organic carbon and nitrate transfers at a watershed scale
TRANSCRIPT

Organic carbon and nitrate transfers at a watershed scalewith the SWAT+ model using landscape units: applicationto a large watershed in France
Clément Fabre, Sabine Sauvage, Raghavan Srinivasan, José Miguel Sánchez Pérez
Presented by Clément Fabre

Riparian zones : Powerful water cleaners
2
5(CH2O) + 4NO3- + 4H+ → 5CO2 + 2N2 + 7H2O
Riparian zones impacts on the nitrogen cycle (Pinay et al., 1998 ; Sánchez-Pérez et al., 2003 ; Sun et al., 2015)
Dilution
Root absorption
Denitrification
Groundwaterlevel
Non SaturatedZone
SaturatedZone
Riparian zones : 40% of nitrates consumed by denitrification at a watershed scale(Seine : Pacsy et al., Garonne : Sun et al., 2015)

Objectives
• Characterize hotspots of denitrification in the alluvial plain of an agricultural catchment
• Quantify the effect of riparian zones on the nitrogen cycle
3

The Garonne River
• Area : 55 000 km²
4

0
1000
2000
3000
4000
5000
2000 2001 2002 2003 2004 2005 2006 2007 2008 2009 2010 2011 2012 2013
Observed discharge (m3.s-1)
The Garonne River
• Average discharge : 650 m3.s-1
• Nitrate concentration : 9.3 mg.L-1
50
5
10
15
20
25
30
2000 2001 2002 2003 2004 2005 2006 2007 2008 2009 2010 2011 2012 2013
Observed [NO3] (mg.L-1)
Portail Adour-Garonne

The Garonne River : An agricultural catchment
6
Land use type Coverage
Agriculture 43 %
Forest 32 %
Pasture 16 %
FAO

SWAT+ advantagesfor this study
• Delineation of the floodplain
directly in the setup
of the project
7

SWAT + advantagesfor this study
• 3 methods
8

SWAT + advantagesfor this study
• 3 methods
9

SWAT + advantagesfor this study
• 3 methods
10

Method 1
11
Method 2
Fluvisols

Alternative :SWAT - LUD
• Landscape Units as in
SWAT + with Darcy’s law
12LU 1 LU 2 LU 3

13
Alternative : SWAT - LUD
• Landuse and soil dependant

14
Alternative : SWAT - LUD
• Landuse and soil dependant

15
Standard
LUD
16
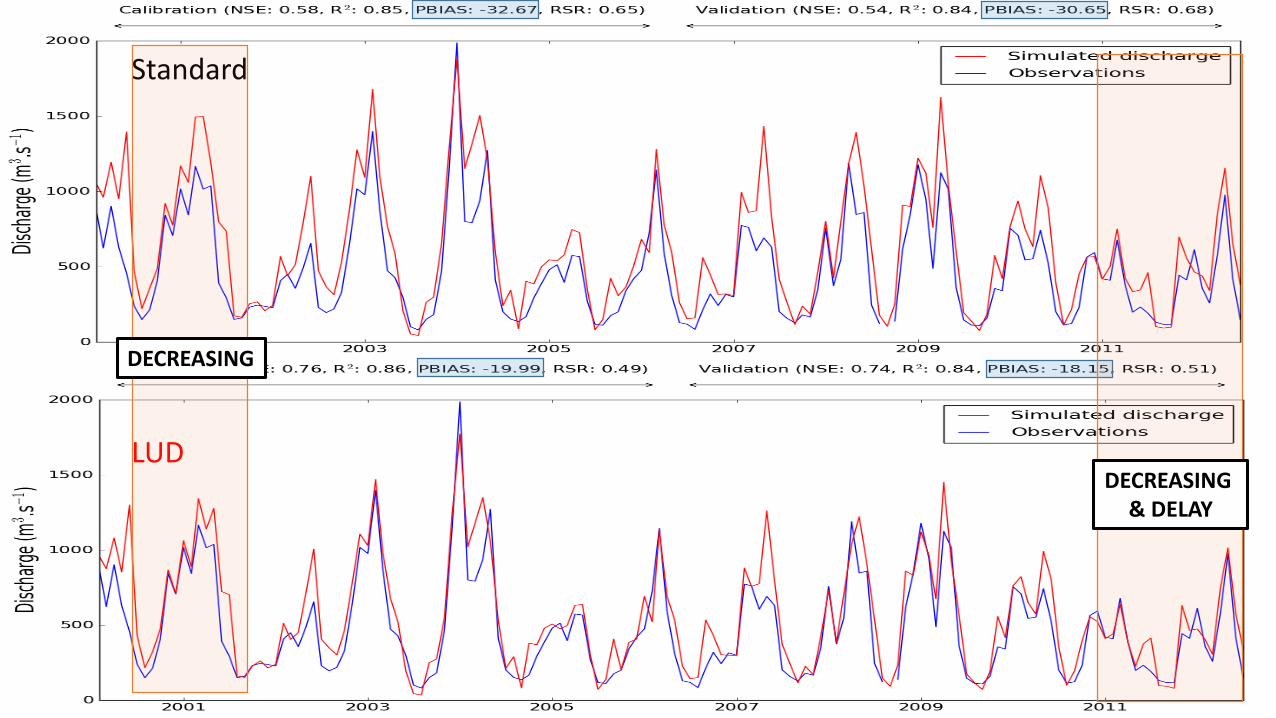
Standard
LUD
DECREASING
DECREASING & DELAY

Daily time step
17
Standard
LUD

Daily time step
18
Standard
LUD

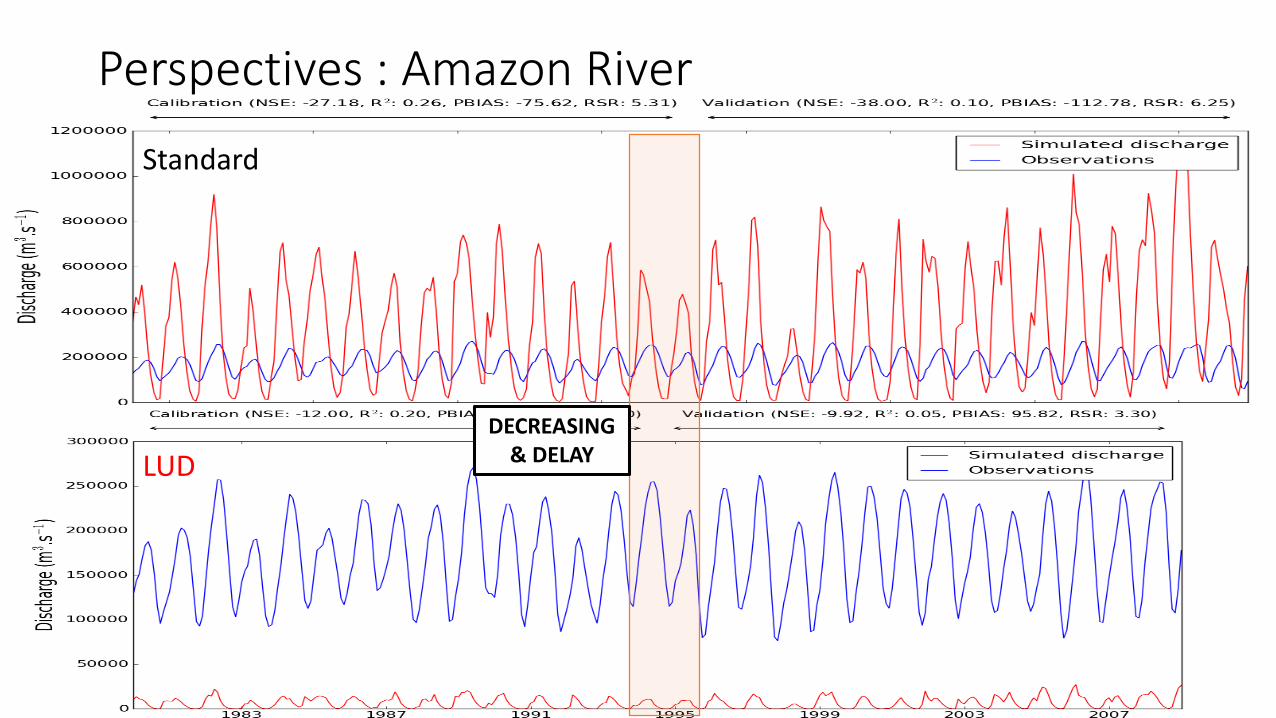
Perspectives : Amazon River
19
Standard
LUD
Perspectives : Amazon River
20
Standard
LUD
DECREASING & DELAY

Conclusion
• Each model(SWAT, SWAT_LUD, SWAT+) different responses
• Spatially different hotspots
• Different methodologies A whole spectre of the effective alluvial zones
21

Thank you for your attention