oregon’s economic forecast may 17, 2013 northwest economic research center college of urban and...
TRANSCRIPT

Oregon’s Economic ForecastMay 17, 2013
Northwest Economic Research CenterCollege of Urban and Public Affairs

About Northwest Economic Research Center (NERC)• Established in 2011• Hosted at the College of Urban and Public
Affairs (CUPA) in Portland State University• Director: Dr. Thomas Potiowsky• Assistant Director: Dr. Jenny H Liu
2

About OEA
3
Excerpts from Slide Presentation to Governor’s Council of Economic AdvisorsPreliminary Economic Outlook Office of Economic Analysis Mark McMullenJosh Lehner

Recent Oregon Economy Facts
4
• 8.2% Unemployment rate for March 2013 (March US rate is 7.6% from 8.8% March 2012, and down 3.4% from recession highs) (US April rate 7.5%) (OR April 8.0%)
• 17th fastest job growth at 1.5% for all states for March 2013 over March 2012.
• Total nonfarm employment increased 1.4% year-over-year for the first quarter of 2013. Total nonfarm up 66,200 since Feb 2010 with the private sector up 73,000 through March 2013.
• 5.3% personal income growth for 4th quarter of 2012 over 4th quarter of 2011. Annualized 4th quarter 2012 growth at 7.5%.
• YTD Oregon exports through February 2013 are up 3.0% from a year ago.
• Computer and electronic products: -9.8%• Agricultural products: +33.5%• All other: 0.9%

Oregon Exports
5
$0
$100
$200
$300
$400
$500
$600
$700
Mill
ions
Oregon Exports, 3 MMA
China / Malaysia
North America
Japan / Korea
Germ/UK/Nether
Taiwan/Vietnam/Sing/Phil/HK/Indo
All Other

Correcting the Jobs Data Again!Index: Feb 2010=100
6Prelim May 2013 economic outlook uses clean CES data, no prelim benchmark data however…

Recovery Spreading to Rural Areas
7
Jan-11 Jul-11 Jan-12 Jul-1250%
55%
60%
65%
70%
75%
80%
85%
90%
95%
100%
Regional Employment GrowthShare of Overall Gains
South Coast
SE Oregon
Gorge
North Coast
NE Oregon
C Oregon
S Oregon
Valley
Portland MSA

8
Leading Indicators

Oregon Coincident Index Components

10

Drags on Economic Growth Are Easing
11
200020012002200320042005200620072008200920102011201220132014201520162017-50
-40
-30
-20
-10
0
10
20
30
40
-5
-4
-3
-2
-1
0
1
2
3
4
Annual Percent Changes in Oregon
Oregon Housing Starts Oregon State and Local Government Employment (Right)

12
Detailed Industry Forecast

13

14

15

16

17
Here we go again!
Jan-05 Jan-06 Jan-07 Jan-08 Jan-09 Jan-10 Jan-11 Jan-12 Jan-131,280.0
1,300.0
1,320.0
1,340.0
1,360.0
1,380.0
1,400.0
1,420.0
1,440.0
1,460.0
Private SectorRecession BLS Prelim Benchmark
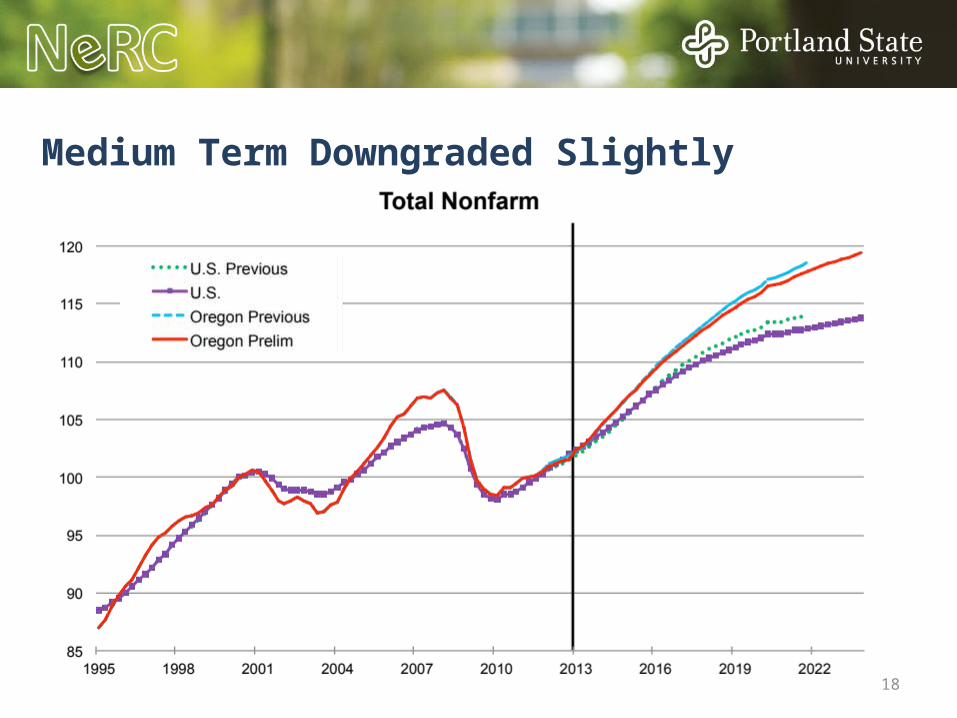
Medium Term Downgraded Slightly
18

Quote: On Financial Crisis and Our Approach to Get Out of It
Will Rogers:“If Stupidity Got Us Into This Mess, Why Can’t It Get Us Out”
19
20
Information for the presentation draws from the Oregon Office of Economic Analysis155 Cottage Street NESalem, OR 97301(503) [email protected]/das/oeaSocial Media:oregoneconomicanalysis.wordpress.com@OR_EconAnalysis
Presented byDr. Thomas PotiowskyNorthwest Econoimc Research Center530A SW Mill StreetPortland, Oregon [email protected]/NERC@nercpdx