oregon - transportation
TRANSCRIPT

Oregon Department of Transportation
Kate Brown, Governor
Implementation of SHRP2 R19A:
1. Trial Use for Routine Bridge Design,
2. Evaluation of In-service Bridges to develop DesignStandard Practice for Service Life Design, and
3. Service Life Design Specification Template for MajorBridges
October 2017

Table of Contents
1. Introduction
2. Background
3. Ochoco Bridge Design Project – Service Life Narrative
A. Purpose and Need
(1). Project Purpose (2). Need (3). Report Purpose
B. Existing Structure and Environment (1).Existing Structure
(2). Environmental Loading (a). Testing of the Existing Structure (b). Determination of Surface Loading C. Proposed Structure (1). Proposed Structure Type and Size (2). Proposed Structure Materials (3). Concrete Material Testing and Results (4). Test Results Commentary (5). Construction Quality Assurance D. Service Life Design Results (1). Standard ODOT Design Practice (2). Corrosion Thresholds, Surface Loading, and Material Selection (3). Service Life Evaluation Costs and Potential Impacts
4. Evaluation of In-Service Bridge Decks Using Chloride Analysis
A. Acid Soluble Chloride in Mortal Testing in Oregon DOT a. History b. ASTM C1152 Versus AASHTO T-260 c. Core Sampling versus Powder Sampling
B. Determination of Effective Surface Concentration and Diffusion Coefficient a. Notes on the Corrosion Threshold
C. Case Studies a. Portland Metro and the Willamette Valley
i. Banfield Interchange BR 08588A, B & C ii. Interstate (I-5) Bridge NB BR 01377A

iii. Mill Creek (I-5) NB BR 20034 iv. Yamhill River (Dayton) BR 08003 v. Hwy 39 Over Hwy 150 BR 08013
vi. Yamhill River Overflow, Hwy 39 BR 08492 vii. South Yamhill River (Whiteson) BR 18675
b. Coastal i. Spencer Creel BR 20198
ii. Bob Creek BRE 19086 iii. Youngs Bay BR 08306
c. Coastal Mountains i. Willamette River (Barnard) BR 07894
ii. Sale Creek BR 2071A d. Siskiyou Mountains
i. Hwy 1 over Hwy 273 (M.P. 7 Interchange) BR 09259 & BFR 09259A e. Ashland
i. Hwy 1 over Crowson Rd. NB BR 08746N ii. Hwy 1 over Crowson Rd. SB BR 08746S
f. Klamath Falls i. Link River, Hwy 4 NB Conn BR 08347A
D. Conclusions and Future Work
5. Design-Build Specification: Design for Durability
6. Summary and Conclusions
A. Ochoco Bridge Design Project B. Evaluation of In-Service Bridge Decks C. Design-Build Specification D. Future Directions and Plans for Implementation of R19A principles
7. Appendices
A. Ochoco Bridge Design Project Appendix A, Bridge Plans, Existing and Proposed B. Ochoco Bridge Design Project Appendix B, Existing Structure, Test Methods and
Laboratory Data C. Ochoco Bridge Design Project Appendix C, Proposed Structure Materials Testing Data D. Ochoco Bridge Design Project Appendix D, Service Life Design Figures E. Evaluation of In-Service Bridge Decks, Appendix E, Chloride Concentration Test Results F. Evaluation of In-Service Bridge Decks, Appendix F, Core Sample Locations G. Design-Build Specification, Appendix G, Comment Log

1. Introduction This report documents the initial implementation of SHRP2 Project R-19A by Oregon DOT (ODOT). The implementation effort was funded through a Lead Adopter Award from FHWA based on the ODOT scope of work in a Round 4 SHRP2 application. The work was guided and assisted by the SHRP2 subject matter expert consulting firm CH2M HILL and sub consultant, COWI-North America. Primary technical expertise was provided by Mike Bartholomew and Anne-Marie Langlois. Technical leads at ODOT were Paul Strausser for In-service Bridge Design, Andrew Blower for Evaluation of In-service Bridge Decks, and Craig Shike for Design-Build Standard Specifications. This report describes the study effort, implementation, and proposed future use of the results.
2. Background
The SHRP2 initiative R19A was created to study Service Life Design of bridge elements and to identify practices that could lead to a minimum 100-year service life. The Oregon Department of Transportation (ODOT) was provided funding to implement practices that support extended service life of bridges. ODOT selected three approaches to investigate the benefits of using service life concepts for design of new bridges and for assessment of existing bridges. The first portion of the ODOT project was to use service life concepts in the design of a new replacement bridge in Central Oregon. The purpose of the effort was to identify any differences in detailing, material use, structural configuration or construction processes would change by specifically addressing service life in the design. A relatively simple single span bridge was selected for this trial application of service life methods. The SHRP2 funding was used to supplement the project PE budget where needed to perform additional work specifically related to service life design. We planned to use the experience from this project to implement and apply the fundamental steps in the service life design process to other bridges located in areas where extended service life is needed. One of the most significant factors limiting the service life of existing structures is premature deterioration of bridge decks. For the second portion of the project ODOT used some of the SHRP2 funds to study chloride contamination of in-service bridge decks. Included in this portion of the project was evaluation and updating of current chloride testing techniques, core sample collection, chloride content testing and evaluation of remaining service life of bridge decks using Fick’s second law of diffusion. A large portion of this study overlapped with ODOT’s current projects to rehabilitate or perform maintenance activities on bridge decks. ODOT’s project funds were used to supplement this study, where appropriate. The result is a series of case studies in bridge deck degradation used to guide bridge deck rehabilitation methods. We expect this effort to serve as a baseline for assessment of service life of existing bridges. We plan to collect additional data to be used to improve decision making for programmatic rehabilitation and maintenance, as well as construction methods and materials selection in the future.

The third portion of the ODOT project was to develop a standard template for Service Life Design specifications for major bridges using design-build procurement. The specs could also be used for other procurement methods such as design-bid-build or CMGC with small editorial revisions appropriate to each technique. The specs were based on an initial effort to define service life requirements for a proposed major crossing of the Columbia River in a joint effort with Washington DOT. Those draft specs were revised based on lessons learned on several other major design-build bridge projects in the eastern US since that time by the SHRP2 subject matter expert team. Some of the recommended provisions may require modification based on project-specific requirements, so a comment log is provided to discuss how the alternative language is evaluated to address those requirements. We plan to use these specs for large bridge projects where the cost, complexity and impacts to the public justify extension of the service life beyond routine expectations.

3. Ochoco Bridge Design Project – Service Life Narrative
A. Purpose and Need
1. Project Purpose The Oregon Department of Transportation (ODOT) mission is to provide a safe, efficient transportation system that supports economic opportunity and livable communities for Oregonians. ODOT defines efficiency as gaining the maximum value from the resources entrusted to us for the benefit of customers. The purpose of this effort is to evaluate the forecasted service life of standard ODOT design details for single span bridges in snow/ice areas. Ochoco Creek Bridge was selected due to the typical nature of the structure, a single span bridge consisting of spread, precast beams with a cast in place deck. 2. Need The ODOT Bridge Design and Drafting Manual (BDDM) sets forth specific design practices for concrete type, reinforcement type, and concrete cover for specific environments. These environments are namely divided into three qualitative categories (1) Coastal (2) Snow/Ice (3) Mild. The intent of these requirements is to devote dollars towards higher quality materials where appropriate in order to minimize maintenance and extend the life of each structure. These practices are engrained in ODOT’s bridge design philosophy and designers are accustomed to tailoring designs to regional environmental conditions. Although well developed and regularly implemented, these standard practices need to be thoroughly vetted and adjusted to best use each dollar spent. This SHRP2 initiative offers an opportunity to think critically about ODOT qualitative practice in a quantitative manner. 3. Report Purpose This report aims to document the structural details, testing, and predicted service life of the structure carrying OR380 over Ochoco Creek, structure number 22324.
B. Existing Structure and Environment
1. Existing Structure The existing reinforced concrete deck girder bridge was a single 35’ span with an out-to-out width of 39’-3”. The thirty foot roadway width wearing surface was asphalt wearing surface and thin gravel section supported by the concrete deck. Structure plans are available in Appendix A. 2. Environmental Loading Service life follows ordinary capacity and demand philosophy. Demand is produced by chloride loading and capacity is provided by materials and detailing. Testing was performed on the existing structure to gain an understanding of the appropriate

loading for the site.
a. Testing of the Existing Structure
Due to the asphalt and gravel shielding the roadway surface, sample cores were collected from the curb. Two, 4.5” cores were taken from each curb and evenly distributed across the structure length. Samples were requested to be tested for chloride content according to Nordtest NT Build 443, Accelerated Chloride Penetration. The results of this test produced profiles of chloride content versus depth in the concrete sample. Tinnea & Associates was contracted to perform the test on these four cores and requested to use an alternative test method designed by the Virginia Department of Transportation. This alternative test, known as VTRC 02-R18, has been peer reviewed and proven to be a sufficient alternative test to NT Build 443. Test results are summarized below. For laboratory data and test method details, see Appendix B.
b. Determination of Surface Loading
Chloride profile data can be used to calculate the apparent chloride diffusion coefficients via a process detailed in ASTM C1556 Determining the Apparent Chloride Diffusion Coefficient of Cementitious Mixtures by Bulk Diffusion. Ultimately this allows a designer to work backwards from chloride profile to an environmental loading useful for design and detailing. This loading is more formally known as the chloride surface concentration. Results are summarized below.
The above table is based on as-constructed mix design for a Class “A” 3300 psi concrete, including six, 94 pound bags of cement per cubic yard of concrete. The surface loading identified in the existing bridge testing program ranged from 0.1% to roughly 0.4%. Due to the limited sample size, and location of cored samples (sidewalk), the highest chloride concentration is recommended for use.
C. Proposed Structure
1. Proposed Structure Type and Size
Table 2.1 - Chloride Content in Existing Bridge
Test Sample Chloride Mass Concentration
Core #1 (NW) 0.50 kg cl- /m3 0.15% chloride / cement
Core #2 (SW) 1.31 kg cl- /m3 0.39% chloride / cement
Core #3 (SE) 0.55 kg cl- /m3 0.16% chloride / cement
Core #4 (NE) 0.29 kg cl- /m3 0.09% chloride / cement
Mean 0.66 kg cl- /m3 0.27% chloride / cement

The replaced bridge is a single 66’ span between bent centerlines with an out-to-out structure width of 64’ – 10”. The superstructure consists of ten spread, 26” precast prestressed slabs and a cast in place deck. The substructure consists of a pile cap supported on driven, steel pipe-piles. For further details, plans are available in Appendix A.
2. Proposed Structure Materials
The replacement structure contains the materials listed in the table below.
Table 3.1 - Materials by Element Element Material Bridge Rail Structural Concrete, Class 3300 Sidewalk Structural Concrete, Class 3300 Bridge Deck Deck Concrete, Class HPC4000 with Synthetic Fiber End Panel Deck Concrete, Class HPC4000 26" Precast Slabs Structural Concrete, Class 8280 Diaphragms Structural Concrete, Class 3300 Pile Cap Structural Concrete, Class 3300 Precast Pile Cap Structural Concrete, Class 8280 Pipe Pile ASTM A252, Grade 3 Bridge Rail and Pile Cap Reinforcement ASTM A706, Grade 60
All Other Reinforcement ASTM A706, Grade 60 Epoxy Coated
3. Concrete Material Testing and Results
Three standard ODOT concrete products, totaling five mix designs, were provided by the supplier indicated and tested during development:
• Structural Concrete Class 3300 (Hooker Creek & Knife River) • Deck Concrete Class HPC4000 w/ Fiber (Slag) (Hooker Creek & Knife River) • Deck Concrete Class HPC4000 w/ Fiber (Fly Ash) (Hooker Creek)
Three standard ODOT concrete products (three mix designs) were provided for construction and subjected to testing:
• Structural Concrete Class 4000 (Knife River) • Structural Concrete Class HPC4000 w/ Fiber (Slag) (Knife River) • Structural Concrete Class 8280 (Precast) (Knife River Prestress)
The chloride migration coefficient represents a concrete section’s resistance to chloride intrusion. Lower values are desirable, indicating a higher resistance. See the figures below for a summary of test results by concrete product and mix design. A test result summary sheet and mix design specifics are available in Appendix C.

Figure 3.1 – NT Build 492 Test Results by Concrete Product
NT Build 492 Test Results by Concrete Product (Mean Columns with ± 1 Standard Deviation Error Bars)
1
Structural ConcreteClass 3300Standard
Structural ConcreteClass 4000Standard
Deck Concrete Class HPC4000(Slag)
Deck Concrete Class HPC4000(Fly Ash)
Structural ConcreteClass 8280(Precast)
Mig
ratio
n Co
effic
ient
(in2
/yea
r)

Figure 3.2 – NT Build 492 Test Results by Mix Design
0.00
0.10
0.20
0.30
0.40
0.50
0.60
0.70
0.80
0.90
1
Mig
ratio
n Co
effic
ient
(in2
/yea
r)
NT Build 492 Test Results by Mix Design (Mean Columns with ± Standard Deviation Error Bars)
Hooker CreekDeck ConcreteClass HPC4000(Slag)
Knife RiverStructural ConcreteClass 8280(Precast)
Hooker CreekStructural ConcreteClass 3300Standard
Knife RiverDeck ConcreteClass HPC4000(Slag)
Knife RiverStructural ConcreteClass 4000Standard
Knife RiverDeck ConcreteClass HPC4000(Slag)
Hooker CreekDeck ConcreteClass HPC4000(Fly Ash)
Knife RiverStructural ConcreteClass 3300Standard

4. Test Results Commentary
Test result comparison is subject to the accuracy and repeatability of the test itself. The NT Build 492 states that a coefficient of variation of repeatability of 9% was observed based on a limited test pool. Fib bulletin 34 recommends using a coefficient of variation of repeatability of 20% based on an expanded pool.
When data sets are limited to a single concrete product provided by a single supplier, this project’s test results fall within the guidance. However, as the data set is expanded to include more samples or more suppliers of the same concrete product, the coefficient of variation of repeatability becomes much more sporadic.
The best example of this is the two mix designs tested for Structural Concrete, Class 3300 and the single mix design tested for Structural Concrete, Class 4000. These mixes contain nearly identical quantities of cement, slag, and water content, yet the NT Build 492 test result are substantially different. Our Subject Matter Expert reported that comparisons on other projects where tests have been done in the US and Europe indicate that this can be expected, especially if the source of cement and slag are different. The desirable repeatability of the test applies for the same lab testing the same batch. The COV will be larger when testing different suppliers. On projects, it is recommended to test the mix of one supplier and allow for a variation of 20% as suggested by fib.
5. Construction Quality Assurance
Two elements of quality assurance were introduced into the construction process: • Each concrete mix design was tested to determine the chloride migration
coefficient • Concrete cover of the reinforcement was verified using ground penetrating radar.
Material testing was challenging to accommodate, since every sample needed to be tested at exactly 28 days. Overall, the process required thorough communication and strict timelines to ensure testing was conducted appropriately. This would be difficult to implement on a larger scale, specifically due to the limited laboratory availability for these specific tests.
Verification of reinforcement cover was easily accommodated.
D. Service Life Design Results
1. Standard ODOT Design Practice
Based on the BDDM, Ochoco Creek Bridge resides in a Snow/Ice Area, which requires all deck and end panel detailing to conform to the following practice:
• High performance concrete class 4500 (Class 4000 at time of construction).• Epoxy coated top and bottom reinforcing mats• Cover equal to 2.5 inches in the top mat and 1.5 inches in the bottom mat.

2. Corrosion Thresholds, Surface Loading, and Material Selection
Critical chloride contents, or corrosion thresholds, are commonly listed in terms of chloride mass as a percentage of cement mass. Fib bulletin 34 recommends a value of 0.6% for uncoated steel reinforcement. Due to defects and potential for coating damage during construction, the corrosion threshold for epoxy coated reinforcement is controversial. Typically no increase in the allowable chloride content is allotted for epoxy coating. The minimum and maximum values in a chloride content curve are represented by the baseline chloride content of the mix design and chloride surface concentration. The chloride content within the concrete section should never be above or below these values. This means that the chloride surface loading at this site (0.39%) is insufficient to induce corrosion of uncoated reinforcement (>0.6%) via chloride intrusion. Plots for service life are available in Appendix D and demonstrates that the materials and detailing are suitable to provide at least 100 years of service life for the loading. Plots are shown for two alternate HPC mix designs:
• Knife River - Deck Concrete, Class HPC4000 w/ Fiber (Slag) • Hooker Creek – Deck Concrete, Class HPC4000 w/ Fiber (Fly Ash)
The Knife River mix design was used during construction of the bridge and represents the actual condition. The Hooker Creek mix design was also presented due to relatively high chloride migration coefficient, which finished seventh out of the eight mix designs tested on the project. Graphical solutions for the project service life of the bridge deck are presented in Appendix D. Both concrete mix designs serve to adequately protect the deck reinforcement due to chloride ingress. 3. Service Life Evaluation Costs and Potential Impacts
Bids ranged from roughly $4000-$10,000 to produce the original chloride profiling of four samples. Costs for sample collection, data review, and data analysis were likely equal to the lab costs. At the low end, this portion of the service life design increased design costs by $7,500. Additional costs were incurred during construction for further lab testing. If the structure design followed the service life design recommendations, uncoated reinforcement would have been justified for use in all structure elements. Using a $0.40 per pound premium for epoxy coated reinforcement above uncoated reinforcement, the structure’s cost could have been reduced by $11,600 (29,000 x $0.40). These results indicate that this effort was marginally cost effective, with the caveat that the additional design costs add no longstanding value to the structure’s quality. If the evaluation is inaccurate or weather/maintenance patterns change, epoxy coated reinforcement serves as relatively inexpensive insurance against corrosion. This may

not be true for all cases, but it appears that ODOT’s standard of practice is reasonable and cost effective for typical structures of this kind.
4. Evaluation of In-Service Bridge Decks Using Chloride Analysis
A. Acid Soluble Chloride in Mortar Testing in Oregon DOT
a. History
The acid soluble chloride in mortar tests have been well established for a long time. The earliest tests in Oregon were performed on the Astoria-Megler Bridge in the 1970s using a hammer drill with spoons and funnels to collect powder samples.
Programmatic testing of concrete for chloride content stared with the formation of the Oregon DOT Bridge Preservation Engineering Team in 1987. This was driven by the decision to replace the Alsea Bay Bridge which was plagued with chloride induced corrosion among other structural issues.
Demolition of the Alsea Bay Bridge, 1991
This testing was first programmed to evaluate the superstructures of historic bridges subject to salt water spray along the Oregon coast. It was first used to evaluate deicer contamination of bridge decks on Interstate 84 in Pendleton, Oregon in April of 2000.
The original sample collection method used a shop vacuum to draw powder through a voided rotary hammer bit and was caught by a coffee filter in a plastic container. Hard rubber spacers placed around the hammer bit controlled the depth of each sample. Sample collection was taken at ½” increments to a depth of 2 ½” from the concrete

surface.
A custom designed vacuum was later implemented which incorporated a sealed chamber dedicated to housing the filter. It required fewer components, was less cumbersome to operate, and reduced the risk of sample contamination when transferring it to a storage bag.

Powder sample collection in a pot hole April, 2015
3 holes were typically drilled off-set from one another. If reinforcement was struck, that hole was abandoned. In rare cases, two holes struck reinforcement and powder was only collected from a single remaining hole. This method typically yielded between 1 and 2 grams of usable sample since not all concrete was pulverized adequately for the laboratory testing.
The ODOT Materials Testing Laboratory in Salem would perform a modified version of AASHTO T-260. Several components of the procedure had been dropped over the years such as acidity indication through the addition of methyl orange indicator and filtering of the powder sample before acid digestion. These steps of the procedure were said to not affect the results in practice. However, there were no records of tests verifying this statement.
b. ASTM C1152 Versus AASHTO T260
R19A was presented to us referencing NordTest Method (NT Build) standards used commonly in Europe. Our partners at CH2M Hill who did the initial standards review for the initiative, stated that ASTM C1152 and AASHTO T-260 were equivalent to the NT Build 208 included as part of the background documents presented to us.
All of these test methods digest a powder sample in nitric acid (HNO3). Electrodes are immersed into the HNO3 solution and connected to a volt meter. A Silver nitrate (AgNO3) solution is slowly added to the solution until an equivalence point is reached (titration) as the chloride ions freed in the acid digestion precipitate as silver chloride (AgCl). The weight of silver nitrate needed to reach the equivalence point is recorded and used in conjunction with the weight of the powder sample to determine the percentage of chloride by weight of sample.

Vacuum Filtering after Acid Digestion Titration with Silver Nitrate Photos Courtesy Siva Corrosion Services, Inc.
These standards are essentially equivalent with a few marked differences. They each use a benchmark solution for a reference during titration. ASTM and AASHTO uses a NaCl solution and NordTest uses a thiocyanate solution with benzyl alcohol or nonanol to prevent dissolution of the AgCl precipitate. A skilled chemist will be able to produce identical results with each method.
The key difference between these methods is the notes on sampling. ASTM C1152 has the strictest guidance. It is unclear in the Nordtest Method how you guarantee that a concrete sample that has been pulverized by a rotary hammer contains at least 2g of cement:
ASTM C1152 AASHTO T260 NT Build 208
Weight of Collected Material (Min)
20g (total) 10g (total) 2g (cement content)
Weight of Material Used in Titration
10g 3g 1g (total)
Figure 1: Acid Soluble Chloride Test Sampling Guidelines
The ODOT Materials Lab had been testing samples according to a modified AASHTO T260 standard. Since the accuracy of this test is identical to the other two once a representative sample is obtained, we decided to continue using the AASHTO standard in the lab. All steps of the standard were reinstated until it could be documented that they were not necessary. We have recently suspended the use of orange methyl indicator as the acidity of the digestion solution has not been an issue through hundreds of samples processed.
Samples listed as testing according to ASTM C1152 were conducted by a third party lab, Siva Corrosion Services, Inc prior to the implementation of the procedure by our lab.

c. Core Sampling Versus Powder Sampling
When reviewing these standards, it quickly became clear that our current sample collection methods were not sufficient. We were often taking samples from structures that are greater than 75 years old and many have large rock, sometimes measuring greater than 3” and often greater than 2”. It is fair to say that 3 x 5/8” holes were not producing samples representative of the structure. To meet the AASHTO sampling requirements we would need to drill about 30 holes – 60 if we followed the ASTM guidance.
ODOT Bridge Preservation Engineering felt this was too destructive to the bridge deck. Taking core samples was an attractive alternative because it allows us to make some qualitative observations about the concrete before it is pulverized. A handheld GPR unit had already been purchased and we can accurately locate reinforcement prior to drilling.
Core Sample Demonstrating Concrete Quality Comparison Between Original Construction and Rigid Overlay
ASTM C1152 has the most detailed procedure for collection of core samples from the field in the referenced standard ASTM C42. This standard offers no specific guidance for cores to be tested for chloride content. However, for compressive strength tests it states that cores needs to be two times the maximum aggregate size. We felt this was a good rule of thumb when trying to get a sample that accurately represents the concrete.
It is very important for this type of testing to avoid taking samples with visible cracks running through them and areas that are delaminated or spalled. It is important to document those defects when evaluation a bridge deck, but they will affect the sample and may indicate a larger chloride problem on a deck that is plagued by impact damage or shrinkage/working cracks.

Location of core samples is also important. Rutting and drainage patterns should be reviewed and a sample set should be representative of differing conditions along the length of the structure. Safety and traffic control are always important considerations. Locations of cores are recorded at time of sample collection and any odd characteristics in the quality of the sample are noted. The location of each sample is shown in Appendix B and is included in guidance to designers, often with a delamination survey conducted separately from this study.
We settled on a 4” drill bit (producing a core approximately 3 3/4” in diameter). This covered the majority of aggregate sizes we were finding in our bridge decks while being able to fit comfortably between most top mat reinforcement details which range typically between 5” and 7”. It is also thin enough that when we run into offset top and bottom mats that limit drilling depth, the sample can be broken off of the structure without destroying the core.
There are some drawbacks from using this method of sample collection. It requires heavier equipment and water and is more time consuming than powder sampling. It also requires further processing to get powder samples for each ½” of depth drilled into the concrete as prescribed by the ASTM and AASHTO standards.
A large portion of the initial cores were sent off to a third party lab awarded the work based on price; Siva Corrosion Services, Inc. They were responsible for slicing and pulverizing the cores before performing the acid soluble chloride tests.
As the value of this testing for overlay project scoping was becoming more apparent to ODOT design engineers, the ODOT Materials Laboratory in Salem was interested in becoming involved in processing these samples. The aggregates department already had a rock saw to slice the samples and procured (with State funds) a pulverizer allowing the collection, processing, and testing of core samples for acid soluble chlorides to be completed entirely by State forces.
Core Sliced into ½” Increments Slice After a Coarse Crush to Feed Pulverizer

Rock Pulverizer Powder Sample Ready for Chemistry Lab
B. Determination of Effective Surface Concentration and Diffusion Coefficient
An iterative method is used to estimate the effective surface concentration and diffusion coefficient of in-service bridges using Fick’s 2nd law of diffusion:
C(𝑥𝑥, 𝑡𝑡) = 𝐶𝐶𝑚𝑚𝑚𝑚𝑚𝑚 − (𝐶𝐶𝑚𝑚𝑚𝑚𝑚𝑚 − 𝐶𝐶𝑚𝑚𝑚𝑚𝑚𝑚)𝑒𝑒𝑒𝑒𝑒𝑒 �𝑥𝑥
2�𝐷𝐷𝑐𝑐 × 𝑡𝑡�
Where: C(x,t ) = Chloride Concentration (%) at depth (x, inches) and time (t, years) Cmax = Effective Surface Chloride Concentration (%) Cmin = Initial Chloride Content (%) Dc = Diffusion Coefficient �𝑖𝑖𝑖𝑖𝑖𝑖ℎ𝑒𝑒𝑒𝑒
2𝑦𝑦𝑒𝑒𝑦𝑦𝑒𝑒� �
The data collected from the core sample is plotted on a spreadsheet and a curve fit is applied using this equation.

Figure 2 – Typical Curve fit of Measured Data
The datapoint closest to the concrete surface is not used in correlation of the curve fit because a large portion of samples collected showed poor correlation of this datapoint to Fick’s 2nd law. The theory is the surface of bridge decks in particular are subject to large seasonal variations. Precipitation can wash chlorides away from the surface and lack of precipitation and humidity can cause chlorides to remain on the surface but never absorb into the concrete.
The accuracy of this analysis is subject to a lot of assumptions. First, the rate at which chloride is absorbed into the concrete is not a constant value, but both the diffusion coefficient and effective surface concentrations are considered constant due to the lack of reliable data to appropriately model dynamic conditions.
Deicers are applied at discreet, sporadic intervals, and the amount that is absorbed during each winter event is dependent on a lot of factors such as length of freeze, length of thaw, subsequent precipitation, humidity, water ponding in ruts, etc. The data contained in this report tends to correlate better when the structure is greater than 20 years old and extremely well when comparing structures greater than 50 years old in similar regions.
The winter road maintenance methods in Oregon greatly vary geographically and over time. Some data sets have very poor correlation. Some of this may be to periods of time when large amounts of rock salt were used followed by a period of lesser magnesium chloride use. This will be presented in some of the case studies to follow.

Second, this does not account for accelerated chloride ingress through cracks. It is important to analyze undamaged concrete to determine whether chloride induced corrosion is causing the cracking and/or spalling or if cracking and/or spalling is leading to chloride induced corrosion.
a. Notes on the Corrosion Threshold
The corrosion threshold of mild steel reinforcement in concrete has been a topic of debate among engineers and academia for many years and it may never be settled. The tendency of reinforcement to corrode hinges on the availability of water and oxygen. No matter how many chloride ions make their way to the reinforcement, corrosion will not occur without these two things. Regional climates affect the ability for reinforcement to corrode. In addition, the ability for the alkalinity of healthy concrete to repair a protective oxide layer on mild steel under chloride attack is variable between mix designs and the age of concrete.
The corrosion threshold is a moving target and we need to make some assumptions to use it in decision making for structure rehabilitation. In practice, corrosion damage resulting in visible spalling has occurred on Oregon bridge decks with a chloride concentration as low as 0.04% by mass of concrete or about 1.5 lbs⁄yd3 assuming a mix weighing 3750 lbs. See case studies for BR2071A and 08347A. While the average chloride concentration for these two structures is around 0.06%, several samples were as low as 0.04%. This value is used to evaluate the service life of a structure conservatively and is the threshold used when evaluating rehabilitation methods for a structure.

C. Case Studies
The extent to which the following data was analyzed varies and is reflected in the narrative provided by this report. Some structures experiencing distress are currently being scoped for rehabilitation work and others were simply points of interest chosen to represent a larger population of bridge decks. This work has expanded to include structures East of the Cascade Mountains, but data was not collected at the time this report was written. Repair methods reference the Oregon Bridge Design and Drafting Manual (BDDM) and the Oregon Standard Specifications for Construction 2015. Raw chloride concentration data, apparent surface concentrations, and diffusion coefficients are presented in Appendix A. Core locations are presented in Appendix B.
Locations of in-service bridge deck testing

a. Portland Metro and Willamette Valley
1. Banfield Interchange BR08588A, B, & C
Background: BR08588A at M.P. 0.24 on Hwy 2 (Route IS84N), BR08588B at M.P. 0.52 on
Hwy 2 (Route IS84N), and BR08588C at M.P. 0.23 on Hwy 2 (Route IS84N) are a mixed plate girder and RCDG design constructed in 1963. The decks are 6” thick with a 1.5” structural wearing surface that was planned for when the bridges were designed. I was not able to find record of when these overlays were installed. The decks have extensive delamination and cracks throughout with a concentration of spalling at the joints (expansion and overlay construction) due to impact with secondary corrosion occurring from the loss of cover. All 3 structures are in similar condition.
BR08588B as Seen From BR08588C After Delamination Survey
Sampling and Testing: Sampling and testing was performed in September of 2016 which consisted of
4x4” cores taken from each of the decks.
All 12 of the deck cores were taken toward the centerline of the structures as reinforcement spacing was tight where bent bars reinforce the railings.
The 12 deck cores were tested for chlorides according to AASHTO T-260 at ½”
depth increments starting at the deck surface as deep as could be safely sliced.

Core From BR08588B Showing Overlay (right), and Parent Material (left)
Results:
This data set exhibits unique characteristic which doesn’t correlate to a traditional model curve fit with Fick’s 2nd Law of diffusion model of chloride ingress. No curve fit was applied to this data set.
Figure 3: BR08588A Chloride Concentrations
Chloride Profile 0.05 0.04 0.03 0.02 0.01
0 0 1 2
Depth (in) 3 4
Core#1
Core#2
Core#3
Core#4
Corr. Threshold
Rebar Depth
Overlay/Parent Interface
Chlo
ride
by M
ass o
f Con
cret
e (%
)

Figure 4: BR08588B Chloride Concentrations
Figure 5: BR08588C Chloride Concentrations
Analysis:
The chloride test results did not follow traditional models of chloride ingress. It appears that the original deck was chloride contaminated and the overlay may have extracted chlorides from the parent material during curing which resulted in higher chloride levels close to the bond interface. This effect could also be from diffusion along the bond interface after chlorides penetrated through cracks.
Whatever the case may be, the chloride levels measured were all below the
corrosion threshold of steel reinforcement in concrete. The damage observed on these structures are predominantly from impact, flexure, thermal cycling/shrinkage, and freeze/thaw, with a strong probability of some localized secondary corrosion from chlorides penetrating these cracks.
Chloride Profile 0.05 0.04 0.03 0.02 0.01
0 0 1 2
Depth (in) 3 4
Core#1
Core#2
Core#3
Core#4
Corr. Threshold
Rebar Depth
Overlay/Parent Interface
Chloride Profile 0.05 0.04 0.03 0.02 0.01
0 0 1 2
Depth (in) 3 4
Core#1
Core#2
Core#3
Core#4
Corr. Threshold
Rebar Depth
Overlay/Parent Interface
Chlo
ride
by M
ass o
f Con
cret
e (%
) Ch
lorid
e by
Mas
s of C
oncr
ete
(%)

It is recommended that the current 1.5” overlay be ground completely off and a new overlay be placed with class 2 preparation as needed. From a corrosion standpoint, a waterproof material such as polyester polymer concrete (PPC) would be preferable, but a structural design engineer should analyze how this would affect deck stiffness as the current 6” deck with the 1.5” rigid overlay is showing signs of flexural cracks and efflorescence in the soffit according to inspection reports. It would be better to have a latex modified concrete (LMC) or silica fume concrete (SFC) with some cracks than a PPC with extensive flexural cracking. Fibers may be appropriate in the overlay material to reduce cracking.
In addition, special attention should be paid toward joint and joint header design
due to the traffic volume and speed on these structures. The B and C structures have especially bad spalling at the joints due to impact damage leading to corrosion damage. There also appears to be extensive corrosion damage to soffits and cross beams on RCDG spans according to inspection reports. This is consistent with deicing chemicals leaking through failed joints and should be addressed sometime in the near future if it is not included with a joint and overlay replacement.
2. Interstate (I5) Bridge NB BR01377A
Background:
BR01377A at M.P. 308.38 on Hwy 1 (Route IS5N) is a steel thru-truss design with a vertical lift span. The bridge was constructed in 1916. A portion of the bridge was raised in the late 1950s when a sister Southbound structure was constructed. As a result, the majority of the deck was replaced in 1960. However, 4 of the original fixed spans remain. The 1916 decks are approximately 13” thick with minimal reinforcement. The decks poured in 1960 are 6” thick. A latex modified concrete (LMC) overlay was placed in 1990 and the lift span deck was reconstructed. A steel mesh was placed with the LMC on the 1916 decks. Some map cracking and spalling is concentrated in the right wheel rut of the slow ‘C’ lane on the spans with steel mesh.
BR1377A Overview: Courtesy Mike Goff; www.bridgehunter.com

Sampling and Testing: Sampling and testing was performed in September of 2016 which consisted of
12x4” cores taken from each of the decks.
Due to a complete bridge closure the samples were evenly distributed throughout the structure.
The 12 deck cores were tested for chlorides according to AASHTO T-260 at ½” depth increments starting at the deck surface.
Core Cutting on the Interstate Bridge
Figure 6: BR01377A Chloride Concentrations of LMC Overlay (11 Samples, Installed 1990)
Chloride Profile 0.2
0.18
0.16
0.14
0.12
0.1
0.08
0.06
0.04
0.02
0
Corr. Threshold
Curve Fit
Core 1
Core 2
Core 3
Core 4
Core 6
Core 9
Core 10
0 0.5 1 1.5 Depth (in)
2 2.5 Core 11
Core 12
Chlo
ride
by M
ass o
f Con
cret
e (%
)

Figure 7: BR01377A Chloride Concentrations of 1960 Deck (4 Samples)
Analysis: The concrete from 1916 had relatively low chloride contamination and was not
analyzed further. It is evident that very little salt was used to de-ice this bridge prior to 1960 and any contaminated concrete was removed when the LMC was placed in 1990.
The curve fit for the 1960 deck parent material did not correlate to the data points
well as there was a lot of variability between core samples. The assumption that the chloride contamination was halted when the overlay was placed may be poor. The majority of the samples show the deck to be below the corrosion threshold. Core 7 is an outlier and contained about 30% more chloride ions than the next highest sample taken.
The SB structure was also tested and yielded near identical results to the NB
decks poured in 1960 despite being about 2 years older. The curves shown were generated from the available information for each material and utilize current grade as depth = 0”. It was unclear how much material was removed from these spans during placement of the LMC so the bond interface is not shown. 1960 details were assumed when showing reinforcement depth, but the grade was likely raised during placement of the LMC and the reinforcement is probably deeper than what is shown. This would explain why no spalling has occurred at the location of Core 7.
Chloride contamination is minimal except for Core 7 and any damage to the deck
appears to be induced by impact of trucks in the “slow” C lane (Core 7 was taken from the “fast” A Lane). If bond tests of the LMC are high enough, a polyester-polymer concrete (PPC) wearing surface could be placed over the LMC to combat rutting and prevent future degradation from wear after any damaged concrete is repaired.
Chloride Profile 0.25
0.2 0.15
0.1 0.05
Curve Fit
Corr. Threshold
Rebar Depth
Core 5
Core 6
Core 7 0
0 0.5 1 1.5 Depth (in)
2 2.5 3 Core 8
Chlo
ride
by M
ass o
f Con
cret
e (%
)

3. Mill Creek (I5) NB BR20034
Background: BR20034 at M.P. 252.54 on Hwy 1 (Route IS5N) is a pre-stressed girder design
with a high performance concrete deck built in 2007. This bridge was tested as a point of interest to represent current construction practices.
Sampling and Testing:
Sampling and testing was performed in February of 2016 which consisted of 4x4” cores.
2 cores were taken in the fast “A” lane at the bottom of the curve which exists on
the structure. 2 additional cores were taken in the shoulder at the top of the curve near the other end of the bridge.
The 4 deck cores were tested for chlorides according to ASTM C1152/C1152M at ½” depth increments starting at the deck surface as deep as could be safely sliced.
Figure 8: BR20034 Chloride Concentrations (4 Samples)
Analysis: There is very little chloride contamination in this deck. There appears to be some
influence from background chlorides either free in the cement or bound to aggregate as all 4 cores exhibited higher chloride levels deeper into the concrete than the ideal equation would suggest. All chloride levels are near the lowest detectable level by the test methods so there may be discrepancies in accuracy.
Of interest, this newer concrete doesn’t exhibit diffusion coefficients far different
from older mix designs. However, some of the discrepancies due to background chlorides don’t give a lot of weight to this observation.
Chloride Profile 0.12
0.1
0.08
0.06
0.04
0.02
0
-0.02 0 0.5 1 1.5 Depth (in)
2 2.5 3
Curve Fit
Corr. Threshold
Rebar Depth
Core 1
Core 2
Core 3
Core 4
Chlo
ride
by M
ass o
f Con
cret
e (%
)

4. Yamhill River (Dayton) BR08003
Background: BR08003 at M.P. 51.57 on Hwy 39 (Route OR18N) is a painted steel girder
design with RCDG approaches built in 1955. This bridge was tested as a point of interest and one of the first bridges to be tested under R19A phase II. It has since been programmed to receive a PPC wearing surface since testing.
BR08003 Overview
Sampling and Testing:
Sampling and testing was performed in February of 2016 which consisted of 4x4” cores.
2 cores were taken in the EB lane near the East finger joint. 2 additional cores
were taken in the WB lane near the West finger joint. However, very large aggregate caused the second two cores to break shallow and uneven. Only 1 and 2 sample depths were obtained from these cores and they were not used in analysis.
The 2 deck cores were tested for chlorides according to ASTM C1152/C1152M at ½” depth increments to a depth of 2.5”.

Figure 9: BR08003 Chloride Concentrations (Curve Fit, 2 Samples)
Figure 10: BR08003 Predicted Chloride Concentrations at 100 Years
Analysis: This bridge exhibits a fair amount of chloride contamination, but has not yet
reached the corrosion threshold at the design depth of reinforcement. At current chloride loading and diffusion, it is predicted the bridge will experience initiation of corrosion at 100 years of age (2055). This prediction was created by simply increasing time in the equation used for the curve fit in Figure 9 to 100 years.
A PPC wearing surface programmed to be installed will slow chloride ingress and
extend the life of this deck.
Chloride Profile 0.1
0.08 0.06 0.04 0.02
0
Curve Fit
Corr. Threshold
Rebar Depth
Core 1
Core 2 0 0.5 1 1.5
Depth (in) 2 2.5 3
Chloride Profile 0.12
0.1
0.08
0.06
0.04
0.02
0
Curve Fit
Corr. Threshold
Rebar Depth
0 0.5 1 1.5 Depth (in)
2 2.5 3
Chlo
ride
by M
ass o
f Con
cret
e (%
) Ch
lorid
e by
Mas
s of C
oncr
ete
(%)

5. BR08013 Hwy 39 Over Hwy 150
Background: BR08013 at M.P.51.38 on Hwy 39 (Route OR18N) was constructed in 1957 and
is a CIP RCDG design with CIP bents. The design calls out –M reinforcement details with 1” of cover directly over the girders and top mat and a “2” AC wearing surface by others”. There is not an apparent record of when the ACWS was placed. However, there are pictures in 1971 of a bare deck and the ACWS shows up in the oldest inspection report digitally recorded in 1988.
Sampling and Testing:
Sampling and testing was performed in March of 2017 which consisted of 2 cores taken from the EB lane. Testing was halted after the second core. A combination of compromised ACWS of variable and a thin deck of 5.5” caused the second hole to punch through the entire deck. This was either a thin spot or ½” of deck was removed when the ACWS was placed. The core was recovered from inside the drill bit intact and tested and a full depth repair was completed.
The 4 deck cores were tested for chlorides according to AASHTO T-260 at ½”
depth increments to a depth of 2.5” after removing the ACWS.
Core Sample Demonstrating 5.5” Deck With Compromised ACWS
Analysis:
The two samples taken from this deck had very little chloride content when compared to BR08003. Being only 2 years younger and a few hundred feet from BR08003 is interesting. It suggests that the ACWS may be not allowing chlorides to absorb into the concrete bridge deck below.

This theory is supported by older structures which have had ACWS on them for the majority of their time in-service. See BR01418 (1931) and BR01939 (1933) in Appendix A. However, all 3 exist in low deicing application rate areas, and in this case, contaminated concrete may have been removed when the ACWS was placed as evidenced by the thin deck. The sample size is small enough that a conclusion can’t be drawn at this time.
6. BR08492 Yamhill River Overflow
Background: BR08492 at M.P. 45.76 on Hwy 39 (Route OR18N) was constructed in 1963 and
is a RCDG design with precast beams on timber bents. The design calls out a cover detail of 1” over the top mat of the deck and a “2” AC wearing surface by others”. The AC wearing surface was never placed on the bridge as recommended by structural design engineers in 1979. The oldest digitally recorded inspection report from 1992 reports transverse cracks in the wearing surface and soffit with a half dozen exposed rebar. The condition has deteriorated ever since to the condition shown.
BR08492 Damage on Deck

BR08492 Exposed Rebar on Deck
Sampling and Testing: Sampling and testing was performed in March of 2017 which consisted of 4 cores
taken from the deck of BR08492. All 4 of the deck cores on BR08492 were taken from the WB lane due to ease of
lane closures. This was deemed acceptable as the visible defects on the surface were spaced fairly evenly throughout the width of the deck.
Deck cores were tested for chlorides according to AASHTO T-260 at ½” depth
increments starting at the deck surface down to 2.5”.
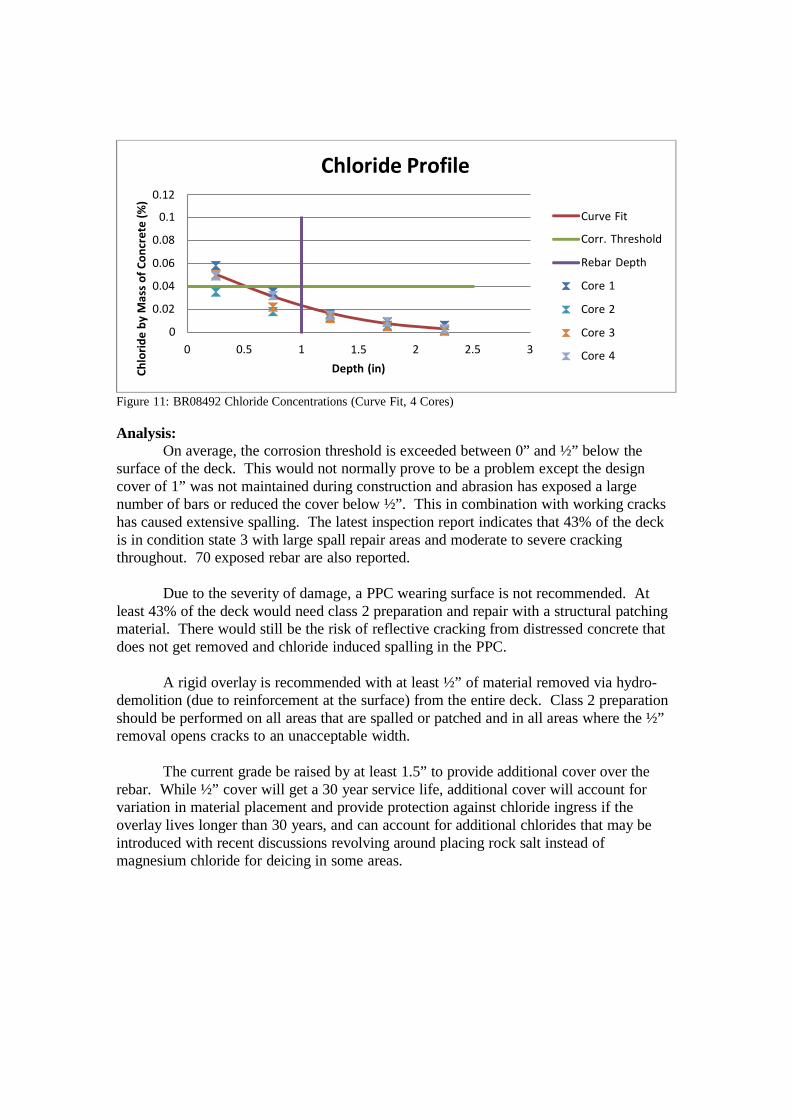
Figure 11: BR08492 Chloride Concentrations (Curve Fit, 4 Cores)
Analysis: On average, the corrosion threshold is exceeded between 0” and ½” below the
surface of the deck. This would not normally prove to be a problem except the design cover of 1” was not maintained during construction and abrasion has exposed a large number of bars or reduced the cover below ½”. This in combination with working cracks has caused extensive spalling. The latest inspection report indicates that 43% of the deck is in condition state 3 with large spall repair areas and moderate to severe cracking throughout. 70 exposed rebar are also reported.
Due to the severity of damage, a PPC wearing surface is not recommended. At
least 43% of the deck would need class 2 preparation and repair with a structural patching material. There would still be the risk of reflective cracking from distressed concrete that does not get removed and chloride induced spalling in the PPC.
A rigid overlay is recommended with at least ½” of material removed via hydro-
demolition (due to reinforcement at the surface) from the entire deck. Class 2 preparation should be performed on all areas that are spalled or patched and in all areas where the ½” removal opens cracks to an unacceptable width.
The current grade be raised by at least 1.5” to provide additional cover over the
rebar. While ½” cover will get a 30 year service life, additional cover will account for variation in material placement and provide protection against chloride ingress if the overlay lives longer than 30 years, and can account for additional chlorides that may be introduced with recent discussions revolving around placing rock salt instead of magnesium chloride for deicing in some areas.
Chloride Profile 0.12
0.1
0.08
0.06
0.04
0.02
0 0 0.5 1 1.5
Depth (in) 2 2.5 3
Curve Fit
Corr. Threshold
Rebar Depth
Core 1
Core 2
Core 3
Core 4
Chlo
ride
by M
ass o
f Con
cret
e (%
)

7. South Yamhill River (Whiteson) BR18675
Background: BR18675 at M.P. 40.78 on Hwy 91 (Route OR99W) is a RCDG design with slab
approaches built in 2002. This bridge was tested as a point of interest and was the first bridge to be tested under R19A phase II. It was chosen as a point of interest to represent Oregon’s “middle aged” bridge inventory.
BR18675 Overview
Sampling and Testing:
Sampling and testing was performed in February of 2016 which consisted of 4x4” cores.
1 core was taken from each travel lane at either end of the bridge. 2 additional
cores were taken next to the curb adjacent to each travel lane core. This practice was later modified due to few defects occurring at the curb base and variable conditions created by localized debris. In addition, railing reinforcement made it difficult to find suitable locations for sampling on some structures.
The 4 deck cores were tested for chlorides according to ASTM C1152/C1152M at ½” depth increments to a depth of 2.5”.

Figure 12: BR18675 Chloride Concentrations (Curve Fit, 4 Samples)
Figure 13: BR18675 Predicted Chloride Concentrations at 100 Years
Analysis: This bridge has relatively low chloride contamination. Under current chloride
loading and diffusion rates, this bridge deck will not have any corrosion issues after 100 years of service (2102). This prediction was created by simply increasing time in the equation used for the curve fit in Figure 12 to 100 years.
Chloride Profile 0.2
0.15
0.1 0.05
Curve Fit
Corr. Threshold
Rebar Depth
Core 1
Core 2 0
0 0.5 1 1.5 2 2.5 3 -0.05
Core 3
Core 4 Depth (in)
Chloride Profile 0.07 0.06 0.05 0.04 0.03 0.02 0.01
0
Curve Fit
Corr. Threshold
Rebar Depth
0 0.5 1 1.5 Depth (in)
2 2.5 3
Chlo
ride
by M
ass o
f Con
cret
e (%
) Ch
lorid
e by
Mas
s of C
oncr
ete
(%)

b. Coastal
1. Spencer Creek BR20198
Background: BR20198 at M.P. 133.86 on Hwy 9 (Route US101) was constructed in 2008 and
is a pre-stressed concrete deck arch with a high performance concrete deck placed on voided pre-stressed slabs with stainless steel deck reinforcement details. This bridge was tested as a point of interest to represent current design practices in a coastal environment.
BR20198 Overview: Courtesy Mike Goff; www.bridgehunter.com
Sampling and Testing:
Sampling and testing was performed in March of 2016 which consisted of 2x4” cores.
Both cores were taken from the NB lane. This was deemed acceptable as there
was no reason to believe conditions were different in the opposite lane.
The 2 deck cores were tested for chlorides according to ASTM C1152/C1152M at ½” depth increments to a depth of 2.5”.

Figure 14: BR20198 Chloride Concentrations (Curve Fit, 2 Samples)
Figure 15: BR20198 Predicted Chloride Concentrations at 100 Years
Analysis: This bridge has a very high surface concentration as it sits a few hundred feet
from the Pacific Ocean and is unprotected by wind driven salt water spray.
The corrosion threshold for 316LN assuming a concrete weight of 3750 pounds per cubic yard is shown (Trejo et. al.). 316LN was one of several grades of stainless steel specified for this bridge. Without further research into construction records, we don’t know which grade of stainless steel from the specification was used.
Chloride Profile 0.6
0.5
0.4
0.3
0.2
0.1
0
-0.1
Curve Fit
Corr. Threshold
Rebar Depth
Core 1
Core 2 0 0.5 1 1.5
Depth (in) 2 2.5 3
Chloride Profile 0.6
0.5
0.4
0.3
0.2
0.1
0
100 Year Prediction
Corr. Threshold
Rebar Depth
0 0.5 1 1.5 Depth (in)
2 2.5 3
Chlo
ride
by M
ass o
f Con
cret
e (%
) Ch
lorid
e by
Mas
s of C
oncr
ete
(%)

The 100 year prediction was created by simply increasing time in the equation used for the curve fit in Figure 14 to 100 years. This predictive calculation amounts to approximately 3 lbs. salt/yd^3 concrete at the depth of reinforcement. All grades of stainless steel in the specification will resist this level of contamination and the service life should extend beyond 100 years. In the future, the exposed arch ribs and slabs should be tested due to direct exposure to sea water spray.
2. Bob Creek BR19086
Background: BR19086 at M.P. 169.94 on Hwy 9 (Route US101) was constructed in 2003 and
is a pre-stressed concrete girder design with a microsilica concrete deck. This bridge was tested as a point of interest due to its construction materials.
Sampling and Testing:
Sampling and testing was performed in March of 2016 which consisted of 2x4” cores.
Both cores were taken from the NB lane. This was deemed acceptable as there
was no reason to believe conditions were different in the opposite lane.
The 2 deck cores were tested for chlorides according to ASTM C1152/C1152M at ½” depth increments to a depth of 2.5”.
Figure 16: BR19086 Chloride Concentrations (Curve Fit, 2 Samples)
Chloride Profile 0.4 0.3 0.2 0.1
Curve Fit
Corr. Threshold
Rebar Depth
Core 1 0
0 0.5 1 1.5 2 2.5 3 Core 2
-0.1 Depth (in) Ch
lorid
e by
Mas
s of C
oncr
ete
(%)

Figure 17: BR19086 Predicted Chloride Concentrations at 100 Years
Analysis: This bridge has a much lower surface concentrations compared to BR20198 due
to terrain and trees that offer some shelter from sea water spray. The grade is also on a significant slope which helps wash the bridge with rainfall.
Microsilica concrete was chosen as a mix design that resists chloride intrusion.
Interestingly, this material doesn’t show a significant difference in performance from LMC, past structural concretes, and modern high performance concretes.
This bridge deck is predicted to not reach corrosion threshold in a 100 year
service life. However, the girders should be tested in the future as the bulb-I stirrups are much shallower than the deck reinforcement and they don’t get washed by precipitation. This prediction was created by simply increasing time in the equation used for the curve fit in Figure 16 to 100 years.
3. Youngs Bay BR8306
Background: BR08306 at M.P. 4.91 on Hwy 9 (Route US26N) was constructed in 1964. The
main channel is a painted steel pony truss vertical lift span and the secondary channel is a fixed painted steel pony truss. The approach spans are pre-stressed RCDG. The deck has wheel rutting and exposed rebar throughout. The last inspection report dated June, 2016 estimates 220 exposed rebar on Spans: 9-11, 27-30, 38, 48, 50, 51. Transverse cracking has been noted on all inspection reports dating back to November 1988. Exposed rebar was first reported in an inspection report dated April 1996. Sporadic shallow spalls have been developing due to the exposure of these bars from rutting and corrosion ever since.
Chloride Profile 0.14 0.12
0.1 0.08 0.06 0.04 0.02
0
100 Year Prediction
Corr. Threshold
Rebar Depth
0 0.5 1 1.5 Depth (in)
2 2.5 3
Chlo
ride
by M
ass o
f Con
cret
e (%
)

Overview of BR08306: Courtesy Mike Goff; www.bridgehunter.com
BR08306: Single Exposed Rebar

BR08306: Typical Exposed Rebar Pattern
Sampling and Testing: Sampling and testing was performed in March of 2017 which consisted of 4x4”
cores taken from the deck.
All 4 of the deck cores were taken from the NB travel lane. Rutting and defects were consistent throughout so this was deemed acceptable.
The 4 deck cores were tested for chlorides according to AASHTO T-260 at ½”
depth increments starting at the deck surface.
Results:
Figure 18: BR08306 Chloride Concentrations (Curve Fit, 4 Samples)
Chloride Profile 0.2
0.15
0.1 0.05
0 0 0.5 1 1.5
Depth (in) 2 2.5 3
Curve Fit
Corr. Threshold
Rebar Depth
Core 1
Core 2
Core 3
Core 4
Chlo
ride
by M
ass o
f Con
cret
e (%
)

Chloride Profile 0.12
0.1 0.08
0.06
0.04
0.02
0
Curve Fit
Corr. Threshold
Rebar Depth
0 0.5 1 1.5 Depth (in)
2 2.5 3
Chlo
ride
by M
ass o
f Con
cret
e (%
)
Figure 19: BR08306 Predicted Overlay Chloride Concentrations at 30 Years
Analysis: This deck shows chloride contamination above the corrosion threshold at
approximately ¾” from the surface on average. The effective chloride loading was approximately double in the wheel rut as it was in the center of the travel lane. The most contaminated sample was over the corrosion threshold to a depth just shallow of 1”.
This would not prove to be an issue if the rebar was at its design depth of 1½”.
However, large portions of the top mat are exposed due to scaling, rutting, and likely lack of adequate cover during concrete placement.
Due to the contamination levels and lack of cover, a PPC wearing surface is not
recommended. There is a large risk that spalling will continue after placement of a PPC. In addition, future removal of a PPC wearing surface at the end of its service life would likely result in major damage to deck reinforcement and removal equipment. It is likely that the surface preparation for PPC would expose additional reinforcement.
A rigid overlay is recommended with at least 1” of material removed via hydro-
demolition (due to reinforcement at the surface) from the entire deck. Class 2 preparation should be performed on all areas that are spalled or patched and in all areas where the 1” removal opens cracks to an unacceptable width.
A faster setting latex modified concrete (LMC) could be used to help staging
concerns. It is feasible that with proper coordination of personnel, equipment, and weather, the deck could be reopened to traffic in 3-5 days as the material will reach strength within 36 hours. Other DOTs, material suppliers, and contractors should be contacted to get a better understanding of reasonable production rates.
While I do not have data on modern LMC, Oregon has LMC overlays which have
performed favorably on many structures such as Yaquina Bay Bridge, the I5 Interstate Bridge, the Banfield Interchange structures as well as others.

Based on tests performed on the Interstate Bridge, the corrosion threshold in LMC or silica fume concrete (SFC) would be reached in 30 years if ¾” of cover was placed over the rebar. If we assume ¼” of rutting in those 30 years, the minimum cover that should be restored after placement of an LMC or SFC should be 1”.
It is recommended that current grade be raised by at least 1.5” to provide
additional cover over the rebar. This will cover variation in material placement and if the overlay lasts longer than 30 years.

c. Cascade Mountains
1. Willamette River (Barnard) BR07894
Background: BR07894 at M.P. 33.24 on Hwy 18 (Route OR58N) is a plate girder design with
RCDG approach spans built in 1955. The deck on the plate girder spans was replaced and a structural overlay placed on the RCDG spans in 2005. This bridge was chosen as a point of interest due to the deck replacement and structural overlay.
Sampling and Testing:
Sampling and testing was performed in March of 2016 which consisted of 4x4” cores taken from the deck.
2 Cores were taken from each travel lane on the plate girder spans. Cores were
attempted on the approach spans, but the bond of the overlay was broken during extraction and not enough thickness was obtained for core processing.
The 4 deck cores were tested for chlorides according to ASTM C1152/C1152M depth increments starting at the deck surface
Figure 20: BR07894 Chloride Concentrations (Curve Fit, 4 Samples)
Analysis: This bridge has approximately twice the chloride loading of the bridges in the
Portland Metro and Willamette Valley as would be expected for this area as it sees more snowfall and freezing conditions throughout the year.
The diffusion coefficient is also higher. The construction plans for the deck
replacement do not specify the grade of concrete used. Given the age of construction, it is likely that a high performance concrete was used.
Chloride Profile 0.3
0.25
0.2
0.15
0.1
0.05
0 0 0.5 1 1.5
Depth (in) 2 2.5 3
Curve Fit
Corr. Threshold
Rebar Depth
Core 1
Core 2
Core 3
Core 4
Chlo
ride
by M
ass o
f Con
cret
e (%
)

The curve fits do not correlate that well with the sample data. This may be due to influence from shrinkage and freeze/thaw cracks. Therefore, not much conclusion can be drawn from this other than this may be an area of Oregon where alternative construction materials may need to be considered when designing for service life.
2. Salt Creek BR2071A
Background: BR02071A at M.P. 42.93 on Hwy 18 (Route OR58N) was constructed in 1965
and is a combination RCBG and steel plate girder design. A unique design feature is the steel span bearing on a concrete cantilever approximately 15’ off the each bent. An early application of post-tensioned rods is utilized to provide reinforcement where the steel bears on the cantilevers. Common to RCBG design of this era is a large amount of negative moment reinforcement in the top mat of the deck over the bents.
The deck has been having spalling issues for several years that the bridge crew has been chasing with patching efforts and a thin epoxy overlay that has continued to crack and spall as corrosion of the reinforcement continues. Chloride tests were conducted in September of 2015, but the results were inconclusive as not enough depths were tested to obtain a proper chloride profile and the sampling method is subject to inaccuracies.
BR2071A: Damage on Deck of Span 1
Sampling and Testing:
A more comprehensive set of sampling and testing was performed in March of 2016 which consisted of 6 cores taken from the deck and 8 cores taken from the soffit.
All 6 of the deck cores were taken from the Eastbound lane due to ease of lane
closures. This was deemed acceptable as the visible defects on the surface were spaced fairly evenly throughout the width of the deck.

The soffit cores served an alternate purpose of providing drain holes which weren’t installed during construction. After visual inspection of the interior of the box girders showed little signs of moisture, it was decided that testing 2 cores for chlorides per each span was sufficient.
Deck cores were tested for chlorides according to ASTM C1152/C1152M at ½”
depth increments starting at the deck surface after removal of the epoxy wearing surface. Soffit cores were tested by the same method starting from both the soffit and the interior surface of the box.
Results:
Figure 21: BR02071A Chloride Concentrations (Curve Fit, 6 Cores)
Analysis: The box girders don’t show signs of chloride contamination. While it appears
some moisture made it into the girders and degraded some of the form work it is not distributing enough chlorides from deicers to damage the concrete. Weep holes should be drilled in the remaining cells that did not receive them in this exploration.
The deck shows chloride contamination throughout. Even though most of the
distress is shown in span 1, there are corrosion cracks showing through the rest of the deck and it is a matter of time before the entire deck is in the same condition as span 1.
Contaminated concrete should be removed and replaced with new material from
the entire deck to a depth of 2” to ensure that existing chlorides below removal depth don’t exceed the chloride threshold at the reinforcement level as they diffuse back into new material.
Chloride Profile 0.3
0.25
0.2 0.15
0.1 0.05
Curve Fit
Corr. Threshold
Rebar Depth
Core 1
Core 2
Core 3
Core 4 0
0 0.5 1 1.5 Depth (in)
2 2.5 Core 5
Core 6
Chlo
ride
by M
ass o
f Con
cret
e (%
)

Methods of removal and placement of repair material would have to be carefully considered given the cantilevered spans. Further analysis should be performed on whether rehabilitation of the deck is preferable to replacement of the bridge.
Impressed current cathodic protection (ICCP) or electrochemical chloride
extraction (ECE) is not an option due to concerns with hydrogen embrittlement of the 100ksi tension rods in the chairs for the steel span. Galvanic anodes are not appropriate for this level of chloride contamination.
It is advised to add an additional 1” of cover above existing grade creating a total
of 2.5” clearance from reinforcement.

d. Siskiyou Mountains
1. Hwy 1 over Hwy 273 (M.P. 7 Interchange) BR09259 & BR09259A
Background:
BR09259 and BR09259A at M.P. 5.32 on Hwy 1 (Route IS5) are pre-stressed concrete girder design constructed in 1965. A overlay was placed on the decks sometime between 1976 and 1978 using the “Iowa method” which utilized a very dry and dense concrete mix to help protect against chloride ingress. The decks have spalls and cracks throughout with a large concentration of spalls at the joints with the approach panels due to corrosion of shear dowels in combination with traffic impact of the headers. Both structures are in similar condition and detailing which is why they are both included in the same report.
BR09259 (Southbound)
BR09259A (Northbound)

Sampling and Testing: Sampling and testing was performed in April of 2016 which consisted of 4x4”
cores taken from the decks.
All 7 of the deck cores were taken from the right travel lane due to ease of traffic control. One core from 09259 broke shallow due to a delamination and was not sent in for testing. 3 Cores were obtained from 09259A due to time constraints. The overlay portion from core 1 from 09259A was destroyed on extraction and not tested. Core 3 from 09259A broke shallow and did not yield any parent material to test.
The 6 deck cores were tested for chlorides according to ASTM C1152/C1152M at
½” depth increments starting at the deck surface.
BR09259 Repair Area at Deck-Impact Panel Joint
BR09259: Core Showing Overlay (left), Parent Material with Large River Rock (Right)

BR09259A: Core Hole Showing Relatively Shallow Portion of Overlay With Corrosion Induced Fracture at Top Mat Plane
Results:
Figure 22: BR09259 Chloride Concentrations of Rigid Overlay (Curve Fit, 3 Samples)
Chloride Profile 1
0.8 0.6 0.4 0.2
Core 1
Core 3
Core 4
Curve Fit
Corr. Threshold 0
0 1 2 3 4 5 Rebar Depth
Depth (in) Chlo
ride
by M
ass o
f Con
cret
e (%
)

Figure 23: BR09259 Chloride Concentrations of Parent Material (Curve Fit, 3 Cores)
Figure 24: BR09259A Chloride Concentrations of Rigid Overlay (Curve Fit, 2 Cores)
Chloride Profile 0.9
0.8
0.7
0.6
0.5
0.4
0.3
0.2
0.1
0
Core 1
Core 3
Core 4
Curve Fit
Corr. Threshold
Rebar Depth
0 1 2 3 4 5 Depth (in)
Chloride Profile 1
0.8 0.6 0.4 0.2
0
Curve Fit
Corr. Threshold
Rebar Depth
Core 2
Core 3 0 1 2 3 4 5
Depth (in) Chlo
ride
by M
ass o
f Con
cret
e (%
) Ch
lorid
e by
Mas
s of C
oncr
ete
(%)

Figure 25: BR09259A Chloride Concentrations of Parent Material (Curve Fit, 2 Cores)
Analysis: These decks show chloride contamination above the corrosion threshold at or
approaching the level of reinforcement in the overlays. The parent concrete has contaminated concrete down to about 3”-4” below the surface of the concrete. All of this contaminated material would need to be removed in order to ensure delamination does not continue and chloride does not migrate toward the bottom mat. To remove this much material, it is assumed that hydro-demolition would be the least damaging to reinforcement and the most cost effect method of removal.
The impact panels also require extensive repair and detailing modifications to avoid spalling of dowels in the future.
Assuming the original construction plans were followed and the “Iowa Method” overlay was constructed with 2” cover over the rebar, the current deck thicknesses are 7.5”. This method of construction means there is a variable thickness in the overlay as spalls were repaired. This was observed in the core samples.
In reviewing the attached documents, the density of the overlay material would require a high pressure hydro-demolition that would likely punch through the additional 3.5” of parent material due to a combination of being older (harder, brittle), less dense, and having large aggregate.
Given this combination of corrosion and constructability issues, replacement of the decks and impact panels on BR09259 and BR09259A is recommended. The region may want to review construction methods to see if it is possible to remove 3.5” of a 7.5” deck in an economical way that won’t blow through the soffit given the density of the overlay material. Given the amount of salt the reinforcement has seen over the years, a large portion of the top mats are assumed to need repair.
Chloride Profile 1
0.8 0.6 0.4 0.2
0
Curve Fit
Corr. Threshold
Rebar Depth
Core 1
Core 2 0 1 2 3 4 5
Depth (in) Chlo
ride
by M
ass o
f Con
cret
e (%
)

Given the history of this area, alternate construction materials or practices which elevate corrosion resistance or eliminate/minimize chloride intrusion should be explored when replacing these decks.

e. Ashland
1. Hwy 1 over Crowson Rd. NB BR08746N
Background: BR08746N at M.P. 13.29 on Hwy 1 (Route IS5N) is a pre-stressed concrete girder
design constructed in 1963. The deck was replaced when the bridge was widened in 2001. The deck has spalling mostly concentrated in the left rut of the right travel lane which prompted this investigation.
BR08746N: Overview of Right Travel Lane with Spalled/Patched Areas
Sampling and Testing: Sampling and testing was performed in April of 2016 which consisted of 3x4”
cores taken from the deck.
All 3 of the deck cores were taken from the right travel lane due to ease of traffic control.
The 4 deck cores were tested for chlorides according to ASTM C1152/C1152M at
½” depth increments starting at the deck surface.

BR08746N: Spalling and Patch Repair
Results:
Figure 26: BR08746N Chloride Concentrations (Curve Fit, 3 Cores)
Analysis: The deck shows moderate chloride contamination throughout, but critical
contamination has not reached the design depth of the reinforcement. The spalling on this structure seems to be cause by a construction defect at the splice point of transverse deck reinforcement that caused less cover (about 1.5”) directly beneath the wheel track in the slow lane which sees significant truck usage.
It should also be noted that the chloride loading on this structure is very high
(effectively about 1% by weight of concrete at the surface). This may be due to rock salt being tracked down the Siskiyou grade in addition to the magnesium chloride being used
Chloride Profile 1
0.8 0.6 0.4 0.2
Core 1
Core 2
Core 3
Curve Fit
Corr. Threshold 0
0 0.5 1 1.5 Depth (in)
2 2.5 3 Rebar Depth
Chlo
ride
by M
ass o
f Con
cret
e (%
)

on this structure. It should also be considered when programming repairs that rock salt usage is planned for IS5N up to Canyonville.
Given these factors it is reasonable that a holistic approach is taken toward
preserving this deck:
1. 2” of material should be removed from this deck and a structural (SFC or LMC) overlay be placed. This will remove all concrete contaminated above the corrosion threshold. Several methods could be used for this approach including hydro-demolition, roto-milling to 2” and repairing any damaged shallow reinforcement, combination roto-milling and use of handheld hammers around shallow reinforcement.
2. Cover should be restored to design depth above all reinforcement (2.5”).
Whether or not this affects grade will be determined by the construction methods chosen in (1).
3. Deck protection should be programmed into long term maintenance and/or
preservation planning:
a. A methacrylate or other penetrating sealer should be placed about 3 months after placement of new concrete, but before the next winter season to avoid rapid chloride penetration through cracks.
Either a waterproof wearing surface such as PPC should be placed within 10 years to protect the deck or a replacement overlay be planned for about 30 years after the repairs in (1) are completed. It should be noted that this timeframe is a rough guideline. Overlay life is going to depend on the material used, detailing at joints, and the change in effective chloride loading as rock salt is used.
2. Hwy 1 over Crowson Rd. SB BR08746S
Background: BR08746S at M.P. 13.29 on Hwy 1 (Route IS5S) is a pre-stressed RCDG design
constructed in 1963. A microsilica overlay was placed on the deck in 2001. The deck has widespread cracking and sporadic spalling.

BR08746S: Overview
Sampling and Testing: Sampling and testing was performed in April of 2016 which consisted of 4x4”
cores taken from the deck.
All 4 of the deck cores were taken from the right travel lane due to ease of traffic control. All 4 cores were taken in areas where class 2 preparation had been performed and no data from the parent material was obtained. All data shown is from the SFC overlay.
The 4 deck cores were tested for chlorides according to ASTM C1152/C1152M at
½” depth increments starting at the deck surface.
BR08746S: Repair Area Showing Surface Cracking, Corrosion, and Fracture Plane at Rebar Depth

Results:
Figure 27: BR08746S Chloride Concentrations of Rigid Overlay (Curve Fit, 3 Cores)
Figure 28: BR08746S Predicted Chloride Concentrations of Rigid Overlay at 100 Years of Age
Analysis: The deck shows very little chloride contamination except for
a strong surface concentration. This surface concentration is subject to values that fall outside of the diffusion model since weather (washing and drying) can affect the amount of chlorides accumulating on the surface.
The 100 year prediction was created by simply increasing
time in the equation used for the curve fit in Figure 27 to 100 years. Analysis shows that overall chloride absorption into sound concrete is not a problem for this structure over a projected 100 years.
Chloride Profile 0.5 0.4 0.3 0.2 0.1
0
Core 1
Core 2
Core 3
Corr. Threshold
Rebar Depth
0 0.5 1 -0.1
1.5
Depth (in)
2 2.5 3 Curve Fit
Chloride Profile 0.25
0.2 0.15
0.1 0.05
Curve Fit
Corr. Threshold
Rebar Depth
0 0 0.5 1 1.5
Depth (in) 2 2.5 3
Chlo
ride
by M
ass o
f Con
cret
e (%
) Ch
lorid
e by
Mas
s of C
oncr
ete
(%)

However, cracking (most likely shrinkage) of the overlay has caused localized corrosion leading to delamination. The cracks also appear to be causing some secondary impact and freeze thaw damage to spall out concrete in localized areas. A sealer had been applied and has probably mitigated a good bit of chloride penetration through cracks.
Given the overall condition of the structure, putting a polymer or polyester
overlay material on the existing surface is not advised. The surface prep for these materials would open existing cracks or create a lot of additional cracking and could compromise bonding of the existing overlay.
Since the overlay is still performing its function and there isn’t an underlying
chloride problem that could lead to deck replacement it is suggested to leave the overlay in service while monitoring its condition and then programming a replacement of the wearing surface with another overlay SFC, or LMC. This overlay will not see the intended 30 year+ service life due to the extent of shrinkage cracks, impact, and freeze/thaw damage.
Cleaning the surface and applying another sealer could be a worthwhile
investment and could add another 5 years or so of service life out of the existing overlay. This benefit is hard to quantify because we don’t know how much micro cracking or delamination has already occurred. A chain drag survey would be a good indicator if this is a worthwhile preservation activity.

f . Klamath Falls
1. Link River, Hwy 4 NB Conn BR08347A
Background: BR08347A at M.P. 275.38 on Hwy 4 (Route US97N) is a RCBG design
constructed in 1968. The deck has been having spalling issues for several years that the bridge crew has been chasing with patching efforts and a thin epoxy overlay installed in 2008 that has continued to crack and spall as corrosion of the reinforcement continues. Chloride tests were conducted in late 2012 and correctly identified that the bridge had corrosion issues due to chloride contamination but the sampling method is subject to inaccuracies and could not be used to offer proper advice on repair measures.
BR08347: Overview of Deck with Repair Areas
Sampling and Testing: Sampling and testing was performed in April of 2016 which consisted of 4x4½”
cores taken from the deck.
All 4 of the deck cores were taken from the left wheel track due to ease of traffic control. This was deemed acceptable as there appeared to be little difference in rutting between the two wheel tracks and while there was more patching done in the right wheel track, corrosion cracks through the entire width of the overlay indicated that chloride contamination was occurring throughout the structure.
3 of the 4 deck cores were tested for chlorides according to ASTM
C1152/C1152M at ½” depth increments starting at the deck surface after removal of the epoxy wearing surface. One of the cores broke too shallow to be tested due to a corrosion induced delamination (See photo below).

Results:
Figure 29: BR08347A Chloride Concentrations (Curve Fit, 3 Cores)
BR08347A: Corrosion Induced Delamination Fracture within Core
Analysis: The deck shows extreme chloride contamination throughout. There are three
options of rehabilitation that should be evaluated for this structure. In all cases, the thin broom and seed overlay will have to be removed.
Contaminated concrete should be removed and replaced with new material from
the entire deck to a depth of at least 2” to ensure that existing chlorides below removal depth don’t exceed the chloride threshold at the reinforcement level as they diffuse back into new material.
Chloride Profile 0.25
0.2 0.15
0.1 0.05
Core 1
Core 3
Core 4
Curve Fit
Corr. Threshold 0
0 0.5 1 1.5 Depth (in)
2 2.5 3 Rebar Depth
Chlo
ride
by M
ass o
f Con
cret
e (%
)

Impressed current cathodic protection (ICCP) could be applied to this structure after all damaged concrete is removed and replaced. This requires installation of an anode material in a cementitious overlay as well as a permanent power supply and a datalogger to monitor the effectiveness of the system over time. Different materials determine life span and cost of this type of repair and Bridge Preservation will be available to assist with pricing and mobility concerns with this work. There are some challenges to specifying and implementing this repair, but the degree of success in mitigating corrosion is extremely high.
Electrochemical chloride extraction (ECE) could be applied to this structure after all
damaged concrete is removed and replaced. It uses the same principles as ICCP but accelerates the process with a higher current density for a short period of time in favor of not having to maintain a power supply or anode system. ECE is typically applied for 4-8 weeks and the deck should be milled and a non-permeable wearing surface applied immediately following ECE. This repair needs further analysis by Bridge Preservation as it only removes chloride contamination immediately surrounding the rebars and a significant amount of chlorides could be left in the structure without proper implementation.
It is advised to add an additional 1” of cover above existing grade creating a
total of 2.5” clearance from reinforcement if repair (1) is chosen. There is anecdotal evidence that 1.5” is not enough cover as a deck that is only 15 years old is showing extensive spalling where reinforcement cover was only approximately 1.5”.

5. Design-Build Specification: Design for Durability
(Commentary: This specification applies only when the Contractor will be responsible for structural design of all or portions of a project. This would generally be limited to design/build projects and value engineering proposals.)
SECTION 00XXX – DESIGN FOR DURABILITY
Section 00XXX, which is not a Standard Specification, is included in this Project by Special Provision.
Description 00XXX.00 Scope - This work consists of performing analysis, testing, and providing reports to demonstrate that the designed bridge is capable of providing the minimum required design service life according to 00XXX.50 Design Service Life Requirements. 00XXX.10 Definitions – Following are definitions of words and phrases used in this special provision. Design Service Life – The specified period of time for which a structure or a component is to be used for its intended purpose with appropriate maintenance activities and without unplanned major repair, or rehabilitation, or replacement. Major Bridge – For these provisions, a major bridge is any structure that is required to have a design service life greater than Other Bridges. Although this will normally be bridges of significant size, it will apply to any bridge the Agency deems requires enhanced durability. Service Life – The actual period of time where the structure is used for its intended purpose with appropriate maintenance activities and without unplanned major repair, rehabilitation or replacement. Other Bridges – Typical bridges required to have a design service life equal to the Design Life specified in AASHTO LRFD. Maintenance activities – Normal regular maintenance is required during the service life. Normal maintenance is defined as either “good practice” directed toward prolonging the life of components which are performing as expected (e.g. cleaning debris from horizontal surfaces) or local repairs resulting from unforeseen conditions.

Major repair, rehabilitation – An activity required because of widespread or significant systemic deterioration arising from actual service and exposure conditions. A major repair or rehabilitation is not part of the planned maintenance activities. 00XXX.20 Unacceptable Materials – Do not use the following materials.
• Stay-in-place deck forms • Steel girder or composite sandwich decking • Timber or timber composites • Proprietary composite steel/concrete girder systems • Previously used materials
00XXX.30 Strategy – Use one or more of the following methods for providing the required design service life for each identified potential degradation mechanism:
• Avoid the degradation mechanism. • Select materials and details which resist the degradation mechanism for the required
period of time. • Apply supplementary protective measures to protect the structure from the degradation
mechanism for the required period of time. • By other means acceptable to the Agency.
Base the primary approach to achieve the required design service life on the need to achieve a high quality concrete with sufficient cover, paying particular attention to structural detailing. Do not consider secondary measures such as active current cathodic protection, passive sacrificial anodes, and corrosion inhibiting admixtures as mitigation of expected corrosion effects in structures, including piles and do not consider them as justification for relaxation of the primary approach to achieve the required design service life. Electrically insulate dissimilar metals from one another to prevent galvanic corrosion. Electrically insulate aluminum products from concrete components.
(The suggested minimum service life of various components is listed below. The project team will confirm the required service life and which components are considered non-replaceable and which can be considered replaceable. The ODOT BDDM will provide guidance for some component types.)
00XXX.50 Design Service Life Requirements – Provide components having the following minimum design service life.

1) Non-Replaceable Components: Major structural components that are not designed to be replaced within the service life of the Bridge.
Non-Replaceable Component Major Bridges Other Bridges Drilled shafts or piles 100 years 75 years Shaft caps or pile caps 100 years 75 years Piers & columns 100 years 75 years Pier caps & cross beams 100 years 75 years Girders, floor beams, stringers, 100 years 75 years diaphragms, & cross frames Concrete decks 100 years 75 years Other non-replaceable components 100 years 75 years 2) Replaceable Components: Components designed to be replaced entirely within the
service life of the Bridge.
Replaceable Component Major Bridges Other Bridges Drainage systems 40 years 30 years Concrete bridge barriers 40 years 40 years Steel bridge rail elements 40 years 30 years Deck wearing surface 25 years 25 years Bridge bearings 40 years 40 years Expansion joints 30 years 30 years Overhead sign structures 40 years 30 years Internal access ladders, 40 years 30 years platforms, fall protection devices, & other safety features Traveler systems 40 years 30 years Coating systems 20 years 20 years Other replaceable components As negotiated. As negotiated.
When concrete overlays are included as part of the long-term corrosion plan for a concrete deck, consider the overlay non-structural for design. When an overlay will be placed with the original construction, neglect the top ¼ inch of concrete in the deck design. When an anticipated overlay is not placed with the original construction, neglect the top ½ inch of concrete in the deck design. These requirements apply to Latex-Modified concrete (LMC), Silica-Fume Concrete (SFC), Polyester Polymer Concrete (PPC), and thin-lift overlay systems. Do not use asphalt concrete overlays on concrete decks. 00XXX.60 Service Life and Corrosion Protection Plan – Provide a detailed Service Life and Corrosion Protection Plan for all bridges, prepared by or under the direction of a qualified

Professional Engineer licensed in the State of Oregon and bearing the engineer’s signature, seal, and expiration date. Include the following minimum considerations:
• An executive summary describing the conceptual approach to achieving the required service life for non-replaceable components.
• Identification of each bridge component with the corresponding environmental exposure
conditions for each component (e.g., buried, submerged, exposed to atmosphere, exposed to corrosive chemicals, exposed to splash/spray, exposed to surface runoff containing deicing chemicals). Include the following typical surfaces that are subject to spray, splash or surface runoff containing de-icing chemicals as a minimum:
• Concrete decks (with or without waterproofing), curbs, sidewalks, barrier walls, bridge fascia, and end diaphragms.
• For concrete decks with closed barrier walls, the exterior surface of the barrier system, deck fascia, and underside of deck up to the drip groove.
• For concrete decks with or without curbs but with open railings, the deck fascia and underside of the deck past the drip groove to the lowest elevation of the primary component and thereafter along the soffit for a minimum distance of 3 feet. For soffits that are level or slope downward, the portion from the exterior edge to the full soffit width. For girders, the exterior surface and soffit of the girder.
• Components and surfaces under expansion joints, such as bearings and ends of girders, ends of decks, ballast walls, bearing seats, wing walls, etc.
• Exposed surfaces located within 20 feet horizontally of the roadway and 20 feet above the roadway.
• Identification of relevant degradation and protective mechanisms for each bridge component. Quantify degradation processes and resistances to these processes with respect to time. List the models used in the plan. For chloride-induced corrosion in concrete structures, use a model as required in 00XXX.70 Full-probabilistic Models to evaluate the time-related changes in performance depending on the component, environmental conditions, and any proposed protective measures.
• Confirmation of the expected service life of each bridge component based on the
proposed material, exposure condition, relevant degradation mechanism, and any proposed protective measures, taking into account the proposed inspection and maintenance schedules. List any corrosion allowances and thresholds used. Include the level of reliability or probability of the predicted service life for each element as well as the expected interval for replacement or renewal of the protective measures within the service life duration (e.g., thickness of coats, number of times to recoat paint that protects steel members).

• Explanation of what will be done during construction to ensure suitably high quality products are achieved (including uniform compaction of concrete, adequate concrete cover, proper curing). Identify critical materials properties to be validated during the construction period. Describe proposed quality control and quality assurance program for each material, including testing frequency to outline how the parameters assumed during the design will be achieve through construction. At a minimum, verify the following parameters during construction:
• Concrete covers: Following concrete placement, measure concrete covers using a magnetic cover reader on a 4 feet x 4 feet grid with a minimum of two horizontal and two vertical readings per side of every concrete element constructed.
• Concrete transport properties (use test consistent with the time to corrosion model in 00XXX.70 Full-probabilistic Models):
• For Major Bridges: during the trial batch process, and every 1000 cubic yards or once a month for each mix used on permanent works.
• For Other Bridges: during the trial batch process, and at least once for each component of permanent works.
• Concrete initial chloride content: during the trial batch process. • Concrete hardened air void ASTM C457: during the trial batch process.
• Describe the general procedure for assessing non-conformances occurring during
construction that may negatively affect the service life of the component. Describe potential remediation methods that may be considered. Provide remediation methods that return the affected materials and components to a condition consistent with the service life requirements.
(The project team will determine the discount rate to be used based on current economic conditions. As of July 2017, the recommended discount rate for Oregon is 2.9%.)
• Summary, for each component and relevant element, of the estimated life-cycle costs for
each bridge. For the life-cycle cost analysis, use a discount rate of x.x% to convert future costs to present worth in the current year.
Include the following additional information with the corrosion protection plan:
• List of manufacturers for all proposed coatings, sealers, and membranes. • Proposed corrosion inspection schedule for relevant components. • Proposed maintenance schedule for relevant items and materials that could be affected
by corrosion or other means of degradation. Following construction, submit an As-Built Corrosion Protection Report. This report will confirm that the constructed components meet all requirements necessary to ensure the intended design

service life. For any components not meeting all requirements, identify the changes to the approved Service Life and Corrosion Protection Plan needed to achieve the design service life including any remediation methods implemented during construction.
00XXX.70 Full-probabilistic Models – Acceptable full-probabilistic models for predicting degradation of components are as follows: Concrete elements – Model the chloride-induced corrosion process in concrete components based on the fib Bulletin 34 approach using a full probabilistic model. Other equivalent models can be used if approved by the Agency. Use the model to determine the combination of concrete covers, concrete properties, and type of embedded steel that will achieve the design service life. Test the concrete transport properties of the concrete mixes used in the permanent works using a test consistent with the chosen model. Use the Nordtest NTBuild 492 test if the modeling is performed according to the fib Bulletin 34 chloride-induced corrosion model. The end of the design service life is reached when the chloride concentration reaches the corrosion threshold at the reinforcement (corrosion initiation) using a target reliability index of 1.3.
Use the following corrosion thresholds:
• 0.06% by mass of cement for ASTM A615 and ASTM A706 carbon steel reinforcement • 1.4% by mass of cement for ASTM A1035, Grade CM steel reinforcement • 3.6% by mass of cement for Type 316 stainless steel reinforcement (including alloys listed
in Table 02513-1 of the Boilerplate Special Provisions 02513 for Stainless Steel Reinforcement). (The project team will determine the value for x.x% by mass of concrete based on the local environment. As of July 2017, Oregon proposes to apply the corrosion loading as a maximum to be expected. Ultimately, we would like corrosion loading to be applied as a normal distribution. However, we do not have adequate data to determine an appropriate coefficient of variation to allow a normal distribution. The data Oregon does have is generally limited to decks. Therefore, we will need to use significant judgment when determining the corrosion loading for components other than decks. Our current loading recommendation will range from 1.1% for heavy exposure areas (Siskiyou Mountains in SW Oregon and coastal areas with direct exposure to the ocean) down to 0.06% for moderate exposure (Willamette Valley and Portland Metro). Since these recommendations will likely be modified as we gather additional data, project teams should consult with the Corrosion Engineer to confirm the values to be used on individual projects.)

Use the maximum chloride loading with the following parameters:
Component Chloride Surface Loading (% by mass of concrete)
Drilled shafts or piles x.x Drilled shaft caps or pile caps x.x Piers & columns x.x Pier caps & cross beams x.x Girders, floor beams, stringers, x.x diaphragms, & cross frames Concrete decks, sidewalks, curbs and barriers x.x Coated steel elements, including hot-dip galvanized steel elements – Model coating system deterioration due to water intrusion, chloride intrusion, ultraviolet radiation, weathering, abrasion, thermal cycling, and consumption of sacrificial elements. Currently a “deemed to satisfy” approach based on consideration of the listed causes of deterioration is acceptable. The end of service life for the coating system is reached when there is 10% coating breakdown and active rusting of the substrate is present. 00xxx.80 Measurement - No measurement of quantities will be made for work performed under this Section.
(The project team will determine whether payment should be one item for the whole project or separate items for each structure.)
00xxx.90 Payment - Work performed under this Section will be paid for at the Contract lump sum amount for the item “Service Life and Corrosion Protection Plan”. Payment will be payment in full for all analysis, testing, reporting, and furnishing all equipment, labor, and incidentals necessary to complete the work as specified. Payment for this item includes both the “Service Life and Corrosion Protection Plan” and the “As-Build Corrosion Protection Report”.

Summary and Conclusions
Bridge Design Trial Based on the Oregon Bridge Design and Drafting Manual, Ochoco Creek Bridge resides in a Snow/Ice Area, which requires all deck and end panel detailing to conform to the following practice:
• High performance concrete class 4500 (Class 4000 at time of construction). • Epoxy coated top and bottom reinforcing mats • Cover equal to 2.5 inches in the top mat and 1.5 inches in the bottom mat.
Common practice is to assume that the chloride threshold for corrosion, in terms of chloride mass as a percentage of cement mass, is 0.6% for uncoated steel reinforcement. For undamaged epoxy coated steel reinforcement a value of 0.9% as a percentage of cement mass can be assumed until more corroboratory research is conducted, since this value is based on one study and may not be generally accepted by the industry. This chloride content must occur at the level of reinforcement to induce corrosion.
The minimum and maximum values in a chloride content curve are represented by the baseline chloride content of the mix design and chloride surface concentration. The chloride content within the concrete section should never be above or below these values. This means that the chloride surface loading at this site (0.12%) is insufficient to induce corrosion of even uncoated reinforcement (>0.6%). As such, it is unlikely that chlorides will be the cause for this structure’s demise, regardless of the bridge deck detailing or material properties of the deck concrete.
Plots for service life are available in Appendix D and demonstrates that the materials and detailing are suitable to provide at least 100 years of service life for the loading. Plots are shown for two alternate HPC mix designs. One mix utilized ground granulated blast furnace slag (GGBFS) and the other used fly ash. The GGBFS mix design was used for construction of the replacement structure.
Bids ranged from roughly $4000-$10,000 to produce the original chloride profiling of four samples. Costs for sample collection, data review, and data analysis were likely equal to the lab costs. At the low end, this portion of the service life design increased design costs by $7,500. Additional costs were incurred during construction for further lab testing. If the structure design followed the service life design recommendations, uncoated reinforcement would have been used in all structure elements. Using a $0.40 per pound premium for epoxy coated reinforcement above uncoated reinforcement, the structure’s cost could have been reduced by $11,600 (29,000 x $0.40).
These results indicate that this effort was cost effective, but marginally so in the specific environment. This is due to the additional design costs not substantially impacting the final

design in this case, but the effort did provide a rational basis for verifying the measures to ensure the structure’s long term durability and quality. If the evaluation is inaccurate or weather/maintenance patterns change, epoxy coated reinforcement serves as relatively inexpensive insurance against corrosion. This may not be true for all cases, but it appears that ODOT’s standard of practice is reasonable and cost effective for typical structures of this kind. Two elements of quality assurance were introduced into the construction process. Concrete was tested to determine each mix’s chloride migration coefficient and reinforcement cover was verified using ground penetrating radar. These two elements were selected to be introduced for information only. Material testing was challenging to accommodate, since every sample needed to be tested at exactly 28 days. Overall, the process required thorough communication and strict timelines to ensure testing was conducted appropriate. The process will need to be fine-tuned to implement efficiently on a larger scale, specifically due to the limited laboratories available to complete the time consuming NT Build 492 test. Verification of reinforcement cover was easily accommodated. Overall, the process was straight forward and could be implemented on future bridge design projects. The information and confirmation provided was considered useful.
Chloride Sampling of In-service Bridge Decks for Development of Standard Practice
Evaluation of In-Service Bridge Decks Using Chloride Analysis has proven to be an extremely effective tool when scoping for rehabilitation. An investment on the order of a few thousand dollars up front can save significant funding on possibly using the wrong preservation or rehabilitation method. ODOT is fortunate that the two failing multi-layered polymer concrete overlays which demonstrate this fact (on BR02071A and BR08347A) were installed by State maintenance forces and were relatively inexpensive.
This testing only evaluates a subset of issues that could be plaguing a distressed bridge deck. Detailing, inspection reports, load ratings, and maintenance records need to be reviewed as well as conducting NDE such as infrared photogrammetry and impact echo in addition to this testing in order to identify the main source of distress.
As demonstrated by this report, the behavior of each structure varies and can be quite unique. Although we found that specific classes, types and age of bridges can be grouped to leverage the investigation to reasonable finding for a group of bridges. When using this approach, care must be taken, since issues with poor detailing and construction defects such as shifts in reinforcement or shrinkage cracks can make a structure with otherwise good service life design details perform poorly.
In practice, the different mix designs used throughout Oregon for decks and overlays don’t show a significant difference in chloride diffusion coefficients. One reason for this may be that the chloride loading in Oregon is fairly low compared to the amount of precipitation and the pore spaces in concrete mixes are not the driving factor for chloride ingress.

Additionally, ACWS has been observed to offer some protection against chlorides on several bridge decks tested. This is contrary to the belief that this material will hold deicing brine on the deck surface for longer periods of time and cause a greater chloride loading. A more detailed analysis of these materials should be conducted after more data points are collected.
The ultimate goal of synthesizing this data in a single report was to influence written guidance to designers in our Bridge Design and Drafting Manual. The results of this testing so far is promising in this regard. Overall, the effective chloride surface concentrations seen in Oregon are remarkably low. Because of this, effective service life is heavily influenced by other factors which often seem to control such as rutting, impact, and freeze/thaw. This will require designers to spend a little more effort considering all factors when scoping rehabilitation or preventative maintenance projects.
A major issue when approaching a structural overlay project is detouring traffic. Due to its short placement and cure times ODOT will be looking at possibly using fast-curing latex modified concrete in some of its projects instead of silica-fume concrete mixes. The inspections associated with the R19A phase II chloride testing have provided anecdotal evidence that LMC performs well in high ADT areas as well as numerical analysis that it resists chloride ingress as well as SFC in practice (according to the late 80s early 90s LMC overlays encountered).
With a relatively small number of additional data points, we could reasonably identify the relatively small areas of Oregon which need a higher level of preventative maintenance on existing structures and alternative corrosion resistant materials in new construction. Currently, most new construction projects utilize standard construction details, materials, and practices would provide service lives in excess of 100 years without the use of epoxy coated steel reinforcement we currently specify. However, the recent decision to expand the use of rock salt programmatically over an additional several hundred miles of highway and “strategically” in some urban centers will require additional testing and study of those targeted highway segments in order to draw appropriate conclusions from this data set.
This type of evaluation has become common with designers and bridge inspectors and will continue into the foreseeable future both to monitor the effect of using more rock salt and to better inform maintenance, preservation, and rehabilitation efforts. It has appeared to change the culture of bridge deck preservation across the State and we are now spending both maintenance and major project funds more confidently to ensure our bridge inventory provides the service life which is currently demanded.
Design-Build Specs Template
The Design-Build Specifications for Durability grew from an initial specification developed for a major design-build project in Oregon that was a combined effort of ODOT design-build program staff, ODOT Bridge Preservation staff, and two major International bridge design

consulting firms. Under the current project, we revised the specification based on learnings over the last 6 years since it was initially drafted along with significant input from SHRP2 R-19A subject matter experts at CH2M HILL and Cowi-North America. The value brought from the SHRP2 team was based in part on actual experience as part of the delivery team on three large design-build bridge projects in the eastern US where the first complete Service Life Design assessments for a major bridge in the US were completed. While working through the process we maintained a “comment log” to document some of the considerations in making fairly significant changes to the original specification. We found the comment log to be useful in explaining these considerations. It is included as an appendix to this report for future reference and as documentation of the reasons behind some of the improved language. The changes included both improved technical references, a required framework of testing, and reorganization of the specification to follow more closely the process of preparing a Service Life Design Analysis and Report.
Future Directions and Plans for Implementation of R19A principles The SHRP2 Lead Adopter Funding Award allowed Oregon DOT to fully explore the use of service life concepts in design of new bridges, characterizing chloride contamination for use in setting bridge practices and standards, and the use of an enhanced service life design specification for major new bridges. We found after completing the three phases of the project that the use of these concepts is an effective and necessary part of our due diligence in providing durable, long lasting structures to maximize the limited resources available for transportation infrastructure. Each phase of the project will lead to further work to implement these service life concepts. Some of the future work we envisioned is outlined below. New Bridge Projects 1 – ODOT plans to develop "contour" map of surface chloride loading for coastal, Willamette Valley, and Cascades/East climate regions. 2 – ODOT plans to develop and standardize specific mix designs, cover depths, reinforcement types applicable for each region and incorporate into BDDM and standard specifications. 3 – ODOT will consider adding requirements for measuring concrete cover dimensions on hardened concrete for all new bridges as a requirement in the standard construction specifications. 4 – ODOT plans to establish requirements for recording as-built documentation of durability properties (mix designs/test results, cover dimensions) during construction as part of an enhanced asset management system. In Service Monitoring and Rehabilitation Projects

1 – ODOT is moving forward in the development of a comprehensive plan for periodic sampling/coring of bridge decks for chloride profiling for condition assessment of a set of “indicator” bridges to be used in selecting preservation actions for similar bridges. 2 – We are planning to develop guidelines for in-place chloride level limits for decision making on preservation actions such as minor repairs, partial deck removal, overlays, cathodic protection, chloride extraction, and for full replacement.

Appendix A:
Bridge Plans Existing and Proposed


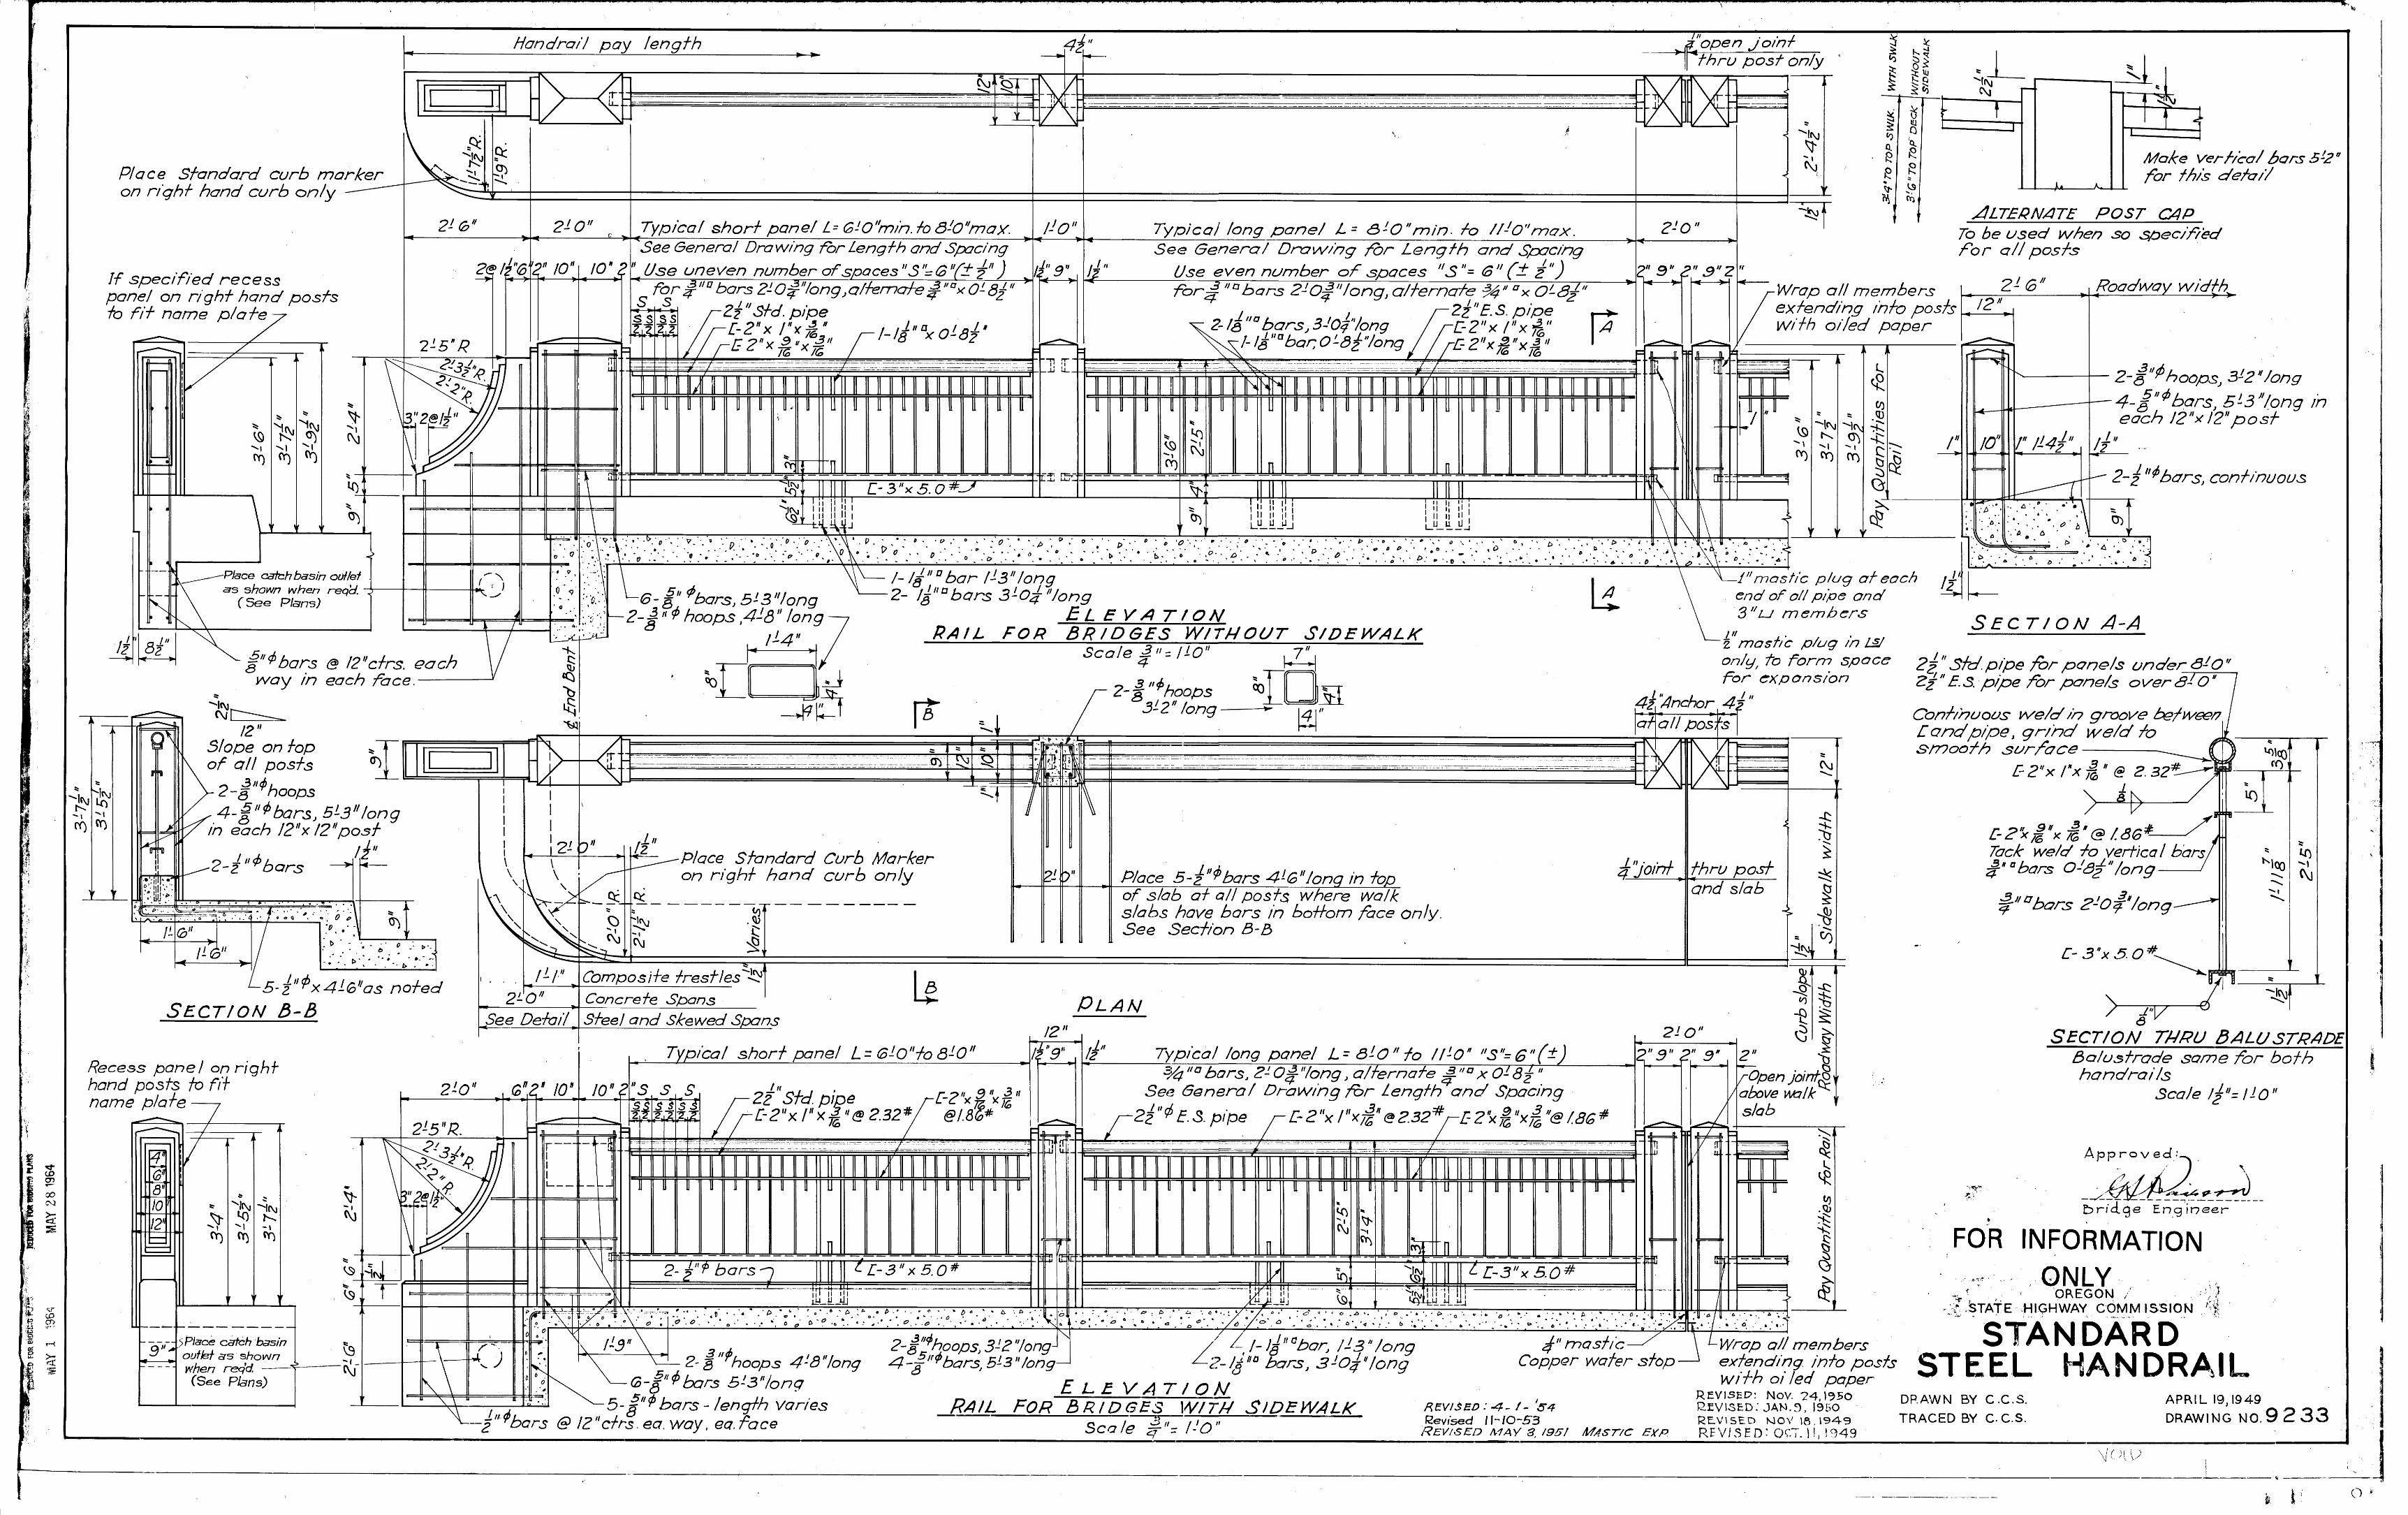


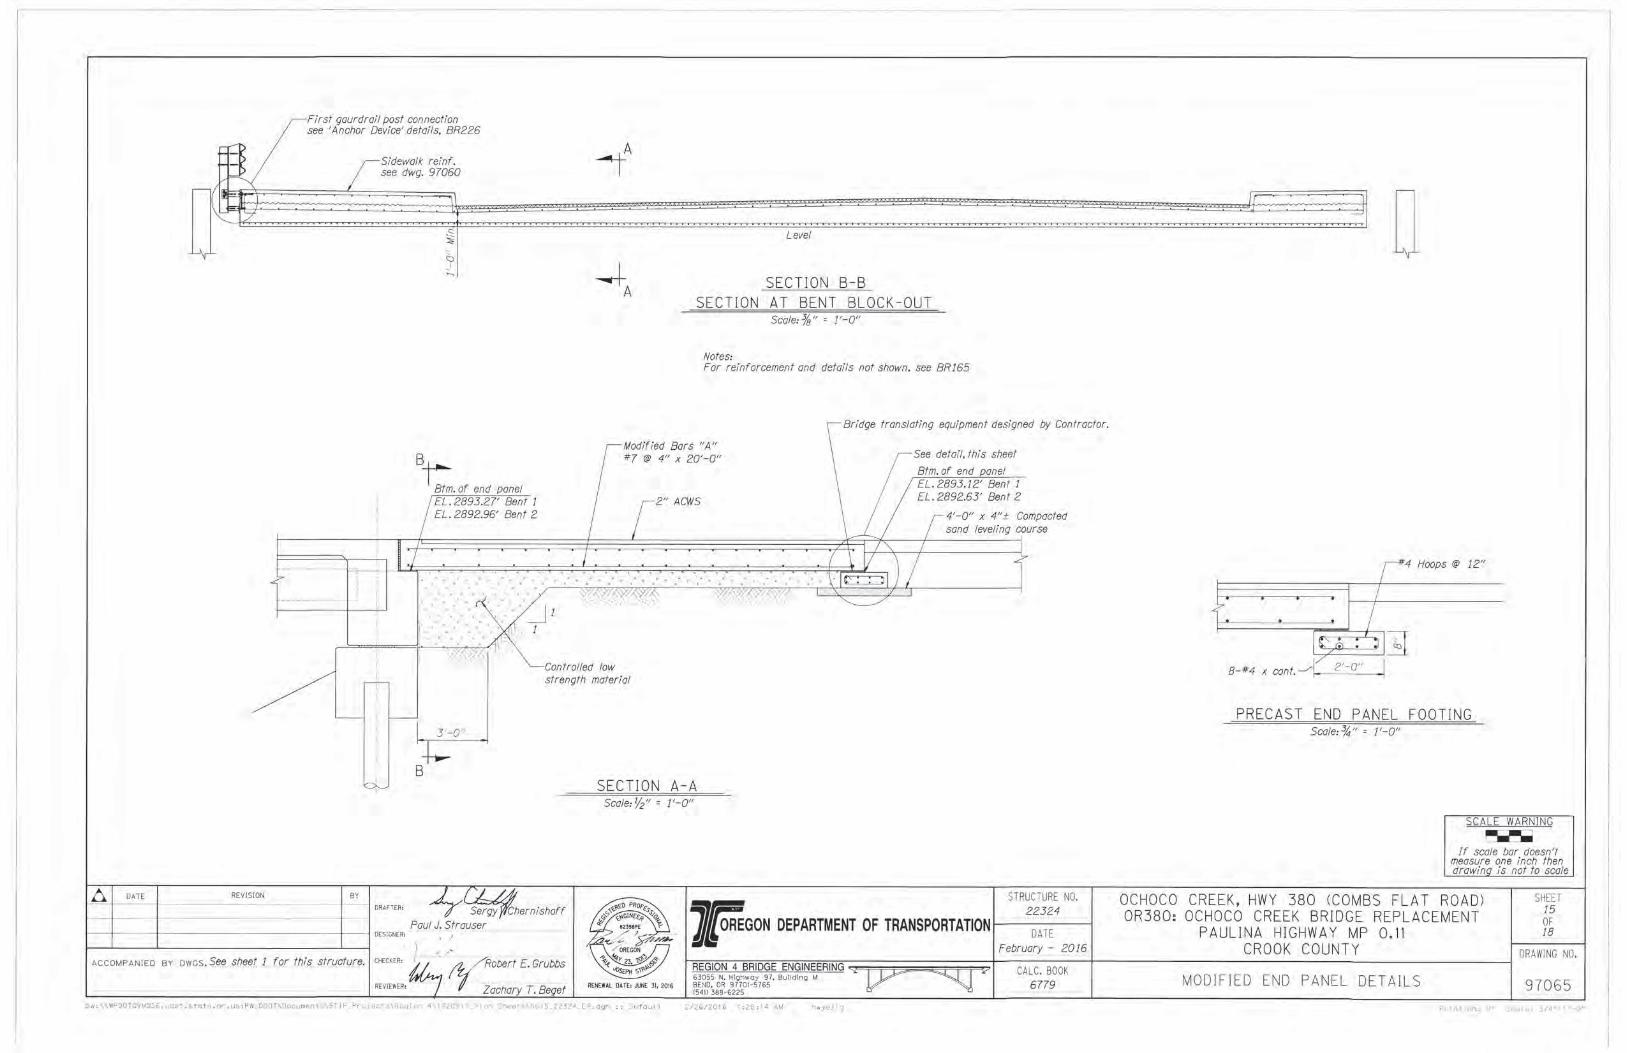


Appendix B:
Existing Structure Test Methods and Laboratory Data

OREGON DOT CORE SAMPLES CHLORIDE TEST RESULTS
1 | P a g e
Core SW #2 Chlorides
Depth Wsample (g) Cs (kg/m3) Ex (mV) Ex+S (mV) Ex+2S (mV) Cx (kg/m3)
0‐1mm 2.5000 16.7371 219.6 147.4 131.3 0.88
1‐2mm 2.5060 16.6970 233.6 148.2 131.5 0.54
2‐3mm 2.5030 16.7171 247.2 148.5 132.5 0.25
3‐4mm 2.5010 16.7304 253.4 149.2 132.6 0.23
4‐5mm 2.5050 16.7037 254.8 148.8 131.7 0.24
5‐6mm 2.5100 16.6704 254.3 148.3 131.5 0.22
6‐7mm 2.5050 16.7037 254.4 147.2 131.0 0.18
7‐8mm 2.5070 16.6904 255.5 146.5 130.6 0.15
8‐9mm 2.5050 16.7037 254.1 145.7 130.5 0.12
9‐10mm 2.4980 16.7505 255.3 146.8 130.9 0.15
15‐16mm 2.5090 16.6771 255.3 145.7 130.2 0.13
20‐21mm 2.4990 16.7438 250.0 148.2 131.0 0.30
25‐26mm 2.5080 16.6837 252.0 148.9 132.3 0.24
37.5‐38.5mm 2.4940 16.7774 250.3 150.0 132.2 0.37
50‐51mm 2.5070 16.6904 256.3 149.1 132.8 0.18
Core SE #3 Chlorides
Depth Wsample (g) Cs (kg/m3) Ex (mV) Ex+S (mV) Ex+2S (mV) Cx (kg/m3)
0‐1mm 2.2420 18.6632 240.0 144.5 129.0 0.28
1‐2mm 2.5000 16.7371 231.8 146.4 130.8 0.41
2‐3mm 2.4100 17.3622 232.1 148.2 132.1 0.52
3‐4mm 2.5000 16.7371 233.3 149.7 134.2 0.44
4‐5mm 2.5010 16.7304 242.5 153.5 136.8 0.46
5‐6mm 2.5010 16.7304 238.4 151.9 136.1 0.41
6‐7mm 2.5030 16.7171 243.9 151.3 135.0 0.35
7‐8mm 2.5020 16.7237 246.5 151.2 134.9 0.31
8‐9mm 2.4970 16.7572 253.4 156.3 139.0 0.37
9‐10mm 2.4990 16.7438 252.8 153.5 136.7 0.30
15‐16mm 2.5010 16.7304 259.8 151.8 135.2 0.19
20‐21mm 2.5030 16.7171 260.3 152.4 135.9 0.19
25‐26mm 2.5020 16.7237 266.9 154.5 136.8 0.22
37.5‐38.5mm 2.5060 16.6970 260.1 151.1 134.6 0.18
50‐51mm 2.5010 16.7304 273.5 152.2 135.6 0.11

OREGON DOT CORE SAMPLES CHLORIDE TEST RESULTS
1 | P a g e
Core NW #1 Chlorides
Depth Wsample (g) Cs (kg/m3) Ex (mV) Ex+S (mV) Ex+2S (mV) Cx (kg/m3)
0‐1mm 2.5090 16.6771 223.7 142.0 126.1 0.53
1‐2mm 2.5020 16.7237 236.8 142.4 126.1 0.33
2‐3mm 2.5030 16.7171 237.2 141.9 125.9 0.29
3‐4mm 2.5040 16.7104 236.4 141.0 125.1 0.28
4‐5mm 2.4970 16.7572 231.8 141.6 125.3 0.40
5‐6mm 2.5010 16.7304 231.3 141.6 125.4 0.39
6‐7mm 2.4980 16.7505 232.7 140.9 125.0 0.33
7‐8mm 2.4970 16.7572 234.4 140.0 124.4 0.27
8‐9mm 2.5000 16.7371 231.7 140.5 124.6 0.34
9‐10mm 2.4980 16.7505 230.9 141.0 124.9 0.38
15‐16mm 2.5020 16.7237 242.8 141.2 125.1 0.22
20‐21mm 2.5030 16.7171 244.6 141.1 125.1 0.20
25‐26mm 2.4990 16.7438 245.1 141.2 125.0 0.21
37.5‐38.5mm 2.4970 16.7572 235.0 141.0 125.1 0.30
50‐51mm Insufficient core depth
Core NE #4 Chlorides
Depth Wsample (g) Cs (kg/m3) Ex (mV) Ex+S (mV) Ex+2S (mV) Cx (kg/m3)
0‐1mm 2.4950 16.7707 244.0 143.6 127.6 0.23
1‐2mm 2.4990 16.7438 248.1 143.9 127.7 0.20
2‐3mm 2.5020 16.7237 245.1 144.1 127.3 0.28
3‐4mm 2.5030 16.7171 243.0 143.7 127.7 0.24
4‐5mm 2.5030 16.7171 242.3 143.7 127.7 0.25
5‐6mm 2.5020 16.7237 243.8 143.9 127.8 0.24
6‐7mm 2.5030 16.7171 245.6 144.4 127.9 0.25
7‐8mm 2.4970 16.7572 247.8 142.8 127.9 0.13
8‐9mm 2.5040 16.7104 251.8 145.8 125.0 0.55
9‐10mm 2.4960 16.7639 250.5 143.5 127.1 0.19
15‐16mm 2.4970 16.7572 258.0 142.3 126.0 0.13
20‐21mm 2.5030 16.7171 260.9 144.3 128.3 0.11
25‐26mm 2.5020 16.7237 263.4 144.2 127.6 0.12
37.5‐38.5mm 2.4970 16.7572 257.6 142.8 125.9 0.16
50‐51mm 2.4960 16.7639 252.7 142.8 126.7 0.15

Date: 15-Nov-15
Test Method VTRC 02-R18
Test Sample ID # Core NE #4
d depth from surface [mm] 0 1 2 3 4 5 6 7 8 9 10 15 20 25
Cm Test Values [kg/m3] 0.230 0.200 0.280 0.240 0.250 0.240 0.250 0.130 0.190 0.130 0.110 0.120
Cc Fit Data to Cs, Dapp,C [kg/m3] 0.285 0.272 0.260 0.248 0.237 0.225 0.215 0.205 0.195 0.186 0.178 0.147 0.130 0.123 ∑ (Cm-Cs)
2
(Cm - Cs)2
Sum of least squares 3.64E-03 1.00E-03 1.07E-05 6.01E-04 6.39E-04 2.07E-03 4.21E-03 1.52E-04 2.73E-04 4.06E-04 1.03E-05 1.30E-02
Co
Initial chloride content
(measured) [kg/m3] 0.120
t Exposure time [yr] 50
Cs
Chloride content at
exposed face [kg/m3] 0.285
Dapp,C
Apparent coefficient of
chloride diffusion [mm2/yr] 1.145
Cement content [kg/m3] 335
Cs as % mass of cement [%mass] 0.085%
Co as % mass of cement [%mass] 0.036%
Apparent Chloride Diffusion Coefficient
This tool has been developed to interpret test results from profile samples taken on concrete exposed to chlorides. The method is detailed in ASTM C1556, "Determining the Apparent Chloride Diffusion
Coefficient of Cementitious Mixtures by Bulk Diffusion". The primary results obtained from the analysis are the apparent chloride diffusion coefficient, the chloride content at the exposed face, and the initial
chloride content of the concrete specimen. Specimens are sampled and tested using ASTM C1543, "Determining the Penetration of Chloride Ion Into Concrete by Ponding" (also known as the Salt Ponding Test),
and ASTM C1152, "Acid Soluble Chloride in Mortar and Concrete". Alternatively, Nordtest NT Build 443, "Accelerated Chloride Penetration" (also known as the Bulk Diffusion Test), and Nordtest NT Build 208,
"Chloride Content by Volhard Titration", can be substituted for the ASTM tests. This tool is most valuable for determining chloride profiles of concrete at various ages and times of exposures.
0.000
0.050
0.100
0.150
0.200
0.250
0.300
0 5 10 15 20 25 30
Ch
lori
de
Co
nce
ntr
ati
on
, [k
g/m
3]
Depth below exposed surface, mm
Chloride Profile Fit Using
Test Values
Fit Data to Cs, Dapp,C
⋅⋅−⋅−+=
tD
xerfCCCtxC
Capp
oso
,21)(),(

Date: 15-Nov-15
Test Method VTRC 02-R18
Test Sample ID # Core NW #1
d depth from surface [mm] 0 1 2 3 4 5 6 7 8 9 10 15 20 25
Cm Test Values [kg/m3] 0.530 0.330 0.290 0.280 0.400 0.390 0.330 0.270 0.340 0.380 0.220 0.200 0.210
Cc Fit Data to Cs, Dapp,C [kg/m3] 0.500 0.462 0.426 0.391 0.358 0.329 0.303 0.281 0.262 0.246 0.234 0.205 0.200 0.200 ∑ (Cm-Cs)
2
(Cm - Cs)2
Sum of least squares 9.13E-03 1.01E-02 6.10E-03 5.08E-03 7.60E-03 2.45E-03 6.77E-05 8.76E-03 2.13E-02 2.16E-04 2.21E-07 9.95E-05 7.09E-02
Co
Initial chloride content
(measured) [kg/m3] 0.200
t Exposure time [yr] 50
Cs
Chloride content at
exposed face [kg/m3] 0.500
Dapp,C
Apparent coefficient of
chloride diffusion [mm2/yr] 0.400
Cement content [kg/m3] 335
Cs as % mass of cement [%mass] 0.149%
Co as % mass of cement [%mass] 0.060%
Apparent Chloride Diffusion Coefficient
This tool has been developed to interpret test results from profile samples taken on concrete exposed to chlorides. The method is detailed in ASTM C1556, "Determining the Apparent Chloride Diffusion
Coefficient of Cementitious Mixtures by Bulk Diffusion". The primary results obtained from the analysis are the apparent chloride diffusion coefficient, the chloride content at the exposed face, and the initial
chloride content of the concrete specimen. Specimens are sampled and tested using ASTM C1543, "Determining the Penetration of Chloride Ion Into Concrete by Ponding" (also known as the Salt Ponding Test),
and ASTM C1152, "Acid Soluble Chloride in Mortar and Concrete". Alternatively, Nordtest NT Build 443, "Accelerated Chloride Penetration" (also known as the Bulk Diffusion Test), and Nordtest NT Build 208,
"Chloride Content by Volhard Titration", can be substituted for the ASTM tests. This tool is most valuable for determining chloride profiles of concrete at various ages and times of exposures.
0.000
0.100
0.200
0.300
0.400
0.500
0.600
0 5 10 15 20 25 30
Ch
lori
de
Co
nce
ntr
ati
on
, [k
g/m
3]
Depth below exposed surface, mm
Chloride Profile Fit Using
Test Values
Fit Data to Cs, Dapp,C
⋅⋅−⋅−+=
tD
xerfCCCtxC
Capp
oso
,21)(),(

Date: 15-Nov-15
Test Method VTRC 02-R18
Test Sample ID # Core SE #3
d depth from surface [mm] 0 1 2 3 4 5 6 7 8 9 10 15 20 25
Cm Test Values [kg/m3] 0.280 0.410 0.520 0.440 0.460 0.410 0.350 0.310 0.370 0.300 0.190 0.190 0.220
Cc Fit Data to Cs, Dapp,C [kg/m3] 0.551 0.522 0.493 0.465 0.438 0.412 0.388 0.365 0.343 0.324 0.306 0.243 0.214 0.203 ∑ (Cm-Cs)
2
(Cm - Cs)2
Sum of least squares 6.94E-03 2.98E-03 2.64E-06 2.26E-03 4.88E-04 2.21E-04 1.12E-03 2.13E-03 3.59E-05 2.78E-03 5.62E-04 2.73E-04 1.98E-02
Co
Initial chloride content
(measured) [kg/m3] 0.200
t Exposure time [yr] 50
Cs
Chloride content at
exposed face [kg/m3] 0.551
Dapp,C
Apparent coefficient of
chloride diffusion [mm2/yr] 0.940
Cement content [kg/m3] 335
Cs as % mass of cement [%mass] 0.164%
Co as % mass of cement [%mass] 0.060%
Apparent Chloride Diffusion Coefficient
This tool has been developed to interpret test results from profile samples taken on concrete exposed to chlorides. The method is detailed in ASTM C1556, "Determining the Apparent Chloride Diffusion
Coefficient of Cementitious Mixtures by Bulk Diffusion". The primary results obtained from the analysis are the apparent chloride diffusion coefficient, the chloride content at the exposed face, and the initial
chloride content of the concrete specimen. Specimens are sampled and tested using ASTM C1543, "Determining the Penetration of Chloride Ion Into Concrete by Ponding" (also known as the Salt Ponding Test),
and ASTM C1152, "Acid Soluble Chloride in Mortar and Concrete". Alternatively, Nordtest NT Build 443, "Accelerated Chloride Penetration" (also known as the Bulk Diffusion Test), and Nordtest NT Build 208,
"Chloride Content by Volhard Titration", can be substituted for the ASTM tests. This tool is most valuable for determining chloride profiles of concrete at various ages and times of exposures.
0.000
0.100
0.200
0.300
0.400
0.500
0.600
0 5 10 15 20 25 30
Ch
lori
de
Co
nce
ntr
ati
on
, [k
g/m
3]
Depth below exposed surface, mm
Chloride Profile Fit Using
Test Values
Fit Data to Cs, Dapp,C
⋅⋅−⋅−+=
tD
xerfCCCtxC
Capp
oso
,21)(),(

Date: 15-Nov-15
Test Method VTRC 02-R18
Test Sample ID # Core SW #2
d depth from surface [mm] 0 1 2 3 4 5 6 7 8 9 10 15 20 25
Cm Test Values [kg/m3] 0.880 0.540 0.250 0.230 0.240 0.220 0.180 0.150 0.120 0.150 0.130 0.300 0.240
Cc Fit Data to Cs, Dapp,C [kg/m3] 1.312 0.870 0.523 0.308 0.205 0.165 0.153 0.151 0.150 0.150 0.150 0.150 0.150 0.150 ∑ (Cm-Cs)
2
(Cm - Cs)2
Sum of least squares 3.03E-04 3.41E-03 6.44E-04 5.60E-03 4.44E-03 8.65E-04 6.83E-09 9.01E-04 6.33E-13 4.00E-04 2.25E-02 8.10E-03 4.72E-02
Co
Initial chloride content
(measured) [kg/m3] 0.150
t Exposure time [yr] 50
Cs
Chloride content at
exposed face [kg/m3] 1.312
Dapp,C
Apparent coefficient of
chloride diffusion [mm2/yr] 0.041
Cement content [kg/m3] 335
Cs as % mass of cement [%mass] 0.392%
Co as % mass of cement [%mass] 0.045%
Apparent Chloride Diffusion Coefficient
This tool has been developed to interpret test results from profile samples taken on concrete exposed to chlorides. The method is detailed in ASTM C1556, "Determining the Apparent Chloride Diffusion
Coefficient of Cementitious Mixtures by Bulk Diffusion". The primary results obtained from the analysis are the apparent chloride diffusion coefficient, the chloride content at the exposed face, and the initial
chloride content of the concrete specimen. Specimens are sampled and tested using ASTM C1543, "Determining the Penetration of Chloride Ion Into Concrete by Ponding" (also known as the Salt Ponding Test),
and ASTM C1152, "Acid Soluble Chloride in Mortar and Concrete". Alternatively, Nordtest NT Build 443, "Accelerated Chloride Penetration" (also known as the Bulk Diffusion Test), and Nordtest NT Build 208,
"Chloride Content by Volhard Titration", can be substituted for the ASTM tests. This tool is most valuable for determining chloride profiles of concrete at various ages and times of exposures.
0.000
0.200
0.400
0.600
0.800
1.000
1.200
1.400
0 5 10 15 20 25 30
Ch
lori
de
Co
nce
ntr
ati
on
, [k
g/m
3]
Depth below exposed surface, mm
Chloride Profile Fit Using
Test Values
Fit Data to Cs, Dapp,C
⋅⋅−⋅−+=
tD
xerfCCCtxC
Capp
oso
,21)(),(

Appendix C:
Proposed Structure Materials Testing Data

Nordtest Method NT Build 492 Results
Mix
Structural
Concrete
Class 3300
Standard
Structural
Concrete
Class 4000
Standard
Deck
Concrete
Class
HPC4000
(Slag)
Deck
Concrete
Class
HPC4000
(Fly Ash)
Test Result Core #1 1.046E‐11 ‐ 7.272E‐12 1.257E‐11Test Result Core #2 9.622E‐12 ‐ 7.614E‐12 1.329E‐11Test Result Core #3 8.643E‐12 ‐ 6.808E‐12 1.363E‐11
Mean (m2/sec) 9.576E‐12 ‐ 7.231E‐12 1.316E‐11
Mean (in2/year) 0.47 ‐ 0.35 0.64
σ (in2/year) 0.04 ‐ 0.02 0.02
CV 0.08 ‐ 0.05 0.03
Mix
Structural
Concrete
Class 3300
Standard
Structural
Concrete
Class 4000
Standard
Deck
Concrete
Class
HPC4000
(Slag)
Deck
Concrete
Class
HPC4000
(Fly Ash)
Test Result Core #1 1.578E‐11 ‐ 1.229E‐11 ‐Test Result Core #2 1.189E‐11 ‐ 1.172E‐11 ‐Test Result Core #3 1.628E‐11 ‐ 1.498E‐11 ‐
Mean (m2/sec) 1.465E‐11 ‐ 1.300E‐11 ‐Mean (in
2/year) 0.72 ‐ 0.64 ‐σ (in
2/year) 0.10 ‐ 0.07 ‐CV 0.13 ‐ 0.11 ‐
Pre‐Construction
Hooker Creek
Pre‐Construction
Knife River

Nordtest Method NT Build 492 Results
Mix
Structural
Concrete
Class 3300
Standard
Structural
Concrete
Class 4000
Standard
Deck
Concrete
Class
HPC4000
(Slag)
Deck
Concrete
Class
HPC4000
(Fly Ash)
Structural
Concrete
Class 8280
(Precast)
Test Result Core #1 ‐ 1.270E‐11 1.150E‐11 ‐ 7.494E‐12Test Result Core #2 ‐ 1.230E‐11 1.357E‐11 ‐ 7.664E‐12Test Result Core #3 ‐ 1.250E‐11 1.288E‐11 ‐ 7.692E‐12Test Result Core #4 ‐ ‐ 1.198E‐11 ‐ 1.117E‐11Test Result Core #5 ‐ ‐ 1.087E‐11 ‐ 9.151E‐12Test Result Core #6 ‐ ‐ 1.231E‐11 ‐ 1.187E‐11Test Result Core #7 ‐ ‐ ‐ ‐ 9.576E‐12Test Result Core #8 ‐ ‐ ‐ ‐ 9.660E‐12Test Result Core #9 ‐ ‐ ‐ ‐ 1.047E‐11Test Result Core #10 ‐ ‐ ‐ ‐ 9.185E‐12Test Result Core #11 ‐ ‐ ‐ ‐ 8.839E‐12Test Result Core #12 ‐ ‐ ‐ ‐ 8.783E‐12Test Result Core #13 ‐ ‐ ‐ ‐ 9.826E‐12Test Result Core #14 ‐ ‐ ‐ ‐ 1.033E‐11Test Result Core #15 ‐ ‐ ‐ ‐ 9.320E‐12Test Result Core #16 ‐ ‐ ‐ ‐ 8.578E‐12Test Result Core #17 ‐ ‐ ‐ ‐ 1.154E‐11Test Result Core #18 ‐ ‐ ‐ ‐ 1.143E‐11Test Result Core #19 ‐ ‐ ‐ ‐ 8.902E‐12Test Result Core #20 ‐ ‐ ‐ ‐ 1.054E‐11Test Result Core #21 ‐ ‐ ‐ ‐ 1.008E‐11Test Result Core #22 ‐ ‐ ‐ ‐ 8.190E‐12Test Result Core #23 ‐ ‐ ‐ ‐ 7.976E‐12Test Result Core #24 ‐ ‐ ‐ ‐ 7.643E‐12
Mean (m2/sec) ‐ 1.250E‐11 1.219E‐11 ‐ 9.413E‐12
Mean (in2/year) ‐ 0.61 0.60 ‐ 0.46
σ (in2/year) ‐ 0.01 0.04 ‐ 0.06
CV ‐ 0.01 0.07 ‐ 0.14
Mix
Structural
Concrete
Class 3300
Standard
Structural
Concrete
Class 4000
Standard
Deck
Concrete
Class
HPC4000
(Slag)
Deck
Concrete
Class
HPC4000
(Fly Ash)
Structural
Concrete
Class 8280
(Precast)
Mean (m2/sec) 1.211E‐11 1.250E‐11 1.115E‐11 1.316E‐11 9.413E‐12Mean (in
2/year) 0.59 0.61 0.55 0.64 0.46
σ (in2/year) 0.14 0.01 0.12 0.02 0.06
CV 0.24 0.01 0.22 0.03 0.14
Summary
Construction Quality Assurance
Knife River

Nordtest Method NT Build 492 Results
Mix Design
Mean
Migration Coefficient (in2/year)
Standard of Deviation
(in2/year)
CV
Hooker Creek
Deck Concrete
Class HPC4000
(Slag)
0.35 0.02 5%
Knife River
Structural Concrete
Class 8280
(Precast)
0.46 0.06 14%
Hooker Creek
Structural Concrete
Class 3300
Standard
0.47 0.04 8%
Knife River
Deck Concrete
Class HPC4000
(Slag)
0.60 0.04 7%
Knife River
Structural Concrete
Class 4000
Standard
0.61 0.01 1%
Knife River
Deck Concrete
Class HPC4000
(Slag)
0.64 0.07 11%
Hooker Creek
Deck Concrete
Class HPC4000
(Fly Ash)
0.64 0.02 3%
Knife River
Structural Concrete
Class 3300
Standard
0.72 0.10 13%
NT Build 492 Test Results By Mix Design

0.00
0.10
0.20
0.30
0.40
0.50
0.60
0.70
0.80
1
Mig
rati
on
Co
eff
icie
nt
(in
2/y
ea
r)
NT Build 492 Test Results by Concrete Product(Mean Columns with ± 1 Standard Deviation Error Bars)
Structural
Concrete
Class 3300…
Structural
Concrete
Class 4000…
Deck
Concrete
Class HPC4000…
Deck
Concrete
Class HPC4000…
Structural
Concrete
Class 8280…

0.00
0.10
0.20
0.30
0.40
0.50
0.60
0.70
0.80
0.90
1
Mig
rati
on
Co
eff
icie
nt
(in
2/y
ea
r)
NT Build 492 Test Results by Mix Design(Mean Columns with ± Standard Deviation Error Bars)
Hooker Creek
Deck Concrete
Class HPC4000
(Slag)
Knife River
Structural Concrete
Class 8280
(Precast)
Hooker Creek
Structural Concrete
Class 3300
Standard
Knife River
Deck Concrete
Class HPC4000
(Slag)
Knife River
Structural Concrete
Class 4000
Standard
Knife River
Deck Concrete
Class HPC4000
(Slag)
Hooker Creek
Deck Concrete
Class HPC4000
(Fly Ash)
Knife River
Structural Concrete
Class 3300
Standard


lb C‐1 lb %lb C‐2 lb %lb C‐3 lb %lb F‐1 lb %
lb F‐2 lb %
F‐3 lb %lb
lblblb A‐1 ozlb A‐2 oz
A‐3 oz lblb A‐4 oz
A‐5 oz inF A‐6 oz %F lb
lblblb Pot Calibration
C‐1 ‐ ( / 1+ ) = lbC‐2 ‐ ( / 1+ ) = lbC‐3 ‐ ( / 1+ ) = lbF‐1 ‐ ( / 1+ ) = lbF‐2 ‐ ( / 1+ ) = lbF‐3 ‐ ( / 1+ ) = lb
= lb
= lb
= lb
X
CONCRETE MIX / FIELD DATA Yield and w/cm form
CONTRACT NUMBERPROJECT NAME (SECTION)
NT-Build Class 3300 1"
Cementitious
Tim Whitehall
28 DAYS3300
1
PROJECT MANAGERC0NTRACTOR
Aggregates
StructuralSPECIFIED STRENGTHData Batched Time Batched
11/24/15 7:49
BID ITEM NUMBER
NT-3
07‐047‐4 1"‐No.4 0.501,705
Agg. Free moisture
BATCH SIZE
Yd³
Psi
CONCRETE FOR USE IN (LOCATION OR PLACEMENT)
CONCRETE SUPPLIER
HCCSUBMITTED BY
401Cement
172Fly Ash
Slag1.87
Solids in color
ColorColor name
Add water
Batch water 241Water from Integral color
573
Silica Fume
Total Cementitious
Add water 3046Total Aggregate mass
07‐047‐4 PCC Fine Agg. 1,341
Total Batch Mass 3864
Total mix water 244 Pozzolith 80 173
AdmixuresAE‐90 5
8.04Pot mass
Concrete Temp. 63
DensityConcrete + Pot 42.95
Total Admixtures mass
5"
Air 5.91
139.6=0.25015248
Slump
Ambient Temp. 32
07‐047‐4 PCC Fine Agg.
Batch mass
Concrete Mass
Water Cementitious Ratio
Yield
Cementitious Contentlb/ft³ x 27
8170507‐047‐4 1"‐No.4
Total cementitiousw/cm Ratio
lb/ft³
‐1+Free moisture factor
Batch mass(
= yd³
Free moisture factor = % free moisture divided by 100 (5.5 = 0.055)
1.03
/34.91Yield
=38643768
Total Cementitious
A = Aggregate free water
=Total Batch Mass
lb/yd³
=
=
= Agg. Free Moisture
0.50
1.03
= 573= 556
Total water in mix )1705
25
Verification
42300
1341
33
1
Date
1.871341
=
Card No.
244A. Aggregate Free Moisture Total
0.49
Company Name
HCCSignature
C. Total Admixtures AddedB. Water Added at Plant & Jobsite
W/cm Ratio
Tim WhitehallCertified Technician (print)
Quality Control
Total Cementitious
Total Water 278573

Concrele Mix Evaluator
1 pound ofwater= 2.16 gal/yd210.3 mL- 1 gal / cubic Yd
0.463 Lb- I gal / cubic Yd
Adiusted Batch WtsOnly aggregates and watet are adjusted tot Relative Y¡eld
SSDDesign
Wts
Lab Date.
Lab Series.
Lab Mix #.
11117t2015-rtFSCS
Lab Batch Size rI- 1.5
Admixture: oz I cv,rl Ozlyard Batch (ml)
AEA 90 2.00 12.98 21.336.00 38.94
Class ¡1000 HPC Deck
266'tzlF5CSLab Trial
Design Strength (f'c) 4000 psi
Target Strength (f'",) 4500 psi
Design Slump Rang6.5" +l- 2.5" i
Design Air Range 6.0 PS 1466 63.98
Cementitious Materials: Lbs Batch wts Lab Batch
Portland Cement Type l-ll 429 429 23.83Dura Slag 195 195 10.83Silica Fume
Source
BASF
CalPortland
Ash Grove
25 25 1.39 Plastic Propert¡es Batch Start Time: 5:21 PM
fl)Testing Stage: (tD (il1)Aqgregates: 649 Total Moist Abs. 649 36.06 Sample Time: 5:30 PM
Lone Pine Pit 1 600 2,82o/" 1.500/" 1621 90.06 Lab Ware(+/-)Lb -0.46
Lone Pine Pit 200 4,OOo/o 205 11.37 Slump: 4.25
3/4" - #4 Round
3/8" Pea Rock 1.700/o
Plastic Air (%) 4.9
Plastic Densitv: 146.38Sand Lone Pine P¡t 1 070 8.95% 3.00% 1134 62.97 Concrete Temp: 61
NOVAMESH 950 Fibermesh 5 5 0.28 Ambient Temp: 52Design Water
in admixlure not
260 171 9.48 I Time of set (Hrs)
Total weight 3779
Adj waler
3779 209.94*''ïZ{t
Desiqn Volume (Ft3) 27_OO
Lab YieldRelative Yield 0.9540
Desiqn Dens¡tv 140.14 25.76Desiqn Air (o/o) 1.82Design Water/Cement
." 6,qq0.401 Total Trlm Water lbs/ vci €.3
89.4
-"" --4clqel_Wl9i4ie --9.3€"8--.
Aggregates:3/4'- #4 Round _'
16003/8" Pea Rock 200
1 070SandAdiusted Water:
Design Water 260Water / Cement¡tious Ratio 0.401
CENTRAL OREGON REDI.MIX Concrete Mix Evaluator

Concrete Mix Evaluator
1 pound of water = 2.16 gallyd210.3 mL- 1 gal / cubic Yd
0.463 Lb- 1 gal / cubic Yd
Ad¡usted Batch WtsOnly aggrcgates and water are adjusted fot Relat¡ve Yield
ssDDesign
Wts
1.5
Admixture: Ozlyard
AEA 90
oz / cvû
1.00 5.74 9.43Batch
POLY 997 6.00 34.44 56.58
Class 3300 Structural2656KNG8M7
Lab Trial
Design Strength (f'c) 4000 psi
Target Strength (f'c) 4928 psi
Design Slump Range 4" +/-1" in"
Design A¡r Range 6.0%
Source Lbs Batch wts Lab BatchCêmentitious Materials:
Portland Cement Tvoe l-ll CalPortland 402 402 22.33Dura Slaq Ash Grove 172 9.56172
Plastic Properties Batch Start Time: 5:55 PM
Test¡ng Stage: (t) (tD 0il)Aoorecates: 574 Tolal Moist Abs. 574 31.89 Sample Time: 6:02 PM
3/4" - #4 Round Lone Pine Pit 1 550 2.82/o 87.25 Lab Wate(+/-)Lb 0.733/8" Pea Rock 200
1.50o/o
1.70%
1 570
205 11.37 Slump: 4.504.O0/o
Plastic Air (%) 5.5
Lone Pine Pit
Plastic Dens¡ty: 143.13Sand Lone Pine Pit 1147 8.95% 3.00% 1257 69.85 Concrete Temp: 60
Ambient Temp: 52
267 Adi water 95.7 171 9.52 I Time of Set (Hrs)
¿UC.6I- "1718377821'.0;a-
F Time of Set (hrs)Lab Yield
Relative Yield139.91 Yield lcu fward)
1.471
26.ß0.9809
not calculated
Water
Volume
A¡r 6.00 calculared Air (%)
Desion Water/Cement Total Trim Water lbs/ yd0.4653.8413.1-õ:¿Bå*"
Aelqd w¿ç leLs
Lab Date.
Lab Series.
Lab Mix #.
11117/2015
Tz-Lab Batch Size (Ft3)..
___ Aggregates:3/4r-#M
3/8" Pea Rock 200
1187SandAdiusted Water:
Desiqn Water 267Water / Cementitious Ratio 0.465
CENTRAL OREGON REDI-MIX Concrete Mix Evaluator

OREGON DEPARTMENT OF TRANSPORTATION
MATERIALS LABORATORY
800 AIRPORT ROAD SESALEM, OR 97301-4798
503.986.3000Fax: 503.986.3096
Contract No.: C14900 EA: CON03889
STRUCTURAL CONCRETE MIX DESIGN REVIEW
Lab No. 16-CMD129
Project Name: OR380: Ochoco Creek Bridge Replacement
Highway: Paulina Highway
County: Crook
Contractor: Carter & Company, Inc.
Project PM: Robert Townsend
Amendment 1 Date:
Amendment 2 Date:
Mix Design by: Kevin McCaul Contractor Mix Design No.: 6TZ1F5CS
Structure Services Engineer
Date
C:Project Manager; Austin JohnsonCarter & Company, Inc.
F.A. No STP-S380(002)
Amendment 3 Date:
ODOT PM: Robert Townsend
Submitted By: Stuart Cobine
Material Source: Knife River Tumalo/Redmond
Specified Compressive Strength: 4000
Proposed Use: Bridge Deck
CCT # 44396
Mix Type: Structural HPC
Aggregate Max Nom: 1"
Cement Manufacturer
Cal Portland
Cement Source
Ssangyong
Type
I/II
(lb/yd3)
480
SCM Manufacturer
Ash Grove
Modifer Source
Dura Slag
Type
GGBF Slag 205
Coarse Agg Source
07-051-4
GSSD
2.63
Abs
1.4%
DRUW
103.5
Coarse Agg Size
1.5" - 3/4" 204
07-051-4 2.62 1.6% 104.2 3/4" - #4 1552
07-051-4 2.62 2.1% 101.3 3/8" - #8 100
Fine Agg Source
07-051-4
GSSD
2.57
Abs
3.0%
FM
2.78
Fine Agg Size
#4 - 0 1038
Water Source Well 250
5.5
Air Content (%)
5.5
Density (lb/ft3)
142.2
W/C Ratio
0.37
Admixture Brand/Product
BASF MasterAir AE 90
Type
Air-Entraining
Dosage
20.6
BASF MasterGlenium 1466 WRA 41.1
BASF MasterSet Delvo Retarding 41.1
ABC Polymer MacroPro Fibers 5
9/6/2016
Average Trial Batch Compressive Strength: 6990 psi @ 28 days
RCPT (AASHTO T277/ASTM C1202): 999 Coulombs @ 90 days Shrinkage (Length Change) test ASTM C157:-0.042% @ 28 days-0.049% @ 56 days
Based on the information submitted for review, this mix design Does Comply with specifications. This report does not supersede, delete or amend the Contract Documents or relieve the Contractor of the responsibility to provide concrete within specification.
Exposure: Severe
Scott Nelson Eric Burns Stuart Cobine
Region QAC
Scott D. Nelson, P.E.
Slump (Inches)
oz/yd3
oz/yd3
oz/yd3
lbs/yd3

OREGON DEPARTMENT OF TRANSPORTATION
MATERIALS LABORATORY
800 AIRPORT ROAD SESALEM, OR 97301-4798
503.986.3000Fax: 503.986.3096
Contract No.: C14900 EA: CON03889
STRUCTURAL CONCRETE MIX DESIGN REVIEW
Lab No. 16-CMD097
Project Name: OR380: Ochoco Creek Bridge Replacement
Highway: Paulina Highway
County: Crook
Contractor: Carter & Company, Inc.
Project PM: Robert Townsend
Amendment 1 Date:
Amendment 2 Date:
Mix Design by: Kevin McCaul Contractor Mix Design No.: 26S6KNG8M7
Structure Services Engineer
Date
C:Project Manager; Austin JohnsonCarter & Company, Inc.
F.A. No STP-S380(002)
Amendment 3 Date:
ODOT PM: Robert Townsend
Submitted By: Stuart Cobine
Material Source: Knife River Tumalo/Redmond
Date Received: 7/12/2016
Date Reported: 7/19/2016
Specified Strength:4000
Proposed Use: Foundation/Misc
CCT # 44396
Mix Type: General Structural
MaxNom: 3/4"
Cement Manufacturer
Cal Portland
Cement Source
Ssangyong
Cement Type
I/II
(lb/yd3)
402
Modifier Manufacturer
Ash Grove
Modifer Source
Dura Slag
Modifier Type
GGBF Slag 172
Coarse Agg Source
07-051-4
GSSD
2.62
Abs
1.5%
FM DRUW
104.1
Coarse Agg Size
3/4" - #4 R 1550
07-051-4 2.622 1.7% 101.3 3/8" - #8 R 200
Fine Agg Source
07-051-4
GSSD
2.569
Abs
3.0%
FM
2.78
Fine Agg Size
#4 - 0 1192
Water Source
Well 260
4
Air Content (%)
6
Density (lb/ft3)
140.1
W/C Ratio
0.46
Admixture Brand
BASF MasterAir AE 90
Admixture
Air-Entraining
Dosage (oz/yd3)
5.2
BASF MasterPolyheed 997 WRA 34.4
BASF MasterSet Delvo Retarding 28.7
1
2
3
1
2
1
2
3
4
1
2
3
5
6
7
8
[email protected] [email protected]
7/19/2016
Average Compressive Strength: 4593 psi @ 28 days
Based on the information submitted for review, this mix design Does Comply with specifications. This report does not supersede, delete or amend the Contract Documents or relieve the Contractor of the responsibility to provide concrete within specification.
Exposure: Severe
Scott Nelson Eric Burns Stuart Cobine
Region QAC
Scott D. Nelson, P.E.
Slump (Inches)


Appendix D:
Service Life Design Figures

0
1
2
3
4
0.00 0.10 0.20 0.30 0.40 0.50 0.60 0.70 0.80 0.90 1.00
Ch
lori
de
Su
rfa
ce C
on
cen
tra
tio
n (
%ce
m.)
Migration Coefficient at 28 days Dcrm (in2/year)
Temperature: mean = 49.1F, std = 12.1F
Exposure Zones: Splash/Deicing Salts
Concrete Type: OPC + >20%FA
1in cover 1.5in Cover 2in cover 2.5in cover 3in cover 3.5in cover 4in cover
Calculations as per fib Bulletin 34 - fully probabilistic design
Service Life = 100 years
Beta = 1.3, Probability of failure = 10%
Critical chloride concentration: black bars - 0.6%cem.
Initial chloride concentration : 0.1%cem.
SERVICE LIFE DESIGN - GRAPHICAL SOLUTION

0
0.5
1
1.5
2
2.5
3
3.5
4
0.00 0.10 0.20 0.30 0.40 0.50 0.60 0.70 0.80 0.90 1.00
Ch
lori
de
Su
rfa
ce C
on
cen
tra
tio
n (
%ce
m.)
Migration Coefficient at 28 days Dcrm (in2/year)
1in cover 1.5in cover 2in cover 2.5in cover 3in cover 3.5 4
Calculations as per fib Bulletin 34 - fully probabilistic design
Service Life = 100 years
Beta = 1.3, Probability of failure=10%
Critical chloride concentration: black bars - 0.6%cem.
Initial chloride concentration : 0.1%cem.
SERVICE LIFE DESIGN - GRAPHICAL SOLUTION
Temperature: mean = 49.1F°, std = 12.1F°
Exposure Zones: Splash/Deicing Salts
Concrete Type: OPC+30% GGBS
Age factor: mean = 0.40, std = 0.15

Appendix E: Chloride Concentration Test Results
Banfield Interchange BR08588A
Sample # Cf, % Cmax,
% Dc,
in^2/yr Overlay Parent
0-0.5"
0.5"-1"
1"-1.5"
1.5"-2"
2"-2.5"
2.5"-3"
3"-3.5"
3.5"-4"
1 0.010 0.004 0.014 0.033 0.016 n/a n/a n/a n/a n/a
2 0.012 0.004 0.021 0.032 0.025 0.017 n/a n/a n/a n/a
3 0.013 0.005 0.012 0.026 0.017 0.011 n/a n/a n/a n/a
4 0.005 0.002 0.003 0.028 0.026 0.026 n/a n/a n/a n/a
Banfield Interchange BR08588B
Sample # Cf, % Cmax,
% Dc,
in^2/yr Overlay Parent
0-0.5"
0.5"-1"
1"-1.5"
1.5"-2"
2"-2.5"
2.5"-3"
3"-3.5"
3.5"-4"
1 0.006 0.003 0.015 0.017 0.018 0.020 n/a n/a n/a n/a
2 0.007 0.009 0.024 0.020 0.019 n/a n/a n/a n/a n/a
3 0.012 0.001 0.019 0.018 0.020 n/a n/a n/a n/a n/a
4 0.008 0.001 0.004 0.010 0.017 n/a n/a n/a n/a n/a
Banfield Interchange BR08588C
Sample # Cf, % Cmax,
% Dc,
in^2/yr
Overlay Parent
0-0.5"
0.5"-1"
1"-1.5"
1.5"-2"
2"-2.5"
2.5"-3"
3"-3.5"
3.5"-4"
1 0.020 0.013 0.003 0.015 0.018 0.014 n/a n/a n/a n/a
2 0.018 0.013 0.013 0.021 0.018 0.017 n/a n/a n/a n/a
3 0.008 0.003 0.003 0.029 0.023 0.023 n/a n/a n/a n/a
4 0.031 0.019 0.007 0.023 0.018 0.018 n/a n/a n/a n/a

Interstate Bridge NB BR01377A
Sample # Cf, % Cmax,
% Dc,
in^2/yr 0-
0.5" 0.5"-1"
1"-1.5"
1.5"-2"
2"-2.5"
2.5"-3"
3"-3.5"
3.5"-4"
1 Overlay
0.003 0.026 0.002 n/a n/a n/a n/a n/a 0.082 0.0095
1 Parent n/a n/a n/a 0.002 0.001 n/a n/a n/a n/a n/a 2
Overlay 0.019 0.003 0.003 n/a n/a n/a n/a n/a 0.035 0.005
2 Parent n/a n/a n/a 0.002 0.002 0.002 n/a n/a n/a n/a 3
Overlay 0.033 0.003 0.001 0.001 0.001 n/a n/a n/a 0.0022 0.0049
4 Overlay
0.021 0.002 0.003 0.002 n/a n/a n/a n/a 0.050 0.0026
4 Parent n/a n/a n/a n/a 0.004 0.004 n/a n/a n/a n/a 5
Overlay 0.025 n/a n/a n/a n/a n/a n/a n/a n/a n/a
5 Parent n/a 0.016* 0.028 0.024 0.013 n/a n/a n/a 0.098 0.0132 6
Overlay 0.008 0.012 0.016 n/a n/a n/a n/a n/a 0.054 0.0125
6 Parent n/a n/a n/a 0.014 0.011 0.005 n/a n/a 0.175 0.0188 7
Overlay 0.066 0.024 n/a n/a n/a n/a n/a n/a n/a n/a
7 Parent n/a n/a 0.034* 0.047 0.023 n/a n/a n/a 0.445 0.02 8
Overlay 0.012 0.007 n/a n/a n/a n/a n/a n/a n/a n/a
8 Parent n/a n/a 0.020* 0.021 0.017 n/a n/a n/a 0.260 0.0185 9
Overlay 0.026 0.004 0.002 n/a n/a n/a n/a n/a 0.0096 0.0176
9 Parent n/a n/a n/a 0.021 0.018 0.019 n/a n/a n/a n/a 10
Overlay 0.024 0.032 0.033 n/a n/a n/a n/a n/a 0.050 0.0176
10 Parent n/a n/a n/a 0.021 0.015 n/a n/a n/a n/a n/a 11
Overlay 0.042 0.003 0.005 n/a n/a n/a n/a n/a 0.034 0.0044
11 Parent n/a n/a n/a 0.011 n/a n/a n/a n/a n/a n/a 12
Overlay 0.021 0.004 0.006 n/a n/a n/a n/a n/a 0.038 0.0048
12 Parent n/a n/a n/a 0.013 0.008 0.006 n/a n/a n/a n/a
Average, Latex Modified Concrete Overlay 0.041 0.0077
Average, Parent Material (1960 Deck, Samples 5-8) 0.245 0.0176
*Contains both overlay and parent material, not used in numerical analysis

Mill Creek (I5) NB BR20034
Sample # Cf, % Cmax,
% Dc,
in^2/yr 0-
0.5" 0.5"-1"
1"-1.5"
1.5"-2"
2"-2.5"
2.5"-3"
3"-3.5"
3.5"-4"
1 0.042 0.012 0.012 0.011 0.013 n/a n/a n/a 0.100 0.0138
2 0.011 0.010 0.006 0.004 0.004 n/a n/a n/a 0.095 0.0122
3 0.028 0.010 0.015 0.017 0.010 n/a n/a n/a 0.062 0.0190
4 0.035 0.01 0.007 0.007 0.007 n/a n/a n/a 0.067 0.0168
Average 0.0810 0.0155
Yamhill River (Dayton) BR08003
Sample # Cf, % Cmax,
% Dc,
in^2/yr 0-
0.5" 0.5"-1"
1"-1.5"
1.5"-2"
2"-2.5"
2.5"-3"
3"-3.5"
3.5"-4"
1 0.074 0.056 0.032 0.020 0.021 n/a n/a n/a 0.103 0.0155
2 0.071 0.060 0.029 0.018 0.011 n/a n/a n/a 0.117 0.0110
Average 0.0110 0.0133
Hwy 39 Over Hwy 150 BR08013
Sample # Cf, % Cmax,
% Dc,
in^2/yr 0-
0.5" 0.5"-1"
1"-1.5"
1.5"-2"
2"-2.5"
2.5"-3"
3"-3.5"
3.5"-4"
1 0.010 0.008 0.007 0.005 0.003 n/a n/a n/a n/a n/a
2 0.009 0.012 0.003 0.009 0.007 n/a n/a n/a n/a n/a
Yamhill River Overflow, Hwy 39 BR08492
Sample # Cf, % Cmax,
% Dc,
in^2/yr
0-0.5"
0.5"-1"
1"-1.5"
1.5"-2"
2"-2.5"
2.5"-3"
3"-3.5"
3.5"-4"
1 0.058 0.035 0.016 0.009 0.006 n/a n/a n/a 0.065 0.0127
2 0.035 0.018 0.013 0.006 0.002 n/a n/a n/a 0.041 0.0122
3 0.050 0.022 0.012 0.005 0.001 n/a n/a n/a 0.045 0.0112
4 0.049 0.032 0.015 0.009 0.003 n/a n/a n/a 0.061 0.0121
Average 0.053 0.0121

South Yamhill River (Whiteson) BR18675
Sample # Cf, % Cmax,
% Dc,
in^2/yr 0-
0.5" 0.5"-1"
1"-1.5"
1.5"-2"
2"-2.5"
2.5"-3"
3"-3.5"
3.5"-4"
1 0.169 0.029 0.007 0.003 0.001 n/a n/a n/a 0.109 0.0163
2 0.027 0.006 0.003 0.003 0.000 n/a n/a n/a 0.036 0.0106
3 0.013 0.006 0.001 0.001 0.001 n/a n/a n/a 0.035 0.0109
4 0.008 0.007 0.000 0.002 0.003 n/a n/a n/a 0.036 0.0118
Average 0.054 0.0124
Spencer Creek BR20198
Sample # Cf, % Cmax,
% Dc,
in^2/yr 0-
0.5" 0.5"-1"
1"-1.5"
1.5"-2"
2"-2.5"
2.5"-3"
3"-3.5"
3.5"-4"
1 0.217 0.034 0.011 0.007 0.004 n/a n/a n/a 0.345 0.0130
2 0.248 0.072 0.016 0.008 0.004 n/a n/a n/a 0.892 0.0116
Average 0.619 0.0123
Bob Creek BR19086
Sample # Cf, % Cmax,
% Dc,
in^2/yr 0-
0.5" 0.5"-1"
1"-1.5"
1.5"-2"
2"-2.5"
2.5"-3"
3"-3.5"
3.5"-4"
1 0.315 0.021 0.011 0.010 0.010 n/a n/a n/a 0.146 0.0106
2 0.368 0.027 0.006 0.002 0.000 n/a n/a n/a 0.129 0.0138
Average 0.138 0.0122

Youngs Bay BR08306
Sample # Cf, % Cmax,
% Dc,
in^2/yr 0-
0.5" 0.5"-1"
1"-1.5"
1.5"-2"
2"-2.5"
2.5"-3"
3"-3.5"
3.5"-4"
1 0.052 0.023 0.008 0.003 0.004 n/a n/a n/a 0.066 0.0059
2 0.125 0.059 0.014 0.003 0.002 n/a n/a n/a 0.138 0.0074
3 0.052 0.024 0.012 0.005 0.003 n/a n/a n/a 0.061 0.0082
4 0.154 0.045 0.013 0.003 0.002 n/a n/a n/a 0.122 0.0060
Average 0.097 0.00688
Willamette River (Barnard) BR07894
Sample # Cf, % Cmax,
% Dc,
in^2/yr 0-
0.5" 0.5"-1"
1"-1.5"
1.5"-2"
2"-2.5"
2.5"-3"
3"-3.5"
3.5"-4"
1 0.152 0.066 0.041 0.02 0.009 n/a n/a n/a 0.268 0.0154
2 0.173 0.074 0.029 0.011 0.007 n/a n/a n/a 0.287 0.0154
3 0.138 0.037 0.013 0.010 0.005 n/a n/a n/a 0.115 0.0198
4 0.256 0.167 0.067 0.026 0.008 n/a n/a n/a 0.344 0.0358
Average 0.254 0.0216
Salt Creek BR2071A
Sample # Cf, % Cmax,
% Dc,
in^2/yr
0-0.5"
0.5"-1"
1"-1.5"
1.5"-2"
2"-2.5"
2.5"-3"
3"-3.5"
3.5"-4"
1 0.192 0.108 0.063 0.029 0.011 n/a n/a n/a 0.229 0.0123
2 0.187 0.134 0.066 0.043 0.023 n/a n/a n/a 0.232 0.0172
3 0.184 0.143 0.102 0.047 0.020 n/a n/a n/a 0.243 0.0211
4 0.243 0.113 0.042 0.028 0.010 n/a n/a n/a 0.248 0.0101
5 0.220 0.187 0.088 0.052 0.014 n/a n/a n/a 0.276 0.219
6 0.103 0.086 0.056 0.041 0.021 n/a n/a n/a 0.145 0.0225
Average 0.229 0.0175

Hwy 1 Over Hwy 273 SB BR09259
Sample # Cf, % Cmax,
% Dc,
in^2/yr 0-
0.5" 0.5"-1"
1"-1.5"
1.5"-2"
2"-2.5"
2.5"-3"
3"-3.5"
3.5"-4"
1 Overlay
0.416 0.200 0.122 0.088* n/a n/a n/a n/a 0.475 0.0129
1 Parent n/a n/a n/a n/a 0.088 0.076 0.048 0.033 0.533 0.0362 3
Overlay 0.858 0.368 0.129 0.104* n/a n/a n/a n/a 0.798 0.0114
3 Parent n/a n/a n/a n/a 0.085 0.077 0.049 0.047 0.528 0.0325 4
Overlay 0.767 0.704 0.211 0.090* n/a n/a n/a n/a 1.250 0.0143
4 Parent n/a n/a n/a n/a 0.086 0.056 n/a n/a 0.378 0.0352
Average, Overlay 0.841 0.0129
Average, Parent Material 0.478 0.0346
*Sample contains both overlay and parent material, not used in numerical analysis
Hwy 1 Over Hwy 273 NB BR09259A
Sample # Cf, % Cmax,
% Dc,
in^2/yr 0-
0.5" 0.5"-1"
1"-1.5"
1.5"-2"
2"-2.5"
2.5"-3"
3"-3.5"
3.5"-4"
1 Parent n/a n/a n/a 0.320 0.157 0.105 0.066 0.058 1.030 0.0276 2
Overlay 0.793 0.168 0.073 n/a n/a n/a n/a n/a 0.364 0.0124
2 Parent n/a n/a n/a 0.101 0.050 0.059 n/a n/a 0.368 0.0262 3
Overlay 0.767 0.109 0.109 0.046 n/a n/a n/a n/a 0.256 0.0198
Average, Overlay 0.310 0.0161
Average, Parent Material 0.699 0.0269
Hwy 1 Over Crowson Rd. NB BR08746N
Sample # Cf, % Cmax,
% Dc,
in^2/yr 0-
0.5" 0.5"-1"
1"-1.5"
1.5"-2"
2"-2.5"
2.5"-3"
3"-3.5"
3.5"-4"
1 0.319 0.513 0.058 0.007 0.007 n/a n/a n/a 1.020 0.0304
2 0.271 0.559 0.082 0.024 0.005 n/a n/a n/a 1.430 0.0209
3 0.356 0.292 0.018 0.006 0.007 n/a n/a n/a 0.716 0.0205
Average 1.055 0.0239

Hwy 1 Over Crowson Rd. SB BR08746S
Sample # Cf, % Cmax,
% Dc,
in^2/yr 0-
0.5" 0.5"-1"
1"-1.5"
1.5"-2"
2"-2.5"
2.5"-3"
3"-3.5"
3.5"-4"
1 0.434 0.029 0.002 0.005 0.008 n/a n/a n/a 0.164 0.0108
2 0.377 0.034 0.005 0.005 0.009 n/a n/a n/a 0.245 0.0092
3 0.442 0.065 0.008 0.005 0.004 n/a n/a n/a 0.254 0.0152
4 0.338 0.044 0.007 0.016 0.005 n/a n/a n/a 0.244 0.0112
Average, Overlay 0.227 0.0116
Link River, Hwy 4 NB Conn BR08347A
Sample # Cf, % Cmax,
% Dc,
in^2/yr 0-
0.5" 0.5"-1"
1"-1.5"
1.5"-2"
2"-2.5"
2.5"-3"
3"-3.5"
3.5"-4"
1 0.160 0.139 0.079 0.062 0.036 n/a n/a n/a 0.242 0.0194
3 0.168 0.128 0.100 0.072 0.044 n/a n/a n/a 0.225 0.0246
4 0.154 0.114 0.048 0.047 0.023 n/a n/a n/a 0.182 0.0198
Average 0.216 0.0213

Appendix F: Core Sample Locations
Banfield Interchange BR08588A
Banfield Interchange BR08588B

Banfield Interchange BR08588C
In terstate Bridge NB BR01377A

Mill C reek (I5) NB BR20034
Yamhill River (Dayton) BR08003

Hwy 39 Over Hwy 150 BR08013
Yamhill River Overflow, Hwy 39 BR08492

South Yamhill River (Whiteson) BR18675
Spencer Creek BR20198

Bob Creek BR19086
Youngs Bay BR08306

Willamette River (Barnard) BR07894
Salt Creek BR2071A

Hwy 1 Over Hwy 273 SB BR09259
Hwy 1 Over Hwy 273 NB BR09259A

Hwy 1 Over Crowson Rd. NB BR08746N
Hwy 1 Over Crowson Rd. SB BR08746S

Link River, Hwy 4 NB Conn BR08347A

References
1. AASHTO. AASHTO T260-97(2016) Standard Method of Test for Sampling andTesting for Chloride Ion in Concrete and Concrete Raw Materials. Washington,DC: AASHTO, 2016.
2. ASTM International. ASTM C1152/C1152M-04(2012)e1 Standard Test Methodfor Acid-Soluble Chloride in Mortar and Concrete. West Conshohocken, PA:ASTM International, 2012.
3. Goff, Mike. Multiple Pictures. Digital image. Bridgehunter.com. N.p., n.d. Web.28 Apr. 2017. <www.bridgehunter.com>.
4. Nordtest. NT Build 208 Concrete, hardened: Chloride Content By VolhardTitration. Taastrupl, Denmark: Nordtest, 1996.
5. Trejo, David and Pillai, Radhakrishna G. “Accelerated Chloride ThresholdTesting-Part II: Corrosion-Resistant Reinforcement”. Materials Journal, 1 Jan.2004, pp 57-64.

Acknowledgments
A Special Thanks To:
• Patricia Bush and Matthew DeMarco, FHWA• Mike Bartholomew and Amir Arab, CH2M Hill, Inc.• Anne-Marie Langlois, COWI• Siva Venugopalan and Jesse Swenk, Siva Corrosion Services, Inc.• Rick Garrick, Jeff Gates and American Concrete Company, Inc.• Bruce Johnson, ODOT State Bridge Engineer• Ray Bottenberg, Bert Hartman, Craig Shike, and Scott Liesinger, ODOT Bridge
Engineering Managers• Rebecca Burrow, David Dobson, James Garrard Jr., Zach Beget, Paul Strauser,
and Matthew Stucker, Bridge Preservation and Regional Bridge DesignEngineering
• Kevin Brophy, Jason Cieslak, Ken Scott and the ODOT Materials LaboratoryCrew
• Mike Gehring, Jeremy Kappers and the Milwaukie Bridge Crew• Marc Gross and the Interstate Bridge Crew• Dan McFadden, Jared Lyon and the Seaside Bridge Crew• Del Webb, Hank Morrical, and the Salem Bridge Crew• Eric Alexander, David Lihou, Dave Schaumburg, the Ona Beach and Eugene
Bridge Crews• Bryan Mast, Bill Long, Scott Shands, the Grants Pass and Coos Bay Bridge
Crews• All of the region bridge inspectors, regional design engineers, project delivery
teams, their management, and others who have supported chloride testing ofbridge decks in Oregon

Appendix G – Comment Log for Design for Durability Specification
Location Reviewer Comment Response 00XXX.00 Scope
Change "ensure designed and selected bridge components are" to "demonstrate that the designed bridge is".
Proposed language changes incorporated without modification.
00XXX.00 Scope
Delete "Provide a completed structure that provides a minimum design service life".
Proposed deletion incorporated without modification.
00XXX.00 Scope
Reference to "00XXX.50(1)" changed to "00XXX.50". Proposed deletion incorporated without modification.
00XXX.00 Scope
A completed structure has both replaceable and non-replaceable.
Agreed. All proposed changes incorporated.
00XXX.10 Definitions Design Service Life
Change definition of Design Service Life to read, "The specified period of time for which a structure or a component is to be used for its intended purpose with appropriate maintenance activities and without unplanned major repair, or rehabilitation, or replacement."
Proposed deletion incorporated without modification.
00XXX.10 Definitions Design Service Life
For "Major Bridge" definition, changed "any a structure that it is" to "any structure that is".
00XXX.10 Definitions Design Service Life
The term "useful life" is not defined so seems redundant to define service with useful life.
Agreed. Proposed change incorporated.
00XXX.10 Definitions Design Service Life
Including the words "anticipated rehabilitation" seem risky: rehab are usually expensive and should not, in my opinion, be part of the service life assessment.
Agreed. Proposed change incorporated.
00XXX.10 Definitions Design Service Life
Suggest adding definitions for maintenance and rehab to add clarity to the definitions.
Agreed. Proposed definitions incorporated. See AL7 and AL8.
00XXX.10 Definitions Design Service Life
I am proposing a different definition instead. Note this is based on the definition currently considered by the Canadian Highway Bridge Design Code for service life. I added "replacement" in the definition.
Agreed. Proposed definition change incorporated without modification.
00XXX.10 Definitions Major Bridge
"other bridges" changed to "Other Bridges". Agreed. Since this is one of the defined terms, it should be capitalized. Proposed change incorporated.
00XXX.10 Definitions Major Bridge
The following phrase is added to the second sentence, "…due to higher consequences of early degradation, ease of rehabilitation or replacement, and/or importance of the structure in the network."
Do not agree. Agency reasons for wanting enhanced durability are not relevant.

Appendix 7 – Comment Log for Design for Durability Specification
Reasons have been deleted.
00XXX.10 Definitions Major Bridge
Revise phrase added by Alto include "capital cost". Do not agree. Agency reasons for wanting enhanced durability are not relevant. Reasons have been deleted.
00XXX.10 Definitions Major Bridge
Department or Agency? Both are used through the text. The correct term is "agency". Any use of "department" will be corrected to "agency".
00XXX.10 Definitions Service Life
Revise sentence to read, "The actual period of time where the structure is used for its intended purpose with appropriate maintenance activities and without unplanned major repair or rehabilitation or replacement."
Agreed. Proposed language is incorporated without modification.
00XXX.10 Definitions Service Life
I removed "useful life" because it is not defined. Agreed. Proposed change incorporated.
00XXX.10 Definitions Other Bridges
Suggest including this definition. I assumed the 75 years was chosen to be consistent with AASHTO LRFD.
Agree with adding definition. Yes, 75 years in 00XXX.50(1) is intended to be consistent with AASHTO LRFD.
00XXX.10 Definitions Other Bridges
Suggest changing "design life" to "Design Life specified". Agreed. Proposed change incorporated.
00XXX.10 Definitions Other Bridges
Design life in AASHTO is relevant only to statistical derivation of transient loads not service life
Concur.
00XXX.10 Definitions Maintenance Activities
Proposed definition. I also saw some agencies defining maintenance as activities they can perform themselves without having to hire a contractor but this depends how much you do in-house.
Agree with proposed definition that does not distinguish between in-house and contracted maintenance. New definition is incorporated without modification.
00XXX.10 Definitions Maintenance Activities
Hyphen added for consistency. Concur.

Appendix 7 – Comment Log for Design for Durability Specification
00XXX.10 Definitions Major Repair, rehabilitation
Proposed definition. Some agencies add that this is something they cannot do in-house and have to hire a contractor.
Agree with proposed definition that does not distinguish between in-house and contracted maintenance. New definition is incorporated with additions below.
00XXX.10 Definitions Major Repair, rehabilitation
Corrected beginning of definition to read, "An …" Concur.
00XXX.10 Definitions Major Repair, rehabilitation
Added "or significant". Agreed. Proposed change incorporated.
00XXX.10 Definitions Major Repair, rehabilitation
Added "actual service and exposure conditions". Agreed. Proposed change incorporated.
00XXX.20 Unacceptable Materials
This sentence is open to interpretation: commonly used locally, in Oregon or in North America? It could limit innovation because providing for a longer service life may mean using something different than what has been done so far. Suggest removing.
Agreed. Proposed language is incorporated with some modification.
00XXX.20 Unacceptable Materials
Change "Acceptable Materials" to "Unacceptable Materials". Agreed. Proposed change incorporated.
00XXX.20 Unacceptable Materials
Delete "used". Concur. Proposed change incorporated.
00XXX.20 Unacceptable Materials
Revised "Do not ..." to "Structures shall not …". Do not agree. ODOT style requirements require use of imperative mood language. Other states may adjust this to meet their own specifications style. Language has been changed back to "Do not use..". Note that Scope paragraph already defines work as having to do with constructing a "bridge".

Appendix 7 – Comment Log for Design for Durability Specification
00XXX.30 Strategy
Added "for each identified potential degradation mechanism" to opening sentence.
Agreed. Proposed change incorporated.
00XXX.30 Strategy
This seems like materials selections mentioned below. Agreed. The "select materials …" item moved up to second bullet and the "reduced corrosion potential" item is deleted.
00XXX.30 Strategy
Reworded second sentence in second paragraph to read, "Do not consider secondary measures such as active current cathodic protection, passive sacrificial anodes, and corrosion inhibiting admixtures as mitigation of expected corrosion effects in structures, including piles and do not consider them as justification for relaxation of the primary approach to achieve the required design service life.
00XXX.30 Strategy
Moved "Avoid the degradation mechanism" to be the first bullet.
Agreed. Proposed change incorporated.
00XXX.30 Strategy
Bullet added for "Apply supplementary protective measures …".
Agreed. Proposed language incorporated without modification.
00XXX.30 Strategy
Proposed new paragraph starting with "The primary approach …".
Agreed. Proposed change incorporated, but modified to imperative mood as required by ODOT style requirements.
00XXX.30 Strategy
Proposed new sentence reading, "Electrically insulate …". Agreed. Proposed language incorporated without modification.
00XXX.40 Environmental Conditions
This is a good idea to include requirements for exposure. However, a few things with what is currently proposed:

Appendix 7 – Comment Log for Design for Durability Specification
- Suggest including this requirement in the modeling section for concrete structures.
Agreed. Section moved to 00XXX.70,
- Since using a full probabilistic approach, a mean and standard deviation should be indicated.
Oregon currently lacks sufficient information to provide a mean and standard deviation. We concur with the concept of establishing a mean and standard deviation as some point in the future.
- Suggest defining "heavy deicing salts" and "moderate deicing salts". Is this depending on the region?
The project team will determine the % by mass based on the local environment.
- Using the same exposure for buried concrete as for the deck seems too conservative; it could lead to overdesign for buried components. It could also be difficult to provide for this level of service life, i.e. it could results in very low permeability mix for foundations (often mass concrete) which would have high hydration temperature or other constructability issues. This also gives no benefit to a joint-less bridge where there could be a relaxation for the piers where no joints are present.
Agreed. However, we currently do not have adequate information in Oregon to accurately distinguish between all these elements. With time we will develop more reliable values.
- 1.1% concrete is on the high side and may be difficult to meet for decks with a 100 year service life. The full probabilistic approach uses a mean and standard deviation to model for the risk of higher/lower chloride loading. Suggest revising numbers.
Our Oregon data is generally limited to decks. We will need to use significant judgment when determining the corrosion loading for components other than decks. We will modify our recommendations as we gather additional data to support less conservative values.
- If one has to assume salts in the soil, does this mean the soil should be designed as corrosive and therefore higher corrosion allowance for steel piles shall be used? I think this would lead to expensive foundations even if it is a non-contaminated soil where there is no need for a corrosion allowance.
Again, we will use better values once we have the data to support it.
- If only data from decks were gathered to produce this table, I suggest indicating only the chloride loading for decks.
Agreed.

Appendix 7 – Comment Log for Design for Durability Specification
00XXX.40 Environmental Conditions
These are good comments. Have we edited the document to reflect these comments?
Comments are incorporated into note for designer (orange section in parenthesis) associated with 00XXX.70.
00XXX.50 Design Service Life Requirements
Added "major structural components that are not designed to be replaced within the service life of the Bridge" to the title under subsection (1).
Agreed. Proposed language incorporated without modification.
00XXX.50 Design Service Life Requirements
In subsection (1), "All Other Bridges" changed to "Other Bridges".
Concur.
00XXX.50 Design Service Life Requirements
Added "components designed to be replaced entirely within the service life of the Bridge" to the title under subsection (2).
Agreed. Proposed language incorporated without modification.
00XXX.50 Design Service Life Requirements
Added "Other non-replaceable components" with 100 and 75 year design lives.
Agreed. Addition incorporated without modification.
00XXX.50 Design Service Life Requirements
You could have the same requirements for both bridge types (like the major bridge column). This could also be based on the DOTs experience with typical observed service life.
We like the idea of having longer service life requirements for components on major bridges. This may not be realistic for many component types. We will need to take a skeptical look at this when we apply it to an actual project.
00XXX.50 Design Service Life Requirements
In subsection (2), "All Other Bridges" changed to "Other Bridges".
Concur.
00XXX.50 Design Service Life Requirements
Changed "Concrete bridge rail" to "Concrete bridge barriers". Agreed. Although "bridge rail" is commonly used in Oregon, "bridge barrier" is a more universal term and would certainly be clearly understood in Oregon.

Appendix 7 – Comment Log for Design for Durability Specification
00XXX.50 Design Service Life Requirements
Suggest 75 (service life for concrete bridge barrier for "Major Bridges") if the DOT thinks it is feasible; the coatings could be touch-up.
Agreed. We will keep this at 40 years for now, but there is certainly reason to believe longer life is achievable at many bridge sites.
00XXX.50 Design Service Life Requirements
Suggest 40 or 50 (service life for concrete bridge barrier for "Other Bridges"). They will probably last less for various reasons including impact, which can't be predicted.
Agreed. We concur with 40 years for now, but there is certainly reason to believe longer life is achievable at many bridge sites.
00XXX.50 Design Service Life Requirements
15 for concrete wearing surface (service life for "Other Bridges") is low.
Agreed. We concur with 25 years. Each project will need to consider what is achievable at their site. 25 years would be our expectation for a silica fume concrete overlay. We also use epoxy overlays in some locations to restore ride quality. Epoxy overlays, where allowed, would only have an expected life of 15 years. We also use Polyester polymer concrete which has a life between the other two. Each project will need to consider which of these types can be accepted.
00XXX.50 Design Service Life Requirements
Suggest 40-50 years (service life for bridge bearings). Agreed. We will keep this at 40 years for now, but there is certainly reason to believe longer life is achievable at many bridge sites.
00XXX.50 Design Service Life Requirements
"Expansion Joints" added to subsection (2). Agreed. Addition incorporated without modification.

Appendix 7 – Comment Log for Design for Durability Specification
00XXX.50 Design Service Life Requirements
Added "Coating systems" to subsection (2) with a 20 year service life.
Agreed. Addition incorporated without modification.
00XXX.50 Design Service Life Requirements
Added "Other replaceable components" with "as negotiated" service life.
Agreed. Addition incorporated without modification.
00XXX.50 Design Service Life Requirements
This is a choice which can be made by the Agency but we have designed bridges with replacement structural overlays. The concrete overlays in these cases have been used or live load only.
Concur. Considering the overlay as non-structural for design purposes provides our agency more flexibility when it comes to future load rating. For structures with a large deck area, we may need to consider the additional cost of this conservatism.
00XXX.60 Service Life and Corrosion Protection Plan
This is the typical wording we see in RFPs that keeps being reused over and over… I added a few things and the fact that it is embedded in a larger framework makes it more useable.
Concur.
00XXX.60 Service Life and Corrosion Protection Plan
First bullet, changed "members" to "components" Agreed. Addition incorporated without modification.
00XXX.60 Service Life and Corrosion Protection Plan
Added, "exposed to surface runoff containing deicing chemicals" to the second bullet
Agreed. Addition incorporated without modification.
00XXX.60 Service Life and Corrosion Protection Plan
Suggest defining what is exposed to deicing salts. Concur with adding this new section.
This is based on CSA S6 commentary and should be modified based on your expectations. Note that this lumps together direct and indirect exposure to deicing salts. Hence, the Consultant would still be free to assume different exposures for all these components.

Appendix 7 – Comment Log for Design for Durability Specification
00XXX.60 Service Life and Corrosion Protection Plan
This item is currently under discussion with the S6 committee. fib Bulletin 34 and Eurocode offer different guidance:
Noted.
fib: 5ft x 5ft (1.5m x 1.5m) for splash zone, spray zone is not defined
We believe the Eurocode value is more appropriate for OR.
Eurocode: 20ft x 20ft (6m x 6m) We concur with this value.
The vertical clearance is important for highway overpass as it will affect the girders.
Concur.
00XXX.60 Service Life and Corrosion Protection Plan
Wide range of values (last sub-bullet under the second main bullet).
Concur. We will go with the 20 x 20 Eurocode value.
00XXX.60 Service Life and Corrosion Protection Plan
Added "List the models used in the plan." to the 3rd bullet. Agreed. Addition incorporated without modification.
00XXX.60 Service Life and Corrosion Protection Plan
Replaced "Model degradation using a full probabilistic approach ..." with "For chloride-induced corrosion in concrete structures, use a model as required in 00XXX.70 Full-probabilistic Models ..." to the 3rd bullet.
Agreed. Addition incorporated without modification.
00XXX.60 Service Life and Corrosion Protection Plan
Some corrosion allowances that are difficult to determine because AASHTO LRFD does not provide guidance:
Noted.
- corrosion allowance of buried/submerged steel piles - corrosion allowance of weathering steel FHWA has limited guidance and, for piles, very conservative
corrosion allowances. FDOT developed a methodology for steel piles that may be worth looking into. We have used Eurocodes on some projects too. If this is an issue in Oregon, you may want to consider specifying a corrosion allowance or a certain code.
We have not yet looked at the FDOT methodology. We agree this section of the spec will require modification in the future as we learn more.
Suggest discussion.

Appendix 7 – Comment Log for Design for Durability Specification
00XXX.60 Service Life and Corrosion Protection Plan
Good commentary (above by AML) - include somehow? We concur that including this type of information will improve the spec. However, we need more information before we can properly use it.
00XXX.60 Service Life and Corrosion Protection Plan
New section added to 5th bullet starting with, "Identify critical materials properties …"
Agreed. Addition incorporated with minor grammatical changes to fit ODOT writing style.
00XXX.60 Service Life and Corrosion Protection Plan
I am assuming your standard spec requires trial batches and submittal of mills certificates, plastic air is measured at the truck, AAR tests is conducted, etc. hence these are not included here. I would put here only additional tests not covered in your standard specs.
Concur.
One important discussion: are these two parameters a compliance items or a monitoring items? On some jobs, they are a monitoring items (meaning they do no generate an NCR but the Contractor has to adjust its procedures), on some other jobs they are a compliance items and these generate an NCR.
We would anticipate these items generating an NCR. There are several options to remedy to NCR. Adjustment of the Contractor's procedures would be one.
00XXX.60 Service Life and Corrosion Protection Plan
This is my suggestion. Could also be tied to compressive strength frequency (like every 3rd set or every 10th set).
We will keep this as is for now. We will consider what is appropriate when we have an actual project.
00XXX.60 Service Life and Corrosion Protection Plan
Will this specification be applicable to "Other Bridges". My understand is this specification would only be attached to requirements for "Major Bridges"
Our goal is to eventually apply some type of durability requirements even to "other" bridges. Also, major projects with a signature bridge often have "other" bridges in the same project.
00XXX.60 Service Life and Corrosion Protection Plan
Added "Concrete initial chloride content: during the trial batch process." and "Concrete hardened air void ASTM C457: during the trial batch projects." as sub-bullets under the 5th bullet.
Agreed. Addition incorporated without modification.

Appendix 7 – Comment Log for Design for Durability Specification
00XXX.60 Service Life and Corrosion Protection Plan
Added "Describe the general procedure …" as a new 6th bullet.
Agreed. Addition incorporated without modification.
00XXX.60 Service Life and Corrosion Protection Plan
I added this because I think it is good to get the conversation on NCR going during the design phase.
Agreed. Addition incorporated with minor grammatical changes to fit ODOT writing style.
The final objective may not always be possible and most likely you will have to negotiate. For example, if the proposed solution is to add a sealer, this will result in additional maintenance because the sealer will need to be reapply every few years in order to be effective. We also need to keep in mind that a lot of non-conformances are local anomalies for which no modelling is possible and that will most likely result in localized maintenance but not an overall loss of service life.
Noted.
00XXX.60 Service Life and Corrosion Protection Plan
May not want to fix this (the discount rate) – use "as provided by the Agency"?
Discount rate changed to x.x%. We will want to have this clearly defined in the specs since it will have a major impact on the life-cycle cost analysis.
00XXX.60 Service Life and Corrosion Protection Plan
I see this often in RFPs but often I feel we are missing relevant data to make this assessment really meaningful for the Owner.
Noted.
00XXX.60 Service Life and Corrosion Protection Plan
inhibitors? See section 00XXX.30 where I suggest adding that CP and inhibitors not be considered as part of mitigation of expected corrosion.
Concur. "Inhibitors" deleted.
00XXX.60 Service Life and Corrosion Protection Plan
This is only useful if the Contractor performs tests during construction and gathers data. Hence I added tests during construction.
Agreed. Addition incorporated without modification.
00XXX.60 Service Life and Corrosion Protection Plan
This was moved to the strategy section. Concur.
00XXX.70 Full-probabilistic
Added, "…the chloride-induced corrosion process …" Agreed. Addition incorporated with minor grammatical

Appendix 7 – Comment Log for Design for Durability Specification
Models changes to fit ODOT writing style.
00XXX.70 Full-probabilistic Models
I think leaving the door open to other models is fair. Not every consultant is familiar with the fib bulletin 34 methodology in the USA.
Concur.
00XXX.70 Full-probabilistic Models
Deleted reference and equations for Fick's 2nd Law. Concur.
00XXX.70 Full-probabilistic Models
Changed "useful life" to "the design Service life". Agreed. Addition incorporated without modification.
Added, "… (corosion initiation) using a target reliability index of 1.3.
Agreed. Addition incorporated without modification.
00XXX.70 Full-probabilistic Models
Since a full probabilistic approach is specified, should include a standard deviation and distribution. These values are on the lower side and adequate if using a deterministic approach. The threshold here for black steel is much lower than what fib Bulletin 34 proposes. The full probabilistic approach has the advantage of capturing the variability of the input parameters and the wide range of corrosion threshold. Suggest revising to consider a full probabilistic approach.
OR is comfortable with these thresholds. We do not have adequate data to propose a standards deviation at this time. This will be a future enhancement we will consider.
00XXX.70 Full-probabilistic Models
Added "by mass of concrete" to three threshold levels. Agreed. Addition incorporated without modification.
00XXX.70 Full-probabilistic Models
We should discuss this. see previous comments on what information should be included.
We added notes to designer that provides our current recommendations. These chloride loadings will need project-specific input. We are not yet comfortable with including a coefficient of variation.
Could also include components below joints. This value could be half of the deck value for example.
Concur. Components below joints added.
00XXX.70 Full-probabilistic Models
The NTBuild 492 test can only be used with the fib bulletin 34 model and measures the concrete chloride migration coefficient. I put this requirement in the text related to construction requirements.
Concur with moving this item.

Appendix 7 – Comment Log for Design for Durability Specification
00XXX.70 Full-probabilistic Models
Second paragraph under "Coated Steel …", changed "useful life" to "service life".
Concur.
00XXX.70 Full-probabilistic Models
Second paragraph under "Coated Steel …", reworded last half of sentence.
Agreed. Addition incorporated without modification.
00XXX.70 Full-probabilistic Models
Delete last sentence that refers to a degradation model. I do not know of any degradation model.
Agreed. Addition incorporated without modification.