oregon investment council€¦ · rukaiyah adams john russell rex kim patricia moss tobias read...
TRANSCRIPT

Oregon Investment Council
September 18, 2019
Rukaiyah Adams Chair John Skjervem Chief Investment Officer Tobias Read State Treasurer

Rukaiyah Adams John Russell Rex Kim Patricia Moss Tobias Read Kevin Olineck Chair Vice Chair Member Member State Treasurer PERS Director
OREGON INVESTMENT COUNCIL
Agenda
September 18, 2019
9:00 AM
Oregon State Treasury Investment Division
16290 SW Upper Boones Ferry Road Tigard, OR 97224
Time A. Action Items Presenter Tab 9:00-9:05 1. Review & Approval of Minutes Rukaiyah Adams 1 June 5, 2019 OIC Chair 9:05-9:10 2. Committee Reports and CIO Remarks John Skjervem 2 Chief Investment Officer
B. Information Items 9:10-10:00 3. Financial Markets and Macro Economic Update Brian Smedley 3
Head of Macroeconomic and Investment Research, Guggenheim Partners, LLC 10:00-10:20 4. Q2 2019 Performance & Risk Report Karl Cheng 4
OPERF Senior Investment Officer, Portfolio Risk & Research Janet Becker-Wold
Senior Vice President, Callan LLC 10:20-10:30 -------------------- BREAK -------------------- 10:30-11:15 5. Annual Cost & Implementation Analysis David Randall 5 OPERF Director of Investment Operations Mike Heale Principal, CEM Benchmarking

Rukaiyah Adams John Russell Rex Kim Patricia Moss Tobias Read Kevin Olineck Chair Vice Chair Member Member State Treasurer PERS Director
OIC Meeting Agenda September 18, 2019 Page 2
11:15-12:30 6. Oregon Savings Growth Plan Wil Hiles 6 Annual Review and Update Investment Officer, Public Equity
Matt O’Hara Managing Director, Co-Head of LifePath, BlackRock Uvan Tseng Senior Vice President, Callan LLC 12:30-12:35 7. Asset Allocations & NAV Updates John Skjervem 7 a. Oregon Public Employees Retirement Fund b. SAIF Corporation c. Common School Fund d. Southern Oregon University Endowment Fund 8. Calendar — Future Agenda Items 8 12:35 9. Open Discussion Council Members Staff Consultants C. Public Comment Invited 10 Minutes

TAB 1 – REVIEW & APPROVAL OF MINUTES
June 5, 2019 Regular Meeting
Oregon Investment Council
State of Oregon Office of the State Treasurer
16290 SW Upper Boones Ferry Road Tigard, Oregon 97224
OREGON INVESTMENT COUNCIL June 5, 2019
Meeting Minutes
Members Present: Rukaiyah Adams, John Russell, Tobias Read, Rex Kim, Patricia Moss and Kevin Olineck
Staff Present: John Skjervem, Darren Bond, Perrin Lim, David Randall, Deena Bothello, Karl
Cheng, Austin Carmichael, Paul Koch, David Elott, May Fanning, Angela Schaffers, Tony Breault, Jen Plett, Debra Day, Krystal Mclean, Sam Spencer, Ben Mahon, Tom Lofton, Lisa Pettinati, Geoff Nolan, Garrett Cudahey, Amanda Kingsbury, Michael Mueller, Aliese Jacobsen, Eric Messer, Kristel Flores, Steve Kruth, Joe Hutchinson, Michael Viteri, Jennifer Peet, Tyler Bernstein, Ricardo Lopez, Tiffany ZhuGe, Andy Coutu, James Sinks, Dmitri Palmateer, Amy Wojcicki, Kristi Jenkins, Ahman Dirks, Robin Kaukonen, Sommer May, Andrey Voloshinov, Chris Ebersole, Scott Robertson, Ian Huculak, Mark Selfridge and Kim Olson
Consultants Present: Tom Martin (TorreyCove); Allan Emkin, Christy Fields and Brandon Ross
(Meketa Investment Group, Inc.); Janet Becker-Wold and Jim Callan (Callan LLC); Tom Marin (TorreyCove Capital Partners)
Legal Counsel Present: Steven Marlowe, Department of Justice The June 5th, 2019 OIC meeting was called to order at 9:01 am by Rukaiyah Adams, OIC Chair. I. 9:01 am Review and Approval of Minutes
MOTION: Chair Adams asked for approval of the April 24, 2019 OIC regular meeting minutes. Member Russell moved the motion at 9:02 am, and Mr. Kim seconded the motion which then passed by a 5/0 vote.
II. 9:03 am Committee Reports and CIO Remarks
Committee Reports: Mr. Skjervem gave an update on the following committee actions taken since the April 24th, 2019 OIC meeting:
Private Equity Committee April 26, 2019 Permira VII, L.P. €225M Alternatives Portfolio Committee May 22, 2019 Silver Creek Aggregate Reserves Fund I $150M
Taurus Mining Finance Fund No. 2, L.P. $150M

OREGON INVESTMENT COUNCIL June 5, 2019
Meeting Minutes
Oregon Investment Council
2
Opportunity Portfolio Committee None Real Estate Committee None
Mr. Skjervem then provided opening remarks which included a preview of the Annual Alternatives Review, Annual Overly Review, Q1 2019 Performance & Risk Report and the Annual Operations Update. He also introduced new staff member, Ian Huculak, Investment Analyst, Operations, and announced the transfer of Ricardo Lopez from Investment Analyst in Operations to a similar role in Real Estate. Finally, Mr. Skjervem recognized Deputy Treasurer Darren Bond and his upcoming June 30 retirement, thanking him for his guidance and leadership at Treasury as well as his 30 years of dedicated service to the State of Oregon.
III. 9:13 am Alternatives Portfolio Review – OPERF Alternatives Portfolio
Ben Mahon, Senior Investment Officer, Alternatives along with Tom Martin, TorreyCove Capital Partners and Jim Callahan, Callan LLC, presented the Alternatives Portfolio 2018 Annual Review and 2019 Plan. This presentation included a discussion of the Alternatives Portfolio’s background and objectives, and a review of the portfolio’s 2018 performance and investment activity. Messrs. Mahon, Martin and Callahan also provided the Council with an update on the portfolio’s current positioning as well as staff’s 2019 investment plan. 10:13 am Overlay Review – OPERF Karl Cheng, Senior Investment Officer, Portfolio Risk & Research, introduced Russell Investment’s Greg Nordquist, Director, Overlay Strategies, and Philip Saucier, Portfolio Manager, Overlay Strategies, who the presented Russell’s annual report on the OPERF overlay program and that firm’s management thereof.
IV. 10:47 am Q1 2019 Performance & Risk Report – OPERF Karl Cheng, and Janet Becker-Wold, Senior Vice President, Callan LLC, presented the quarterly OPERF investment performance and risk report for the calendar year and cumulative period ended March 31, 2019.
V. 11:13 am OST Investment Operations Update – OPERF & Other OST-managed Accounts David Randall, Director of Investment Operations, Debra Day, Investment Reporting Manager and Kristi Jenkins, Investment Operations Manager, provided the Council with an update on Investment Operations that included an executive summary of their group’s various activities and accomplishments and an updated OST Investment Division Org Chart.
VI. 11:26 am Asset Allocation & NAV Updates Mr. Skjervem reviewed asset allocations and NAVs across OST-managed accounts for the period ended April 30, 2019.
VII. 11:26 am Calendar – Future Agenda Items
A calendar listing of future OIC meetings and scheduled agenda topics was included in the Council’s meeting material.
VIII. 11:35 am Joint PERS Board/OIC Discussion Following the conclusion of the regular OIC meeting, Chair Adams invited members of the Public Employees Retirement System (PERS) Board to participate in a roundtable discussion regarding the Oregon Public Employees Retirement Fund (OPERF). That discussion started with a presentation from PERS actuary Matt Larrabee of Milliman, during which Mr. Larrabee reviewed the PERS Board’s objectives as well as the pension

OREGON INVESTMENT COUNCIL June 5, 2019
Meeting Minutes
Oregon Investment Council
3
plan’s operating assumptions and governance structure. He also provided a comparison of peer fund’s return expectations and shared his firm’s projections of Oregon’s unfunded pension liability. Following Mr. Larabee’s remarks, the Council and PERS Board members engaged in a spirited discussion of future investment returns and the inherent trade-offs embedded in various investment strategies and asset allocation approaches.
12:48 pm Public Comments None.
Ms. Adams adjourned the meeting at 12:49 pm. Respectfully submitted,
May Fanning Executive Support Specialist

TAB 2 – Committee Reports and CIO Remarks

Opening RemarksJohn D. Skjervem, Chief Investment Officer
Oregon Investment CouncilSeptember 18, 2019

Macro Overview• Negative interest rates
Q2 2019 Performance & Risk Report
• Decidedly positive first half results
Annual Cost & Implementation Analysis
• Well above peer group median performance at slightly below
peer group median cost
OSGP Annual Review and Update
• Minor changes in fund line-up necessitate a similarly minor
benchmark change

New Hires• Aaron Schaffer, Office Assistant
• Jeremy Knowles, Investment Analyst I, Fixed Income
• Mohammed Quraishi, Investment Analyst II, Operations
Promotions• Eric Messer, from Investment Analyst III, Alternatives to
Investment Officer I, Private Equity
• Wil Hiles, from Investment Analyst II, Public Equity to
Investment Officer I, Public Equity
• Krystal Mclean, from Legal Assistant to Paralegal
• Jen Plett, from Senior Investment Analyst, Portfolio Risk &
Research to Investment Officer I, Portfolio Risk & Research
• Sommer May, from Senior Compliance Analyst to
Compliance Manager
• Amanda Kingsbury, from Senior Investment Analyst,
Alternatives to Investment Officer I, Alternatives

So Long and Thank You• Maryam Azeemi
Girls Who Invest Intern, Summer 2019
• Vivek Sharma
University of Oregon Intern, Summer 2019
Welcome• Bolivar Cardenas
Portland State University Straub Fellow, 2019-20

TAB 3 – Financial Markets and Macro Economic Update
CONFIDENTIAL

TAB 4 – Q2 2019 Performance & Risk Report
OPERF
Oregon Investment Council
Second Quarter 2019Performance Review
September 18, 2019

2Knowledge. Experience. Integrity. Oregon Investment Council
Does Strong First Half Spell Problems for Second Half of 2019 and 2020?
Strong equity markets continue in Q2, adding to sharp rebound in Q1– S&P up 18.5%, ACWI ex USA up 13.6% y-t-d
Dovish Fed comments, solid corporate fundamentals, and even lower unemployment propel equity markets in Q2:– low quality stocks outperform– growth over value– small cap lags large cap once again– Developed non-U.S. equities continue
rebound, EM stalls in Q2
Trade uncertainty slowed markets in May, hope of deal rebounded in June
Fixed income markets participate, too– Investment grade is strongest performer in
the U.S.– Credit spreads continued rally in Q2.– Yield curve shifts lower across maturities,
inverts from 3 months – 10 years; upward sloping from 1 year
Did we just “steal” the expected return for the next 18 months?
*Cambridge PE data are available through December 31, 2018.
Source: Callan
1 Quarter 1 Year 5 Years 10 Years 25 YearsU.S. EquityRussell 3000 4.10 8.98 10.19 14.67 9.98S&P 500 4.30 10.42 10.71 14.70 9.97Russell 2000 2.10 -3.31 7.06 13.45 9.26Non-U.S. EquityMSCI World ex USA 3.79 1.29 2.04 6.75 5.01MSCI Emerging Markets 0.61 1.22 2.49 5.81 --MSCI ACWI ex USA Small Cap 1.21 -5.94 2.77 8.48 5.32Fixed IncomeBloomberg Barclays Aggregate 3.08 7.87 2.95 3.90 5.503-Month T-Bill 0.64 2.31 0.87 0.49 2.52Bloomberg Barclays Long Gov/Credit 6.59 13.82 5.68 7.62 7.73Bloomberg Barclays Global Agg ex-US 3.42 4.10 -0.12 2.10 4.49Real EstateNCREIF Property 1.51 6.51 8.83 9.25 9.36FTSE NAREIT Equity 1.24 11.21 7.92 15.46 10.25AlternativesCS Hedge Fund 2.35 2.46 2.36 5.03 7.84Cambridge Private Equity* 4.86 12.71 12.30 14.83 15.32Bloomberg Commodity -1.19 -6.75 -9.15 -3.74 1.69Gold Spot Price 8.87 12.69 1.35 4.31 5.32Inflation - CPI-U 0.76 1.65 1.45 1.73 2.22
Returns for Periods ended June 30, 2019

3Knowledge. Experience. Integrity. Oregon Investment Council
Global Economic Update 2019
Central bank policy front and center
– The Fed was alone on a path to normalize interest rates, with nine rate hikes in two years; euro zone sat out. U.S. rates have been substantially higher than developed markets globally for an extended period.
– Fed adopted dovish tone in January, a sharp reversal in stance. Rates held constant through Q2; rate cuts now expected in Q3 or Q4 2019.
However, U.S. economy remains strong, labor market very tight, reaching the limits of full employment
– Solid Q1 GDP growth (3.2%) moderated in Q2 (2.1%), will soften further in face of slowing global economy, trade uncertainty
– Slower growth inevitable after impact of 2018 fiscal stimulus fades and full impact of nine rate hikes feeds through the economy.
– Switch to dovish Fed policy boosted consumer and business confidence, and juiced stock market; drop back in borrowing costs expected to sustain growth, or at least soften slowdown
– Policy reversal simultaneously stoked fears of coming slowdown and fed a rally in bonds.
The slowdown in Europe and China weighing on global growth
– Euro zone unemployment has dropped, but economic growth stalled (GDP below 1.5%).
– China suffering dramatic slowdown in growth: industrial output, retail sales, implied GDP
– Resolution of trade uncertainty crucial to resumption of growth, far more important to China than the U.S.
Inflation remains stuck below 2% in U.S., weaker overseas
– Wage pressures building in U.S. have yet to translate into headline inflation.
– Weakening global growth, softer inflation give Fed cover to reverse policy and cut rates
The Big Picture
4Knowledge. Experience. Integrity. Oregon Investment Council
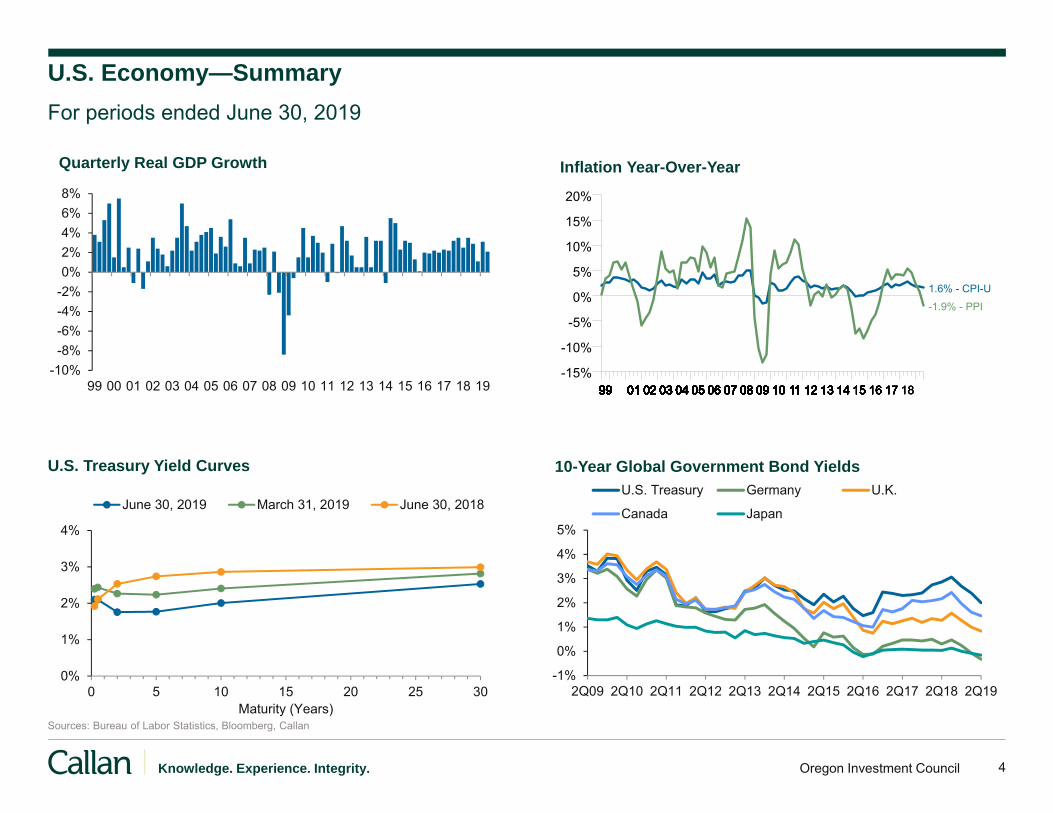
U.S. Economy—SummaryFor periods ended June 30, 2019
Sources: Bureau of Labor Statistics, Bloomberg, Callan
-10%-8%-6%-4%-2%0%2%4%6%8%
99 00 01 02 03 04 05 06 07 08 09 10 11 12 13 14 15 16 17 18 19
Quarterly Real GDP Growth
999999999999999999 0199 0199 0199 0199 01 0299 01 0299 01 0299 01 0299 01 02 0399 01 02 0399 01 02 0399 01 02 0399 01 02 03 0499 01 02 03 0499 01 02 03 0499 01 02 03 0499 01 02 03 04 0599 01 02 03 04 0599 01 02 03 04 0599 01 02 03 04 0599 01 02 03 04 05 0699 01 02 03 04 05 0699 01 02 03 04 05 0699 01 02 03 04 05 0699 01 02 03 04 05 06 0799 01 02 03 04 05 06 0799 01 02 03 04 05 06 0799 01 02 03 04 05 06 0799 01 02 03 04 05 06 07 0899 01 02 03 04 05 06 07 0899 01 02 03 04 05 06 07 0899 01 02 03 04 05 06 07 0899 01 02 03 04 05 06 07 08 0999 01 02 03 04 05 06 07 08 0999 01 02 03 04 05 06 07 08 0999 01 02 03 04 05 06 07 08 0999 01 02 03 04 05 06 07 08 09 1099 01 02 03 04 05 06 07 08 09 1099 01 02 03 04 05 06 07 08 09 1099 01 02 03 04 05 06 07 08 09 1099 01 02 03 04 05 06 07 08 09 10 1199 01 02 03 04 05 06 07 08 09 10 1199 01 02 03 04 05 06 07 08 09 10 1199 01 02 03 04 05 06 07 08 09 10 1199 01 02 03 04 05 06 07 08 09 10 11 1299 01 02 03 04 05 06 07 08 09 10 11 1299 01 02 03 04 05 06 07 08 09 10 11 1299 01 02 03 04 05 06 07 08 09 10 11 1299 01 02 03 04 05 06 07 08 09 10 11 12 1399 01 02 03 04 05 06 07 08 09 10 11 12 1399 01 02 03 04 05 06 07 08 09 10 11 12 1399 01 02 03 04 05 06 07 08 09 10 11 12 1399 01 02 03 04 05 06 07 08 09 10 11 12 13 1499 01 02 03 04 05 06 07 08 09 10 11 12 13 1499 01 02 03 04 05 06 07 08 09 10 11 12 13 1499 01 02 03 04 05 06 07 08 09 10 11 12 13 1499 01 02 03 04 05 06 07 08 09 10 11 12 13 14 1599 01 02 03 04 05 06 07 08 09 10 11 12 13 14 1599 01 02 03 04 05 06 07 08 09 10 11 12 13 14 1599 01 02 03 04 05 06 07 08 09 10 11 12 13 14 1599 01 02 03 04 05 06 07 08 09 10 11 12 13 14 15 1699 01 02 03 04 05 06 07 08 09 10 11 12 13 14 15 1699 01 02 03 04 05 06 07 08 09 10 11 12 13 14 15 1699 01 02 03 04 05 06 07 08 09 10 11 12 13 14 15 1699 01 02 03 04 05 06 07 08 09 10 11 12 13 14 15 16 1799 01 02 03 04 05 06 07 08 09 10 11 12 13 14 15 16 1799 01 02 03 04 05 06 07 08 09 10 11 12 13 14 15 16 1799 01 02 03 04 05 06 07 08 09 10 11 12 13 14 15 16 1799 01 02 03 04 05 06 07 08 09 10 11 12 13 14 15 16 17 1899 01 02 03 04 05 06 07 08 09 10 11 12 13 14 15 16 17 1899 01 02 03 04 05 06 07 08 09 10 11 12 13 14 15 16 17 18-15%
-10%
-5%
0%
5%
10%
15%
20%
Inflation Year-Over-Year
1.6% - CPI-U
-1.9% - PPI
U.S. Treasury Yield Curves
0%
1%
2%
3%
4%
0 5 10 15 20 25 30Maturity (Years)
June 30, 2019 March 31, 2019 June 30, 2018
-1%
0%
1%
2%
3%
4%
5%
2Q09 2Q10 2Q11 2Q12 2Q13 2Q14 2Q15 2Q16 2Q17 2Q18 2Q19
10-Year Global Government Bond YieldsU.S. Treasury Germany U.K.
Canada Japan

5Knowledge. Experience. Integrity. Oregon Investment Council
Treasury Yield CurveAugust 23, 2009– August 23, 2019
6Knowledge. Experience. Integrity. Oregon Investment Council
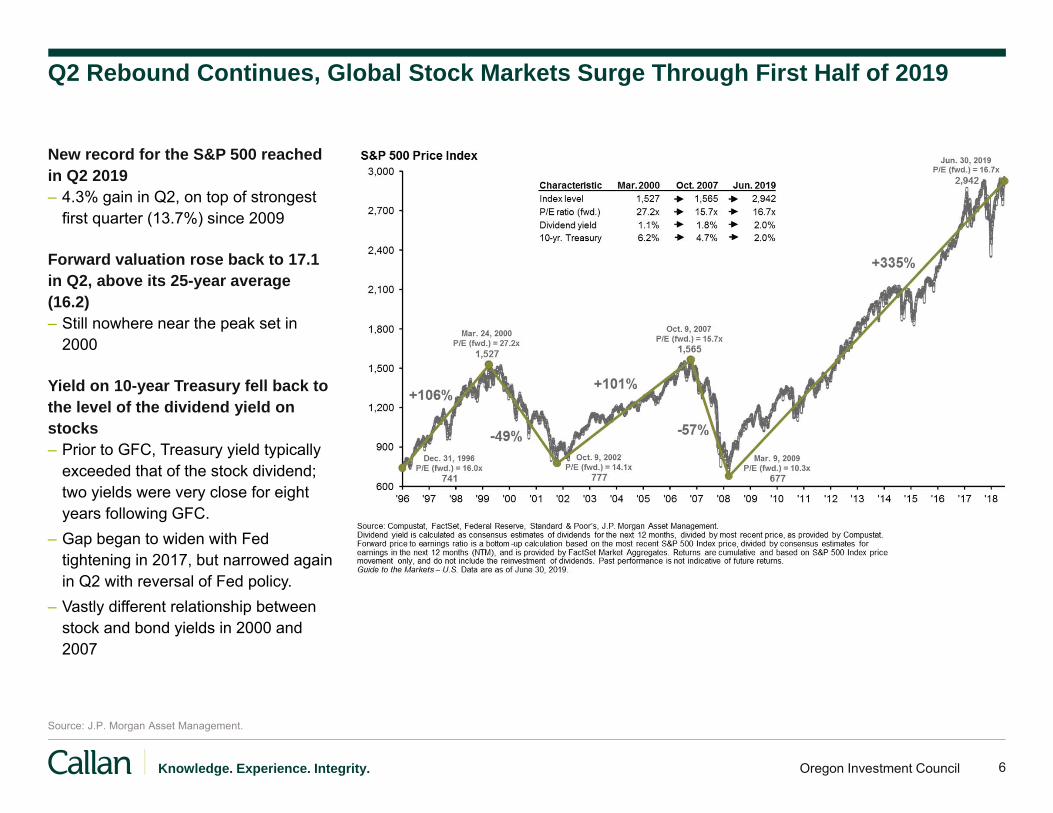
Q2 Rebound Continues, Global Stock Markets Surge Through First Half of 2019
New record for the S&P 500 reached in Q2 2019– 4.3% gain in Q2, on top of strongest
first quarter (13.7%) since 2009
Forward valuation rose back to 17.1 in Q2, above its 25-year average (16.2)– Still nowhere near the peak set in
2000
Yield on 10-year Treasury fell back to the level of the dividend yield on stocks– Prior to GFC, Treasury yield typically
exceeded that of the stock dividend; two yields were very close for eight years following GFC.
– Gap began to widen with Fed tightening in 2017, but narrowed again in Q2 with reversal of Fed policy.
– Vastly different relationship between stock and bond yields in 2000 and 2007
Source: J.P. Morgan Asset Management.

7Knowledge. Experience. Integrity. Oregon Investment Council
Callan Periodic Table of Investment ReturnsReturns for Key Indices
Sources: Bloomberg Barclays, FTSE Russell, MSCI, Standard & Poor’s
● S&P 500 Index ● Russell 2000 Index ● MSCI World ex USA ● MSCI Emerging Markets ● Bloomberg Barclays US Aggregate Bond ● Bloomberg Barclays High Yield Bond Index ● Bloomberg Barclays Global Aggregate ex US Bond Index ● FTSE EPRA/NAREIT Developed REIT Index ● 3-month Treasury Bill
EquityLarge Cap
4.91%
EquityLarge Cap
15.79%
EquityLarge Cap
5.49%
EquityLarge Cap
-37.00%
EquityLarge Cap
26.47%
EquityLarge Cap
15.06%
EquityLarge Cap
2.11%
EquityLarge Cap
16.00%
EquityLarge Cap
32.39%
EquityLarge Cap
13.69%
EquityLarge Cap
1.38%
EquityLarge Cap
11.96%
EquityLarge Cap
21.83%
EquityLarge Cap
-4.38%
EquityLarge Cap
18.54%
EquitySmall Cap
4.55%
EquitySmall Cap
18.37%
EquitySmall Cap
-1.57%
EquitySmall Cap
-33.79%
EquitySmall Cap
27.17%
EquitySmall Cap
26.85%
EquitySmall Cap
-4.18%
EquitySmall Cap
16.35%
EquitySmall Cap
38.82%
EquitySmall Cap
4.89%
EquitySmall Cap
-4.41%
EquitySmall Cap
21.31%
EquitySmall Cap
14.65%
EquitySmall Cap
-11.01%
EquitySmall Cap
16.98%
EquityNon-U.S.
14.47%
EquityNon-U.S.
25.71%
EquityNon-U.S.
12.44%
EquityNon-U.S.
-43.56%
EquityNon-U.S.
33.67%
EquityNon-U.S.
8.95%
EquityNon-U.S.
-12.21%
EquityNon-U.S.
16.41%
EquityNon-U.S.
21.02%
EquityNon-U.S.
-4.32%
EquityNon-U.S.
-3.04%
EquityNon-U.S.
2.75%
EquityNon-U.S.
24.21%
EquityNon-U.S.
-14.09%
EquityNon-U.S.
14.64%
IncomeU.S. Fixed
2.43%
IncomeU.S. Fixed
4.33%
IncomeU.S. Fixed
6.97%
IncomeU.S. Fixed
5.24%
IncomeU.S. Fixed
5.93%
IncomeU.S. Fixed
6.54%
IncomeU.S. Fixed
7.84%
IncomeU.S. Fixed
4.21%
IncomeU.S. Fixed
-2.02%
IncomeU.S. Fixed
5.97%
IncomeU.S. Fixed
0.55%
IncomeU.S. Fixed
2.65%
IncomeU.S. Fixed
3.54%
IncomeU.S. Fixed
0.01%
IncomeU.S. Fixed
6.11%
Market EquityEmerging
34.00%
Market EquityEmerging
32.17%
Market EquityEmerging
39.38%
Market EquityEmerging
-53.33%
Market EquityEmerging
78.51%
Market EquityEmerging
18.88%
Market EquityEmerging
-18.42%
Market EquityEmerging
18.23%
Market EquityEmerging
-2.60%
Market EquityEmerging
-2.19%
Market EquityEmerging
-14.92%
Market EquityEmerging
11.19%
Market EquityEmerging
37.28%
Market EquityEmerging
-14.57%
Market EquityEmerging
10.59%
High Yield
2.74%
High Yield
11.85%High Yield
1.87%
High Yield
-26.16%
High Yield
58.21%
High Yield
15.12%
High Yield
4.98%
High Yield
15.81%
High Yield
7.44%High Yield
2.45%
High Yield
-4.47%
High Yield
17.13%
High Yield
7.50%
High Yield
-2.08%
High Yield
9.94%
Real Estate
15.35%
Real Estate
42.12%
Real Estate
-7.39%
Real Estate
-48.21%
Real Estate
37.13%
Real Estate
19.63%
Real Estate
-6.46%
Real Estate
27.73%
Real Estate
3.67%
Real Estate
15.02%
Real Estate
-0.79%Real Estate
4.06%Real Estate
10.36%
Real Estate
-5.63%
Real Estate
14.51%
Fixed IncomeNon-U.S.
-8.65%
Fixed IncomeNon-U.S.
8.16%
Fixed IncomeNon-U.S.
11.03%
Fixed IncomeNon-U.S.
4.39%
Fixed IncomeNon-U.S.
7.53%
Fixed IncomeNon-U.S.
4.95%
Fixed IncomeNon-U.S.
4.36%
Fixed IncomeNon-U.S.
4.09%
Fixed IncomeNon-U.S.
-3.08%
Fixed IncomeNon-U.S.
-3.09%
Fixed IncomeNon-U.S.
-6.02%
Fixed IncomeNon-U.S.
1.49%
Fixed IncomeNon-U.S.
10.51%
Fixed IncomeNon-U.S.
-2.15%
Fixed IncomeNon-U.S.
4.99%
EquivalentCash
3.07%
EquivalentCash
4.85%
EquivalentCash
5.00%
EquivalentCash
2.06%
EquivalentCash
0.21%
EquivalentCash
0.13%
EquivalentCash
0.10%
EquivalentCash
0.11%
EquivalentCash
0.07%
EquivalentCash
0.03%
EquivalentCash
0.05%
EquivalentCash
0.33%
EquivalentCash
0.86%
EquivalentCash
1.87%
EquivalentCash
1.24%
2005 2006 2007 2008 2009 2010 2011 2012 2013 2014 2015 2016 2017 20182019
2 Qtrs.

8Oregon Investment CouncilKnowledge. Experience. Integrity.
OPERF Total Regular AccountPerformance Summary for the Second Quarter 2019Total Fund:
For the quarter ended June 30, 2019, the Total Regular Account rose 3.27% (+3.16% net of fees), lagging behind the 5.05% return of the Policy Benchmark,and ranked in the second quartile of Callan’s $10B+ public fund peer group. For the twelve months ended June, the Total Regular Account gained 7.00%(+6.54% net of fees), falling just short of the 7.2% return for the Policy Target, and ranked in the top third of Callan’s $10B+ public fund peer group. Longer termresults against the Policy Target are mixed; however, absolute returns are strong and peer group rankings are in the top quartile.
Asset Classes:
Total Fixed Income: The Fixed Income Portfolio added 3.03% (+3.00% net of fees) for the quarter versus a gain of 2.86% for the Custom Fixed IncomeBenchmark, and ranked in the 59th percentile of Callan’s Public Funds $10B+ US Fixed income (Gross) peer group. For the trailing year, the Portfolio rose7.39% (+7.24% net of fees), coming in ahead of the 7.15% return of the benchmark, and ranked in the 63th percentile of the peer group. 10 year resultswere ahead of the benchmark and ranked in the top quartile of the peer group.
Total Public Equity: Total Public Equity portfolio returned 3.33% (+3.27% net of fees) for the quarter versus 3.37% increase in the MSCI ACWI IMI Netbenchmark, and ranked in the 65th percentile of its peer group. For the trailing year, the portfolio rose 3.88% (+3.63% net of fees), trailing the 4.56% returnof the benchmark and ranked in the 66th percentile of peer group. 10 year returns remain well ahead of the benchmark though they trail the peer groupmedian.
● U.S. Equity: The U.S. Equity Portfolio increased 3.77% (+3.75% net of fees) for the quarter, lagging the Russell 3000 Index return of 4.10%, andranked in the 57th percentile of Callan’s Public Fund: $10B+ Domestic Equity (gross) peer group. On a trailing 12 month basis, the Portfolio gained5.38% (+5.30% net of fees) versus a return of 8.98% for the benchmark and ranked in the 81th percentile of the peer group. 10 year results of14.34% (+14.12% net of fees) trail the benchmark return of 14.67% and ranked in the 74th percentile of the peer group.
● International Equity: The International Equity Portfolio registered returns of 2.72% (+2.60% net of fees) for the quarter, essentially matching the2.74% return of the MSCI ACWI ex-U.S. IMI Index, and ranked in the 63th percentile of Callan’s Public Fund: $10B+ International Equity (gross) peergroup. For the trailing year, the Portfolio returned 0.80% (+0.39% net of fees) beating the benchmark return of 0.26%, and ranked in the 70thpercentile in the peer group. 10 year results remained comfortably ahead of the benchmark (+7.98% net of fees versus +6.78%) and continued torank in the top quartile of the peer group.
Total Real Estate: The Real Estate Portfolio continued to show competitive absolute results over the last decade with an annualized return of 10.03% net offees.
Opportunity Portfolio: The Opportunity Portfolio’s results over the last 10 years continue to be favorable with an annualized return of 10.60% net of fees.
Alternative Portfolio: The Alternative Portfolio returned 1.88% per annum net of fees over the last five years.
Total Private Equity: The Private Equity Portfolio’s returns remained strong with an annualized return of 14.54% net of fees over the last ten years.

9Oregon Investment CouncilKnowledge. Experience. Integrity.
OPERF Total Regular AccountAsset Allocation
*Interim policy target adopted January 1, 2019 **Strategic policy target adopted April 24, 2019 ***Totals provided by OST Staff
Actual Allocation as of 06/30/2019 Interim Policy Target*
Domestic Equity, 18.8%
International Equity, 18.8%
Fixed Income, 21.0%
Real Estate, 12.5%
Private Equity, 19.0%
Alternatives, 10.0%
***
Strategic Policy Target**
Domestic Equity, 16.3%
International Equity, 16.3%
Fixed Income, 20.0%
Real Estate, 12.5%
Private Equity, 17.5%
Alternatives, 15.0%
Risk Parity, 2.5%
Domestic Equity, 19.5%
International Equity, 15.5%
Fixed Income, 20.8%
Real Estate, 10.8%
Private Equity, 21.6%
Opportunity, 2.2%
Alternatives, 9.6%
Cash, 0.0%
$000s Weight Percent $000sAsset Class Actual Actual Target Dif f erence Dif f erenceTotal Fixed Income 15,962,777 20.8% 21.0% (0.2%) (125,789)U.S. Equity Portf olio 14,916,106 19.5% 18.8% 0.7% 551,314Non-U.S. Equity Portf olio 11,867,444 15.5% 18.8% (3.3%) (2,497,348)Total Real Estate 8,291,318 10.8% 12.5% (1.7%) (1,285,210)Opportunity Portf olio 1,705,836 2.2% 0.0% 2.2% 1,705,836Alternativ e Portf olio 7,329,823 9.6% 10.0% (0.4%) (331,400)Total Priv ate Equity 16,516,650 21.6% 19.0% 2.6% 1,960,328Cash 22,270 0.0% 0.0% 0.0% 22,270Total 76,612,224 100.0% 100.0%

10Oregon Investment CouncilKnowledge. Experience. Integrity.
OPERF Total Regular AccountNet Cumulative Performance by Asset Class as of June 30, 2019
*Current Policy Benchmark = 37.5%, MSCI ACWI IMI, 21.0% OPERF Custom Total FI Benchmark, 19.0% Russell 3000 + 300 bps Qtr Lag, 12.5% Oregon Custom Real Estate Benchmark and 10.0% CPI + 400 bpsTarget 12/18= 39.0%, MSCI ACWI IMI, 22.0% OPERF Custom Total FI Benchmark, 19.0% Russell 3000 + 300 bps Qtr Lag, 12.5% Oregon Custom Real Estate Benchmark and 7.5% CPI + 400 bps
Last Quarter Last Year Last 3 Years Last 5 Years Last 10 YearsTotal Regular Account 3.16% 6.54% 9.34% 6.65% 10.17%Total Regular Account ex-Overlay 3.12% 6.27% 9.20% 6.53% 9.99%OPERF Policy Benchmark* 5.05% 7.21% 9.78% 7.23% 10.33%
Total Fixed Income 3.00% 7.24% 2.97% 2.80% 5.69%Custom FI Benchmark 2.86% 7.15% 2.55% 2.54% 4.05%Callan Public Fund > $10bn U.S. Fixed 3.08% 7.67% 3.23% 3.28% 4.72%
Total Public Equity 3.27% 3.63% 11.70% 6.28% 10.88%MSCI ACWI IMI Net 3.37% 4.56% 11.42% 6.03% 10.32%
U.S. Equity Portfolio 3.75% 5.30% 13.19% 9.09% 14.12%Russell 3000 Index 4.10% 8.98% 14.02% 10.19% 14.67%Callan Large Public > $10bn U.S. Equity 3.98% 7.61% 13.93% 9.94% 14.64%
Non-U.S. Equity Portfolio 2.60% 0.39% 9.79% 3.34% 7.98%MSCI ACWI ex-US IMI Index** 2.74% 0.26% 9.17% 2.25% 6.78%Callan Large Public > $10bn Non-U.S. Equity 2.97% 1.18% 9.81% 3.31% 7.82%
Total Real Estate 1.04% 5.85% 7.59% 9.12% 10.03%Total Real Estate ex REITs 1.52% 5.99% 8.99% 10.39% 9.23%Oregon Custom Real Estate Benchmark 1.20% 6.55% 7.01% 9.03% 8.46%Callan Public Plan - Real Estate 1.65% 7.10% 7.71% 9.32% 10.48%
Opportunity Portfolio 0.55% 3.55% 6.65% 4.49% 10.60%Russell 3000 Index 4.10% 8.98% 14.02% 10.19% 14.67%CPI + 5% 2.00% 6.45% 7.01% 6.25% 6.71%
Alternative Portfolio -0.08% -2.65% 4.13% 1.88% -CPI + 4% 1.75% 5.71% 6.12% 5.51% -
Total Private Equity 5.89% 15.03% 15.11% 11.80% 14.54%OIC - Russell 3000 + 300 BPS Qtr Lag 14.85% 12.01% 16.86% 13.64% 19.38%
11Oregon Investment CouncilKnowledge. Experience. Integrity.
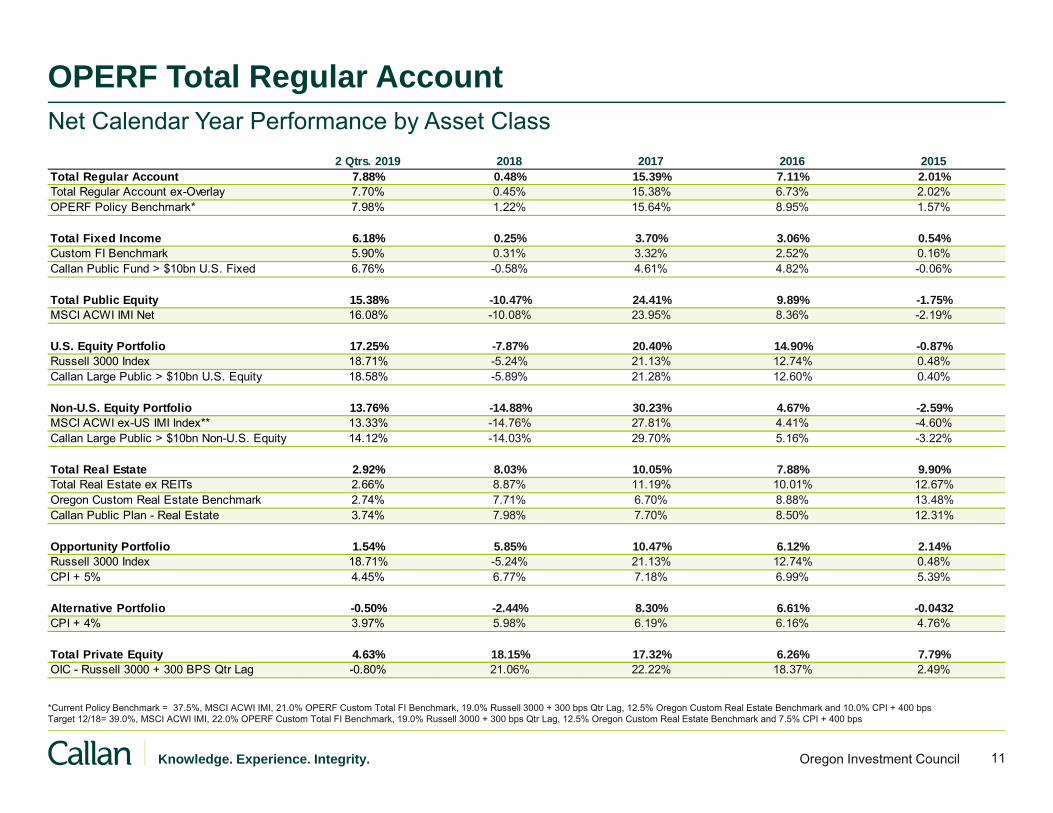
OPERF Total Regular AccountNet Calendar Year Performance by Asset Class
2 Qtrs. 2019 2018 2017 2016 2015Total Regular Account 7.88% 0.48% 15.39% 7.11% 2.01%Total Regular Account ex-Overlay 7.70% 0.45% 15.38% 6.73% 2.02%OPERF Policy Benchmark* 7.98% 1.22% 15.64% 8.95% 1.57%
Total Fixed Income 6.18% 0.25% 3.70% 3.06% 0.54%Custom FI Benchmark 5.90% 0.31% 3.32% 2.52% 0.16%Callan Public Fund > $10bn U.S. Fixed 6.76% -0.58% 4.61% 4.82% -0.06%
Total Public Equity 15.38% -10.47% 24.41% 9.89% -1.75%MSCI ACWI IMI Net 16.08% -10.08% 23.95% 8.36% -2.19%
U.S. Equity Portfolio 17.25% -7.87% 20.40% 14.90% -0.87%Russell 3000 Index 18.71% -5.24% 21.13% 12.74% 0.48%Callan Large Public > $10bn U.S. Equity 18.58% -5.89% 21.28% 12.60% 0.40%
Non-U.S. Equity Portfolio 13.76% -14.88% 30.23% 4.67% -2.59%MSCI ACWI ex-US IMI Index** 13.33% -14.76% 27.81% 4.41% -4.60%Callan Large Public > $10bn Non-U.S. Equity 14.12% -14.03% 29.70% 5.16% -3.22%
Total Real Estate 2.92% 8.03% 10.05% 7.88% 9.90%Total Real Estate ex REITs 2.66% 8.87% 11.19% 10.01% 12.67%Oregon Custom Real Estate Benchmark 2.74% 7.71% 6.70% 8.88% 13.48%Callan Public Plan - Real Estate 3.74% 7.98% 7.70% 8.50% 12.31%
Opportunity Portfolio 1.54% 5.85% 10.47% 6.12% 2.14%Russell 3000 Index 18.71% -5.24% 21.13% 12.74% 0.48%CPI + 5% 4.45% 6.77% 7.18% 6.99% 5.39%
Alternative Portfolio -0.50% -2.44% 8.30% 6.61% -0.0432CPI + 4% 3.97% 5.98% 6.19% 6.16% 4.76%
Total Private Equity 4.63% 18.15% 17.32% 6.26% 7.79%OIC - Russell 3000 + 300 BPS Qtr Lag -0.80% 21.06% 22.22% 18.37% 2.49%
*Current Policy Benchmark = 37.5%, MSCI ACWI IMI, 21.0% OPERF Custom Total FI Benchmark, 19.0% Russell 3000 + 300 bps Qtr Lag, 12.5% Oregon Custom Real Estate Benchmark and 10.0% CPI + 400 bpsTarget 12/18= 39.0%, MSCI ACWI IMI, 22.0% OPERF Custom Total FI Benchmark, 19.0% Russell 3000 + 300 bps Qtr Lag, 12.5% Oregon Custom Real Estate Benchmark and 7.5% CPI + 400 bps
12Oregon Investment CouncilKnowledge. Experience. Integrity.
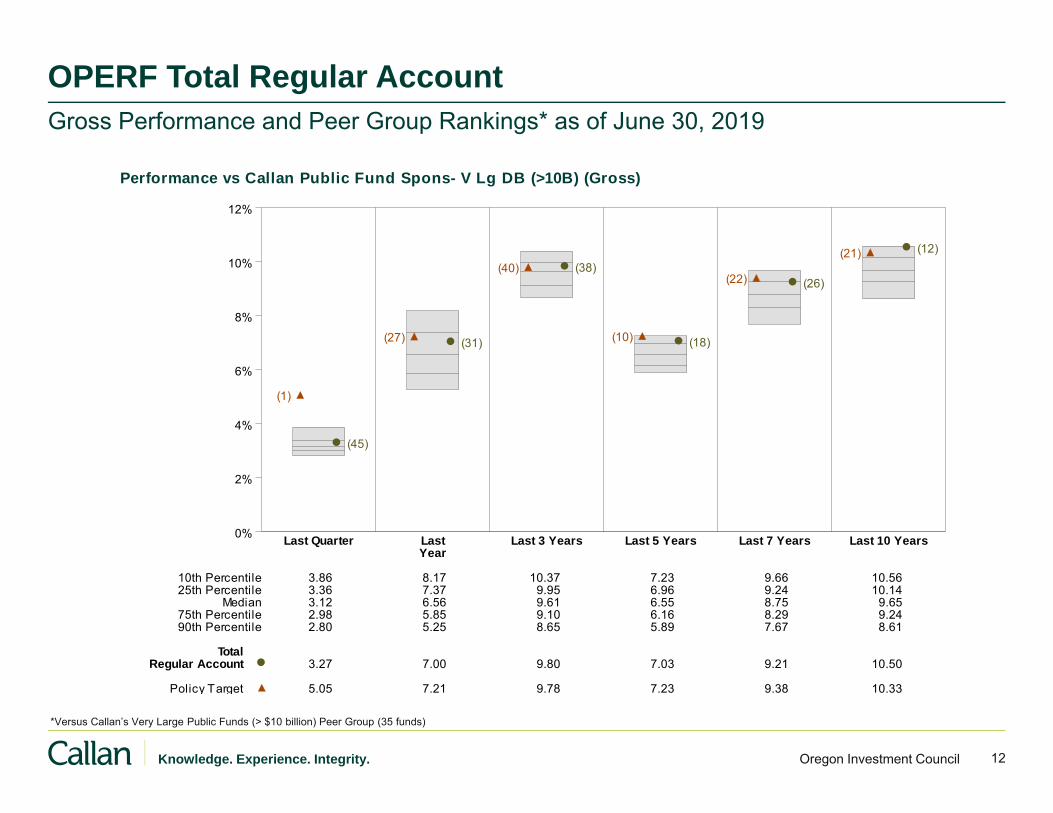
OPERF Total Regular AccountGross Performance and Peer Group Rankings* as of June 30, 2019
*Versus Callan’s Very Large Public Funds (> $10 billion) Peer Group (35 funds)
Performance vs Callan Public Fund Spons- V Lg DB (>10B) (Gross)
0%
2%
4%
6%
8%
10%
12%
Last Quarter Last Last 3 Years Last 5 Years Last 7 Years Last 10 YearsYear
(45)
(1)
(31)(27)
(38)(40)
(18)(10)
(26)(22)
(12)(21)
10th Percentile 3.86 8.17 10.37 7.23 9.66 10.5625th Percentile 3.36 7.37 9.95 6.96 9.24 10.14
Median 3.12 6.56 9.61 6.55 8.75 9.6575th Percentile 2.98 5.85 9.10 6.16 8.29 9.2490th Percentile 2.80 5.25 8.65 5.89 7.67 8.61
TotalRegular Account 3.27 7.00 9.80 7.03 9.21 10.50
Policy Target 5.05 7.21 9.78 7.23 9.38 10.33

13Oregon Investment CouncilKnowledge. Experience. Integrity.
OPERF Rolling 10 Year Returns and Rankings
2009 2010 2011 2012 2013 2014 2015 2016 2017 2018 20190.0
2.5
5.0
7.5
10.0
12.5
for 10 Years Ended June 30, 2019Rolling 40 Quarter Gross of Fee Returns
Ret
urns
Callan Public Fund Spons- V Lg DB (>10B)
OIC - Total Regular Account
9
7
914
15
10
7
8 6 6
6
74
6
5
5
5
43
4
4 4
6
9 9
8 12
17
15 14
16
19
18
1820
23 21
18
9
9
12

14Oregon Investment CouncilKnowledge. Experience. Integrity.
OPERF Total Regular AccountRisk vs Return
Callan Public Fund Spons- V Lg DB (>10B) (Gross)Annualized Ten Year Risk vs Return
4 5 6 7 8 9 10 117.5%
8.0%
8.5%
9.0%
9.5%
10.0%
10.5%
11.0%
11.5%
Total Policy Target
Total Regular Account
Standard Dev iation
Ret
urns
0%
2%
4%
6%
8%
10%
12%
Standard Downside TrackingDev iation Risk Error
(83)
(98) (98)
10th Percentile 9.16 3.11 4.2025th Percentile 8.38 2.52 3.36
Median 7.72 2.02 3.0675th Percentile 6.99 1.81 2.5790th Percentile 6.08 1.45 2.13
TotalRegular Account 6.56 0.99 1.49
Risk Statistics Rankings vs Policy TargetRankings Against Callan Public Fund Spons- V Lg DB (>10B) (Gross)Ten Years Ended June 30, 2019

15Oregon Investment CouncilKnowledge. Experience. Integrity.
Total Fund Consistency
Rolling Three Year Return(%) Relative to Policy TargetTen Years Ended June 30, 2019
Ret
urn(
%)
-10
-5
0
5
10
15
20
25
09 2010 2011 2012 2013 2014 2015 2016 2017 2018 2019
Total Regular Account
Rolling Three Year Sharpe Ratio Relative to Policy TargetTen Years Ended June 30, 2019
Sha
rpe
Rat
io
-2
-1
0
1
2
3
4
5
09 2010 2011 2012 2013 2014 2015 2016 2017 2018 2019
Total Regular Account
Rolling Three Year Period Analysis Median PortfolioAv erage Annual Return(%) 7.04% 7.56%% Positiv e Periods 85% 85%Av erage Ranking 50 32
Rolling Three Year Period Analysis Median PortfolioAv erage Annual Sharpe Ratio 1.04% 1.43%% Positiv e Periods 85% 85%Av erage Ranking 50 14
Appendix

17Knowledge. Experience. Integrity. Oregon Investment Council
U.S. Equity Performance: Reaching for Record Highs
Russell 3000Russell 1000
Russell 1000 GrowthRussell 1000 Value
S&P 500Russell Midcap
Russell 2500Russell 2000
U.S. Equity: Quarterly Returns
4.1%4.2%
4.6%3.8%
4.3%4.1%
3.0%2.1%
U.S. Equity: One-Year Returns
Russell 3000Russell 1000
Russell 1000 GrowthRussell 1000 Value
S&P 500Russell Midcap
Russell 2500Russell 2000
9.0%10.0%
11.6%8.5%
10.4%7.8%
1.8%-3.3%
Markets rebounded, continue to march upward– U.S. equity markets neared record highs as market participants
anticipated another round of Fed easing. – Cyclicals outperformed while Financials was the best-performing
sector; Energy was the only sector to experience negative returns over the quarter.
– Trade rhetoric weighed on U.S. stocks in May followed by a rebound.
– Given the increase in risk appetite, defensive sectors including Utilities underperformed.
Growth outpaced value– Growth continued to outpace value.– Increasingly dovish Fed a headwind for the valuation sensitive
stocks.
Small cap stocks lagged large caps
Sources: FTSE Russell, Standard & Poor’s
Economic Sector Quarterly Performance (S&P 500)
Last Quarter
4.5% 5.3%3.7%
-2.8%
8.0%
1.4%
6.1%3.6%
6.3%
2.5% 3.5%
ServicesCommunication
DiscretionaryConsumer
StaplesConsumer Energy Financials Health Care Industrials
TechnologyInformation Materials Real Estate Utilities
18Knowledge. Experience. Integrity. Oregon Investment Council
Non-U.S. Equity Performance
MSCI EAFEMSCI ACWIMSCI World
MSCI ACWI ex USAMSCI World ex USA
MSCI ACWI ex US Small CapMSCI World ex US Small Cap
MSCI Europe ex UKMSCI UK
MSCI Pacific ex JapanMSCI Japan
MSCI Emerging MarketsMSCI China
MSCI Frontier Markets
Global Equity: Quarterly Returns
3.7%3.6%
4.0%3.0%
3.8%1.2%
1.8%5.8%
0.9%5.2%
1.0%0.6%
-4.0%4.7%
MSCI EAFEMSCI ACWIMSCI World
MSCI ACWI ex USAMSCI World ex USA
MSCI ACWI ex US Small CapMSCI World ex US Small Cap
MSCI Europe ex UKMSCI UK
MSCI Pacific ex JapanMSCI Japan
MSCI Emerging MarketsMSCI China
MSCI Frontier Markets
Global Equity: Annual Returns
1.1%5.7%
6.3%1.3%1.3%
-5.9%-6.2%
3.4%-2.0%
8.1%-4.2%
1.2%-6.7%
4.9%
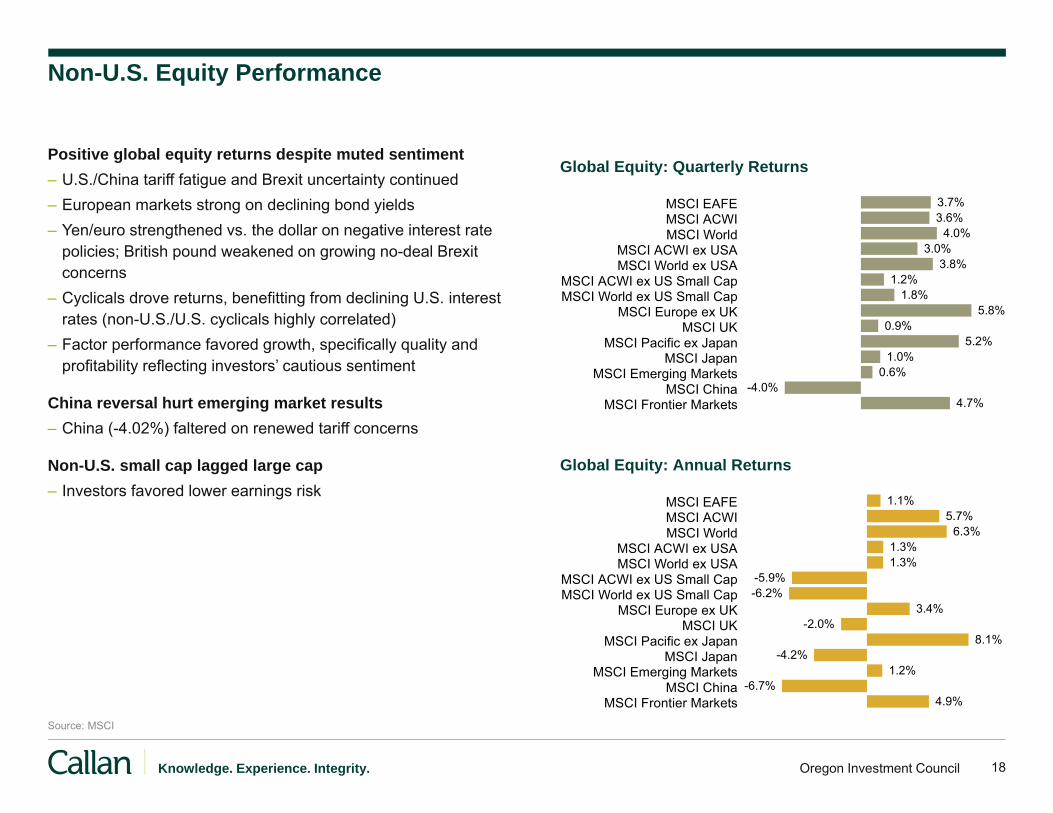
Positive global equity returns despite muted sentiment– U.S./China tariff fatigue and Brexit uncertainty continued– European markets strong on declining bond yields– Yen/euro strengthened vs. the dollar on negative interest rate
policies; British pound weakened on growing no-deal Brexit concerns
– Cyclicals drove returns, benefitting from declining U.S. interest rates (non-U.S./U.S. cyclicals highly correlated)
– Factor performance favored growth, specifically quality and profitability reflecting investors’ cautious sentiment
China reversal hurt emerging market results – China (-4.02%) faltered on renewed tariff concerns
Non-U.S. small cap lagged large cap– Investors favored lower earnings risk
Source: MSCI

19Knowledge. Experience. Integrity. Oregon Investment Council
Trade War With China
Exports to China have fallen by 20%, imports are down by more than 10% (top chart)
– However, decline in exports subtracted less than 0.1% from U.S. GDP in Q1 2019.
Threatened tariffs could reduce GDP by 0.2% in second half of 2019 and another 0.2% in first half of 2020
– Analysis assumes 10% tariff in 2019, rising to 25% in 2020.
– Chart depicts cumulative impact on GDP growth through Q2 2020 is less than 1%.
– Larger impact is on business confidence and investor sentiment.
Substantial impact on trade, but small impact on U.S. GDP
Sources: Capital Economics; IHS Markit
U.S. Bilateral Trade With China (3 month average, % change y/y)
U.S. Tariffs on China ($B and % of GDP)

20Knowledge. Experience. Integrity. Oregon Investment Council
Trade Matters, but More to U.S. Trading Partners
Trade and trade policy dominate headlines in 2019, but impact of trade in the U.S. is far lower than in Europe and many other developed markets– Trade-to-GDP ratio is the sum of exports
and imports as a % of GDP. Exports and imports include both goods and services.
– Trade has become a larger component of U.S. GDP over time.– U.S. exports have gradually risen from 7%
in 1985 to 11.9% in 2017, while imports rose from 9% to 14.7%.
– Trade activity now involves 26.6% of U.S. GDP.
– By comparison, trade accounts for 37.8% of China GDP, and well over half of GDP in Europe and Mexico.
Exports, imports, and trade-to-GDP ratio in 2017
Source: World Bank
Exports (% of GDP)
Imports (% of GDP) Trade-to-GDP Ratio
Germany 47.2% 39.7% 86.9%
Mexico 37.9% 39.7% 77.6%
Canada 30.9% 33.2% 64.1%
France 30.9% 32.0% 62.9%
U.K. 30.5% 31.9% 62.4%
Italy 31.3% 28.2% 59.5%
Russia 26.0% 20.7% 46.7%
China 19.8% 18.0% 37.8%
Japan 16.1% 15.1% 31.2%
U.S. 11.9% 14.7% 26.6%

21Knowledge. Experience. Integrity. Oregon Investment Council
U.S. Fixed Income Performance
Blmberg Barclays Gov/Cr 1-3 Yr
Blmberg Barclays Interm Gov/Cr
Blmberg Barclays Aggregate
Blmberg Barclays Long Gov/Cr
Blmberg Barclays Universal
CS Leveraged Loans
Blmberg Barclays High Yield
Blmberg Barclays TIPS
U.S. Fixed Income: Quarterly Returns
3.1%
3.1%
1.5%
2.6%
6.6%
1.6%
2.5%
2.9%
Blmberg Barclays Gov/Cr 1-3 Yr
Blmberg Barclays Interm Gov/Cr
Blmberg Barclays Aggregate
Blmberg Barclays Long Gov/Cr
Blmberg Barclays Universal
CS Leveraged Loans
Blmberg Barclays High Yield
Blmberg Barclays TIPS
U.S. Fixed Income: Annual Returns
7.9%
8.1%
4.3%
6.9%
13.8%
4.1%
7.5%
4.8%
Bonds rally on dovish Fed comments– Fed policy and comments to “sustain the expansion” caused risk
assets and U.S. Treasuries to rally. – Treasuries rose +3.01% as yield curve shifted lower across
maturities given expectations for Fed to ease.– The overall shape of the yield curve did not materially change
during the quarter.– High yield corporates posted positive results but underperformed
investment grade corporates, primarily due to the longer duration of the investment grade sector.
Bank Loans participated but to lesser degree– Bank loans participated in rally, but lagged IG and HY corporates
as interest rates declined.– Bank loans have less sensitivity to interest rates, but may have a
spread duration profile similar to that of high yield bonds.– Retail outflows remain unabated as the Fed’s dovish tone
dampened enthusiasm for floating rate assets.
Sources: Bloomberg Barclays, Credit Suisse

22Oregon Investment CouncilKnowledge. Experience. Integrity.
Disclaimers
Information contained herein is the confidential and proprietary information of Callan and should not be used other than by the intended recipient for its intended purpose or disseminated to any other person without Callan’s permission.
This report was prepared by Callan for use by a specific client and should not be used by anyone other than the intended recipient for its intended purpose. The content of this report is based on the particular needs of such client and may not be applicable to the specific facts and circumstances of any other individual or entity.
Certain information herein has been compiled by Callan and is based on information provided by a variety of sources believed to be reliable for which Callan has not necessarily verified the accuracy or completeness of or updated.
This content is for informational purposes only and should not be construed as legal or tax advice on any matter. Any decision you make on the basis of this content is your sole responsibility. You should consult with legal and tax advisers before applying any of this information to your particular situation.
This content may consist of statements of opinion, which are made as of the date they are expressed and are not statements of fact.
Reference to or inclusion in this report of any product, service or entity should not be construed as a recommendation, approval, affiliation or endorsement of such product, service or entity by Callan.
22

OPERF Risk Dashboard2019 Q2
September 18, 2019

Allocation & Risk Contribution by Asset Class
0
10
20
30
40
50
60
70
80
Jun 28, 2019
Allocation in $B
Equity Fixed Income
Alternatives Portfolio Opportunity Portfolio
Private Equity Real Estate
Cash Overlay
0%
1%
2%
3%
4%
5%
6%
7%
8%
9%
10%
Jun 28, 2019
Risk Contribution
Equity Fixed Income
Alternatives Portfolio Opportunity Portfolio
Private Equity Real Estate
Cash Overlay
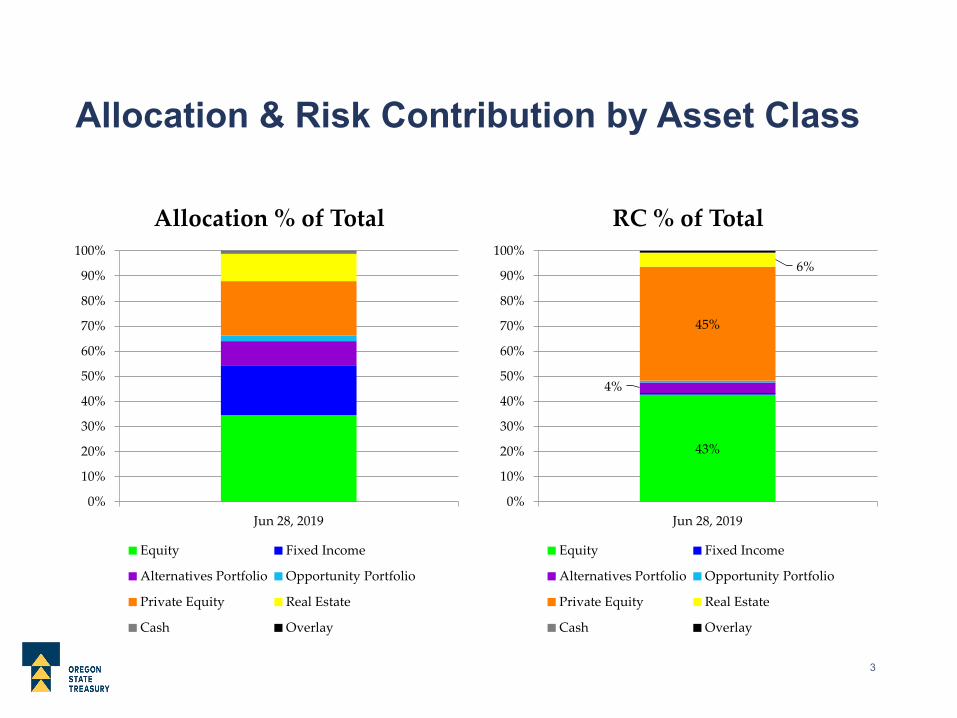
Allocation & Risk Contribution by Asset Class
0%
10%
20%
30%
40%
50%
60%
70%
80%
90%
100%
Jun 28, 2019
Allocation % of Total
Equity Fixed Income
Alternatives Portfolio Opportunity Portfolio
Private Equity Real Estate
Cash Overlay
43%
4%
45%
6%
0%
10%
20%
30%
40%
50%
60%
70%
80%
90%
100%
Jun 28, 2019
RC % of Total
Equity Fixed Income
Alternatives Portfolio Opportunity Portfolio
Private Equity Real Estate
Cash Overlay
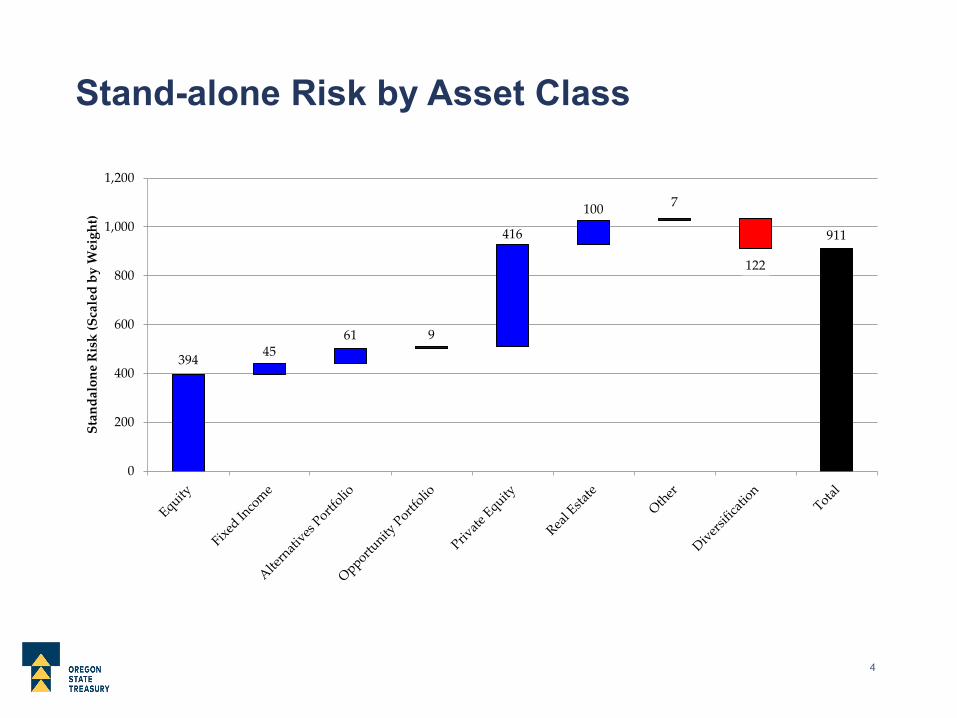
Stand-alone Risk by Asset Class
394 4561 9
416
100 7
122
911
0
200
400
600
800
1,000
1,200
Stan
dalo
ne R
isk
(Sca
led
by W
eigh
t)

14-Quarter Risk Contribution Time Series
-4
0
4
8
12
16
20
24
28
-2%
0%
2%
4%
6%
8%
10%
12%
14%
2016 Q1 2016 Q2 2016 Q3 2016 Q4 2017 Q1 2017 Q2 2017 Q3 2017 Q4 2018 Q1 2018 Q2 2018 Q3 2018 Q4 2019 Q1 2019 Q2
VIX Index Level
Risk
Con
trib
utio
n
Equity Fixed Income Alternatives Portfolio
Opportunity Portfolio Private Equity Real Estate
Other Total VIX (Option Implied Vol)

14-Quarter Risk Contribution Time Series
-10%
0%
10%
20%
30%
40%
50%
60%
2016 Q1 2016 Q2 2016 Q3 2016 Q4 2017 Q1 2017 Q2 2017 Q3 2017 Q4 2018 Q1 2018 Q2 2018 Q3 2018 Q4 2019 Q1 2019 Q2
Risk
Con
trib
utio
n (%
of T
otal
)
Equity Fixed Income Alternatives Portfolio Opportunity Portfolio Private Equity Real Estate Other
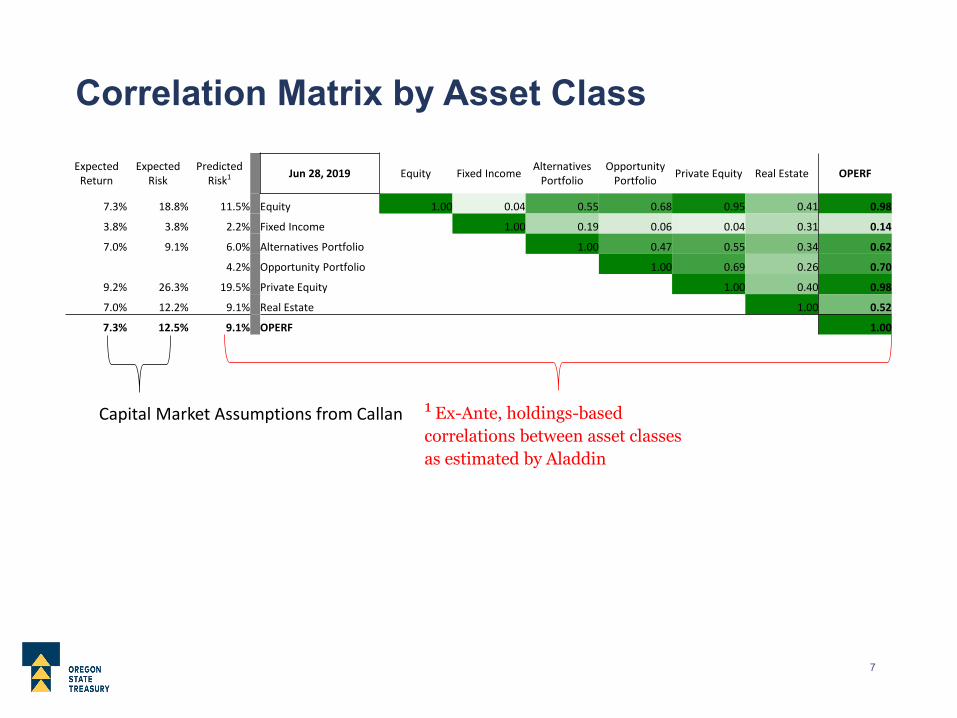
Correlation Matrix by Asset Class
1 Ex-Ante, holdings-based correlations between asset classes as estimated by Aladdin
Capital Market Assumptions from Callan
Expected Return
Expected Risk
Predicted Risk1 Jun 28, 2019 Equity Fixed Income Alternatives
PortfolioOpportunity
Portfolio Private Equity Real Estate OPERF
7.3% 18.8% 11.5% Equity 1.00 0.04 0.55 0.68 0.95 0.41 0.98
3.8% 3.8% 2.2% Fixed Income 1.00 0.19 0.06 0.04 0.31 0.14
7.0% 9.1% 6.0% Alternatives Portfolio 1.00 0.47 0.55 0.34 0.62
4.2% Opportunity Portfolio 1.00 0.69 0.26 0.70
9.2% 26.3% 19.5% Private Equity 1.00 0.40 0.98
7.0% 12.2% 9.1% Real Estate 1.00 0.52
7.3% 12.5% 9.1% OPERF 1.00

35%
21%
10%
2%
22%
11%
0%0%
5%
10%
15%
20%
25%
30%
35%
40%
45%
50%
Equity Fixed Income AlternativesPortfolio
OpportunityPortfolio
Private Equity Real Estate Risk Parity
Perc
ent W
eigh
t of O
PER
FOPERF Allocations
Private Equity’s Q2 2019 weight in OPERF was 21.7%, exceeding the 21% upper limit of policy range.

Liquidity Report
Table periods approximate the time required to liquidate different OPERF allocations.
Liquidity ($M)
Asset Class 1 Week 1 Month 1 Quarter ∞ Uncalled Commitment
Next 12 Months
Cash & Overlay 1,268Public Equity 23,409 1,843 567 567Fixed Income 12,530 2,578Private Equity 16,517 -10,550Real Estate 607 7,692 -1,703Alternatives 1,069 1,245 985 4,033 -3,322Opportunity 354 236 1,115 -718Proj PERS Cash Flow -3,600Total 39,238 5,666 1,789 29,924 -16,292 -3,600
Public Equity - 1 Month = AQR 130/30, Arrowstreet 130/30, & Callan US Micro Cap Value portfoliosPublic Equity - 1 Quarter = 50% Lazard Closed-End Fund portfolioPublic Equity - ∞ = 50% Lazard Closed-End Fund portfolioFixed Income - 1 Month = Below Investment GradeReal Estate - 1 Week = REIT composite
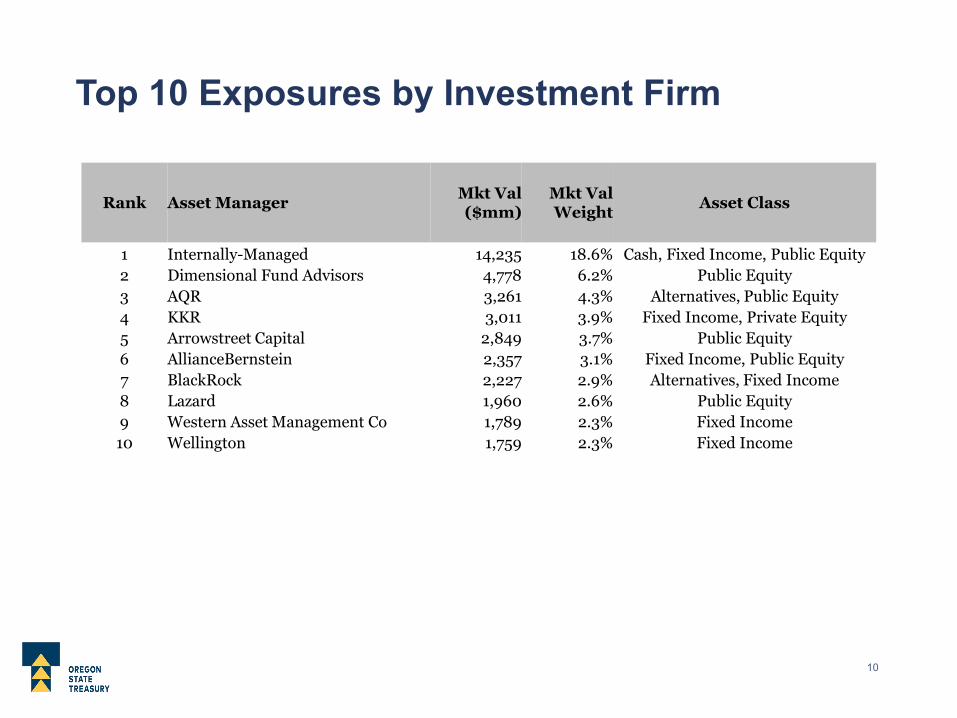
Top 10 Exposures by Investment Firm
Rank Asset Manager Mkt Val ($mm)
Mkt Val Weight Asset Class
1 Internally-Managed 14,235 18.6% Cash, Fixed Income, Public Equity2 Dimensional Fund Advisors 4,778 6.2% Public Equity3 AQR 3,261 4.3% Alternatives, Public Equity4 KKR 3,011 3.9% Fixed Income, Private Equity5 Arrowstreet Capital 2,849 3.7% Public Equity6 AllianceBernstein 2,357 3.1% Fixed Income, Public Equity7 BlackRock 2,227 2.9% Alternatives, Fixed Income8 Lazard 1,960 2.6% Public Equity9 Western Asset Management Co 1,789 2.3% Fixed Income10 Wellington 1,759 2.3% Fixed Income
Expanded Correlation Matrix
• Aladdin estimates risk for every investment held by OPERF.• Staff has a higher degree of confidence in risk estimates for publicly-
traded securities in separate accounts (i.e., most of Capital Markets and REITs) as the risk model is “trained” using daily returns of individual securities.
• Illiquid investments without frequent pricing (i.e., most of the investments comprising the Alternatives Program) are proxied.
• While an overly-granular analysis may be noisy, looking below the asset class level to OPERF’s “sleeve-level” exposures may be informative.
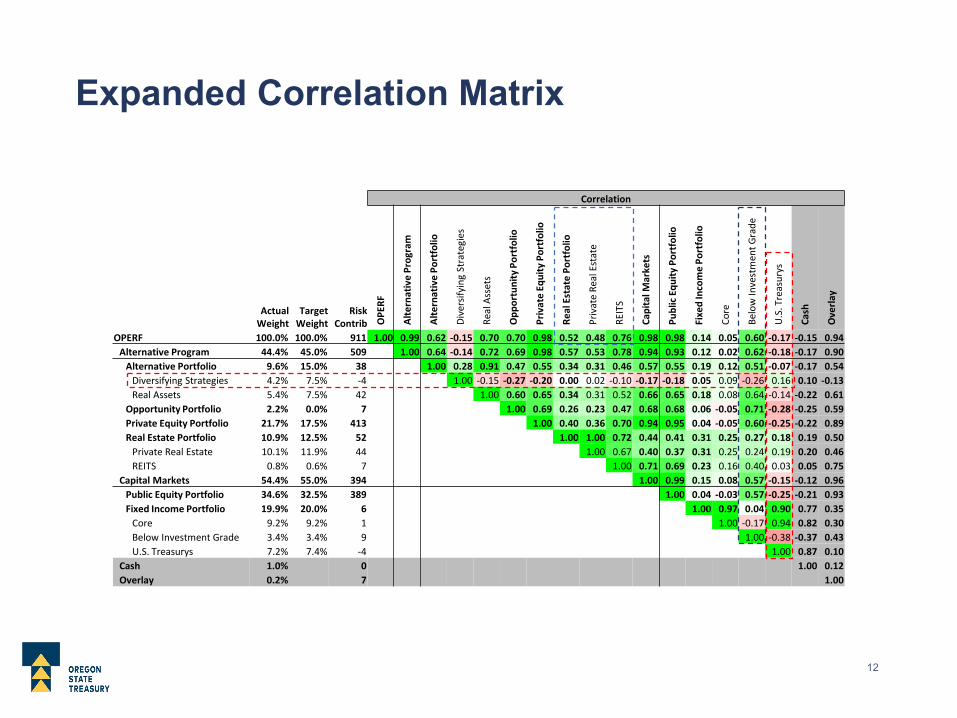
Expanded Correlation Matrix
Correlation
Actual Weight
Target Weight
Risk Contrib O
PERF
Alte
rnat
ive
Prog
ram
Alte
rnat
ive
Port
folio
Dive
rsify
ing
Stra
tegi
es
Real
Ass
ets
Opp
ortu
nity
Por
tfol
io
Priv
ate
Equi
ty P
ortf
olio
Real
Est
ate
Port
folio
Priv
ate
Real
Est
ate
REIT
S
Capi
tal M
arke
ts
Publ
ic E
quity
Por
tfol
io
Fixe
d In
com
e Po
rtfo
lio
Core
Belo
w In
vest
men
t Gra
de
U.S
. Tre
asur
ys
Cash
Ove
rlay
OPERF 100.0% 100.0% 911 1.00 0.99 0.62 -0.15 0.70 0.70 0.98 0.52 0.48 0.76 0.98 0.98 0.14 0.05 0.60 -0.17 -0.15 0.94Alternative Program 44.4% 45.0% 509 1.00 0.64 -0.14 0.72 0.69 0.98 0.57 0.53 0.78 0.94 0.93 0.12 0.02 0.62 -0.18 -0.17 0.90
Alternative Portfolio 9.6% 15.0% 38 1.00 0.28 0.91 0.47 0.55 0.34 0.31 0.46 0.57 0.55 0.19 0.12 0.51 -0.07 -0.17 0.54Diversifying Strategies 4.2% 7.5% -4 1.00 -0.15 -0.27 -0.20 0.00 0.02 -0.10 -0.17 -0.18 0.05 0.09 -0.26 0.16 0.10 -0.13Real Assets 5.4% 7.5% 42 1.00 0.60 0.65 0.34 0.31 0.52 0.66 0.65 0.18 0.08 0.64 -0.14 -0.22 0.61
Opportunity Portfolio 2.2% 0.0% 7 1.00 0.69 0.26 0.23 0.47 0.68 0.68 0.06 -0.05 0.71 -0.28 -0.25 0.59Private Equity Portfolio 21.7% 17.5% 413 1.00 0.40 0.36 0.70 0.94 0.95 0.04 -0.05 0.60 -0.25 -0.22 0.89Real Estate Portfolio 10.9% 12.5% 52 1.00 1.00 0.72 0.44 0.41 0.31 0.25 0.27 0.18 0.19 0.50
Private Real Estate 10.1% 11.9% 44 1.00 0.67 0.40 0.37 0.31 0.25 0.24 0.19 0.20 0.46REITS 0.8% 0.6% 7 1.00 0.71 0.69 0.23 0.16 0.40 0.03 0.05 0.75
Capital Markets 54.4% 55.0% 394 1.00 0.99 0.15 0.08 0.57 -0.15 -0.12 0.96Public Equity Portfolio 34.6% 32.5% 389 1.00 0.04 -0.03 0.57 -0.25 -0.21 0.93Fixed Income Portfolio 19.9% 20.0% 6 1.00 0.97 0.04 0.90 0.77 0.35
Core 9.2% 9.2% 1 1.00 -0.17 0.94 0.82 0.30Below Investment Grade 3.4% 3.4% 9 1.00 -0.38 -0.37 0.43U.S. Treasurys 7.2% 7.4% -4 1.00 0.87 0.10
Cash 1.0% 0 1.00 0.12Overlay 0.2% 7 1.00

Diversifying Strategies & U.S. Treasury Sleeves
Correlation
Actual Weight
Target Weight
Risk Contrib O
PERF
Alte
rnat
ive
Prog
ram
Alte
rnat
ive
Port
folio
Dive
rsify
ing
Stra
tegi
es
Real
Ass
ets
Opp
ortu
nity
Por
tfol
io
Priv
ate
Equi
ty P
ortf
olio
Real
Est
ate
Port
folio
Priv
ate
Real
Est
ate
REIT
S
Capi
tal M
arke
ts
Publ
ic E
quity
Por
tfol
io
Fixe
d In
com
e Po
rtfo
lio
Core
Belo
w In
vest
men
t Gra
de
U.S
. Tre
asur
ys
Cash
Ove
rlay
OPERF 100.0% 100.0% 911 1.00 0.99 0.62 -0.15 0.70 0.70 0.98 0.52 0.48 0.76 0.98 0.98 0.14 0.05 0.60 -0.17 -0.15 0.94Alternative Program 44.4% 45.0% 509 1.00 0.64 -0.14 0.72 0.69 0.98 0.57 0.53 0.78 0.94 0.93 0.12 0.02 0.62 -0.18 -0.17 0.90
Alternative Portfolio 9.6% 15.0% 38 1.00 0.28 0.91 0.47 0.55 0.34 0.31 0.46 0.57 0.55 0.19 0.12 0.51 -0.07 -0.17 0.54Diversifying Strategies 4.2% 7.5% -4 1.00 -0.15 -0.27 -0.20 0.00 0.02 -0.10 -0.17 -0.18 0.05 0.09 -0.26 0.16 0.10 -0.13Real Assets 5.4% 7.5% 42 1.00 0.60 0.65 0.34 0.31 0.52 0.66 0.65 0.18 0.08 0.64 -0.14 -0.22 0.61
Opportunity Portfolio 2.2% 0.0% 7 1.00 0.69 0.26 0.23 0.47 0.68 0.68 0.06 -0.05 0.71 -0.28 -0.25 0.59Private Equity Portfolio 21.7% 17.5% 413 1.00 0.40 0.36 0.70 0.94 0.95 0.04 -0.05 0.60 -0.25 -0.22 0.89Real Estate Portfolio 10.9% 12.5% 52 1.00 1.00 0.72 0.44 0.41 0.31 0.25 0.27 0.18 0.19 0.50
Private Real Estate 10.1% 11.9% 44 1.00 0.67 0.40 0.37 0.31 0.25 0.24 0.19 0.20 0.46REITS 0.8% 0.6% 7 1.00 0.71 0.69 0.23 0.16 0.40 0.03 0.05 0.75
Capital Markets 54.4% 55.0% 394 1.00 0.99 0.15 0.08 0.57 -0.15 -0.12 0.96Public Equity Portfolio 34.6% 32.5% 389 1.00 0.04 -0.03 0.57 -0.25 -0.21 0.93Fixed Income Portfolio 19.9% 20.0% 6 1.00 0.97 0.04 0.90 0.77 0.35
Core 9.2% 9.2% 1 1.00 -0.17 0.94 0.82 0.30Below Investment Grade 3.4% 3.4% 9 1.00 -0.38 -0.37 0.43U.S. Treasurys 7.2% 7.4% -4 1.00 0.87 0.10
Cash 1.0% 0 1.00 0.12Overlay 0.2% 7 1.00
Both of these sleeve-level exposures diversify OPERF’s predicted risk (i.e., they both exhibit low to negative correlation & negative risk contribution).
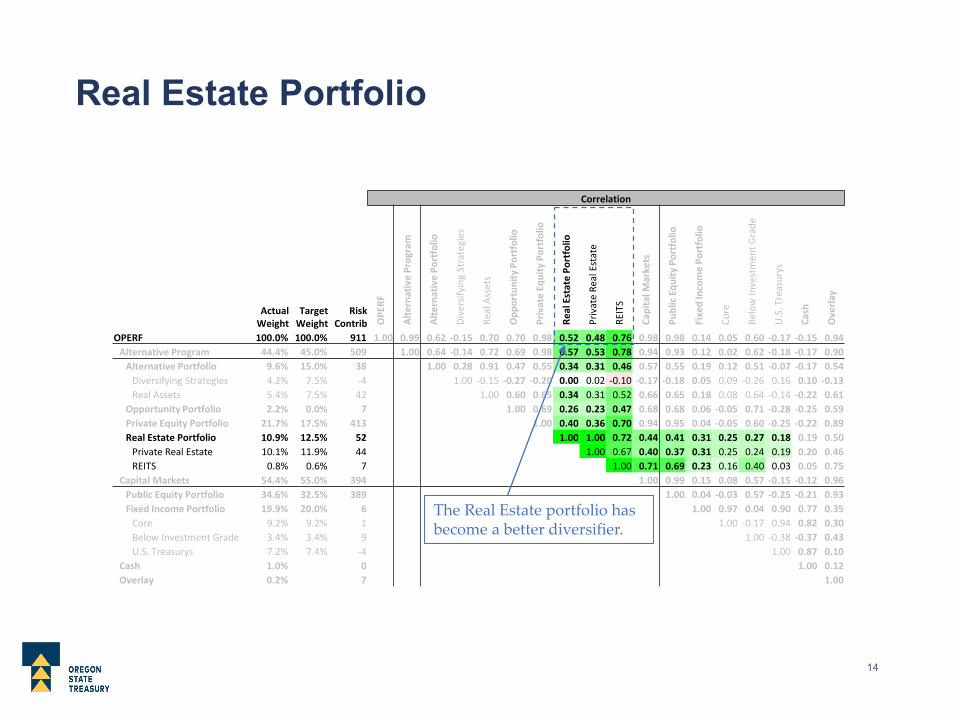
Real Estate Portfolio
Correlation
Actual Weight
Target Weight
Risk Contrib O
PERF
Alte
rnat
ive
Prog
ram
Alte
rnat
ive
Port
folio
Dive
rsify
ing
Stra
tegi
es
Real
Ass
ets
Opp
ortu
nity
Por
tfol
io
Priv
ate
Equi
ty P
ortf
olio
Real
Est
ate
Port
folio
Priv
ate
Real
Est
ate
REIT
S
Capi
tal M
arke
ts
Publ
ic E
quity
Por
tfol
io
Fixe
d In
com
e Po
rtfo
lio
Core
Belo
w In
vest
men
t Gra
de
U.S
. Tre
asur
ys
Cash
Ove
rlay
OPERF 100.0% 100.0% 911 1.00 0.99 0.62 -0.15 0.70 0.70 0.98 0.52 0.48 0.76 0.98 0.98 0.14 0.05 0.60 -0.17 -0.15 0.94Alternative Program 44.4% 45.0% 509 1.00 0.64 -0.14 0.72 0.69 0.98 0.57 0.53 0.78 0.94 0.93 0.12 0.02 0.62 -0.18 -0.17 0.90
Alternative Portfolio 9.6% 15.0% 38 1.00 0.28 0.91 0.47 0.55 0.34 0.31 0.46 0.57 0.55 0.19 0.12 0.51 -0.07 -0.17 0.54Diversifying Strategies 4.2% 7.5% -4 1.00 -0.15 -0.27 -0.20 0.00 0.02 -0.10 -0.17 -0.18 0.05 0.09 -0.26 0.16 0.10 -0.13Real Assets 5.4% 7.5% 42 1.00 0.60 0.65 0.34 0.31 0.52 0.66 0.65 0.18 0.08 0.64 -0.14 -0.22 0.61
Opportunity Portfolio 2.2% 0.0% 7 1.00 0.69 0.26 0.23 0.47 0.68 0.68 0.06 -0.05 0.71 -0.28 -0.25 0.59Private Equity Portfolio 21.7% 17.5% 413 1.00 0.40 0.36 0.70 0.94 0.95 0.04 -0.05 0.60 -0.25 -0.22 0.89Real Estate Portfolio 10.9% 12.5% 52 1.00 1.00 0.72 0.44 0.41 0.31 0.25 0.27 0.18 0.19 0.50
Private Real Estate 10.1% 11.9% 44 1.00 0.67 0.40 0.37 0.31 0.25 0.24 0.19 0.20 0.46REITS 0.8% 0.6% 7 1.00 0.71 0.69 0.23 0.16 0.40 0.03 0.05 0.75
Capital Markets 54.4% 55.0% 394 1.00 0.99 0.15 0.08 0.57 -0.15 -0.12 0.96Public Equity Portfolio 34.6% 32.5% 389 1.00 0.04 -0.03 0.57 -0.25 -0.21 0.93Fixed Income Portfolio 19.9% 20.0% 6 1.00 0.97 0.04 0.90 0.77 0.35
Core 9.2% 9.2% 1 1.00 -0.17 0.94 0.82 0.30Below Investment Grade 3.4% 3.4% 9 1.00 -0.38 -0.37 0.43U.S. Treasurys 7.2% 7.4% -4 1.00 0.87 0.10
Cash 1.0% 0 1.00 0.12Overlay 0.2% 7 1.00
The Real Estate portfolio has become a better diversifier.
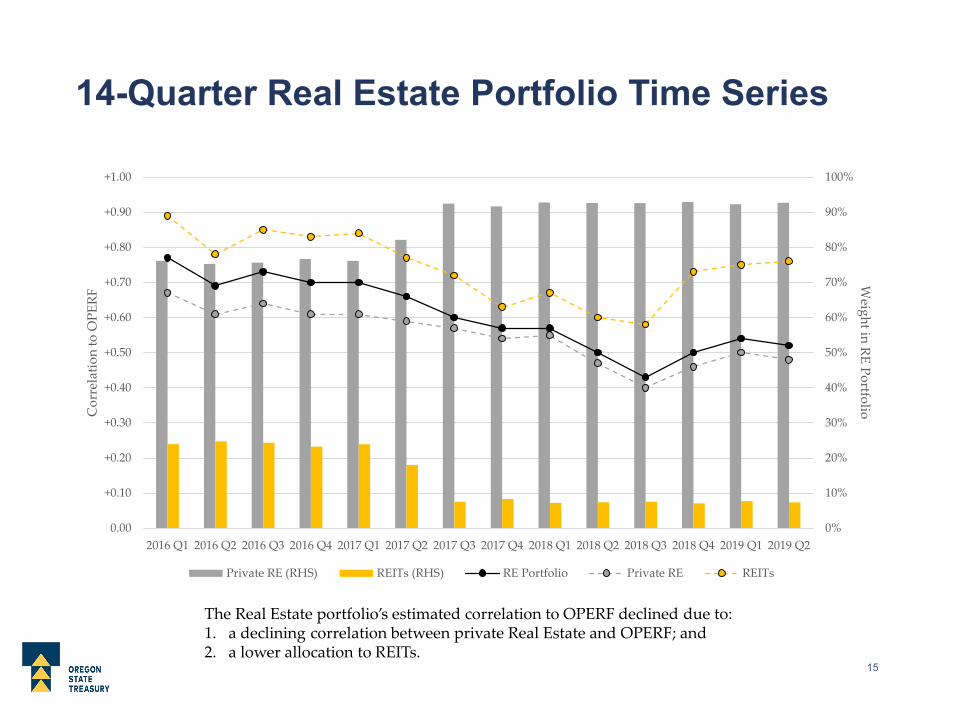
14-Quarter Real Estate Portfolio Time Series
0%
10%
20%
30%
40%
50%
60%
70%
80%
90%
100%
0.00
+0.10
+0.20
+0.30
+0.40
+0.50
+0.60
+0.70
+0.80
+0.90
+1.00
2016 Q1 2016 Q2 2016 Q3 2016 Q4 2017 Q1 2017 Q2 2017 Q3 2017 Q4 2018 Q1 2018 Q2 2018 Q3 2018 Q4 2019 Q1 2019 Q2
Weight in RE PortfolioC
orre
latio
n to
OPE
RF
Private RE (RHS) REITs (RHS) RE Portfolio Private RE REITs
The Real Estate portfolio’s estimated correlation to OPERF declined due to:1. a declining correlation between private Real Estate and OPERF; and2. a lower allocation to REITs.

Below Investment Grade Sleeve
Correlation
Actual Weight
Target Weight
Risk Contrib O
PERF
Alte
rnat
ive
Prog
ram
Alte
rnat
ive
Port
folio
Dive
rsify
ing
Stra
tegi
es
Real
Ass
ets
Opp
ortu
nity
Por
tfol
io
Priv
ate
Equi
ty P
ortf
olio
Real
Est
ate
Port
folio
Priv
ate
Real
Est
ate
REIT
S
Capi
tal M
arke
ts
Publ
ic E
quity
Por
tfol
io
Fixe
d In
com
e Po
rtfo
lio
Core
Belo
w In
vest
men
t Gra
de
U.S
. Tre
asur
ys
Cash
Ove
rlay
OPERF 100.0% 100.0% 911 1.00 0.99 0.62 -0.15 0.70 0.70 0.98 0.52 0.48 0.76 0.98 0.98 0.14 0.05 0.60 -0.17 -0.15 0.94Alternative Program 44.4% 45.0% 509 1.00 0.64 -0.14 0.72 0.69 0.98 0.57 0.53 0.78 0.94 0.93 0.12 0.02 0.62 -0.18 -0.17 0.90
Alternative Portfolio 9.6% 15.0% 38 1.00 0.28 0.91 0.47 0.55 0.34 0.31 0.46 0.57 0.55 0.19 0.12 0.51 -0.07 -0.17 0.54Diversifying Strategies 4.2% 7.5% -4 1.00 -0.15 -0.27 -0.20 0.00 0.02 -0.10 -0.17 -0.18 0.05 0.09 -0.26 0.16 0.10 -0.13Real Assets 5.4% 7.5% 42 1.00 0.60 0.65 0.34 0.31 0.52 0.66 0.65 0.18 0.08 0.64 -0.14 -0.22 0.61
Opportunity Portfolio 2.2% 0.0% 7 1.00 0.69 0.26 0.23 0.47 0.68 0.68 0.06 -0.05 0.71 -0.28 -0.25 0.59Private Equity Portfolio 21.7% 17.5% 413 1.00 0.40 0.36 0.70 0.94 0.95 0.04 -0.05 0.60 -0.25 -0.22 0.89Real Estate Portfolio 10.9% 12.5% 52 1.00 1.00 0.72 0.44 0.41 0.31 0.25 0.27 0.18 0.19 0.50
Private Real Estate 10.1% 11.9% 44 1.00 0.67 0.40 0.37 0.31 0.25 0.24 0.19 0.20 0.46REITS 0.8% 0.6% 7 1.00 0.71 0.69 0.23 0.16 0.40 0.03 0.05 0.75
Capital Markets 54.4% 55.0% 394 1.00 0.99 0.15 0.08 0.57 -0.15 -0.12 0.96Public Equity Portfolio 34.6% 32.5% 389 1.00 0.04 -0.03 0.57 -0.25 -0.21 0.93Fixed Income Portfolio 19.9% 20.0% 6 1.00 0.97 0.04 0.90 0.77 0.35
Core 9.2% 9.2% 1 1.00 -0.17 0.94 0.82 0.30Below Investment Grade 3.4% 3.4% 9 1.00 -0.38 -0.37 0.43U.S. Treasurys 7.2% 7.4% -4 1.00 0.87 0.10
Cash 1.0% 0 1.00 0.12Overlay 0.2% 7 1.00
Preview of coming attractions: the Below Investment Grade sleeve is much more correlated to OPERF than the overall Fixed Income Portfolio.

Tobias ReadOregon State Treasurer
oregon.gov/treasury350 Winter St NE, Suite 100Salem, OR 97301-3896

TAB 5 – Annual Cost & Implementation Analysis
OPERF

Investment Benchmarking ServiceA benchmarking solution for your DB plan
CEM Investment Benchmarking Analysis for: Oregon Public Employees Retirement Fund
September 18, 2019Mike Heale

Key takeaways
Returns
• Your 5-year net total return was 6.3%. This was above the U.S. Public median of 5.4% and above the peer median of
5.6%.
• Your 5-year policy return was 6.3%. This was above the U.S. Public median of 5.3% and above the peer median of
5.7%.
Value added
• Your 5-year net value added was 0.0%. This was equal to the U.S. Public median of 0.0% and equal to the peer median
of 0.0%.
Cost
• Your investment cost of 76.4 bps was close to your benchmark cost of 77.6 bps. This suggests that your fund was
normal cost compared to your peers.
• Your fund was normal cost because you paid less than peers for similar services. These savings were mostly offset by
your higher cost implementation style.
© 2019 CEM Benchmarking Inc. Executive Summary | 1

Participating assets ($ trillions)
*2018 assets includes both received and expected data.
This benchmarking report compares your cost and return performance to the 289
funds in CEM's extensive pension database.
• 149 U.S. pension funds participate. The median U.S.
fund had assets of $10.4 billion and the average U.S.
fund had assets of $24.0 billion. Total participating U.S.
assets were $3.6 trillion.
• 76 Canadian funds participate with assets totaling $1.5
trillion.
• 57 European funds participate with aggregate assets
of $3.1 trillion. Included are funds from the Netherlands,
Norway, Sweden, Finland, Ireland, Denmark and the
U.K.
• 5 Asia-Pacific funds participate with aggregate assets
of $696.3 trillion. Included are funds from Australia,
New Zealand, China and South Korea.
• 3 Gulf region funds participate.
The most meaningful comparisons for your returns and
value added are to the U.S. Public universe of 51 funds.0
2
4
6
8
10
12
92 94 96 98 00 02 04 06 08 10 12 14 16 18*
Asia-Pacific
Europe
Canada
United States
© 2019 CEM Benchmarking Inc. Executive Summary | 2
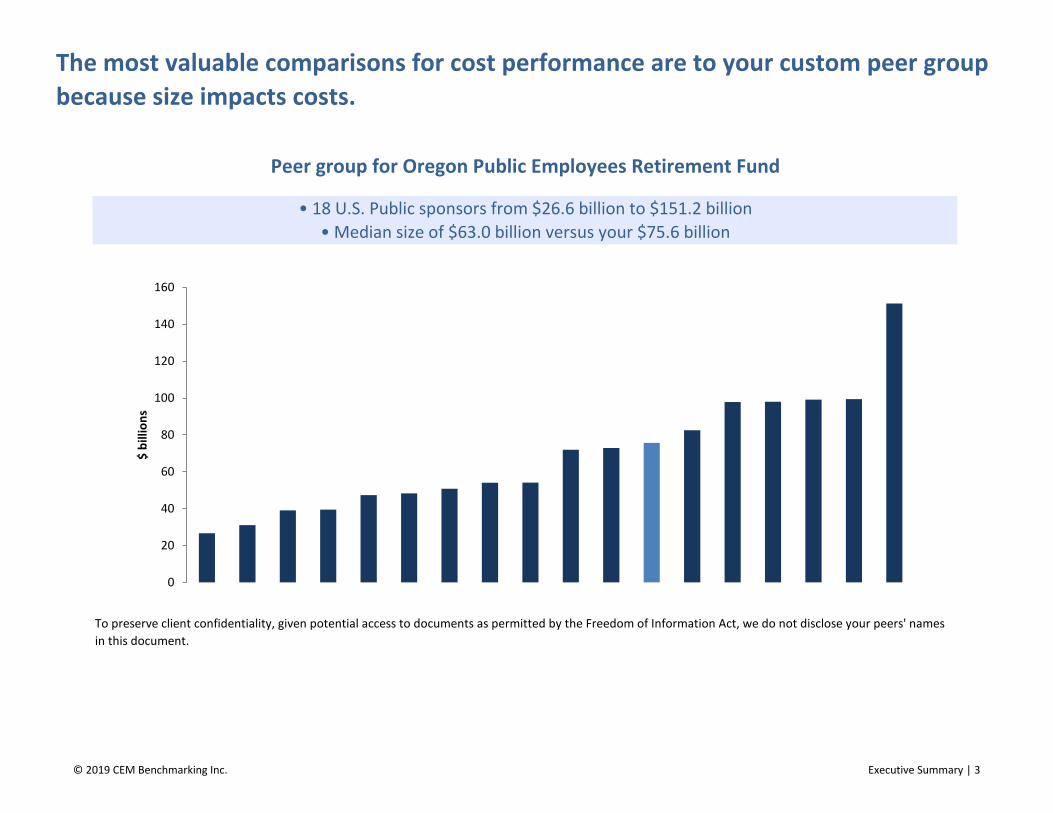
To preserve client confidentiality, given potential access to documents as permitted by the Freedom of Information Act, we do not disclose your peers' names
in this document.
The most valuable comparisons for cost performance are to your custom peer group
because size impacts costs.
Peer group for Oregon Public Employees Retirement Fund
• 18 U.S. Public sponsors from $26.6 billion to $151.2 billion
• Median size of $63.0 billion versus your $75.6 billion
0
20
40
60
80
100
120
140
160
$ b
illio
ns
© 2019 CEM Benchmarking Inc. Executive Summary | 3

What gets measured gets managed, so it is critical that you measure and compare
the right things:
Why do total returns differ from other funds? What was the
impact of your policy mix decisions versus implementation
decisions?
Are your implementation decisions adding value (i.e., mostly the
effectiveness of active management, as well as the amount of
active management versus passive management)?
Are your costs reasonable? Costs matter and can be managed.
2. Net value added
3. Costs
1. Returns
© 2019 CEM Benchmarking Inc. Executive Summary | 4

Total returns, by themselves, provide little insight
into the reasons behind relative performance.
Therefore, we separate total return into its more
meaningful components: policy return and
value added.
Your 5-year
Net total fund return 6.3%
- Policy return 6.3%
= Net value added 0.0%
This approach enables you to understand the
contribution from both policy mix decisions
(which tend to be the board's responsibility) and
implementation decisions (which tend to be
management's responsibility).
Your 5-year net total return of 6.3% was above both the U.S. Public median of 5.4% and
the peer median of 5.6%.
U.S. Public net total returns - quartile rankings
-7%
-2%
3%
8%
13%
18%
5 year
-7%
-2%
3%
8%
13%
18%
2018 2017 2016 2015 2014
Legend
your value
median
90th
75th
25th
peer med
10th
© 2019 CEM Benchmarking Inc. Executive Summary | 5
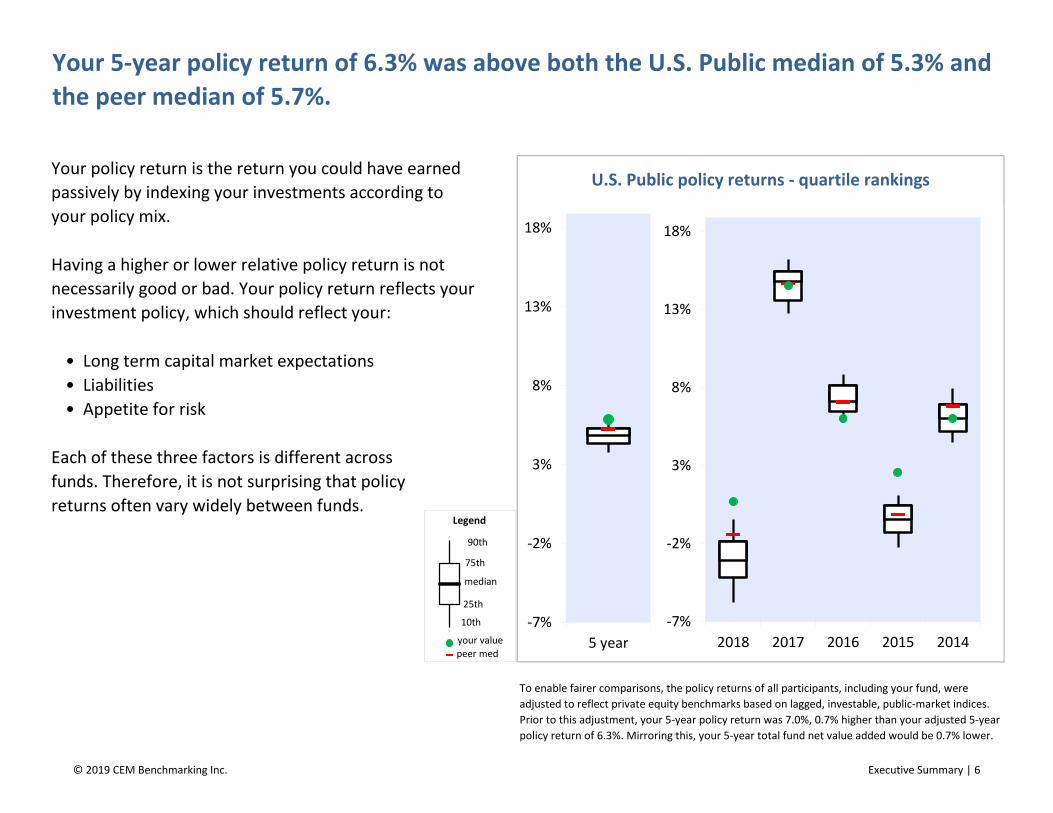
• Long term capital market expectations
• Liabilities
• Appetite for risk
Each of these three factors is different across
funds. Therefore, it is not surprising that policy
returns often vary widely between funds.
Your 5-year policy return of 6.3% was above both the U.S. Public median of 5.3% and
the peer median of 5.7%.
Your policy return is the return you could have earned
passively by indexing your investments according to
your policy mix.
U.S. Public policy returns - quartile rankings
Having a higher or lower relative policy return is not
necessarily good or bad. Your policy return reflects your
investment policy, which should reflect your:
To enable fairer comparisons, the policy returns of all participants, including your fund, were
adjusted to reflect private equity benchmarks based on lagged, investable, public-market indices.
Prior to this adjustment, your 5-year policy return was 7.0%, 0.7% higher than your adjusted 5-year
policy return of 6.3%. Mirroring this, your 5-year total fund net value added would be 0.7% lower.
-7%
-2%
3%
8%
13%
18%
2018 2017 2016 2015 2014
-7%
-2%
3%
8%
13%
18%
5 year
Legend
your value
median
90th
75th
25th
peer med
10th
© 2019 CEM Benchmarking Inc. Executive Summary | 6

• Your More/
Fund Less
Stock 40% 50% -10%
Fixed Income 23% 25% -3%
Real Estate 13% 8% 4%
Alternatives¹ 5% 7% -2%
Private Equity 20% 9% 10%
Total 100% 100% 0%
5-year average policy mix¹
Your higher relative weight in two of the best
performing asset classes of the past 5 years:
Real Estate (your 13% versus the U.S. Public 5-
year average of 8%) and Private Equity (your
20% versus the U.S. Public 5-year average of
9%).
1. Alternatives includes other diversifying strategies, commodities,
natural resources and infrastructure.
Your 5-year policy return of 6.3% was above the U.S. Public median of 5.3%
primarily because of:
U.S. Public
Avg.
© 2019 CEM Benchmarking Inc. Executive Summary | 7
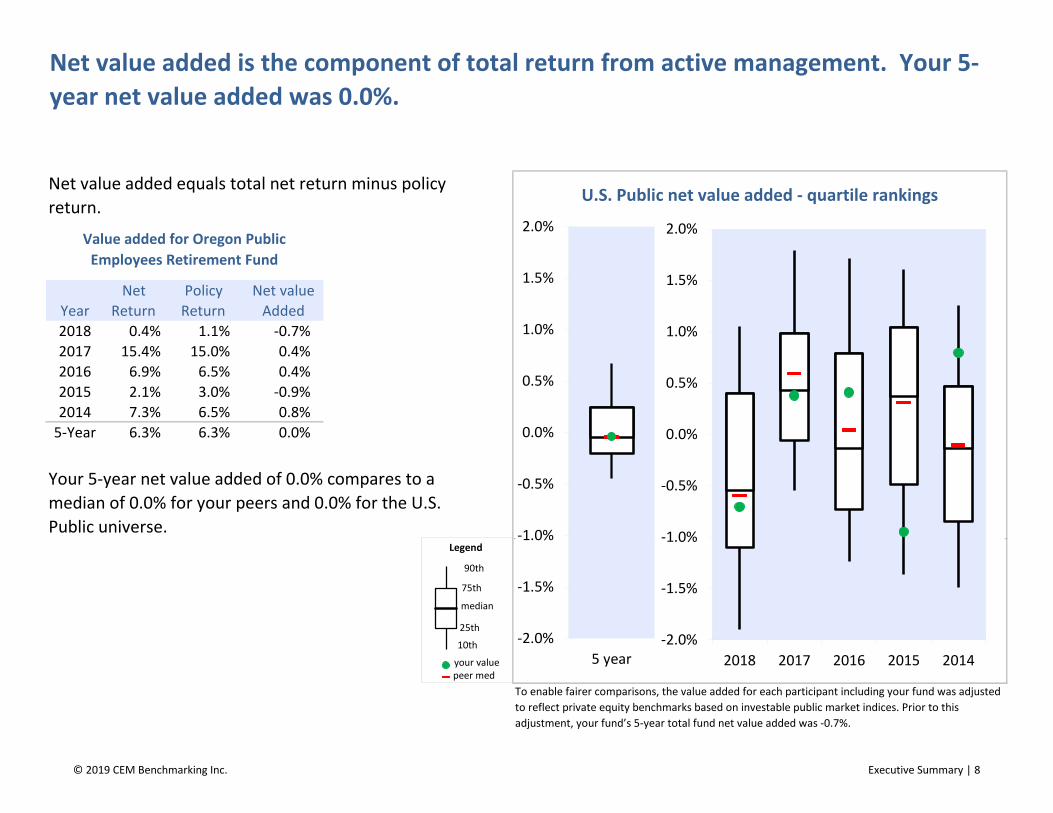
Net Policy Net value
Year Return Return Added
2018 0.4% 1.1% -0.7%
2017 15.4% 15.0% 0.4%
2016 6.9% 6.5% 0.4%
2015 2.1% 3.0% -0.9%
2014 7.3% 6.5% 0.8%
5-Year 6.3% 6.3% 0.0%
To enable fairer comparisons, the value added for each participant including your fund was adjusted
to reflect private equity benchmarks based on investable public market indices. Prior to this
adjustment, your fund’s 5-year total fund net value added was -0.7%.
Net value added is the component of total return from active management. Your 5-
year net value added was 0.0%.
Net value added equals total net return minus policy
return. U.S. Public net value added - quartile rankings
Value added for Oregon Public
Employees Retirement Fund
Your 5-year net value added of 0.0% compares to a
median of 0.0% for your peers and 0.0% for the U.S.
Public universe.
-2.0%
-1.5%
-1.0%
-0.5%
0.0%
0.5%
1.0%
1.5%
2.0%
2018 2017 2016 2015 2014
-2.0%
-1.5%
-1.0%
-0.5%
0.0%
0.5%
1.0%
1.5%
2.0%
5 year
Legend
your value
median
90th
75th
25th
peer med
10th
© 2019 CEM Benchmarking Inc. Executive Summary | 8
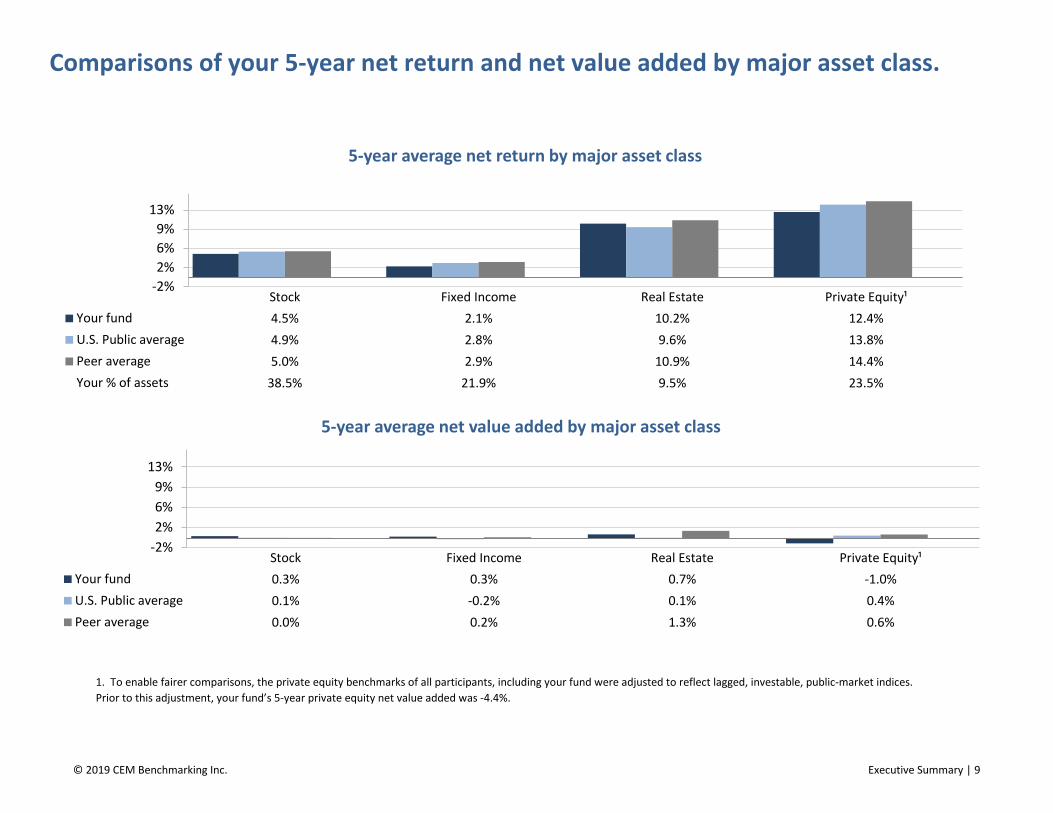
Comparisons of your 5-year net return and net value added by major asset class.
1. To enable fairer comparisons, the private equity benchmarks of all participants, including your fund were adjusted to reflect lagged, investable, public-market indices.
Prior to this adjustment, your fund’s 5-year private equity net value added was -4.4%.
-2%
2%
6%
9%
13%
Stock Fixed Income Real Estate Private Equity¹
Your fund 0.3% 0.3% 0.7% -1.0%
U.S. Public average 0.1% -0.2% 0.1% 0.4%
Peer average 0.0% 0.2% 1.3% 0.6%
5-year average net value added by major asset class
-2%
2%
6%
9%
13%
Stock Fixed Income Real Estate Private Equity¹
Your fund 4.5% 2.1% 10.2% 12.4%
U.S. Public average 4.9% 2.8% 9.6% 13.8%
Peer average 5.0% 2.9% 10.9% 14.4%
Your % of assets 38.5% 21.9% 9.5% 23.5%
5-year average net return by major asset class
© 2019 CEM Benchmarking Inc. Executive Summary | 9
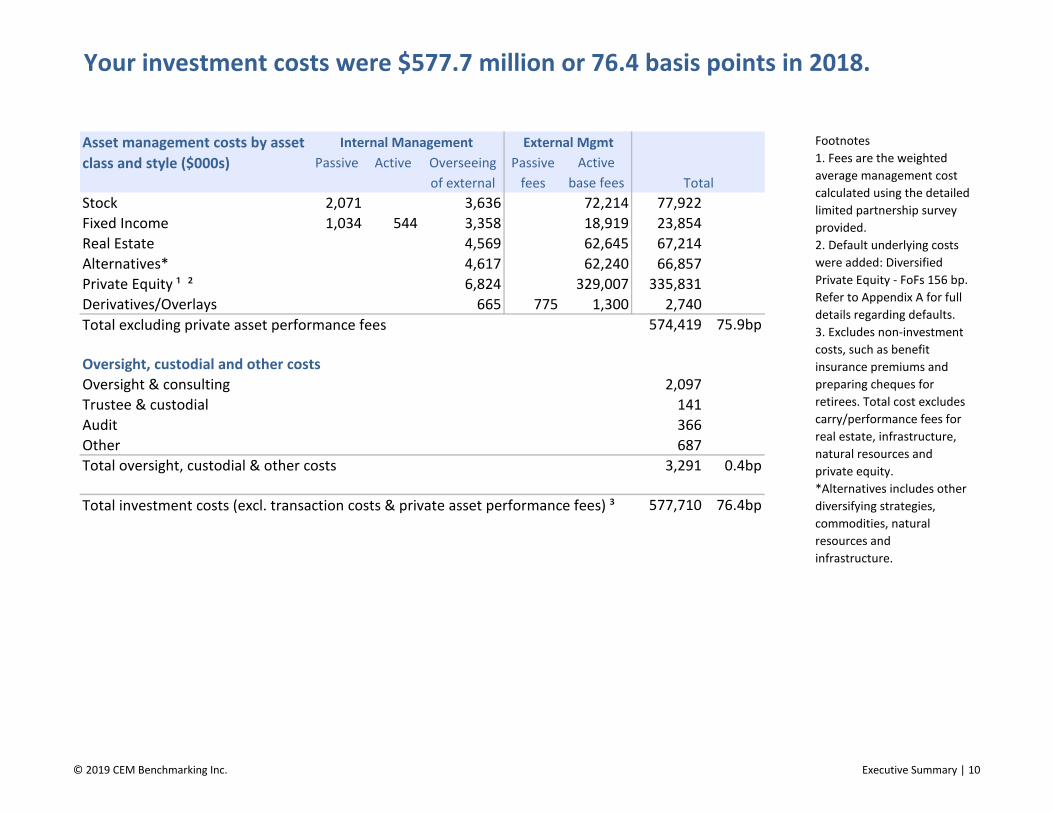
Passive Active Overseeing Passive Active
of external fees base fees Total
Stock 2,071 3,636 72,214 77,922
Fixed Income 1,034 544 3,358 18,919 23,854
Real Estate 4,569 62,645 67,214
Alternatives* 4,617 62,240 66,857
Private Equity ¹ ² 6,824 329,007 335,831
Derivatives/Overlays 665 775 1,300 2,740
574,419 75.9bp
Oversight, custodial and other costs
Oversight & consulting 2,097
Trustee & custodial 141
Audit 366
Other 687
Total oversight, custodial & other costs 3,291 0.4bp
577,710 76.4bp
Your investment costs were $577.7 million or 76.4 basis points in 2018.
Total excluding private asset performance fees
Total investment costs (excl. transaction costs & private asset performance fees) ³
Asset management costs by asset
class and style ($000s)
Internal Management External Mgmt Footnotes
1. Fees are the weighted
average management cost
calculated using the detailed
limited partnership survey
provided.
2. Default underlying costs
were added: Diversified
Private Equity - FoFs 156 bp.
Refer to Appendix A for full
details regarding defaults.
3. Excludes non-investment
costs, such as benefit
insurance premiums and
preparing cheques for
retirees. Total cost excludes
carry/performance fees for
real estate, infrastructure,
natural resources and
private equity.
*Alternatives includes other
diversifying strategies,
commodities, natural
resources and
infrastructure.
© 2019 CEM Benchmarking Inc. Executive Summary | 10

•
• Fund size. Bigger funds have advantages of scale.
Your total investment cost of 76.4 bps was above the peer median of 52.7 bps.
Differences in total investment cost are often caused by
two factors that are often outside of management's
control:
Total investment cost
excluding transaction costs and
private asset performance fees
Asset mix, particularly holdings of the highest cost
asset classes: real estate (excl. REITS),
infrastructure, hedge funds and private equity.
These high cost assets equaled 37% of your funds
assets at the end of 2018 versus a peer average of
27%.
Therefore, to assess whether your costs are high or low
given your unique asset mix and size, CEM calculates a
benchmark cost for your fund. This analysis is shown on
the following page.
0 bp
20 bp
40 bp
60 bp
80 bp
100 bp
120 bp
Peer U.S. Public universe
Legend
your value
median
90th
75th
25th
peer avg
10th
© 2019 CEM Benchmarking Inc. Executive Summary | 11

$000s basis points
577,710 76.4 bp
Your benchmark cost 587,146 77.6 bp
Your excess cost (9,436) (1.2) bp
Benchmark cost analysis suggests that, after adjusting for fund size and asset mix,
your fund was normal cost in 2018.
Your benchmark cost is an estimate of what your cost
would be given your actual asset mix and the median
costs that your peers pay for similar services. It
represents the cost your peers would incur if they had
your actual asset mix.
Your total cost of 76.4 bp was close to your benchmark
cost of 77.6 bp. Thus, your cost savings were 1.2 bp.
Your cost versus benchmark
Your total investment cost
© 2019 CEM Benchmarking Inc. Executive Summary | 12

$000s bps
1. Higher cost implementation style
• More active management, less lower cost passive 14,405 1.9
• More external management vs. lower cost internal 18,144 2.4
• Less partnerships as a percentage of external (359) (0.0)
• Less fund of funds (10,475) (1.4)
• Less co-investment as a percentage of LP/CO 8,386 1.1
• More overlays 800 0.1
30,902 4.1
2. Paying less than peers for similar services
• External investment management costs (37,068) (4.9)
• Internal investment management costs 1,053 0.1
• Oversight, custodial & other costs (4,322) (0.6)
(40,338) (5.3)
Total savings (9,436) (1.2)
Your fund was normal cost because you paid less than peers for similar services.
These savings were mostly offset by your higher cost implementation style.
Reasons for your low cost status
Excess Cost/
(Savings)
© 2019 CEM Benchmarking Inc. Executive Summary | 13

Implementation style¹
•
•
1. The graph above does not take into consideration the impact of derivatives.
The values in the graph above are calculated using average holdings.
Differences in cost performance are often caused by differences in implementation
style.
Implementation style is defined as the way in
which your fund implements asset allocation. It
includes internal, external, active, passive and fund
of funds styles.
The greatest cost impact is usually caused by
differences in the use of:
External active management because it tends to
be much more expensive than internal or
passive management. You used more external
active management than your peers (your 82%
versus 60% for your peers).
Within external active holdings, fund of funds
usage because it is more expensive than direct
fund investment. You had similar amounts in
fund of funds. Your 4% of hedge funds, real
estate and private equity in fund of funds
compared to 7% for your peers.
0%
10%
20%
30%
40%
50%
60%
70%
80%
90%
100%
Your Fund PeersU.S. Public
Funds
Internal passive 16% 8% 5%
Internal active 1% 15% 9%
External passive 0% 17% 20%
External active 82% 60% 66%
© 2019 CEM Benchmarking Inc. Executive Summary | 14
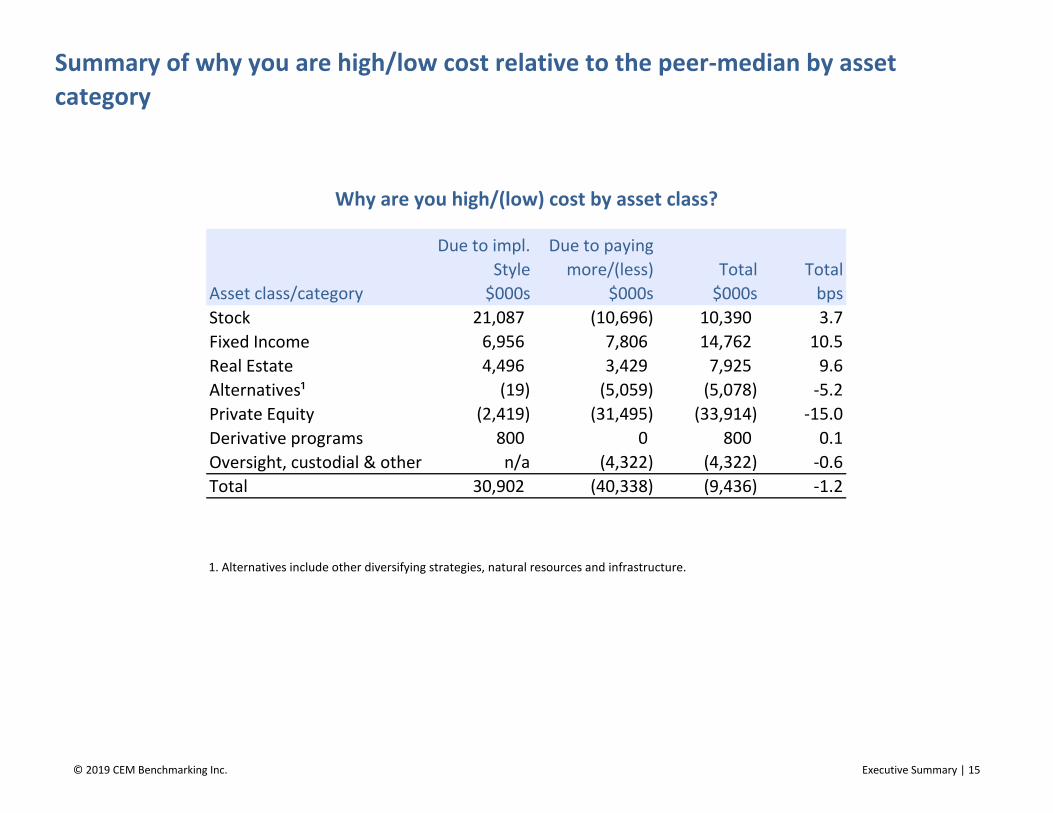
Asset class/category
Stock 21,087 (10,696) 10,390 3.7
Fixed Income 6,956 7,806 14,762 10.5
Real Estate 4,496 3,429 7,925 9.6
Alternatives¹ (19) (5,059) (5,078) -5.2
Private Equity (2,419) (31,495) (33,914) -15.0
Derivative programs 800 0 800 0.1
Oversight, custodial & other n/a (4,322) (4,322) -0.6
Total 30,902 (40,338) (9,436) -1.2
1. Alternatives include other diversifying strategies, natural resources and infrastructure.
Summary of why you are high/low cost relative to the peer-median by asset
category
Why are you high/(low) cost by asset class?
Due to impl.
Style
$000s
Due to paying
more/(less)
$000s
Total
$000s
Total
bps
© 2019 CEM Benchmarking Inc. Executive Summary | 15
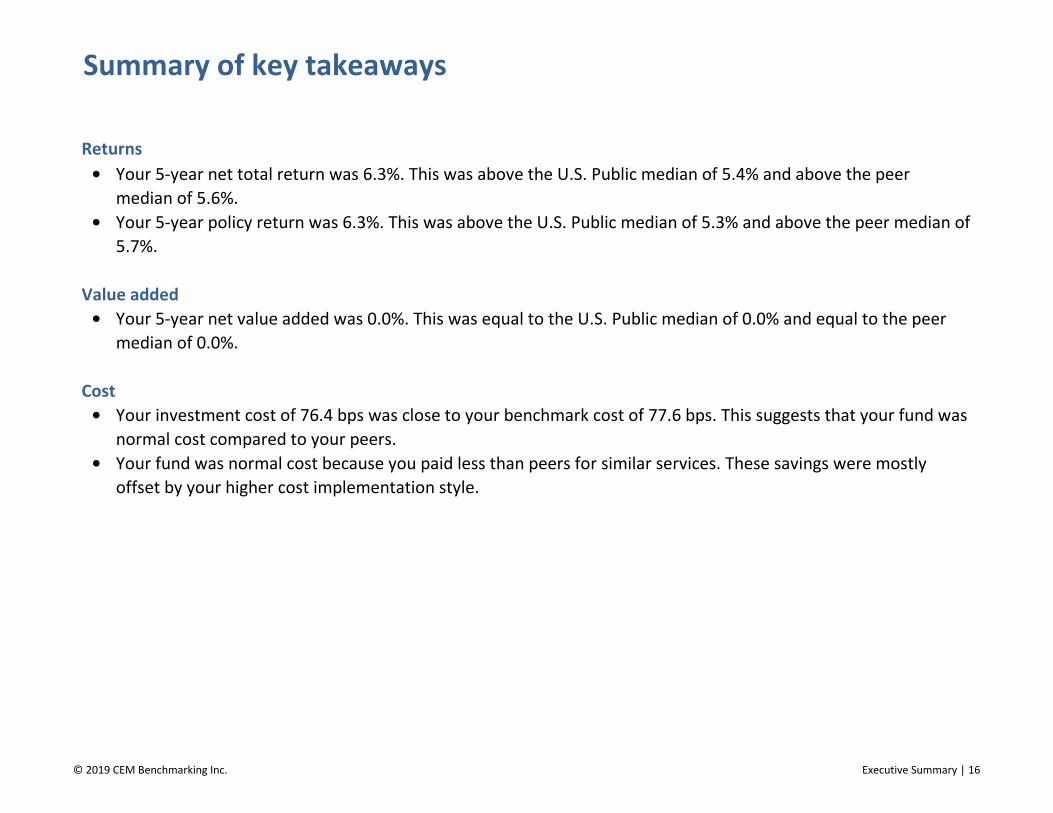
Summary of key takeaways
Returns
• Your 5-year net total return was 6.3%. This was above the U.S. Public median of 5.4% and above the peer
median of 5.6%.
• Your 5-year policy return was 6.3%. This was above the U.S. Public median of 5.3% and above the peer median of
5.7%.
Value added
• Your 5-year net value added was 0.0%. This was equal to the U.S. Public median of 0.0% and equal to the peer
median of 0.0%.
Cost
• Your investment cost of 76.4 bps was close to your benchmark cost of 77.6 bps. This suggests that your fund was
normal cost compared to your peers.
• Your fund was normal cost because you paid less than peers for similar services. These savings were mostly
offset by your higher cost implementation style.
© 2019 CEM Benchmarking Inc. Executive Summary | 16

TAB 6 – Oregon Savings Growth Plan
Annual Review and Update

Tobias Read State Treasurer Michael Kaplan Deputy State Treasurer
Date: September 9, 2019 To: Oregon Investment Council From: Wil Hiles, Investment Officer Michael Viteri, Senior Investment Officer Jennifer Peet, Corporate Governance Director Re: Deferred Compensation Program, 2nd Quarter 2019 Report Background The Oregon Savings Growth Plan (the “Plan” or “OSGP”) is the State of Oregon’s 457 Deferred Compensation plan. OSGP is a voluntary supplemental retirement plan that provides eligible state and local government employees the opportunity to defer a portion of their current salary on a pre-tax or after-tax (Roth) basis. These deferrals are invested in various investment options until participants draw funds at retirement. The Plan offers an array of equity and fixed income investment options, a suite of target-date retirement funds, which in aggregate constitute a single investment option, and a self-directed brokerage option. As of June 30, 2019, plan assets totaled $2.33 billion from over 30,000 participants. With support and assistance from the Oregon State Treasury (OST) Investment Division, the Oregon Investment Council (OIC) is responsible for oversight of the Plan’s investment program. Oversight of Plan administration is the responsibility of the Oregon Public Employees Retirement System Board (“PERS Board”), with support from OSGP staff. Additional oversight is provided by a seven-member Deferred Compensation Advisory Committee (the “Advisory Committee”) established under ORS 243.505.

Oregon State Treasury 2
OSGP Performance
Fund Option Benchmarks
Performance (%)
QTD YTD 1 Year 3 Years 5 Years 10 Years
Stable Value Option 0.57 1.11 2.17 1.81 1.61 1.56 91 Day T-Bill 0.64 1.24 2.31 1.38 0.87 0.49 Rolling Average 5 Year CMT* 0.47 0.92 1.81 1.55 1.46 1.98 Active Fixed Income Option 2.89 5.81 7.23 2.97 3.21 4.69 Barclays US Aggregate Bond Index 3.08 6.11 7.87 2.31 2.95 3.90 Large Company Value Stock Option 3.81 16.21 8.47 10.12 7.27 13.05 Russell 1000 Value Index 3.84 16.24 8.46 10.19 7.46 13.19 Stock Index Option 4.06 18.67 8.89 13.91 10.08 14.53 Russell 3000 Index 4.10 18.71 8.98 14.02 10.19 14.67 Large Company Growth Stock Option 4.60 21.45 11.50 17.92 12.94 16.06 Russell 1000 Growth Index 4.64 21.49 11.56 18.07 13.39 16.28 International Stock Option 2.60 13.13 -0.60 7.91 2.20 6.81 MSCI ACWI ex-US (net) Index 2.98 13.60 1.29 9.39 2.23 6.89 Small Company Stock Option 2.24 16.85 -3.38 11.79 6.76 13.61 Russell 2000 Index 2.10 16.98 -3.31 12.30 7.20 14.19 Socially Responsible Stock Option 3.73 18.16 8.84 13.58 N/A N/A Russell 3000 Index 4.10 18.71 8.98 14.02 N/A N/A Real Return Option 1.27 7.18 1.31 3.31 N/A N/A CPI + 3% 1.70 3.67 4.90 5.17 N/A N/A BlackRock LifePath Retirement 3.13 10.04 6.42 5.66 4.05 6.56 BlackRock LifePath 2020 3.15 10.43 6.30 6.40 4.38 7.69 BlackRock LifePath 2025 3.17 11.81 6.37 7.44 4.88 8.41 BlackRock LifePath 2030 3.19 13.06 6.45 8.46 5.42 9.11 BlackRock LifePath 2035 3.20 14.06 6.35 9.23 5.73 9.59 BlackRock LifePath 2040 3.20 15.03 6.30 9.99 6.07 10.09 BlackRock LifePath 2045 3.18 15.74 6.18 10.43 6.26 10.49 BlackRock LifePath 2050 3.17 16.05 6.14 10.57 6.31 10.78 BlackRock LifePath 2055 3.17 16.09 6.15 10.56 6.27 N/A BlackRock LifePath 2060 3.16 16.08 6.14 10.55 N/A N/A
* CMT is the Constant Maturity Treasury Yield. Performance shown is a) net of fees and b) annualized for periods longer than one year. OSGP has two types of fees, investment management and administrative fees. Administrative fees are comprised of State of Oregon administration, recording keeping, custody, trust and communications fees.

Oregon State Treasury 3
Additional OSGP Data
Fund Name Market Value ($) % of Plan
IM Fees
Admin Fees
Total Fees
Total Participants (bps) (bps) (bps) Stable Value Option 286,760,388 12.7% 8,692 35.1 11.9 47.0 Active Fixed Income Option 149,943,814 6.2% 7,135 16.7 11.9 28.6 Large Company Value Stock Option 200,498,122 8.7% 10,605 2.6 11.9 14.5 Stock Index Option 271,151,785 11.6% 10,185 3.6 11.9 15.5 Large Company Growth Stock Option 279,295,370 11.9% 12,203 2.6 11.9 14.5 International Stock Option 121,174,045 5.2% 9,928 54.0 11.9 65.9 Small Company Stock Option 245,333,170 10.9% 11,155 39.4 11.9 51.3 Real Return Option 4,264,678 0.2% 732 22.0 11.9 33.9 Socially Responsible Investment Option 17,924,151 0.7% 1,758 17.0 11.9 28.9 BlackRock LifePath Retirement Fund 189,986,189 8.2% 3,607 9.0 11.9 20.9 BlackRock LifePath 2020 Fund 140,818,720 6.1% 3,050 9.0 11.9 20.9 BlackRock LifePath 2025 Fund 120,508,967 5.1% 3,537 9.0 11.9 20.9 BlackRock LifePath 2030 Fund 89,997,211 3.8% 3,598 9.0 11.9 20.9 BlackRock LifePath 2035 Fund 67,744,358 2.8% 3,567 9.0 11.9 20.9 BlackRock LifePath 2040 Fund 46,895,413 2.0% 3,322 9.0 11.9 20.9 BlackRock LifePath 2045 Fund 31,840,621 1.3% 2,912 9.0 11.9 20.9 BlackRock LifePath 2050 Fund 25,292,739 1.1% 2,268 9.0 11.9 20.9 BlackRock LifePath 2055 Fund 9,537,378 0.4% 1,222 9.0 11.9 20.9 BlackRock LifePath 2060 Fund 6,499,610 0.3% 835 9.0 11.9 20.9 Self-Directed Brokerage Option 20,572,166 0.9% 264 0.0 11.9 11.9
Total 2,326,038,893 100% Source: Market Value & Plan Participants data, OSGP record keeper, Voya Financial. Fee estimation, OST. OSGP has two types of fees, investment management (IM) and administrative (Admin) fees. Administrative fees are comprised of State of Oregon administration, recording keeping, custody, trust and communications fees.
The plan’s Self-Directed Brokerage Option, executed through Charles Schwab, finished the quarter with $20.6 million in assets, or 0.9% of total OSGP assets. Real Return Option Benchmark On September 19, 2018, the Oregon Investment Council (OIC) approved staff’s recommendation to simplify the Real Return Option. As a result, the GMO Benchmark-Free Allocation Fund and the Wellington Real Return Fund were removed from the Real Return Option on March 22, 2019. The Real Return Option is now comprised of a single, underlying investment strategy, the SSgA Real Assets Fund. The SSgA Real Assets Fund seeks an investment return that approximates, as closely as practicable, before fees, the performance of a custom benchmark by diversifying across several inflation-sensitive asset classes such as commodities, REITs, TIPS, and global infrastructure.

Oregon State Treasury 4
Currently, the benchmark for the Real Return Option is the Consumer Price Index (CPI) + 3%, which was appropriate give the previous, multi-fund structure of the Real Return Option, prior to March 22, 2019. However, given that the SSgA Real Assets Fund is now the single, underlying investment strategy within the Real Return Option, and the SSgA Real Assets Fund is also passively implemented, staff and Callan recommend converting the Real Return Option’s primary benchmark to the SSgA Real Assets Custom Blended Index, as a more appropriate reflection of the Real Return Option’s underlying investments. Additionally, the second objective of the SSgA Real Assets Fund is to seek a positive real return, targeting a long-term goal of CPI + 4% over a full market cycle. Therefore, staff and Callan also recommend utilizing CPI + 4% as a secondary benchmark for the Real Return Option. BlackRock LifePath Index 2020 Fund After the close of business on November 15, 2019, BlackRock will conduct an exchange of units of the respective BlackRock LifePath Index 2020 Funds for units of the corresponding BlackRock LifePath Index Retirement Funds. As BlackRock’s LifePath target date funds approach their target year, each fund shifts a portion of its investments out of equity and equity-like securities and into debt and debt-like securities, with the asset allocation gradually moving closer to that of the BlackRock LifePath Index Retirement Fund. During the 4th quarter of each year preceding the target year, the asset allocation becomes identical to the BlackRock LifePath Index Retirement Fund, thereby eliminating the need to have two separate funds in a plan lineup. This transition is an automated process and does not require any action on behalf of participants (unless, of course, a participant would prefer to transfer her/his current balance and/or future contributions to a different investment option). Voya and OSGP staff communicate this change to participants annually in advance of the aforementioned transition date. Further, BlackRock also introduces a new LifePath target date fund every five years. Accordingly, the BlackRock LifePath Index 2065 Fund has been created and is expected to be added as an investment option prior to 2019 year-end. Small Company Stock Option At staff’s request, Callan, the Plan’s retained investment consultant, performed an evaluation of the Plan’s Small Company Stock Option which is currently comprised of the following three underlying funds: DFA US Small Cap Equity; Callan Small Cap Equity; and BlackRock Russell 2000 Index. In an attempt to more closely align the Plan’s investment strategies with those in the Oregon Public Employees Retirement Fund (OPERF), staff recommends adding the BlackRock S&P 600 Index Fund, as a replacement for the BlackRock Russell 2000 Index Fund. Previously, OPERF was also utilizing a Russell 2000 Index strategy. Staff expects this change will improve the Small Company Stock Option’s risk/return profile while maintaining an identical expense ratio.

Oregon Savings Growth Plan Annual ReviewMichael ViteriSenior Investment Officer
Wil HilesInvestment Officer
September 18, 2019

Agenda
• BlackRock LifePath Research
• Target Date Fund Suitability Study
• Small Company Stock Option Structure Evaluation
• Plan Update
• Recommendations

Plan UpdateOregon Savings Growth Plan (OSGP)
Assets $2.33 billionParticipants 31,854
Change in Total Plan Assets & Participants
10,000
15,000
20,000
25,000
30,000
35,000
$500,000,000
$1,000,000,000
$1,500,000,000
$2,000,000,000
$2,500,000,000
2010 2011 2012 2013 2014 2015 2016 2017 2018
Assets Participants
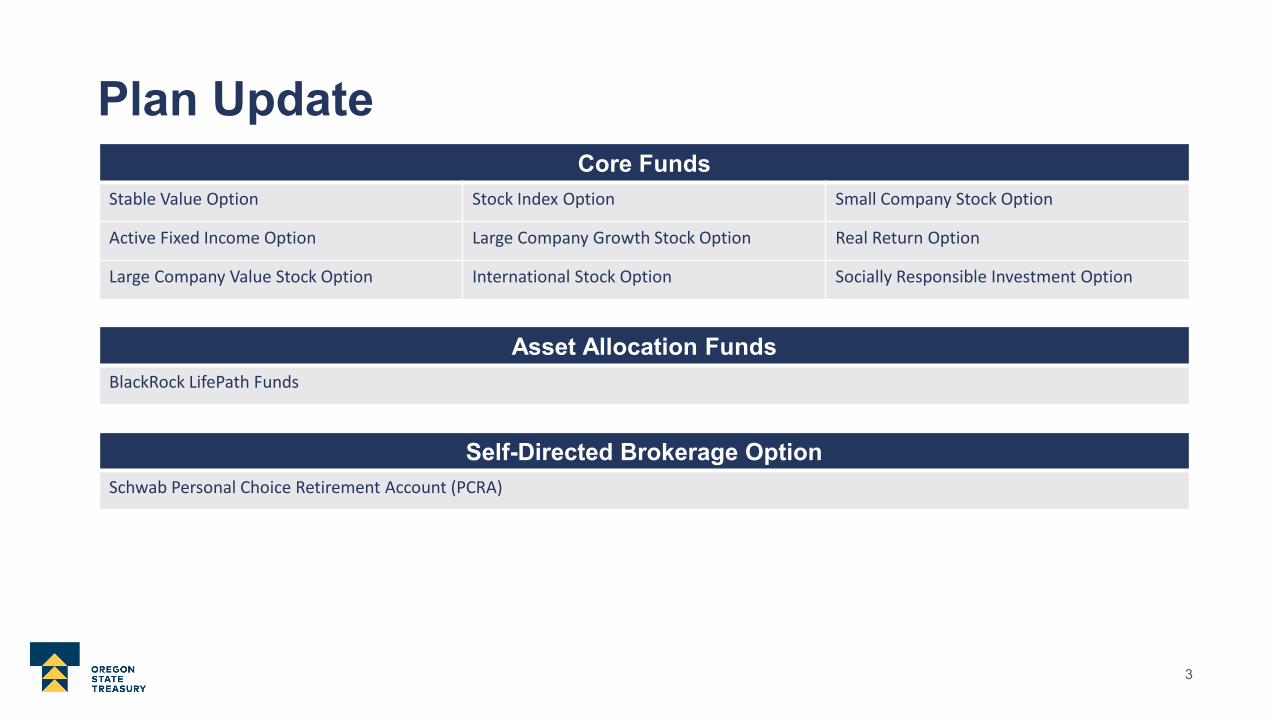
Plan UpdateCore Funds
Stable Value Option Stock Index Option Small Company Stock Option
Active Fixed Income Option Large Company Growth Stock Option Real Return Option
Large Company Value Stock Option International Stock Option Socially Responsible Investment Option
Asset Allocation FundsBlackRock LifePath Funds
Self-Directed Brokerage OptionSchwab Personal Choice Retirement Account (PCRA)
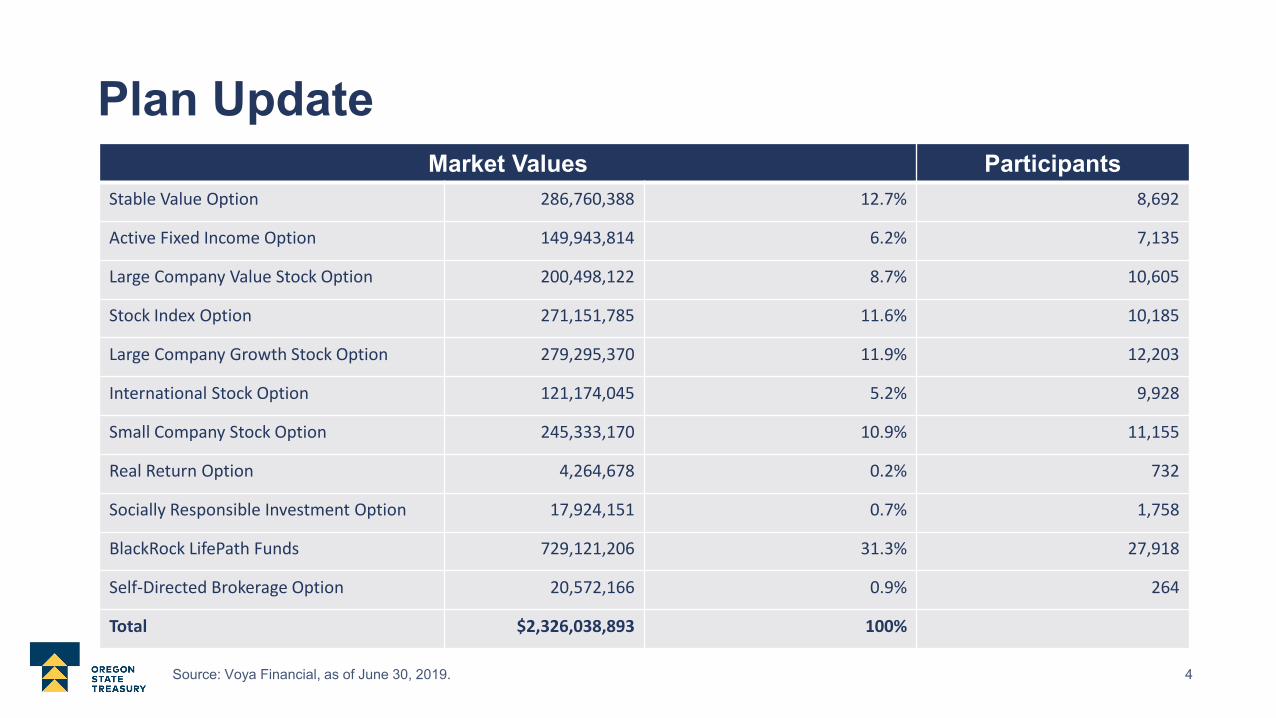
Plan UpdateMarket Values Participants
Stable Value Option 286,760,388 12.7% 8,692
Active Fixed Income Option 149,943,814 6.2% 7,135
Large Company Value Stock Option 200,498,122 8.7% 10,605
Stock Index Option 271,151,785 11.6% 10,185
Large Company Growth Stock Option 279,295,370 11.9% 12,203
International Stock Option 121,174,045 5.2% 9,928
Small Company Stock Option 245,333,170 10.9% 11,155
Real Return Option 4,264,678 0.2% 732
Socially Responsible Investment Option 17,924,151 0.7% 1,758
BlackRock LifePath Funds 729,121,206 31.3% 27,918
Self-Directed Brokerage Option 20,572,166 0.9% 264
Total $2,326,038,893 100%

Plan Update
Upcoming Changes:
• Collapse BlackRock LifePath 2020 Fund into BlackRock LifePath Retirement Fund
• Launch BlackRock LifePath 2065 Fund
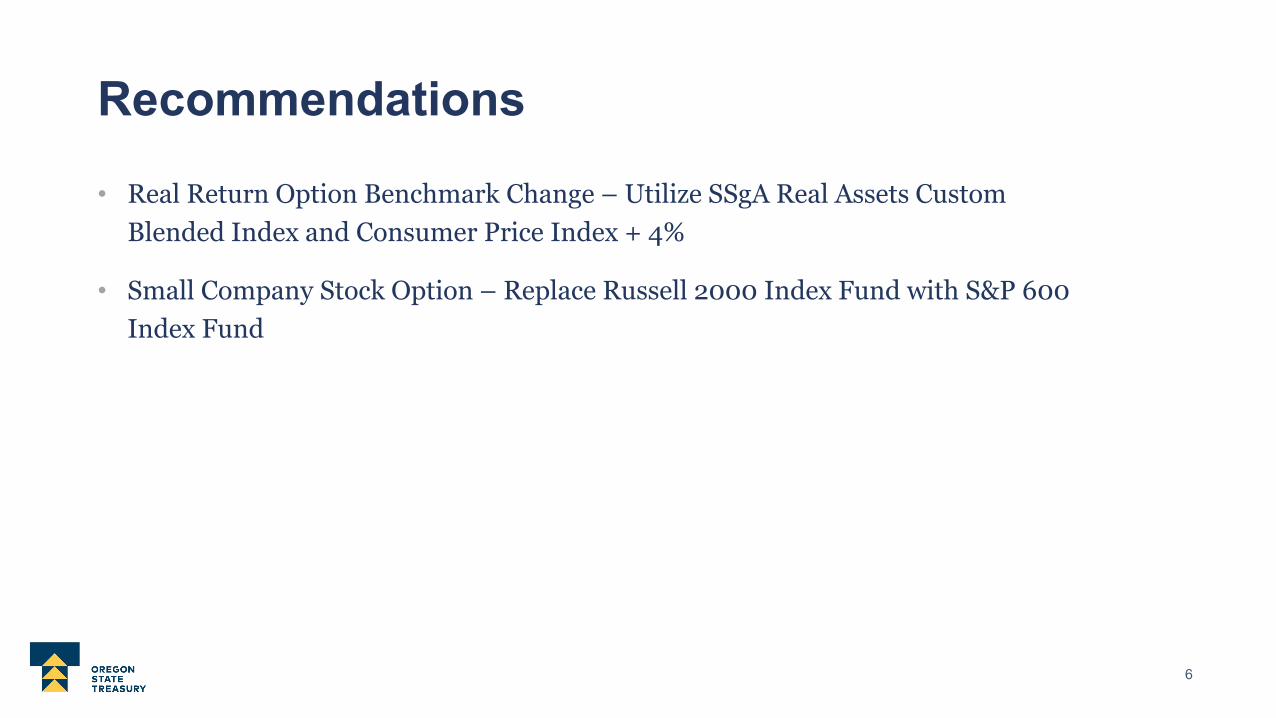
Recommendations
• Real Return Option Benchmark Change – Utilize SSgA Real Assets Custom Blended Index and Consumer Price Index + 4%
• Small Company Stock Option – Replace Russell 2000 Index Fund with S&P 600 Index Fund

Tobias ReadOregon State Treasurer
oregon.gov/treasury16290 SW Upper Boones Ferry RoadTigard, OR 97224
2019 Annual Review
September 18, 2019
Anne HeaphyFund Sponsor Consulting
Uvan Tseng, CFAFund Sponsor Consulting

OSGP Annual Review

3Knowledge. Experience. Integrity. OSGP Annual Review 2019
OSGP Investment Structure
Risk Spectrum Tier I. Asset Allocation Options Tier II. Core Options Tier III. Specialty Options
Conservative Capital PreservationStable Value Option
Fixed IncomeTarget Date Funds Active Fixed Income Option
LifePath Portfolios Broad U.S. Equity
Stock Index Option - Russell 3000 Specialty Equity
Large Cap U.S. Equity Socially Responsible Investment Option
Large Company Value Stock Option
Large Company Growth Stock Option
Small Cap U.S. EquitySmall Company Stock Option
International Equity Inflation SensitiveInternational Stock Option Real Return Option
Brokerage WindowAggressive Schwab PCRA
OSGP Investment Structure

4Knowledge. Experience. Integrity. OSGP Annual Review 2019
Asset DistributionJune 30, 2019 June 30, 2018
Market Value Weight Net New Inv. Inv. Return Market Value WeightTier I - Asset Allocation Options
Target Date Funds $728,529,198 31.32% $(1,343,197) $42,911,505 $686,960,890 31.51%LifePath Index Retirement Fund L 189,917,979 8.17% (17,073,775) 11,342,178 195,649,576 8.97%LifePath Index 2020 Fund L 140,893,358 6.06% (9,837,221) 8,482,525 142,248,054 6.52%LifePath Index 2025 Fund L 120,409,865 5.18% 5,005,329 7,027,605 108,376,931 4.97%LifePath Index 2030 Fund L 89,912,336 3.87% 4,720,281 5,281,726 79,910,330 3.66%LifePath Index 2035 Fund L 67,441,347 2.90% 4,865,707 3,815,789 58,759,852 2.69%LifePath Index 2040 Fund L 46,810,016 2.01% 4,814,622 2,736,748 39,258,645 1.80%LifePath Index 2045 Fund L 31,855,181 1.37% 4,313,496 1,871,362 25,670,322 1.18%LifePath Index 2050 Fund L 25,262,069 1.09% 512,127 1,442,066 23,307,876 1.07%LifePath Index 2055 Fund L 9,533,426 0.41% 306,253 523,609 8,703,565 0.40%LifePath Index 2060 Fund L 6,493,622 0.28% 1,029,985 387,898 5,075,738 0.23%
Tier II - Core Inv estment Options
Stable Value Option Galliard 286,833,937 12.33% 67,986,856 5,259,137 213,587,945 9.80%
Activ e Fixed Income Option BlackRock / DoubleLine / Wellington 149,801,970 6.44% 29,263,429 9,659,675 110,878,866 5.09%
Stock Index Option BlackRock 271,263,366 11.66% (3,886,731) 21,511,602 253,638,495 11.63%
Large Company Value Stock Option BlackRock 200,621,223 8.63% (5,139,969) 16,032,792 189,728,400 8.70%
Large Company Growth Stock Option BlackRock 279,457,549 12.02% (3,973,887) 34,015,115 249,416,321 11.44%
Small Company Stock Option BlackRock / Callan / DFA 245,359,509 10.55% (16,394,886) (16,842,012) 278,596,406 12.78%
International Stock Option AQR / Arrowstreet / DFA* / Lazard 121,110,193 5.21% 6,136,642 (1,859,212) 116,832,763 5.36%
Tier III - Specialty Options
Socially Responsible Inv estment Option TIAA-CREF 17,868,122 0.77% 2,953,305 2,820,365 12,094,452 0.55%
Real Return Option State Street 4,344,058 0.19% (1,710,759) 1,933,469 4,121,348 0.19%
Brokerage Window 20,669,536 0.89% 5,979,344 468,447 14,221,745 0.65%
Total Fund $2,325,869,489 100.0% $28,854,545 $116,626,827 $2,180,388,117 100.0%
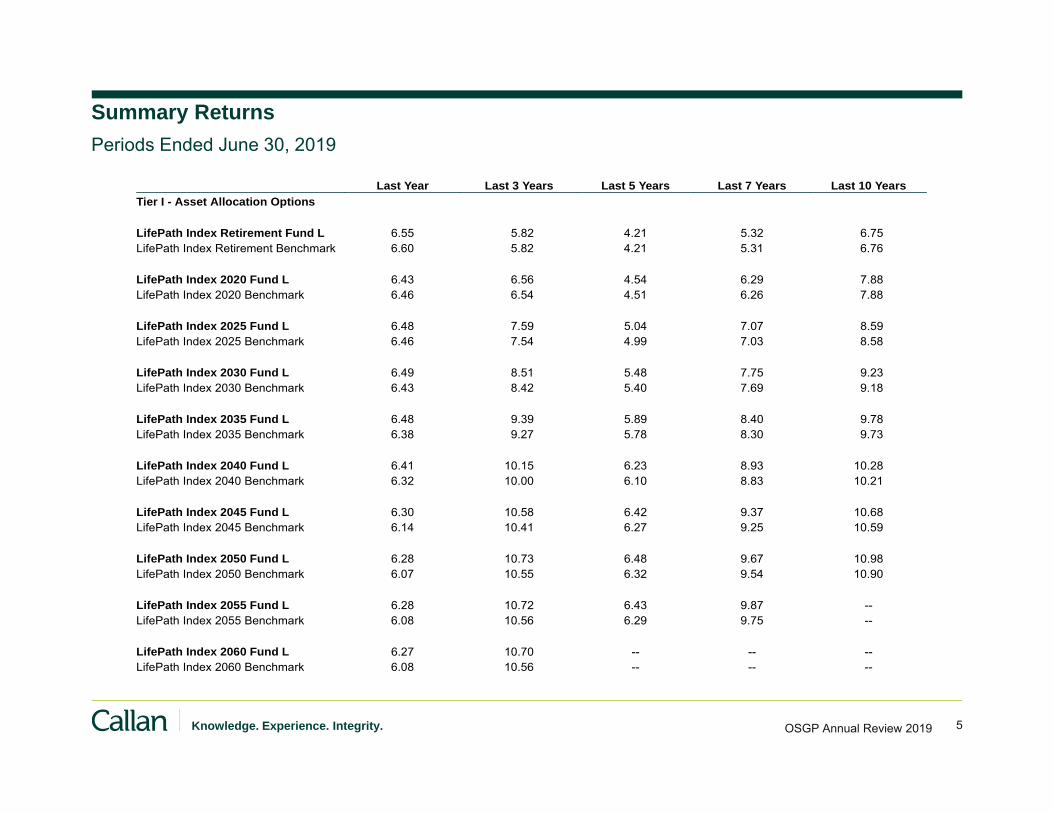
5Knowledge. Experience. Integrity. OSGP Annual Review 2019
Summary ReturnsPeriods Ended June 30, 2019
Last Year Last 3 Years Last 5 Years Last 7 Years Last 10 YearsTier I - Asset Allocation Options
LifePath Index Retirement Fund L 6.55 5.82 4.21 5.32 6.75LifePath Index Retirement Benchmark 6.60 5.82 4.21 5.31 6.76
LifePath Index 2020 Fund L 6.43 6.56 4.54 6.29 7.88LifePath Index 2020 Benchmark 6.46 6.54 4.51 6.26 7.88
LifePath Index 2025 Fund L 6.48 7.59 5.04 7.07 8.59LifePath Index 2025 Benchmark 6.46 7.54 4.99 7.03 8.58
LifePath Index 2030 Fund L 6.49 8.51 5.48 7.75 9.23LifePath Index 2030 Benchmark 6.43 8.42 5.40 7.69 9.18
LifePath Index 2035 Fund L 6.48 9.39 5.89 8.40 9.78LifePath Index 2035 Benchmark 6.38 9.27 5.78 8.30 9.73
LifePath Index 2040 Fund L 6.41 10.15 6.23 8.93 10.28LifePath Index 2040 Benchmark 6.32 10.00 6.10 8.83 10.21
LifePath Index 2045 Fund L 6.30 10.58 6.42 9.37 10.68LifePath Index 2045 Benchmark 6.14 10.41 6.27 9.25 10.59
LifePath Index 2050 Fund L 6.28 10.73 6.48 9.67 10.98LifePath Index 2050 Benchmark 6.07 10.55 6.32 9.54 10.90
LifePath Index 2055 Fund L 6.28 10.72 6.43 9.87 --LifePath Index 2055 Benchmark 6.08 10.56 6.29 9.75 --
LifePath Index 2060 Fund L 6.27 10.70 -- -- --LifePath Index 2060 Benchmark 6.08 10.56 -- -- --

6Knowledge. Experience. Integrity. OSGP Annual Review 2019
Summary ReturnsPeriods Ended June 30, 2019
Last Year Last 3 Years Last 5 Years Last 7 Years Last 10 Years Last 15 YearsTier II - Core Investment Options
Stable Value Option 2.44 2.10 1.91 1.83 1.88 2.703-month Treasury Bill 2.31 1.38 0.87 0.65 0.49 1.38
Active Fixed Income Option 7.44 3.16 3.36 3.20 4.88 4.76Bloomberg Aggregate Index 7.87 2.31 2.95 2.62 3.90 4.27
Stock Index Option 9.05 14.11 10.28 13.87 14.75 8.92Russell 3000 Index 8.98 14.02 10.19 13.79 14.67 8.88
Large Company Value Stock Option 8.62 10.29 7.47 12.67 13.25 7.98Russell 1000 Value Index 8.46 10.19 7.46 12.09 13.19 7.84
Large Company Growth Stock Option 11.54 18.06 13.06 15.72 16.15 9.55Russell 1000 Growth Index 11.56 18.07 13.39 15.76 16.28 9.90
Small Company Stock Option (3.36) 11.88 6.81 11.55 13.65 8.84Russell 2000 Index (3.31) 12.30 7.06 11.63 13.45 8.15
International Stock Option (0.25) 8.26 2.43 7.04 6.96 5.52MSCI ACWI ex US Index 1.29 9.39 2.16 6.36 6.54 5.85
Tier III - Specialty Options
Socially Responsible Investment Option 8.85 13.60 -- -- -- --Russell 3000 Index 8.98 14.02 10.19 13.79 14.67 8.88
Real Return Option 1.39 3.39 -- -- -- --Consumer Price Index + 3% 4.44 5.01 4.25 4.44 4.70 5.01

7Knowledge. Experience. Integrity. OSGP Annual Review 2019
Investment Options Fee Summary
*Fee data provided by OST.
Asset Class and Strategy
Total Annual Operating
Expense Ratio*
Institutional Peer Group
Median
Asset Allocation Options LifePath Index Retirement, 2020 – 2060 Funds; L 0.090% 0.12% - 0.13% Capital Preservation Stable Value Option 0.351% 0.55% Fixed Income Active Fixed Income Option 0.1670% 0.77% U.S. Large Cap Equity Stock Index Option 0.036% 0.04%Large Company Value Stock Option 0.026% 0.04% Large Company Growth Stock Option 0.026% 0.04% U.S. Small Cap Equity Small Company Stock Option 0.394% 1.17% International Equity International Stock Option 0.540% 1.10% Specialty Options Socially Responsible Investment Option 0.170% 0.94% Real Return Option 0.220% 0.63%

TDF Suitability Study Summary

9Knowledge. Experience. Integrity. OSGP Annual Review 2019
Introduction
DOL Tips

10Knowledge. Experience. Integrity. OSGP Annual Review 2019
ConsiderationsPlan Specific Considerations
Consideration Notes
Presence of a DB plan (and coverage) For the purposes of this study participants are assumed to participate in either the Tier I, Tier II or OPSRP Pension. The targeted payout from these pensions is 45% income replacement.
Assumed retirement age Participants are assumed to retire any time after age 50 (minimum of 25 years of service time).
Average total contribution The study models contribution rates of 6, 7 and 8%. These rates are supported by underlying participant data.
Post-retirement health care benefits Most participants have access to the PERS Health Insurance Program (PHIP) which is an option for retiree health coverage.
Male-to-female ratio The study assumes a 50/50 male-to-female split.
Age concentration The population of participants as well as target date users is concentrated in those over age 50. Those aged 65 and older are the largest demographic group.
Turnover Compared to the typical plan, turnover at 16 years is low relative to the wider DC market as well as the public space. With working-age participants staying within the plan, there is presumably more time for them to recover from market downturns.
DOL Tip: Establish a process for comparing and selecting TDFs. Plan sponsors should discuss the significance of other characteristics of the participant population, such as participation in a traditional defined benefit pension plan offered by the employer, salary levels, turnover rates, contribution rates and withdrawal patterns.
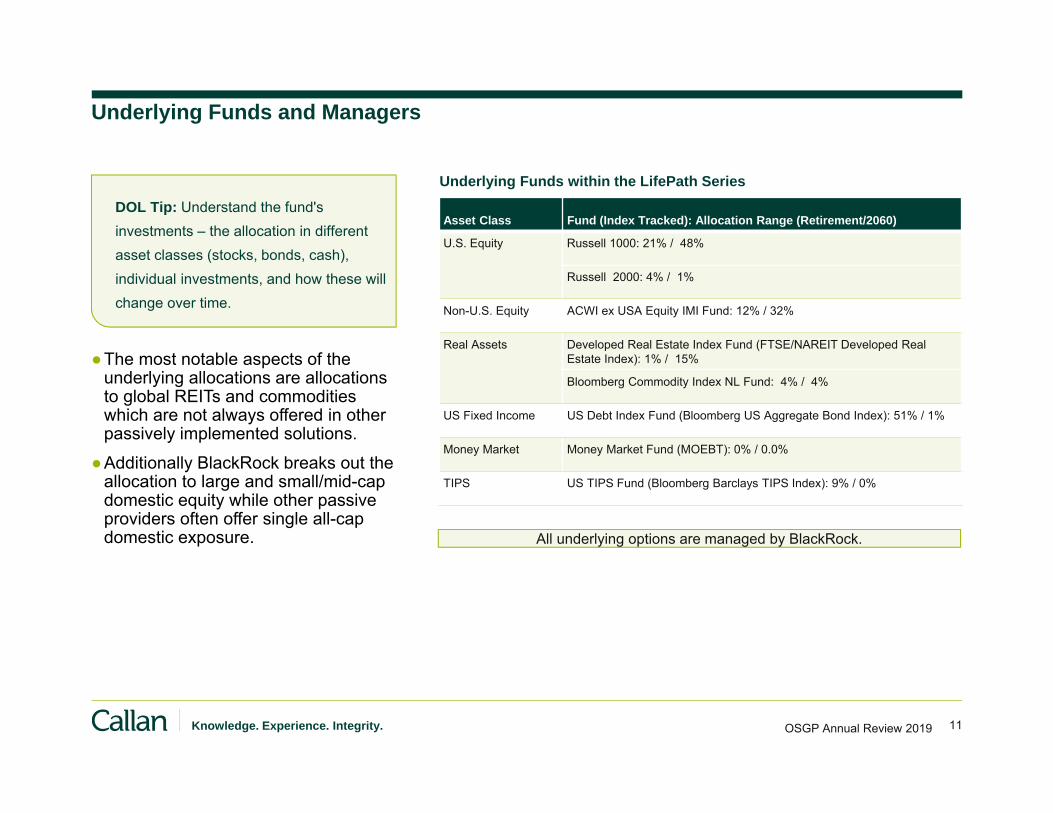
11Knowledge. Experience. Integrity. OSGP Annual Review 2019
Underlying Funds and Managers
●The most notable aspects of the underlying allocations are allocations to global REITs and commodities which are not always offered in other passively implemented solutions.
●Additionally BlackRock breaks out the allocation to large and small/mid-cap domestic equity while other passive providers often offer single all-cap domestic exposure.
Asset Class Fund (Index Tracked): Allocation Range (Retirement/2060)
U.S. Equity Russell 1000: 21% / 48%
Russell 2000: 4% / 1%
Non-U.S. Equity ACWI ex USA Equity IMI Fund: 12% / 32%
Real Assets Developed Real Estate Index Fund (FTSE/NAREIT Developed Real Estate Index): 1% / 15%
Bloomberg Commodity Index NL Fund: 4% / 4%
US Fixed Income US Debt Index Fund (Bloomberg US Aggregate Bond Index): 51% / 1%
Money Market Money Market Fund (MOEBT): 0% / 0.0%
TIPS US TIPS Fund (Bloomberg Barclays TIPS Index): 9% / 0%
All underlying options are managed by BlackRock.
Underlying Funds within the LifePath Series
DOL Tip: Understand the fund's investments – the allocation in different asset classes (stocks, bonds, cash), individual investments, and how these will change over time.
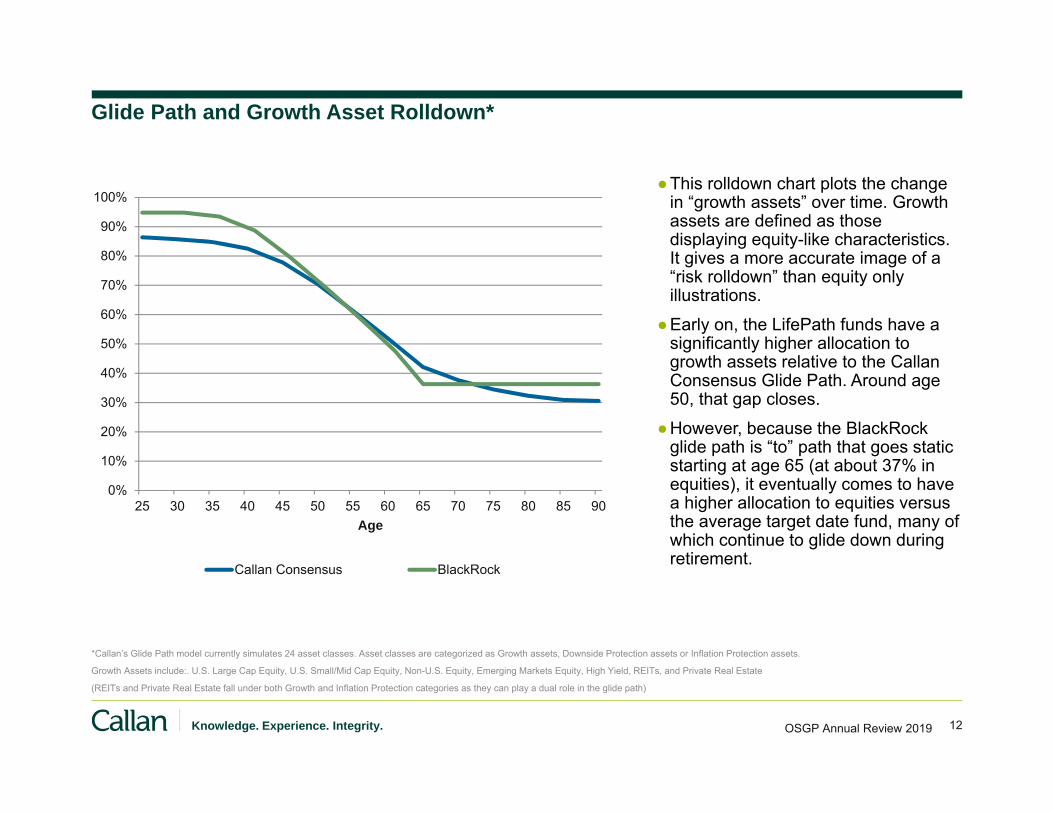
12Knowledge. Experience. Integrity. OSGP Annual Review 2019
Glide Path and Growth Asset Rolldown*
●This rolldown chart plots the change in “growth assets” over time. Growth assets are defined as those displaying equity-like characteristics. It gives a more accurate image of a “risk rolldown” than equity only illustrations.
●Early on, the LifePath funds have a significantly higher allocation to growth assets relative to the Callan Consensus Glide Path. Around age 50, that gap closes.
●However, because the BlackRock glide path is “to” path that goes static starting at age 65 (at about 37% in equities), it eventually comes to have a higher allocation to equities versus the average target date fund, many of which continue to glide down during retirement.
*Callan’s Glide Path model currently simulates 24 asset classes. Asset classes are categorized as Growth assets, Downside Protection assets or Inflation Protection assets.
Growth Assets include:. U.S. Large Cap Equity, U.S. Small/Mid Cap Equity, Non-U.S. Equity, Emerging Markets Equity, High Yield, REITs, and Private Real Estate
(REITs and Private Real Estate fall under both Growth and Inflation Protection categories as they can play a dual role in the glide path)
0%
10%
20%
30%
40%
50%
60%
70%
80%
90%
100%
25 30 35 40 45 50 55 60 65 70 75 80 85 90Age
Callan Consensus BlackRock

13Knowledge. Experience. Integrity. OSGP Annual Review 2019
Downside Protection Assets*
●Downside protection assets include core and short-term fixed income, international fixed income as well as cash.
●Early on and in late retirement, BlackRock’s glide path features a significantly lower allocation to downside protection assets.
●The downside protection comes primarily through core fixed income.
*U.S. Fixed, Non-U.S. Fixed, Hedge Funds, Long Duration, Stable Value, Short Duration, and Cash
0%
10%
20%
30%
40%
50%
60%
70%
25 30 35 40 45 50 55 60 65 70 75 80 85 90Age
Callan Consensus BlackRock

14Knowledge. Experience. Integrity. OSGP Annual Review 2019
Inflation Protection Assets*
● Inflation protection assets include TIPS, REITs and commodities.
●The LifePath funds have an inflation sensitive allocation covering commodities, global REITs and TIPS.
●BlackRock’s inflation protection glide path differs from that of the Callan Consensus, being higher early on, and lower later on in the glide path.
●As the participant ages, the allocation to REITs and commodities decreases while the allocation to TIPS increases.
●The total allocation to combined inflation protection assets decreases across the glide path. However, it is higher than that of the Callan Consensus throughout the glide path.
*Inflation Protection Assets include TIPS, Commodities, REITs and Private Real Estate
0%
2%
4%
6%
8%
10%
12%
14%
16%
18%
20%
25 30 35 40 45 50 55 60 65 70 75 80 85 90Age
Callan Consensus BlackRock

15Knowledge. Experience. Integrity. OSGP Annual Review 2019
Target Income Replacement Assumptions
●The following pages take the Plan’s demographics and projected outcomes based on a 40-year holding period and Callan’s capital market expectations.
●The income replacement ratio is equal to projected post-retirement annual income divided by projected final salary in the year before retirement.
●Typically, an individual needs less than 100% income replacement in retirement to maintain the same standard of living. The primary reasons for this are:– A decrease in income taxes– Reduced spending on wardrobe (presumably work related) and less spending from “walk-around money” (think of lunch and coffee
purchases)– Reduced spending on transportation largely attributable to no longer commuting– Saving for retirement ceases
●Studies have found that income replacement ratios in the range of 80-90% are generally required to maintain one’s same standard of living in retirement. For the purposes of this study, a target of 80% will be used.– Post-retirement healthcare costs may require a higher level of income replacement*
●The following table outlines the assumptions used to arrive at target replacement:
*Measuring Retirement Income Adequacy: Calculating Realistic Income Replacement Rates, EBRI 2006
Income in Retirement Goals
OPSRP DC Replacement Total
45% 35% 80%
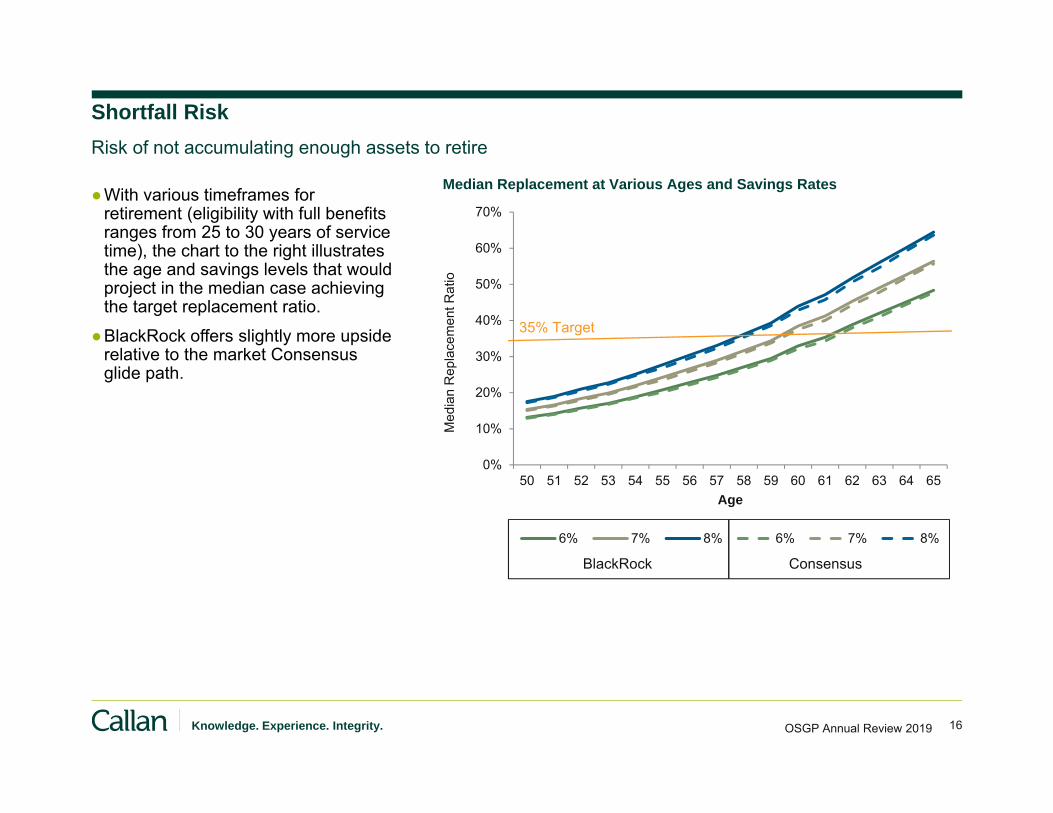
16Knowledge. Experience. Integrity.
0%
10%
20%
30%
40%
50%
60%
70%
50 51 52 53 54 55 56 57 58 59 60 61 62 63 64 65
Med
ian
Rep
lace
men
t Rat
io
Age
6% 7% 8% 6% 7% 8%
Shortfall Risk
●With various timeframes for retirement (eligibility with full benefits ranges from 25 to 30 years of service time), the chart to the right illustrates the age and savings levels that would project in the median case achieving the target replacement ratio.
●BlackRock offers slightly more upside relative to the market Consensus glide path.
Risk of not accumulating enough assets to retire
35% Target
BlackRock Consensus
Median Replacement at Various Ages and Savings Rates
OSGP Annual Review 2019

17Knowledge. Experience. Integrity.
Downside Risk
●Closely mirroring the Callan Consensus, the LifePath funds feature metrics similar to the Consensus.
●There is often an explicit tradeoff between downside risk and shortfall risk.
Risk of volatility, particularly in the preretirement period
*Rolldown Rate is the slope of growth assets from age 50 to age 65.
**For a complete definition please see Appendix VI: Glossary.
***Although there are three downside protection assets, there is currently no allocation to cash, though this is an asset class the funds may allocate to.
“Worst Case” is defined as the 97.5th percentile worst case drawdown from age 50-65. “Expected” is the median result.
Glide path allocations reflect strategic glide path weights.
Number of Downside Protection
Assets
Age 50 to 65
Roll Down Rate*
Average % of Downside Protection Assets**
Expected Standard Deviation
Worst Case Multi-Year Return
LifePath 3 *** 2.3% 41% 10.6% -31%
Callan Consensus 3 1.9% 41% 10.4% -32%
OSGP Annual Review 2019

18Knowledge. Experience. Integrity.
Inflation Risk
●The ability to respond to inflation is a function not only of a glide path’s exposure to inflation sensitive assets but also of the breadth of this exposure. Various asset classes respond to different types of inflation at different times.
●The LifePath funds provide early exposure to inflation sensitive assets through REITs and commodities. As these allocations decrease there is an increase in TIPS.
●The overall decrease in REITs and commodities is of greater magnitude than the commensurate increase in TIPS leading to an overall decrease in inflation sensitive assets over the course of the glide path.
Risk of inflation adversely affecting outcomes
Glide path allocations reflect strategic glide path weights.
*Represents the average across the universe.
Average Inflation Assets (65-85)
% of Inflation Protection Assets at Age 60
% of Inflation Protection Assets at Age 65
Number of Inflation Protection Assets
LifePath 13.0% 13.5% 13.0% 3
Callan Consensus 10.6% 8.6% 9.8% 2*
OSGP Annual Review 2019
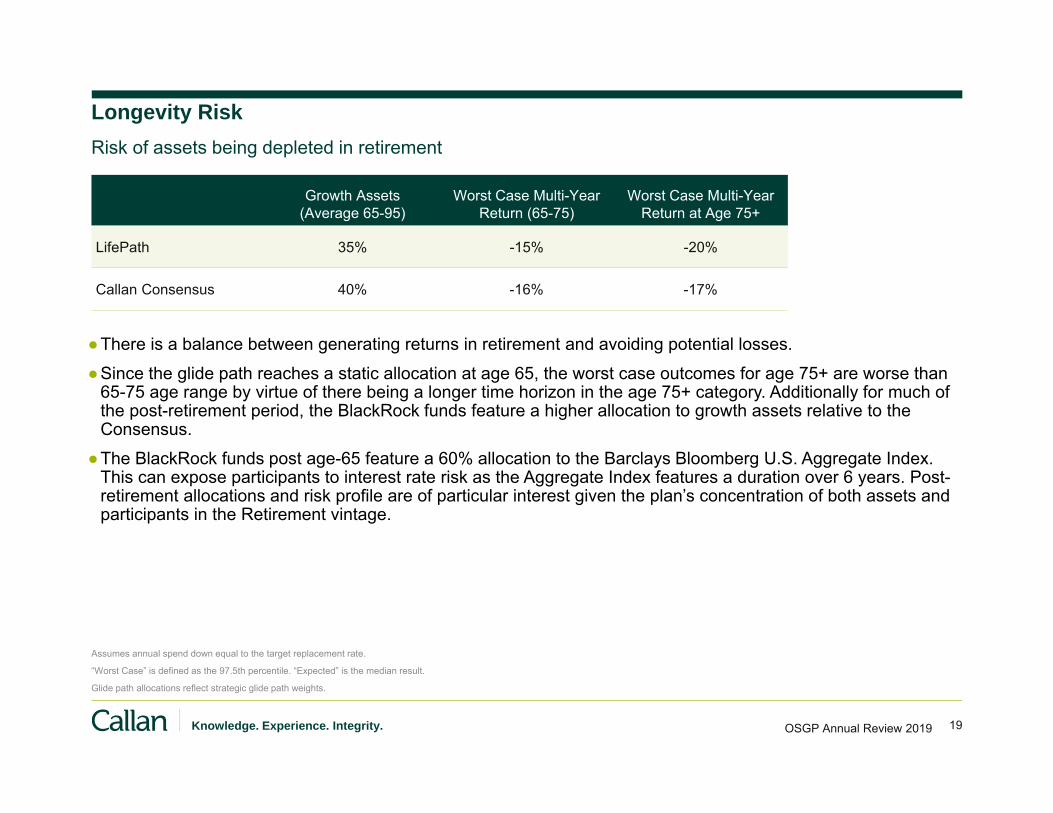
19Knowledge. Experience. Integrity.
Longevity Risk
●There is a balance between generating returns in retirement and avoiding potential losses.
●Since the glide path reaches a static allocation at age 65, the worst case outcomes for age 75+ are worse than 65-75 age range by virtue of there being a longer time horizon in the age 75+ category. Additionally for much of the post-retirement period, the BlackRock funds feature a higher allocation to growth assets relative to the Consensus.
●The BlackRock funds post age-65 feature a 60% allocation to the Barclays Bloomberg U.S. Aggregate Index. This can expose participants to interest rate risk as the Aggregate Index features a duration over 6 years. Post-retirement allocations and risk profile are of particular interest given the plan’s concentration of both assets and participants in the Retirement vintage.
Risk of assets being depleted in retirement
Assumes annual spend down equal to the target replacement rate.
“Worst Case” is defined as the 97.5th percentile. “Expected” is the median result.
Glide path allocations reflect strategic glide path weights.
Growth Assets (Average 65-95)
Worst Case Multi-Year Return (65-75)
Worst Case Multi-Year Return at Age 75+
LifePath 35% -15% -20%
Callan Consensus 40% -16% -17%
OSGP Annual Review 2019
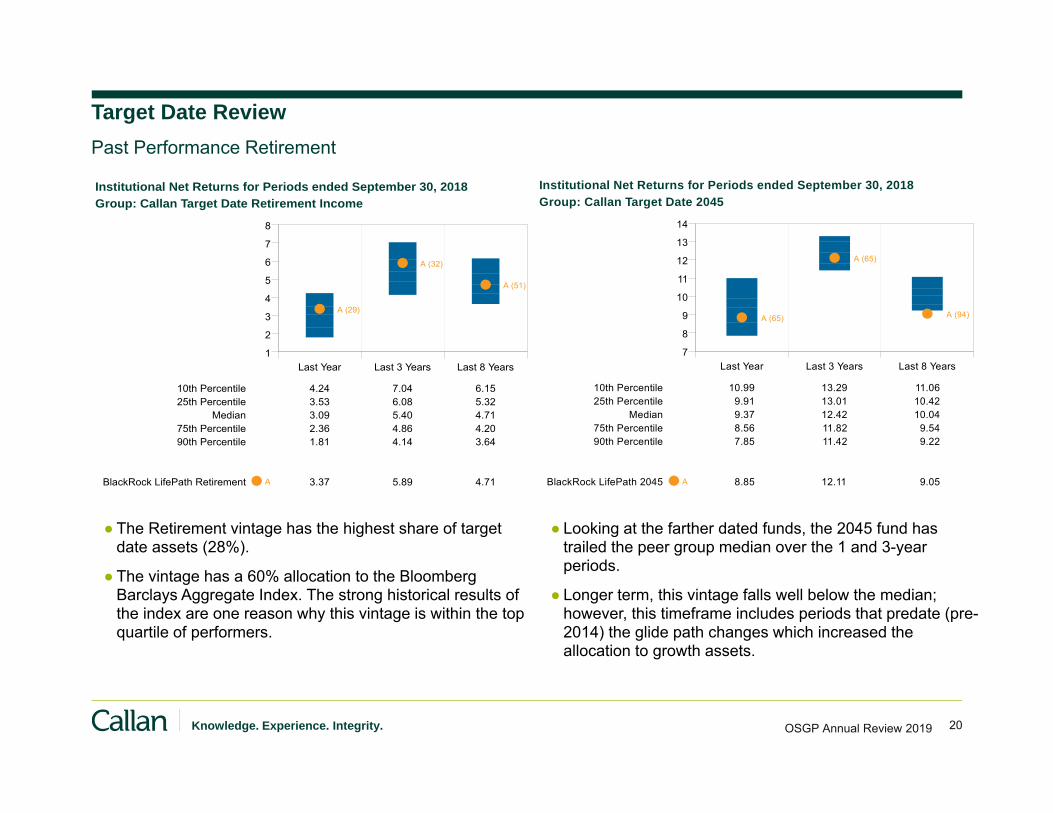
20Knowledge. Experience. Integrity. OSGP Annual Review 2019
Target Date Review
● The Retirement vintage has the highest share of target date assets (28%).
● The vintage has a 60% allocation to the Bloomberg Barclays Aggregate Index. The strong historical results of the index are one reason why this vintage is within the top quartile of performers.
Past Performance Retirement
Last Year Last 3 Years Last 8 Years1
2
3
4
5
6
7
8
Group: Callan Target Date Retirement IncomeInstitutional Net Returns for Periods ended September 30, 2018
10th Percentile 4.24 7.04 6.1525th Percentile 3.53 6.08 5.32
Median 3.09 5.40 4.7175th Percentile 2.36 4.86 4.2090th Percentile 1.81 4.14 3.64
BlackRock LifePath Retirement A 3.37 5.89 4.71
A (29)
A (32)
A (51)
Last Year Last 3 Years Last 8 Years7
8
9
10
11
12
13
14
Group: Callan Target Date 2045Institutional Net Returns for Periods ended September 30, 2018
10th Percentile 10.99 13.29 11.0625th Percentile 9.91 13.01 10.42
Median 9.37 12.42 10.0475th Percentile 8.56 11.82 9.5490th Percentile 7.85 11.42 9.22
BlackRock LifePath 2045 A 8.85 12.11 9.05
A (65)
A (65)
A (94)
● Looking at the farther dated funds, the 2045 fund has trailed the peer group median over the 1 and 3-year periods.
● Longer term, this vintage falls well below the median; however, this timeframe includes periods that predate (pre-2014) the glide path changes which increased the allocation to growth assets.
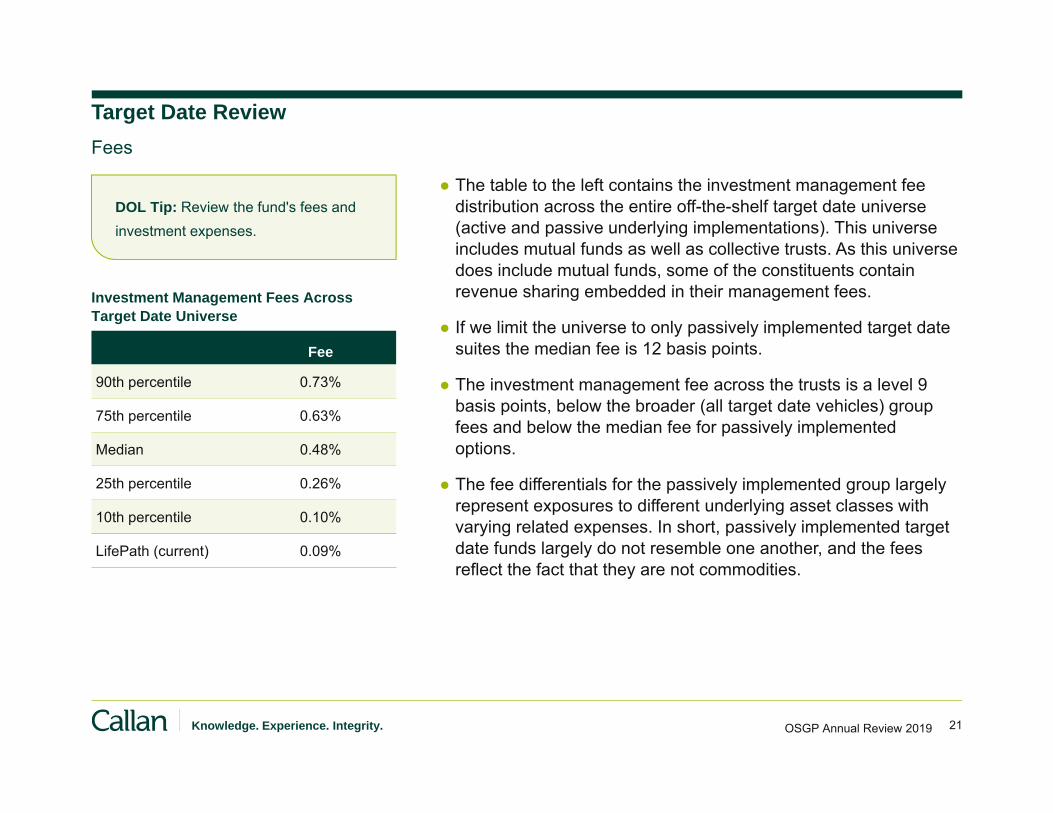
21Knowledge. Experience. Integrity.
Target Date Review Fees
● The table to the left contains the investment management fee distribution across the entire off-the-shelf target date universe (active and passive underlying implementations). This universe includes mutual funds as well as collective trusts. As this universe does include mutual funds, some of the constituents contain revenue sharing embedded in their management fees.
● If we limit the universe to only passively implemented target date suites the median fee is 12 basis points.
● The investment management fee across the trusts is a level 9 basis points, below the broader (all target date vehicles) group fees and below the median fee for passively implemented options.
● The fee differentials for the passively implemented group largely represent exposures to different underlying asset classes with varying related expenses. In short, passively implemented target date funds largely do not resemble one another, and the fees reflect the fact that they are not commodities.
Fee
90th percentile 0.73%
75th percentile 0.63%
Median 0.48%
25th percentile 0.26%
10th percentile 0.10%
LifePath (current) 0.09%
DOL Tip: Review the fund's fees and investment expenses.
Investment Management Fees Across Target Date Universe
OSGP Annual Review 2019
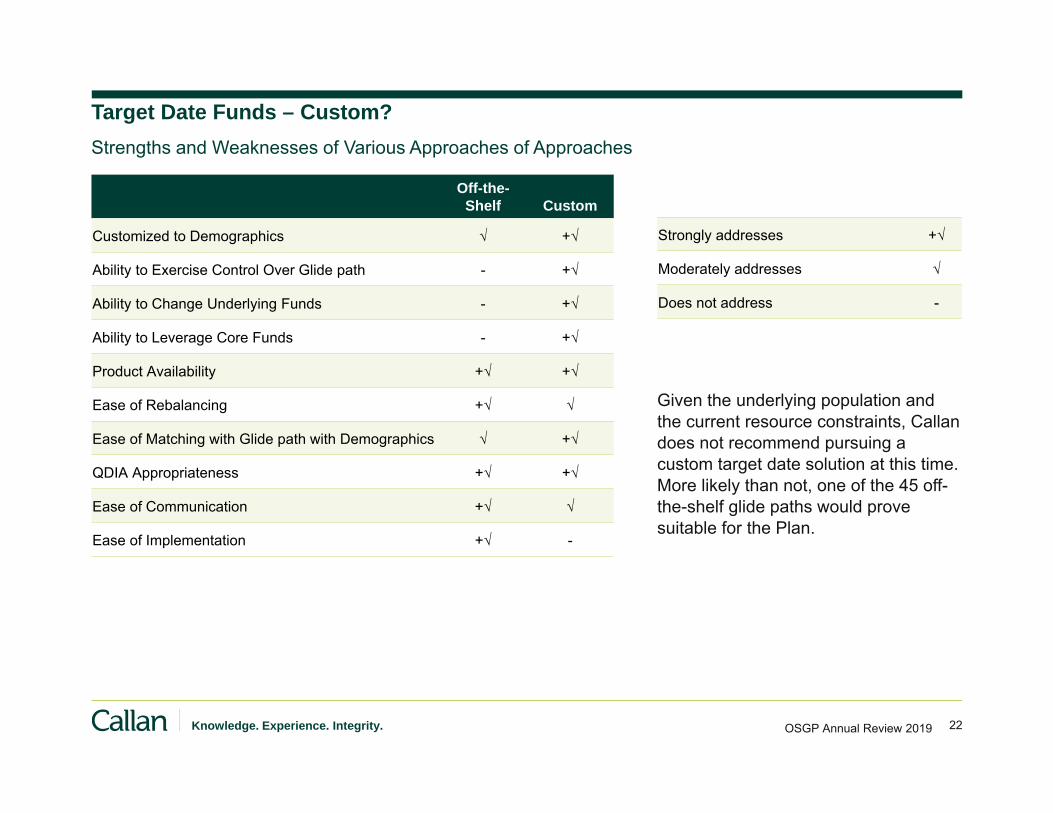
22Knowledge. Experience. Integrity. OSGP Annual Review 2019
Target Date Funds – Custom?
Given the underlying population and the current resource constraints, Callan does not recommend pursuing a custom target date solution at this time. More likely than not, one of the 45 off-the-shelf glide paths would prove suitable for the Plan.
Strengths and Weaknesses of Various Approaches of Approaches
Off-the-Shelf Custom
Customized to Demographics √ +√
Ability to Exercise Control Over Glide path - +√
Ability to Change Underlying Funds - +√
Ability to Leverage Core Funds - +√
Product Availability +√ +√
Ease of Rebalancing +√ √
Ease of Matching with Glide path with Demographics √ +√
QDIA Appropriateness +√ +√
Ease of Communication +√ √
Ease of Implementation +√ -
Strongly addresses +√
Moderately addresses √
Does not address -
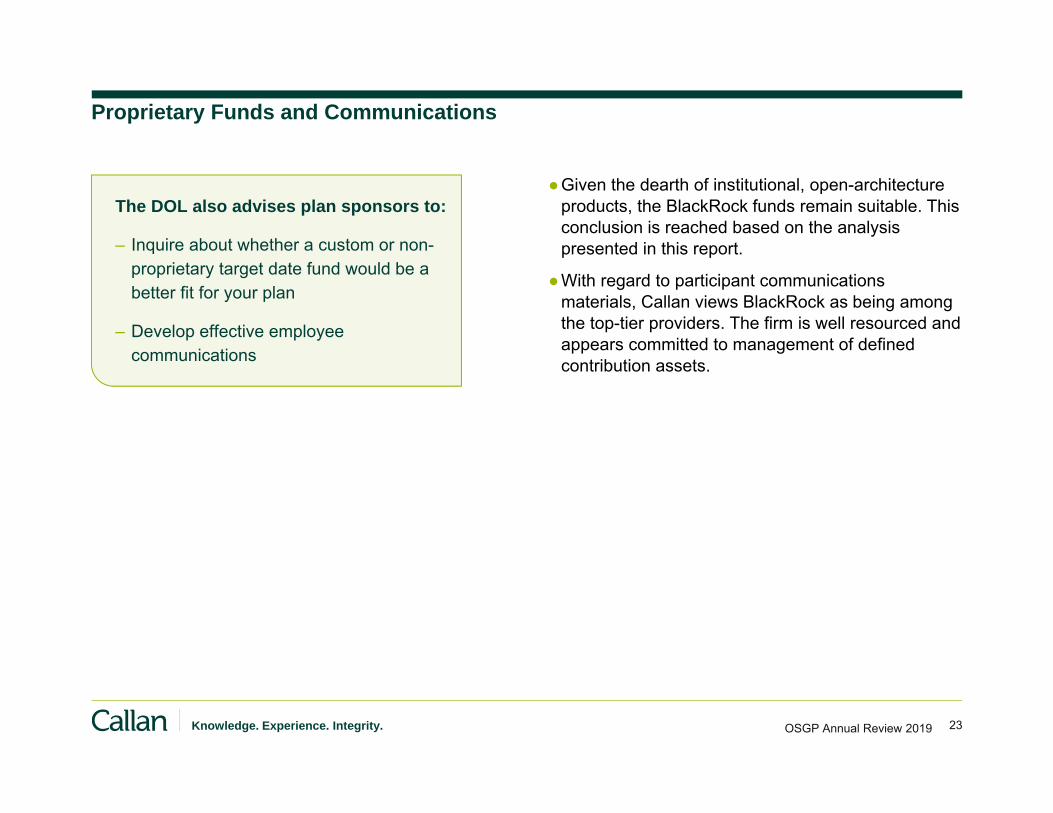
23Knowledge. Experience. Integrity. OSGP Annual Review 2019
Proprietary Funds and Communications
●Given the dearth of institutional, open-architecture products, the BlackRock funds remain suitable. This conclusion is reached based on the analysis presented in this report.
●With regard to participant communications materials, Callan views BlackRock as being among the top-tier providers. The firm is well resourced and appears committed to management of defined contribution assets.
The DOL also advises plan sponsors to:
– Inquire about whether a custom or non-proprietary target date fund would be a better fit for your plan
– Develop effective employee communications

24Knowledge. Experience. Integrity. OSGP Annual Review 2019
Summary
Consideration Notes
Historical Performance With regard to past performance, the funds have by-and-large bested peers on an absolute and risk-adjusted basis. This outperformance is more pronounced in shorter time periods which account for the changes to the glide path (which occurred in 2014).
Team and Organization The funds feature a long-tenured, stable team backed by a deep and committed organization.
Number, type and Quality of underlying funds
There are eight underlying building blocks that are limited by the low-cost passive implementation. Given the fully passive implementation, they are unlikely to include tough-to-index asset classes. There is limited exposure to diversified fixed income asset classes.
Glide path construction The glide path underwent a shift in the fourth quarter of 2014. As currently constituted it represents a moderate (as opposed to aggressive or conservative) allocation, with a higher allocation to growth assets early on and in late retirement (age 75+).
Forward looking projections(Risks)
Overall, many of the risks present are classified as “moderate” relative to the wider universe. The funds feature more and higher allocations to inflation sensitive assets.
Fees The investment management fees across the product suite remain reasonable compared to other passively implemented collective trusts.

OSGP Small Cap OptionStructure Analysis

26Knowledge. Experience. Integrity. OSGP Annual Review 2019
OSGP Small Company Stock Option Structure
OSGP’s Small Company Stock Option consists of the following underlying strategies with a 1/3 target allocation to each:● BlackRock Russell 2000 Index Fund● DFA US Small Cap Portfolio● Callan Small Cap Equity Fund
This structure has been in place since 2015. Longer term history represents a different structure.
Callan and OST Investment Staff regularly monitor the performance of the underlying strategies to determine if:● Underperformance is structural, driven by market conditions, or other reasons● There are better and/or more complementary strategies● The underlying strategies should be active, passive, or both
Recommendation:● Continue to monitor the active portfolios● Replace the BlackRock Russell 2000 Index Fund with the BlackRock S&P 600 Index Fund● Performance of the S&P 600 Index has outpaced the Russell 2000 Index over intermediate and long-term time
periods● The fee impact would be neutral● Would further align OSGP with OPERF
Overview

27Knowledge. Experience. Integrity. OSGP Annual Review 2019
Small Company Stock OptionPeriods Ended June 30, 2019
Performance vs Callan Small Cap Mutual Funds (Institutional Net)
Last Quarter Last Year Last 3 Years Last 5 Years Last 7 Years Last 10 Years(15)
(10)
(5)
0
5
10
15
20
25
10th Percentile 7.83 12.92 21.52 12.55 15.45 16.6125th Percentile 5.81 7.96 18.64 10.99 14.32 15.88
Median 3.20 0.83 12.76 7.60 12.14 13.9975th Percentile 1.69 (5.87) 8.59 4.93 10.51 12.7890th Percentile 0.26 (9.55) 7.02 3.25 8.43 11.15
Small Company Stock Option 2.30 (3.36) 11.88 6.81 11.55 13.65
Russell 2000 Index 2.10 (3.31) 12.30 7.06 11.63 13.45
(67)
(63)
(56)
(60)
(61)
(58)
(70)(63)
(53)
(57)
(59) (60)
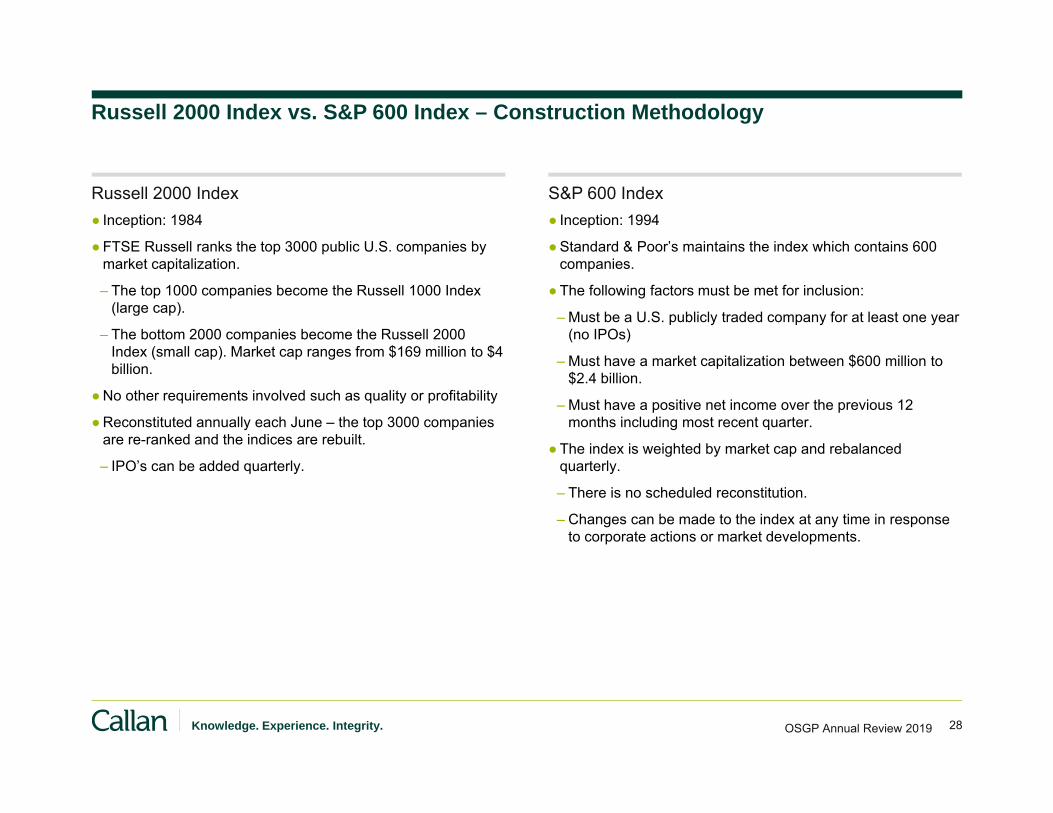
28Knowledge. Experience. Integrity. OSGP Annual Review 2019
Russell 2000 Index vs. S&P 600 Index – Construction Methodology
Russell 2000 Index● Inception: 1984
●FTSE Russell ranks the top 3000 public U.S. companies by market capitalization.
– The top 1000 companies become the Russell 1000 Index (large cap).
– The bottom 2000 companies become the Russell 2000 Index (small cap). Market cap ranges from $169 million to $4 billion.
●No other requirements involved such as quality or profitability
●Reconstituted annually each June – the top 3000 companies are re-ranked and the indices are rebuilt.
– IPO’s can be added quarterly.
S&P 600 Index● Inception: 1994
●Standard & Poor’s maintains the index which contains 600 companies.
●The following factors must be met for inclusion:
– Must be a U.S. publicly traded company for at least one year (no IPOs)
– Must have a market capitalization between $600 million to $2.4 billion.
– Must have a positive net income over the previous 12 months including most recent quarter.
●The index is weighted by market cap and rebalanced quarterly.
– There is no scheduled reconstitution.
– Changes can be made to the index at any time in response to corporate actions or market developments.

29Knowledge. Experience. Integrity. OSGP Annual Review 2019
Portfolio Characteristics
●Characteristics between the Russell 2000 Index and S&P 600 Index are mostly similar.
●The main differences are in the weighted median market cap and the number of holdings.
Market Cap.Wtd. Median Price/Book Value
EarningsForecasted Gr. in Dividend Yield
ScoreCombined Z
HoldingsNumber of
1009080706050403020100
Group: Callan Small Cap Mutual FundsPortfolio Characteristics for Quarter Ended June 30, 2019
10th Percentile 3.89 4.82 20.46 2.02 0.80 25425th Percentile 3.46 3.97 17.22 1.63 0.47 123
Median 2.78 2.40 13.50 1.16 0.00 8075th Percentile 2.25 1.61 11.17 0.66 (0.39) 5390th Percentile 1.67 1.39 8.19 0.34 (0.60) 35
Russell:2000 Index A 2.01 1.95 12.85 1.47 (0.04) 2,006S&P:600 Small Cap B 1.78 1.85 12.21 1.57 (0.09) 600
B (89)
B (58) B (61)
B (28)
B (58)
B (2)
A (80)
A (55) A (56)
A (33)
A (54)
A (1)

30Knowledge. Experience. Integrity. OSGP Annual Review 2019
Sector Allocations
●Sector weights vary quite a bit between the indices.
0 5 10 15 20 25
Financials
Health Care
Information Technology
Industrials
Consumer Discretionary
Real Estate
Utilities
Materials
Energy
Communication Services
Consumer Staples
June 30, 2019Sector Allocation
Russell:2000 Index S&P:600 Small Cap
17.5
16.5
15.7
14.9
11.6
7.4
3.8
3.6
3.3
3.0
2.6
17.9
11.8
14.7
19.7
13.6
6.9
2.2
4.3
3.6
2.0
3.4
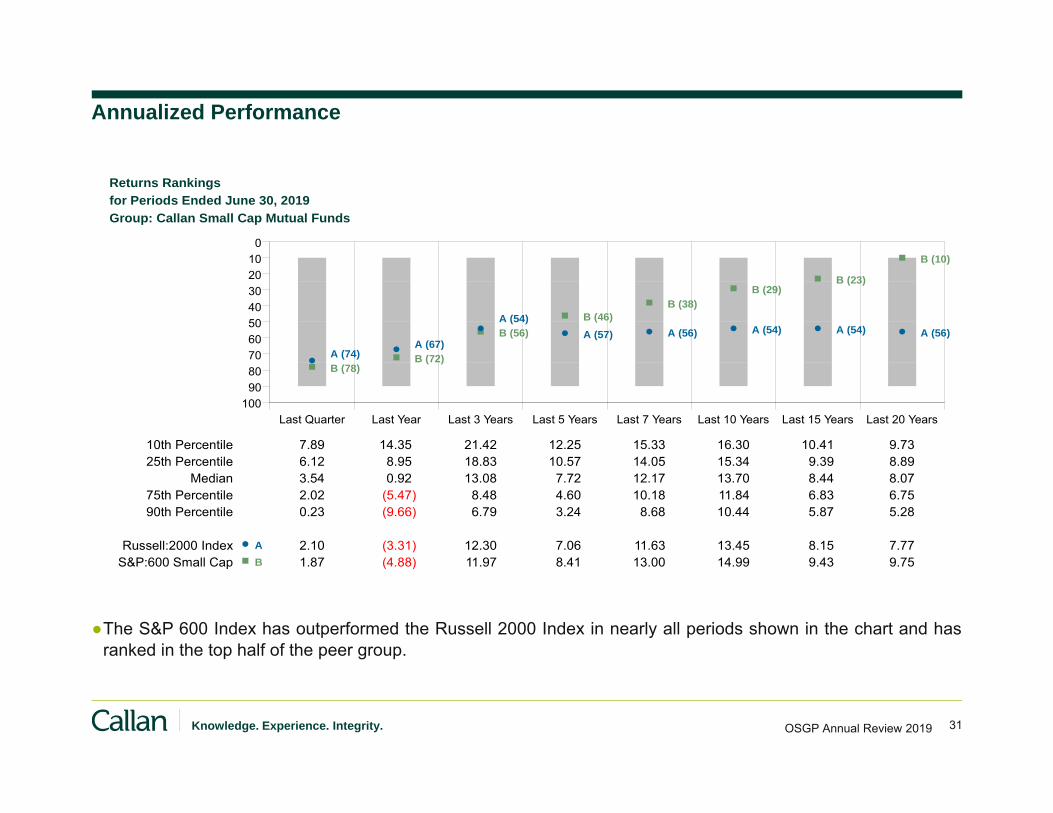
31Knowledge. Experience. Integrity. OSGP Annual Review 2019
Annualized Performance
●The S&P 600 Index has outperformed the Russell 2000 Index in nearly all periods shown in the chart and hasranked in the top half of the peer group.
Last Quarter Last Year Last 3 Years Last 5 Years Last 7 Years Last 10 Years Last 15 Years Last 20 Years100
908070605040302010
0
Group: Callan Small Cap Mutual Fundsfor Periods Ended June 30, 2019Returns Rankings
10th Percentile 7.89 14.35 21.42 12.25 15.33 16.30 10.41 9.7325th Percentile 6.12 8.95 18.83 10.57 14.05 15.34 9.39 8.89
Median 3.54 0.92 13.08 7.72 12.17 13.70 8.44 8.0775th Percentile 2.02 (5.47) 8.48 4.60 10.18 11.84 6.83 6.7590th Percentile 0.23 (9.66) 6.79 3.24 8.68 10.44 5.87 5.28
Russell:2000 Index A 2.10 (3.31) 12.30 7.06 11.63 13.45 8.15 7.77S&P:600 Small Cap B 1.87 (4.88) 11.97 8.41 13.00 14.99 9.43 9.75
B (78)B (72)
B (56)B (46)
B (38)B (29)
B (23)
B (10)
A (74)A (67)
A (54)A (57) A (56) A (54) A (54) A (56)

Appendix

OSGP Investment Option PerformanceSecond Quarter 2019
33

34Knowledge. Experience. Integrity.
BlackRock LifePath Index Target Date Funds Glide Path Analysis
% P
ure
Equ
ity
0%
25%
50%
75%
100%
40 30 20 10 0Retirement
-10 -20Years Until Retirement
Callan Glide Path Universe (ALL)
Callan Consensus ALL Glidepath LifePath Index Fund
0% 0%
25% 25%
50% 50%
75% 75%
100% 100%
Years Until Retirement40 30 20 10 0
Retirement-10 -20
% W
eigh
t
Real AssetsDomestic FixedReal EstateIntl EquityDomestic Broad Eq
Equity Rolldown Analysis
Macro-Level Asset Allocation Glide Path
OSGP Annual Review 2019

35Knowledge. Experience. Integrity. OSGP Annual Review 2019
LifePath Index Retirement FundPeriods Ended June 30, 2019
Performance vs Callan Target Date Retirement Income (Institutional Net)
Last Quarter Last Year Last 3 Years Last 5 Years Last 7 YearsYears
Last 10Years
Last 141
2
3
4
5
6
7
8
9
10th Percentile 3.22 7.15 6.39 4.52 5.95 7.55 5.3725th Percentile 3.08 6.72 5.74 4.25 5.43 6.72 4.95
Median 2.91 5.97 5.26 3.85 4.60 6.10 4.5575th Percentile 2.62 5.71 4.70 3.32 4.03 5.24 3.9990th Percentile 2.28 4.97 3.91 2.72 3.25 4.86 3.11
LifePath Index Retirement Fund L 3.16 6.55 5.82 4.21 5.32 6.75 5.27
LifePath Index Retirement Benchmark 3.21 6.60 5.82 4.21 5.31 6.76 5.36
(16)
(35) (23)
(28)
(28)
(23)
(12)
(12)
(32)
(23)
(28)(28)
(22)
(10)
OSGP Annual Review 2019

36Knowledge. Experience. Integrity. OSGP Annual Review 2019
LifePath Index Retirement FundTarget Asset Allocation
Macro-Level Asset Allocation
Micro-Level Asset Allocation
0%
10%
20%
30%
40%
50%
60%
70%
80%
LifePath Index Retirement Fund L - Target
24.3
11.5
0.5
60.0
3.7
Callan Tgt Dt Idx 2010
22.6
10.4
1.6
53.9
5.4 3.0 2.3 0.8
Domestic Broad Eq Intl Equity Real Estate Domestic Fixed Intl Fixed-Inc Stable Value/Cash Absolute Return/GTAA Real Assets
0%
10%
20%
30%
40%
50%
60%
70%
LifePath Index Retirement Fund L - Target
20.9
3.49.4
2.1 0.5
51.2
8.83.7
Callan Tgt Dt Idx 2010
18.2
4.38.3
2.0 1.1 0.5
32.1
9.42.8 0.8 0.1 0.2
7.912.4
Large Cap Broad Eq Small/Mid Cap Broad Non-US Developed Emerging Markets Other-Real Estate Global REITS Core Bond TIPS Cash Equiv
Commodities Intl Equity Domestic Broad Eq Other Other-Dom Fixed
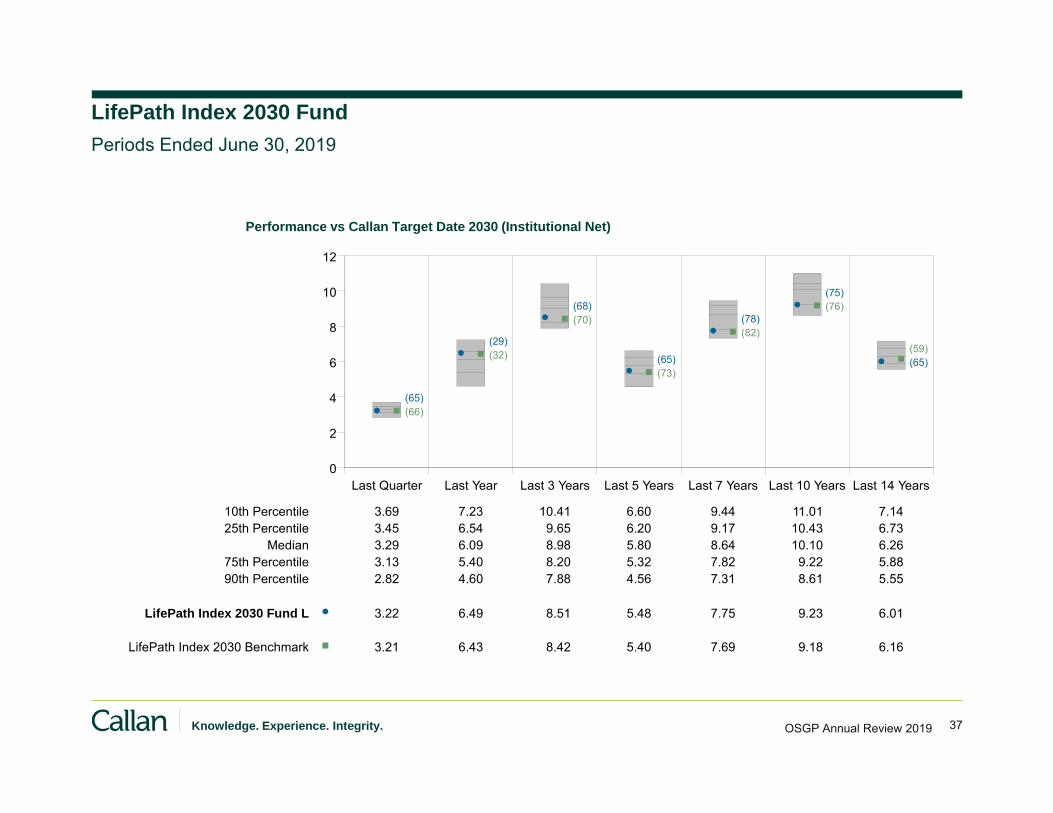
37Knowledge. Experience. Integrity. OSGP Annual Review 2019
LifePath Index 2030 FundPeriods Ended June 30, 2019
Performance vs Callan Target Date 2030 (Institutional Net)
Last Quarter Last Year Last 3 Years Last 5 Years Last 7 Years Last 10 Years Last 14 Years0
2
4
6
8
10
12
10th Percentile 3.69 7.23 10.41 6.60 9.44 11.01 7.1425th Percentile 3.45 6.54 9.65 6.20 9.17 10.43 6.73
Median 3.29 6.09 8.98 5.80 8.64 10.10 6.2675th Percentile 3.13 5.40 8.20 5.32 7.82 9.22 5.8890th Percentile 2.82 4.60 7.88 4.56 7.31 8.61 5.55
LifePath Index 2030 Fund L 3.22 6.49 8.51 5.48 7.75 9.23 6.01
LifePath Index 2030 Benchmark 3.21 6.43 8.42 5.40 7.69 9.18 6.16
(65)
(29)
(68)
(65)
(78)
(75)
(65)
(66)
(32)
(70)
(73)
(82)
(76)
(59)

38Knowledge. Experience. Integrity. OSGP Annual Review 2019
LifePath Index 2030 FundTarget Asset Allocation
Macro-Level Asset Allocation
Micro-Level Asset Allocation
0%
10%
20%
30%
40%
50%
60%
LifePath Index 2030 Fund L - Target
37.5
22.1
7.2
29.9
3.3
Callan Tgt Dt Idx 2030
41.6
21.2
2.3
28.2
3.11.0 1.8 0.8
Domestic Broad Eq Intl Equity Real Estate Domestic Fixed Intl Fixed-Inc Stable Value/Cash Absolute Return/GTAA Real Assets
0%
10%
20%
30%
40%
50%
LifePath Index 2030 Fund L - Target
35.2
2.3
18.1
4.07.2
25.9
4.0 3.3
Callan Tgt Dt Idx 2030
33.1
8.4
16.5
4.41.3 1.0
19.4
3.0 1.0 0.8 0.3 0.24.9 5.8
Large Cap Broad Eq Small/Mid Cap Broad Non-US Developed Emerging Markets Other-Real Estate Global REITS Core Bond TIPS Cash Equiv
Commodities Intl Equity Domestic Broad Eq Other Other-Dom Fixed

39Knowledge. Experience. Integrity. OSGP Annual Review 2019
LifePath Index 2050 FundPeriods Ended June 30, 2019
Performance vs Callan Target Date 2050 (Institutional Net)
Last Quarter Last Year Last 3 Years Last 5 Years Last 7 Years Last 10 YearsYears
Last 11 3/42
4
6
8
10
12
14
10th Percentile 3.81 6.70 11.57 7.18 10.82 11.77 6.3325th Percentile 3.59 6.18 11.27 6.93 10.32 11.25 5.88
Median 3.40 5.55 10.62 6.47 9.88 10.94 5.4575th Percentile 3.19 4.44 10.17 6.16 9.64 10.49 4.7390th Percentile 3.01 3.79 9.83 5.31 8.30 9.39 4.13
LifePath Index 2050 Fund L 3.20 6.28 10.73 6.48 9.67 10.98 5.24
LifePath Index 2050 Benchmark 3.13 6.07 10.55 6.32 9.54 10.90 5.05
(73)
(20)
(48)
(50)
(74)
(45)
(55)
(82)
(27)
(55)
(63)
(77)
(53)
(62)
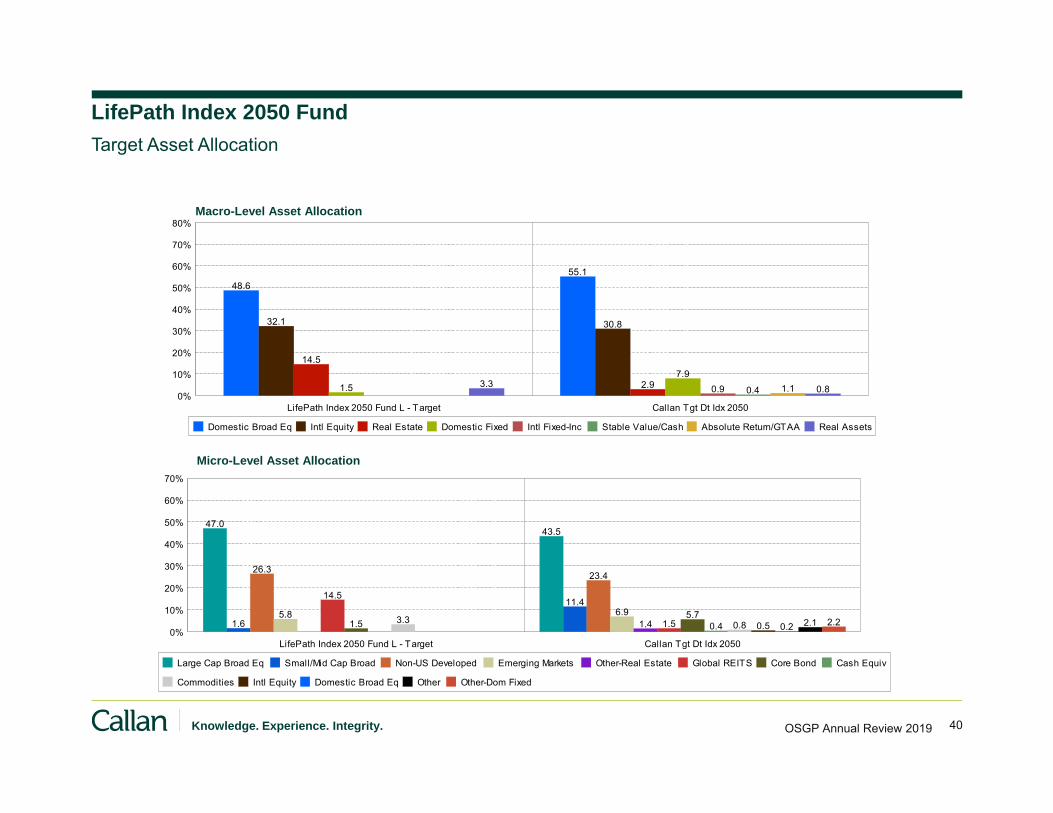
40Knowledge. Experience. Integrity. OSGP Annual Review 2019
LifePath Index 2050 FundTarget Asset Allocation
Macro-Level Asset Allocation
Micro-Level Asset Allocation
0%
10%
20%
30%
40%
50%
60%
70%
80%
LifePath Index 2050 Fund L - Target
48.6
32.1
14.5
1.5 3.3
Callan Tgt Dt Idx 2050
55.1
30.8
2.97.9
0.9 0.4 1.1 0.8
Domestic Broad Eq Intl Equity Real Estate Domestic Fixed Intl Fixed-Inc Stable Value/Cash Absolute Return/GTAA Real Assets
0%
10%
20%
30%
40%
50%
60%
70%
LifePath Index 2050 Fund L - Target
47.0
1.6
26.3
5.8
14.5
1.5 3.3
Callan Tgt Dt Idx 2050
43.5
11.4
23.4
6.91.4 1.5
5.70.4 0.8 0.5 0.2 2.1 2.2
Large Cap Broad Eq Small/Mid Cap Broad Non-US Developed Emerging Markets Other-Real Estate Global REITS Core Bond Cash Equiv
Commodities Intl Equity Domestic Broad Eq Other Other-Dom Fixed

41Knowledge. Experience. Integrity. OSGP Annual Review 2019
Stable Value OptionPeriods Ended June 30, 2019
Last Quarter Last Year Last 3 Years Last 5 Years Last 7 Years Last 10 Years Last 15 Years0
1
2
3
4
10th Percentile 0.61 2.40 2.11 2.01 2.05 2.50 3.2225th Percentile 0.57 2.18 1.90 1.77 1.82 2.20 2.92
Median 0.53 2.02 1.69 1.51 1.50 1.75 2.4775th Percentile 0.48 1.84 1.56 1.41 1.33 1.49 2.2690th Percentile 0.45 1.66 1.34 1.11 1.06 1.36 2.14
Stable Value Option 0.64 2.44 2.10 1.91 1.83 1.88 2.70
3-month Treasury Bill 0.64 2.31 1.38 0.87 0.65 0.49 1.38
(1)
(7)
(11)(20) (25) (37)
(38)
(1)
(14)
(88)
(99)(99)
(100)
(97)
Performance vs Callan Stable Value CT (Institutional Net)
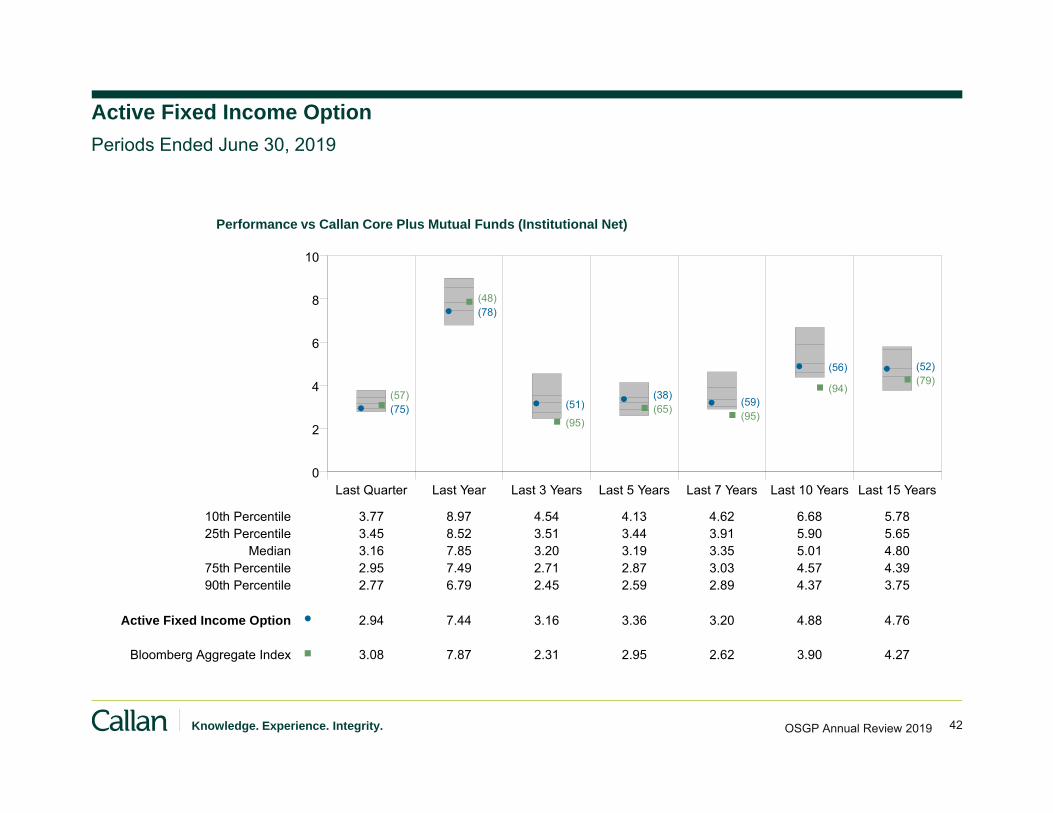
42Knowledge. Experience. Integrity. OSGP Annual Review 2019
Active Fixed Income OptionPeriods Ended June 30, 2019
Performance vs Callan Core Plus Mutual Funds (Institutional Net)
Last Quarter Last Year Last 3 Years Last 5 Years Last 7 Years Last 10 Years Last 15 Years0
2
4
6
8
10
10th Percentile 3.77 8.97 4.54 4.13 4.62 6.68 5.7825th Percentile 3.45 8.52 3.51 3.44 3.91 5.90 5.65
Median 3.16 7.85 3.20 3.19 3.35 5.01 4.8075th Percentile 2.95 7.49 2.71 2.87 3.03 4.57 4.3990th Percentile 2.77 6.79 2.45 2.59 2.89 4.37 3.75
Active Fixed Income Option 2.94 7.44 3.16 3.36 3.20 4.88 4.76
Bloomberg Aggregate Index 3.08 7.87 2.31 2.95 2.62 3.90 4.27
(75)
(78)
(51)(38) (59)
(56) (52)
(57)
(48)
(95)(65) (95)
(94)(79)

43Knowledge. Experience. Integrity.
Active Fixed Income OptionPortfolio Characteristics as of June 30, 2019
(5) 0 5 10 15 20 25 30 35 40 45
Agency RMBS
US Treasuries
Corporate
Non-Agency RMBS
Asset Backed
CMBS
Govt. Related
CMOs
Bank Loans
Cash
June 30, 2019Sector Allocation
Active Fixed Income Option
Bloomberg Aggregate Index
Callan Core Plus Mutual Funds
35.9
19.4
17.2
12.9
5.9
4.9
3.0
1.3
0.7
(1.5)
27.2
39.5
25.0
0.0
0.5
2.0
5.8
0.0
0.0
0.0
26.2
31.7
27.7
4.6
2.0
1.9
5.6
0.0
1.1
1.2
AA+
AA
AA-
A+
A10th Percentile AA25th Percentile AA
Median AA-75th Percentile A+90th Percentile A
Active Fixed Income Option AA-
Bloomberg Aggregate Index AA
vs Callan Core Plus Mutual FundsQuality Ratings
(62)
(5)
OSGP Annual Review 2019
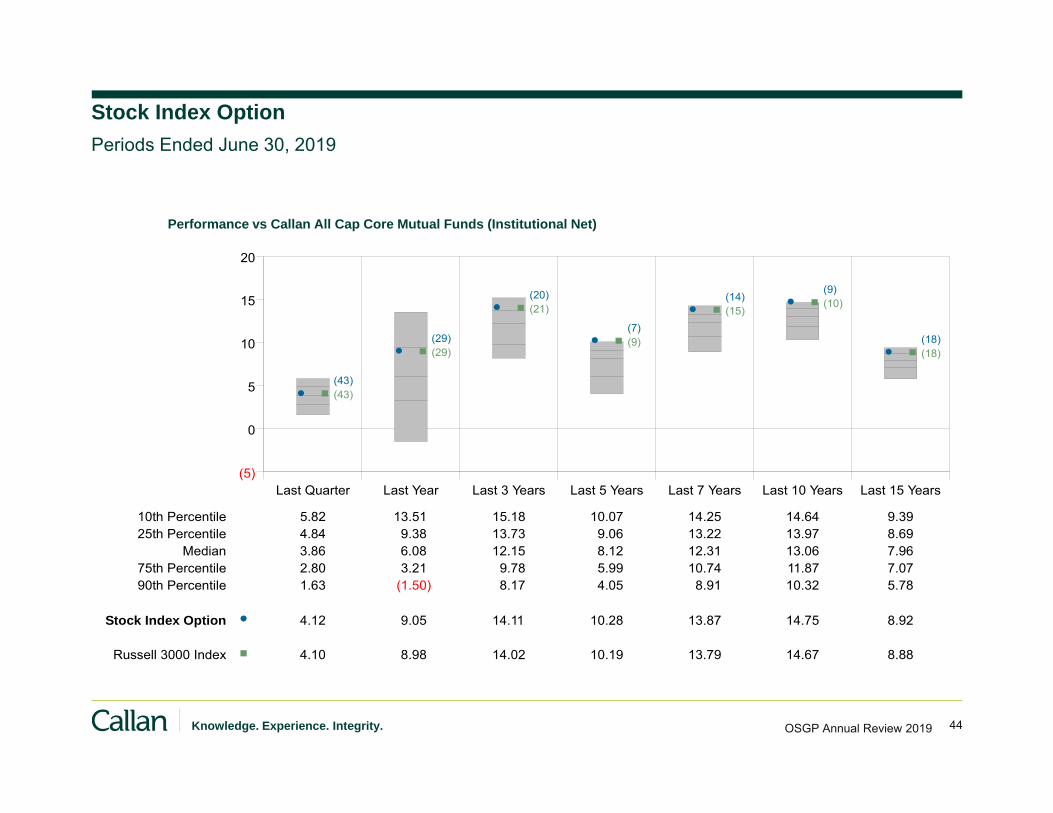
44Knowledge. Experience. Integrity. OSGP Annual Review 2019
Stock Index OptionPeriods Ended June 30, 2019
Last Quarter Last Year Last 3 Years Last 5 Years Last 7 Years Last 10 Years Last 15 Years(5)
0
5
10
15
20
10th Percentile 5.82 13.51 15.18 10.07 14.25 14.64 9.3925th Percentile 4.84 9.38 13.73 9.06 13.22 13.97 8.69
Median 3.86 6.08 12.15 8.12 12.31 13.06 7.9675th Percentile 2.80 3.21 9.78 5.99 10.74 11.87 7.0790th Percentile 1.63 (1.50) 8.17 4.05 8.91 10.32 5.78
Stock Index Option 4.12 9.05 14.11 10.28 13.87 14.75 8.92
Russell 3000 Index 4.10 8.98 14.02 10.19 13.79 14.67 8.88
(43)
(29)
(20)
(7)
(14)(9)
(18)
(43)
(29)
(21)
(9)
(15)(10)
(18)
Performance vs Callan All Cap Core Mutual Funds (Institutional Net)
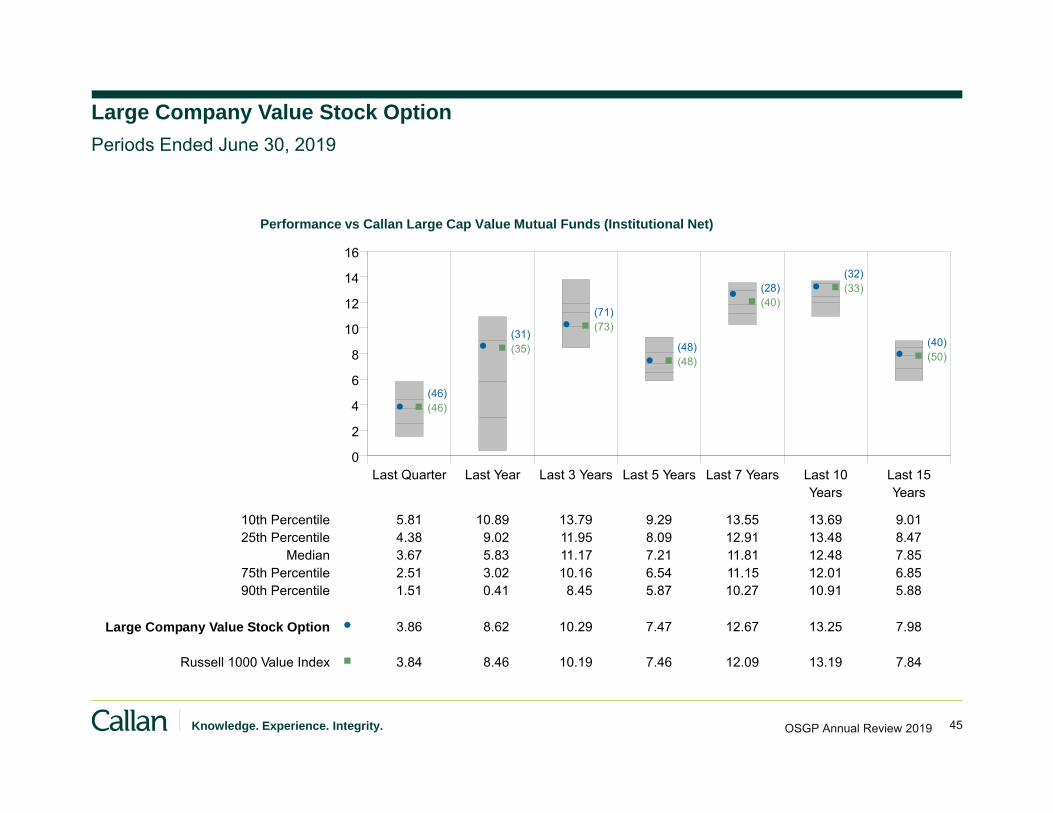
45Knowledge. Experience. Integrity. OSGP Annual Review 2019
Large Company Value Stock OptionPeriods Ended June 30, 2019
Performance vs Callan Large Cap Value Mutual Funds (Institutional Net)
Last Quarter Last Year Last 3 Years Last 5 Years Last 7 YearsYears
Last 10Years
Last 150
2
4
6
8
10
12
14
16
10th Percentile 5.81 10.89 13.79 9.29 13.55 13.69 9.0125th Percentile 4.38 9.02 11.95 8.09 12.91 13.48 8.47
Median 3.67 5.83 11.17 7.21 11.81 12.48 7.8575th Percentile 2.51 3.02 10.16 6.54 11.15 12.01 6.8590th Percentile 1.51 0.41 8.45 5.87 10.27 10.91 5.88
Large Company Value Stock Option 3.86 8.62 10.29 7.47 12.67 13.25 7.98
Russell 1000 Value Index 3.84 8.46 10.19 7.46 12.09 13.19 7.84
(46)
(31)
(71)
(48)
(28)(32)
(40)
(46)
(35)
(73)
(48)
(40)(33)
(50)

46Knowledge. Experience. Integrity. OSGP Annual Review 2019
Large Company Growth Stock OptionPeriods Ended June 30, 2019
Performance vs Callan Large Cap Growth Mutual Funds (Institutional Net)
Last Quarter Last Year Last 3 Years Last 5 Years Last 7 YearsYears
Last 10Years
Last 150
5
10
15
20
25
10th Percentile 7.16 15.47 21.86 15.06 17.41 17.54 10.8225th Percentile 5.69 13.77 20.32 13.76 16.21 16.28 10.39
Median 4.86 11.03 18.85 13.05 15.47 15.55 9.5075th Percentile 4.02 8.83 16.49 11.65 14.62 14.74 9.0590th Percentile 3.02 7.49 15.18 9.91 13.03 13.30 8.25
Large Company Growth Stock Option 4.65 11.54 18.06 13.06 15.72 16.15 9.55
Russell 1000 Growth Index 4.64 11.56 18.07 13.39 15.76 16.28 9.90
(56)
(44)
(59)
(50)
(38) (29)
(49)
(56)
(44)
(59)
(40)
(37) (25)
(39)

47Knowledge. Experience. Integrity. OSGP Annual Review 2019
Small Company Stock OptionPeriods Ended June 30, 2019
Performance vs Callan Small Cap Mutual Funds (Institutional Net)
Last Quarter Last Year Last 3 Years Last 5 Years Last 7 Years Last 10 Years Last 15 Years(15)
(10)
(5)
0
5
10
15
20
25
10th Percentile 7.83 12.92 21.52 12.55 15.45 16.61 10.7925th Percentile 5.81 7.96 18.64 10.99 14.32 15.88 9.89
Median 3.20 0.83 12.76 7.60 12.14 13.99 9.0775th Percentile 1.69 (5.87) 8.59 4.93 10.51 12.78 7.6290th Percentile 0.26 (9.55) 7.02 3.25 8.43 11.15 6.33
Small Company Stock Option 2.30 (3.36) 11.88 6.81 11.55 13.65 8.84
Russell 2000 Index 2.10 (3.31) 12.30 7.06 11.63 13.45 8.15
(67)
(63)
(56)
(60)
(61)
(58)
(56)
(70)(63)
(53)
(57)
(59) (60)
(68)
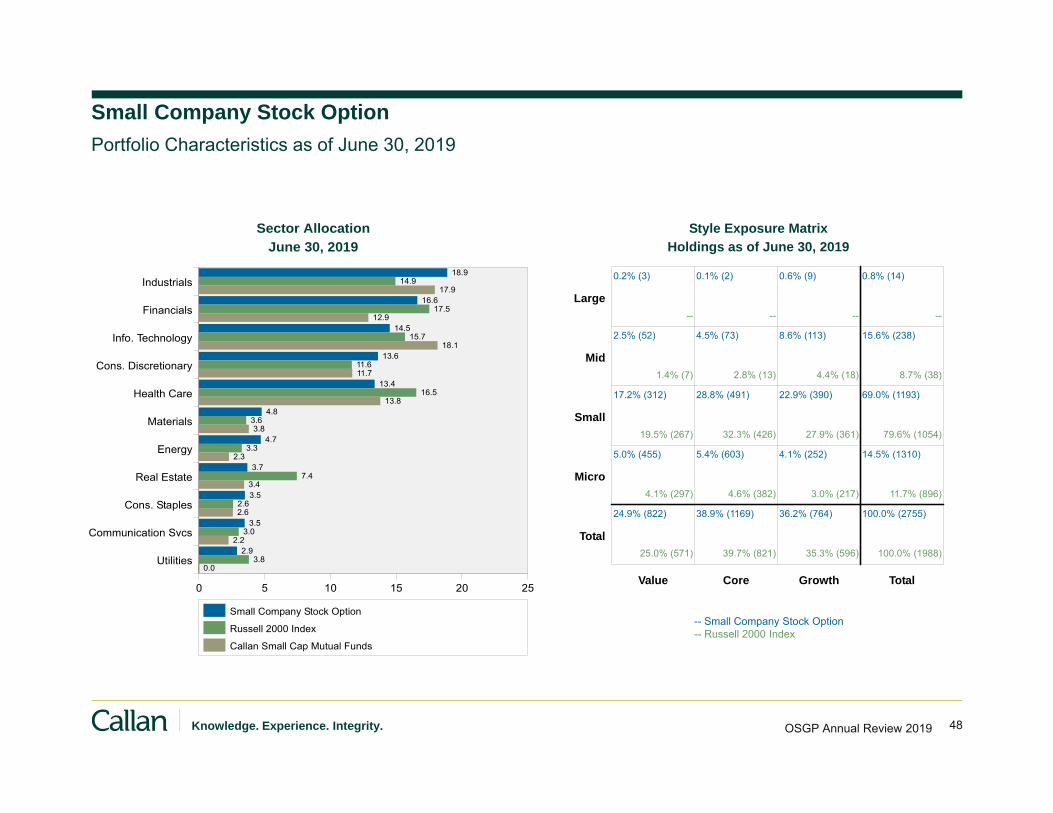
48Knowledge. Experience. Integrity.
Small Company Stock OptionPortfolio Characteristics as of June 30, 2019
0 5 10 15 20 25
Industrials
Financials
Info. Technology
Cons. Discretionary
Health Care
Materials
Energy
Real Estate
Cons. Staples
Communication Svcs
Utilities
June 30, 2019Sector Allocation
Small Company Stock Option
Russell 2000 Index
Callan Small Cap Mutual Funds
18.9
16.6
14.5
13.6
13.4
4.8
4.7
3.7
3.5
3.5
2.9
17.9
12.9
18.1
11.7
13.8
3.8
2.3
3.4
2.6
2.2
0.0
14.9
17.5
15.7
11.6
16.5
3.6
3.3
7.4
2.6
3.0
3.8
Value Core Growth Total
Large
Mid
Small
Micro
Total
0.2% (3)
--
0.1% (2)
--
0.6% (9)
--
0.8% (14)
--
2.5% (52)
1.4% (7)
4.5% (73)
2.8% (13)
8.6% (113)
4.4% (18)
15.6% (238)
8.7% (38)
17.2% (312)
19.5% (267)
28.8% (491)
32.3% (426)
22.9% (390)
27.9% (361)
69.0% (1193)
79.6% (1054)
5.0% (455)
4.1% (297)
5.4% (603)
4.6% (382)
4.1% (252)
3.0% (217)
14.5% (1310)
11.7% (896)
24.9% (822)
25.0% (571)
38.9% (1169)
39.7% (821)
36.2% (764)
35.3% (596)
100.0% (2755)
100.0% (1988)
Holdings as of June 30, 2019Style Exposure Matrix
-- Small Company Stock Option-- Russell 2000 Index
OSGP Annual Review 2019

49Knowledge. Experience. Integrity. OSGP Annual Review 2019
International Stock OptionPeriods Ended June 30, 2019
Performance vs Callan Non US Equity Mutual Funds (Institutional Net)
Last Quarter Last Year Last 3 Years Last 5 Years Last 7 Years Last 10 Years Last 15 Years(10)
(5)
0
5
10
15
10th Percentile 5.95 5.03 10.81 5.58 9.21 9.37 7.8925th Percentile 4.89 2.79 9.99 4.03 7.88 8.58 6.93
Median 3.34 (0.22) 8.51 2.29 7.00 7.39 5.7575th Percentile 2.04 (4.61) 6.68 1.19 6.35 6.28 4.7490th Percentile 0.08 (6.33) 6.16 (0.34) 5.25 5.43 4.10
International Stock Option 2.68 (0.25) 8.26 2.43 7.04 6.96 5.52
MSCI ACWI ex US Index 2.98 1.29 9.39 2.16 6.36 6.54 5.85
(67)
(50)
(54)
(50)
(47) (54)
(56)(63)
(35)
(33)
(50)
(73) (66) (49)
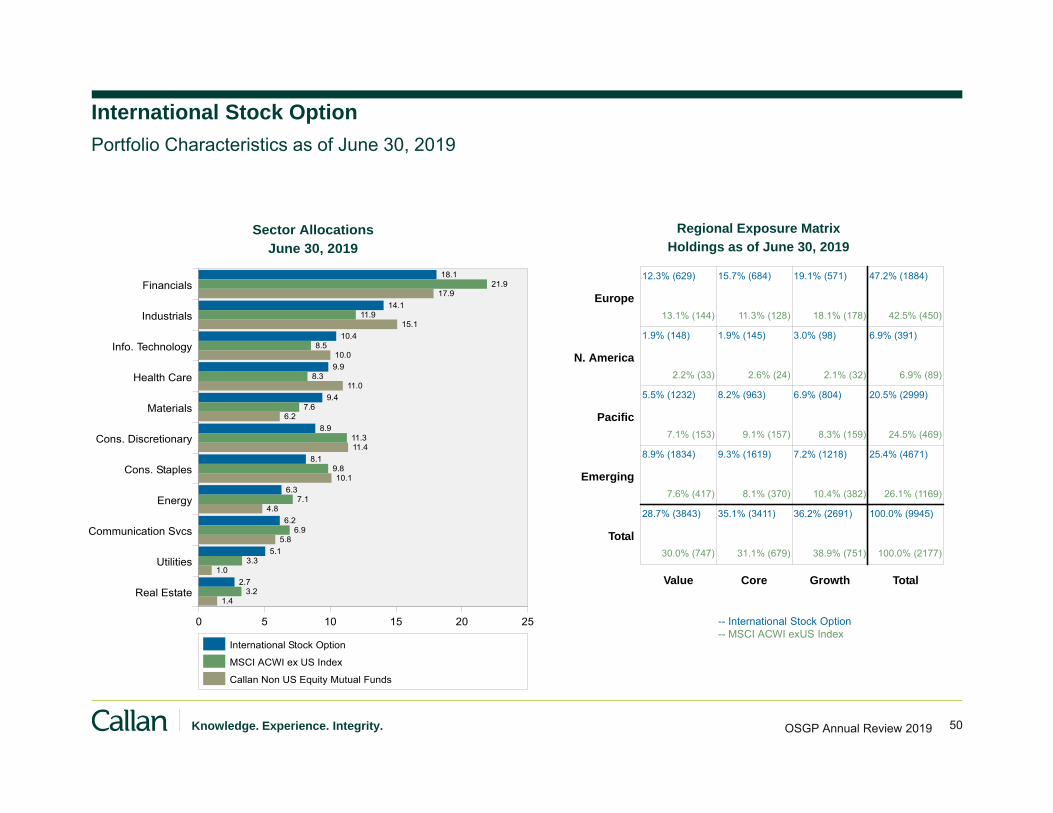
50Knowledge. Experience. Integrity.
International Stock OptionPortfolio Characteristics as of June 30, 2019
0 5 10 15 20 25
Financials
Industrials
Info. Technology
Health Care
Materials
Cons. Discretionary
Cons. Staples
Energy
Communication Svcs
Utilities
Real Estate
June 30, 2019Sector Allocations
International Stock Option
MSCI ACWI ex US Index
Callan Non US Equity Mutual Funds
18.1
14.1
10.4
9.9
9.4
8.9
8.1
6.3
6.2
5.1
2.7
17.9
15.1
10.0
11.0
6.2
11.4
10.1
4.8
5.8
1.0
1.4
21.9
11.9
8.5
8.3
7.6
11.3
9.8
7.1
6.9
3.3
3.2Value Core Growth Total
Europe
N. America
Pacific
Emerging
Total
12.3% (629)
13.1% (144)
15.7% (684)
11.3% (128)
19.1% (571)
18.1% (178)
47.2% (1884)
42.5% (450)
1.9% (148)
2.2% (33)
1.9% (145)
2.6% (24)
3.0% (98)
2.1% (32)
6.9% (391)
6.9% (89)
5.5% (1232)
7.1% (153)
8.2% (963)
9.1% (157)
6.9% (804)
8.3% (159)
20.5% (2999)
24.5% (469)
8.9% (1834)
7.6% (417)
9.3% (1619)
8.1% (370)
7.2% (1218)
10.4% (382)
25.4% (4671)
26.1% (1169)
28.7% (3843)
30.0% (747)
35.1% (3411)
31.1% (679)
36.2% (2691)
38.9% (751)
100.0% (9945)
100.0% (2177)
Holdings as of June 30, 2019Regional Exposure Matrix
-- International Stock Option-- MSCI ACWI exUS Index
OSGP Annual Review 2019

51Knowledge. Experience. Integrity. OSGP Annual Review 2019
Socially Responsible Investment OptionPeriods Ended June 30, 2019
Performance vs Callan All Cap Core Mutual Funds (Institutional Net)
Last Quarter Last Year Last 3 Years Last 4 1/4 Years(5.0)
(2.5)
0.0
2.5
5.0
7.5
10.0
12.5
15.0
17.5
10th Percentile 5.82 13.51 15.18 10.1225th Percentile 4.84 9.38 13.73 9.08
Median 3.86 6.08 12.15 8.0675th Percentile 2.80 3.21 9.78 5.8290th Percentile 1.63 (1.50) 8.17 3.73
Socially Responsible Investment Option 3.72 8.85 13.60 9.66
Russell 3000 Index 4.10 8.98 14.02 10.29
(54)
(30)
(27)
(14)
(43)
(29)
(21)
(8)

52Knowledge. Experience. Integrity.
Socially Responsible Investment OptionPortfolio Characteristics as of June 30, 2019
0 5 10 15 20 25
Info. Technology
Financials
Health Care
Cons. Discretionary
Industrials
Communication Svcs
Cons. Staples
Energy
Real Estate
Utilities
Materials
June 30, 2019Sector Allocations
Socially Responsible Investment Option
Russell 3000 Index
Callan All Cap Core Mutual Funds
20.2
14.8
13.4
11.4
10.4
8.5
6.0
4.8
4.1
3.4
3.2
19.6
14.3
13.0
11.1
11.3
7.8
5.6
3.9
2.0
1.3
3.1
21.3
13.5
14.1
10.4
10.2
9.2
6.4
4.7
4.0
3.3
3.0Value Core Growth Total
Large
Mid
Small
Micro
Total
24.2% (54)
25.0% (107)
21.8% (51)
20.1% (92)
31.8% (51)
30.6% (99)
77.8% (156)
75.7% (298)
4.2% (71)
4.9% (180)
6.2% (86)
6.1% (210)
6.2% (62)
5.8% (207)
16.5% (219)
16.8% (597)
1.2% (88)
1.8% (324)
1.9% (109)
2.7% (486)
1.9% (86)
2.1% (384)
5.0% (283)
6.7% (1194)
0.2% (23)
0.3% (297)
0.3% (45)
0.3% (382)
0.2% (18)
0.2% (217)
0.7% (86)
0.8% (896)
29.8% (236)
32.1% (908)
30.1% (291)
29.2% (1170)
40.1% (217)
38.7% (907)
100.0% (744)
100.0% (2985)
Holdings as of June 30, 2019Style Exposure Matrix
-- Socially Responsible Investment Option-- Russell 3000 Index
OSGP Annual Review 2019
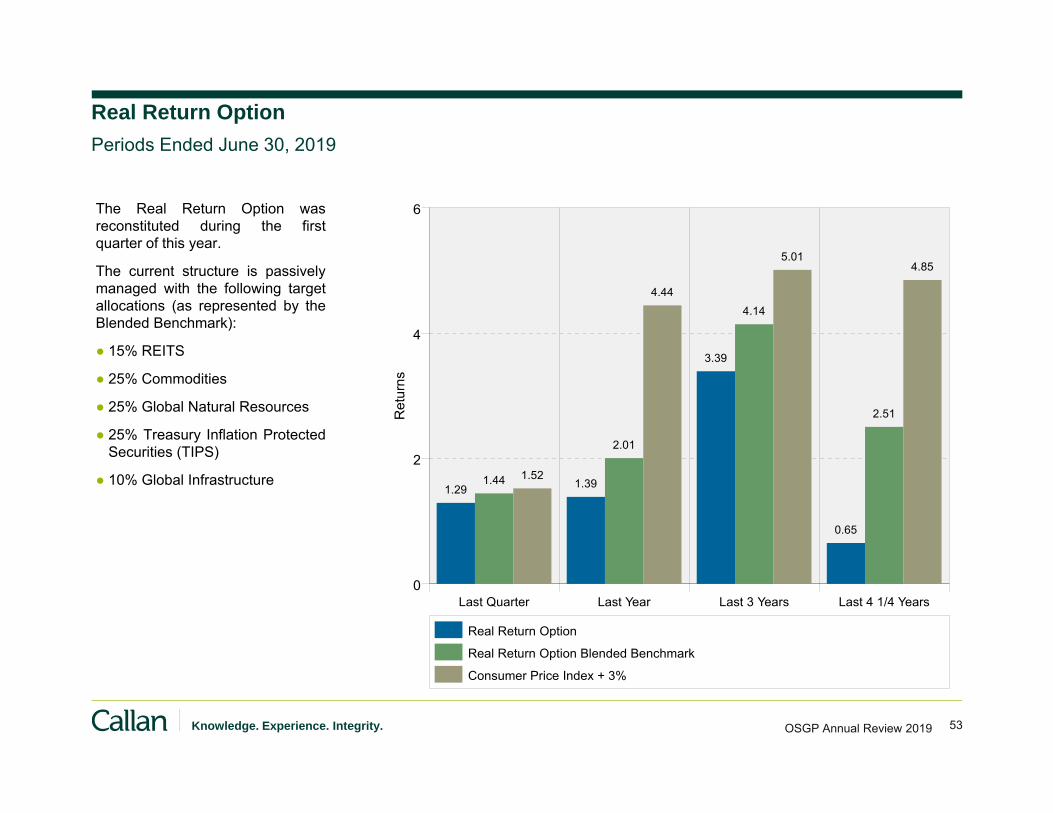
53Knowledge. Experience. Integrity. OSGP Annual Review 2019
Real Return OptionPeriods Ended June 30, 2019
0
2
4
6
Ret
urns
Last Quarter Last Year Last 3 Years Last 4 1/4 Years
Real Return Option
Real Return Option Blended Benchmark
Consumer Price Index + 3%
1.29 1.39
3.39
0.65
1.44
2.01
4.14
2.51
1.52
4.44
5.014.85
The Real Return Option wasreconstituted during the firstquarter of this year.
The current structure is passivelymanaged with the following targetallocations (as represented by theBlended Benchmark):
● 15% REITS
● 25% Commodities
● 25% Global Natural Resources
● 25% Treasury Inflation ProtectedSecurities (TIPS)
● 10% Global Infrastructure

54Knowledge. Experience. Integrity. OSGP Annual Review 2019
Disclosure
© 2019 Callan LLC
Certain information herein has been compiled by Callan and is based on information provided by a variety of sources believed to be reliable for which Callan has not
necessarily verified the accuracy or completeness of this publication. This report is for informational purposes only and should not be construed as legal or tax
advice on any matter. Any investment decision you make on the basis of this report is your sole responsibility. You should consult with legal and tax advisers before
applying any of this information to your particular situation. Reference in this report to any product, service or entity should not be construed as a recommendation,
approval, affiliation or endorsement of such product, service or entity by Callan. Past performance is no guarantee of future results. This report may consist of
statements of opinion, which are made as of the date they are expressed and are not statements of fact. Reference to or inclusion in this report of any product,
service or entity should not be construed as a recommendation, approval, affiliation or endorsement of such product, service or entity by Callan.
Callan is, and will be, the sole owner and copyright holder of all material prepared or developed by Callan. No party has the right to reproduce, revise, resell,
disseminate externally, disseminate to subsidiaries or parents, or post on internal web sites any part of any material prepared or developed by Callan without
permission. Callan’s clients only have the right to utilize such material internally in their business.

TAB 7 – Asset Allocations & NAV Updates

Asset Allocations at July 31, 2019
Target Date Funds Variable Fund Total Fund
OPERF Policy Target1 $ Thousands Pre-Overlay Overlay Net Position Actual $ Thousands $ Thousands $ Thousands
Public Equity 27.5-37.5% 32.5% 26,433,447 34.5% 31,536 26,464,983 34.5% 1,013,043 475,877 27,953,902 Private Equity 13.5-21.5% 17.5% 16,786,023 21.9% 16,786,023 21.9% 16,786,023 Total Equity 45.0-55.0% 50.0% 43,219,470 56.4% 31,536 43,251,006 56.4% 44,739,926 Opportunity Portfolio 0-3% 0.0% 1,709,554 2.2% 1,709,554 2.2% 1,709,554 Fixed Income 15-25% 20.0% 15,140,738 19.7% 899,329 16,040,066 20.9% 1,372,296 17,412,363 Risk Parity 0.0-2.5% 2.5% - 0.0% - 0.0% - Real Estate 9.5-15.5% 12.5% 8,240,310 10.7% (2,400) 8,237,910 10.7% 8,237,910 Alternative Investments 7.5-17.5% 15.0% 7,440,289 9.7% 7,440,289 9.7% 7,440,289 Cash2 0-3% 0.0% 938,613 1.2% (928,464) 10,148 0.0% 9,010 19,158
TOTAL OPERF 100% 76,688,974$ 100.0% -$ 76,688,974$ 100.0% 2,385,339$ 484,886$ 79,559,199$
1 Targets established in June 2015. Interim policy benchmark consists of: 40% MSCI ACWI IMI Net, 22.5% Custom FI Benchmark, 20% Russell 3000+300bps (1 quarter lagged), 12.5% NCREIF ODCE net (1 quarter lagged), & 5% CPI+400bps. 2 Includes cash held in the policy implementation overlay program.
SAIF Policy Target $ Thousands Actual
Total Equity 7-13% 10.0% 619,843 12.4%
Fixed Income 80-90% 85.0% 4,319,093 86.3%Real Estate 0-7% 5.0% - 0.0%
Cash 0-3% 0.0% 63,834 1.3%
TOTAL SAIF 5,002,771$ 100.0%
CSF Policy Target $ Thousands Actual
Global Equities 40-50% 45.0% 822,077 46.5%Private Equity 8-12% 10.0% 208,065 11.8%Total Equity 58-62% 55.0% 1,030,142 58.2%
Fixed Income 25-35% 25.0% 475,362 26.9%
Real Estate 8-12% 10.0% 126,924 7.2%Alternative Investments 8-12% 10.0% 115,806 6.5%Cash 0-3% 0.0% 21,116 1.2%
TOTAL CSF 1,769,349$ 100.0%
Regular Account
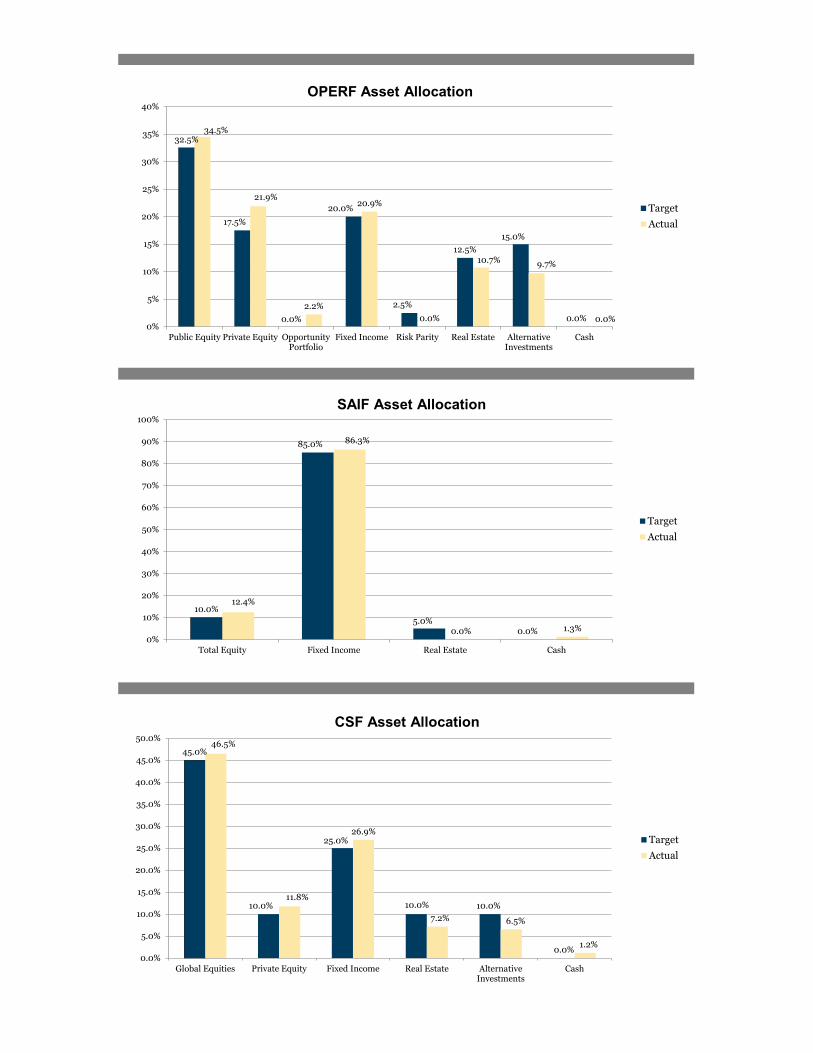
32.5%
17.5%
0.0%
20.0%
2.5%
12.5%15.0%
0.0%
34.5%
21.9%
2.2%
20.9%
0.0%
10.7% 9.7%
0.0%0%
5%
10%
15%
20%
25%
30%
35%
40%
Public Equity Private Equity OpportunityPortfolio
Fixed Income Risk Parity Real Estate AlternativeInvestments
Cash
TargetActual
OPERF Asset Allocation
10.0%
85.0%
5.0%0.0%
12.4%
86.3%
0.0% 1.3%0%
10%
20%
30%
40%
50%
60%
70%
80%
90%
100%
Total Equity Fixed Income Real Estate Cash
TargetActual
SAIF Asset Allocation
45.0%
10.0%
25.0%
10.0% 10.0%
0.0%
46.5%
11.8%
26.9%
7.2% 6.5%
1.2%0.0%
5.0%
10.0%
15.0%
20.0%
25.0%
30.0%
35.0%
40.0%
45.0%
50.0%
Global Equities Private Equity Fixed Income Real Estate AlternativeInvestments
Cash
TargetActual
CSF Asset Allocation

-
10,000
20,000
30,000
40,000
50,000
60,000
70,000
80,000
90,000
Jul-
04O
ct-0
4Ja
n-05
Apr
-05
Jul-
05O
ct-0
5Ja
n-06
Apr
-06
Jul-
06O
ct-0
6Ja
n-07
Apr
-07
Jul-
07O
ct-0
7Ja
n-08
Apr
-08
Jul-
08O
ct-0
8Ja
n-09
Apr
-09
Jul-
09O
ct-0
9Ja
n-10
Apr
-10
Jul-
10O
ct-1
0Ja
n-11
Apr
-11
Jul-
11O
ct-1
1Ja
n-12
Apr
-12
Jul-
12O
ct-1
2Ja
n-13
Apr
-13
Jul-
13O
ct-1
3Ja
n-14
Apr
-14
Jul-
14O
ct-1
4Ja
n-15
Apr
-15
Jul-
15O
ct-1
5Ja
n-16
Apr
-16
Jul-
16O
ct-1
6Ja
n-17
Apr
-17
Jul-
17O
ct-1
7Ja
n-18
Apr
-18
Jul-
18O
ct-1
8Ja
n-19
Apr
-19
Jul-
19
OPERF NAV15 years ending July 31, 2019
($ in Millions)
IAP OPERF

-
1,000
2,000
3,000
4,000
5,000
6,000
Jul-
04O
ct-0
4Ja
n-05
Apr
-05
Jul-
05O
ct-0
5Ja
n-06
Apr
-06
Jul-
06O
ct-0
6Ja
n-07
Apr
-07
Jul-
07O
ct-0
7Ja
n-08
Apr
-08
Jul-
08O
ct-0
8Ja
n-09
Apr
-09
Jul-
09O
ct-0
9Ja
n-10
Apr
-10
Jul-
10O
ct-1
0Ja
n-11
Apr
-11
Jul-
11O
ct-1
1Ja
n-12
Apr
-12
Jul-
12O
ct-1
2Ja
n-13
Apr
-13
Jul-
13O
ct-1
3Ja
n-14
Apr
-14
Jul-
14O
ct-1
4Ja
n-15
Apr
-15
Jul-
15O
ct-1
5Ja
n-16
Apr
-16
Jul-
16O
ct-1
6Ja
n-17
Apr
-17
Jul-
17O
ct-1
7Ja
n-18
Apr
-18
Jul-
18O
ct-1
8Ja
n-19
Apr
-19
Jul-
19
SAIF NAV15 years ending July 31, 2019
($ in Millions)

-
200
400
600
800
1,000
1,200
1,400
1,600
1,800
2,000
Jul-
04O
ct-0
4Ja
n-05
Apr
-05
Jul-
05O
ct-0
5Ja
n-06
Apr
-06
Jul-
06O
ct-0
6Ja
n-07
Apr
-07
Jul-
07O
ct-0
7Ja
n-08
Apr
-08
Jul-
08O
ct-0
8Ja
n-09
Apr
-09
Jul-
09O
ct-0
9Ja
n-10
Apr
-10
Jul-
10O
ct-1
0Ja
n-11
Apr
-11
Jul-
11O
ct-1
1Ja
n-12
Apr
-12
Jul-
12O
ct-1
2Ja
n-13
Apr
-13
Jul-
13O
ct-1
3Ja
n-14
Apr
-14
Jul-
14O
ct-1
4Ja
n-15
Apr
-15
Jul-
15O
ct-1
5Ja
n-16
Apr
-16
Jul-
16O
ct-1
6Ja
n-17
Apr
-17
Jul-
17O
ct-1
7Ja
n-18
Apr
-18
Jul-
18O
ct-1
8Ja
n-19
Apr
-19
Jul-
19
CSF NAV15 years ending July 31, 2019
($ in Millions)

TAB 8 – Calendar — Future Agenda Items
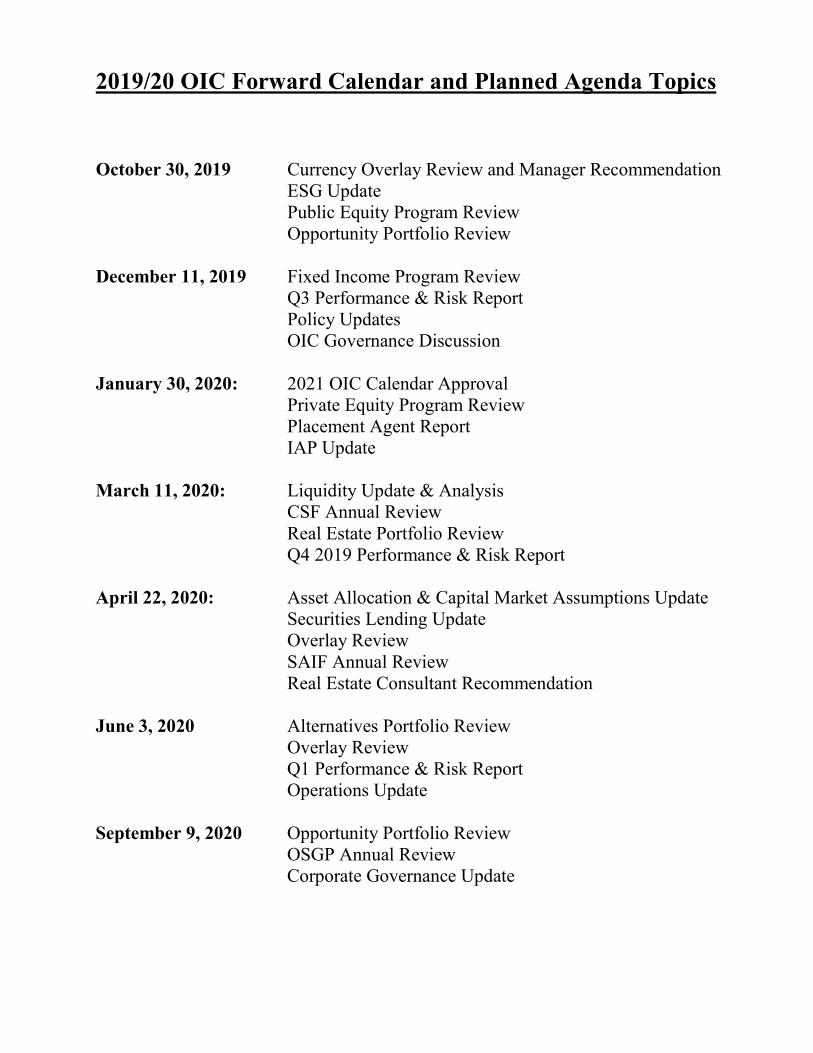
2019/20 OIC Forward Calendar and Planned Agenda Topics October 30, 2019 Currency Overlay Review and Manager Recommendation ESG Update Public Equity Program Review Opportunity Portfolio Review December 11, 2019 Fixed Income Program Review Q3 Performance & Risk Report Policy Updates OIC Governance Discussion January 30, 2020: 2021 OIC Calendar Approval Private Equity Program Review Placement Agent Report IAP Update March 11, 2020: Liquidity Update & Analysis CSF Annual Review Real Estate Portfolio Review Q4 2019 Performance & Risk Report April 22, 2020: Asset Allocation & Capital Market Assumptions Update Securities Lending Update Overlay Review SAIF Annual Review Real Estate Consultant Recommendation June 3, 2020 Alternatives Portfolio Review Overlay Review Q1 Performance & Risk Report Operations Update September 9, 2020 Opportunity Portfolio Review OSGP Annual Review Corporate Governance Update