ordered and chaotic vortex streets behind circular ... · pdf fileordered and chaotic vortex...
TRANSCRIPT
J . Fluid Mech. (1987), vol. 174, p p . 113-133
Printed in Great Britain 113
Ordered and chaotic vortex streets behind circular cylinders at low Reynolds numbers
By C. W. V A N ATTAT AND M. GHARIB Department of Applied Mechanics and Engineering Sciences, University of California,
San Uiego, La Jolla, CA 92093, USA
(Received 21 August 1985 and in revised form 22 May 1986)
We report some experiments undertaken to investigate the origin of ordered and chaotic laminar vortex streets behind circular cylinders at low Reynolds numbers. We made simultaneous measurements of near wake longitudinal velocity and cylinder lateral vibration amplitude spectra for cylinder Reynolds numbers in the range from 40 to 160. For a non-vibrating cylinder the velocity energy spectra contained only a single peak, a t the Strouhal frequency. When the cylinder was observed to vibrate in response to forcing by the vortex wake, additional dominant spectral peaks appeared in the resulting ‘ordered ’ velocity spectra. Cylinder vibra- tions too small to be noticed with the naked eye or from audible Aeolian tones produced a coupled wake-cylinder response with dramatic effects in hot-wire and cylinder vibration detector signals. The velocity spectra associated with these coupled motions had dominant peaks a t the Strouhal frequency f s , at a frequency f , proportional to the fundamental cylinder vibration frequency, and at sum and difference combinations of multiples of f s and f , . I n windows of chaos the velocity spectra were broadened by switching between different competing coupling modes. The velocity spectra were very sensitive to the nature of the boundary conditions a t the ends of the cylinder. Our measurements strongly suggest that the very similar regions of ‘order ’ and ‘ chaos ’ observed by Sreenivasan and interpreted by him as transition through quasi-periodic states in the sense of the Ruelle, Takens, and Newhouse theory were also due to aeroelastic coupling of the vortex wake with cylinder vibration modes.
1. Introduction The transition to turbulence or ‘chaotic’ states in fully bounded (closed) fluid
flows occurs under some conditions according to scenarios generically associated with low-order dynamical systems. Striking examples may be found in the experiments of Gollub & Swinney (1975) in circular Couette flow and Libchaber & Maurer (1980) in BBnard convection, and in the numerical calculations of convection by Curry et al. (1984). The question naturally arises as to whether such correspondences may exist for transition to turbulence in open fluid mechanical systems such as wakes, mixing layers, and boundary layers. From his recent hot-wire anemometer measure- ments in low-Reynolds-number circular cylinder wakes, Sreenivasan ( 1985) has concluded that several features of the initial stages of transition to turbulence in the von Karman vortex street wake are in essential agreement with the scenario of transition in low-dimensional dynamical systems described by Ruelle & Takens (1971) and Newhouse, Ruelle & Takens (1978).
t Also Scripps Institution of Oceanography.

114 C. W. L’an Atta and M . Gharib
Sirovich (1985) has advanced an explanation for Sreenivasan’s observations of quasi-periodicity in terms of the classical stability analysis of the von Karman vortex street. I n the Ruelle, Takens and Newhouse picture, hereinafter referred to as RTN, transition to chaos in a fluid mechanical system can occur after only two discrete transitions to quasi-periodicity as a parameter (like the Reynolds number) is increased. This may be contrasted with an earlier suggestion by Landau that broadband turbulent excitat>ions are only achieved after an infinit’e number of bifurcations through which the flow reaches successively more complicated quasi- periodic states. Other scenarios for transition to chaos are the ‘universal ’ routes via period doubling (Feigenbaum 1978) or quasi-periodic states (Rand et al. 1982) and intermittent generation of chaos (Pomeau & Manneville 1980).
Consider the RTN scenario applied to flow in the wake of a two-dimensional circular cylinder of diameter d , in a fluid of kinematic viscosity i t , with a free-stream velocity U . For low enough Reynolds number Re = U d / v the flow field a t a fixed spatial point would be steady in time. As Re increases beyond a critical value, a single time frequency limit cycle with Strouhal frequency f, = fs would occur. Beyond a second higher critical Re a quasi-periodic flow having t’wo incommensurate fre- quencies fs and fi would occur. Further increase in Re would lead to a flow with either three-frequency quasi-periodicity or a chaotic flow exhibiting broadband spectral excitation, possibly superimposed on a discrete spectrum.
Sreenivasan reported that as Re was increased in the low Re number vortex street range the initial single Strouhal frequency was replaced by a quasi-periodic signal with two independent frequencies a t Re x 55. Two-frequency quasi-periodicity continued up to Re x 67, where ‘ordered behaviour’ was lost in a short Re interval characterized by a broadened spectrum and associabed with a discontinuity in slope of the Strouhal frequency versus Re curve, a phenomenon previously noted by a number of investigators (e.g. Friehe 1980). Sreenivasan adopted the phrase ‘window of chaos’ for such a region. This window persisted until Re = 83, at which he reported the onset of three-frequency quasi-periodicity. This behaviour persisted until Re = 89, after which quasi-periodicities could not be clearly identified, although Sreenivasan remarks that four-frequency quasi-periodicity may have occurred. More windows of chaos were observed a t larger Re. Sreenivasan concluded that the initial stages of transition were characterized by narrow windows of chaos interspersed betwe,en regions of order and that the route to the first appearance of chaos is much like that envisaged by RTN. The potential significance of the latter conclusion prompted us to undertake the experiments reported here.
Earlier experience (e.g. Van Atta 1968) with coupling of vortex shedding and vibrations of cylinders made us wary of such a possibility in our experiment’s. The behaviour of such a coupled mechanical system is known (e.g. Blevins 1977) to be extremely sensitive to the amount of tension and damping in the cylinder. Berger & Wille (1972) describe the behaviour of the system consisting of the cylinder and its periodic wake as similar to that of a nonlinear self-excited oscillator undergoing forced vibrations.
I n our experiment we directly determined the presence or absence of coupling by continuously measuring the tension and natural vibration frequencies of the wire cylinders, and by simultaneously measuring the motion of the cylinders and wake velocity fluctuations.

Vortex streets behind circular cylinders
-
Guitar machine
head
anal yser
115
Interrupter
\
Strain K 2. Experimental arrangement
Our experiments were carried out in the low speed, low turbulence (u’/O less than 0.05% at a speed of 10 m/s) wind tunnel in the Department of Applied Mechanics and Engineering Sciences at the University of California, San Diego. The test section is 76 ern x 76 ern x 10 m long. A schematic diagram of the experimental set-up is given in figure 1 . The vortex-shedding cylinders were steel music wires mounted horizontally in the tunnel mid-plane 42 cm downstream of the end of the contraction. They passed freely through clearance holes in the tunnel walls and were supported at their ends outside the tunnel walls. One end was connected to a guitar string machine head used to adjust the tension T i n the wire. The other end was connected to a small cantilever beam with attached strain gauge used to measure the tension. We used wires of diameter d = 0.0254 cm and d = 0.036 em. The total length of the wire between the two supports was 91.2 cm. For some of the measurements with d = 0.036 cm, we simulated some conditions of Sreenivasan by shortening the cylinder length 1 to 48 cm. One end of the cylinder ran as usual through a hole in the 0.3 cm thick metal plate of the strain gauge assembly while the other ran through a clearance hole in an additional airfoil shaped strut mounted vertically near the tunnel mid-plane, and then continued to the guitar machine head mounted on the outside of the opposite tunnel wall. The strain gauge was calibrated by suspending a set of precision weights from one end of the wire after bypassing the guitar machine head to a pulley.
The hot wire used for measuring the longitudinal velocity fluctuation u’ in the cylinder wake was operated at an overheat ratio of 40 % by a DISA 55M01 constant temperature anemometer. The hot-wire probe body entered the wake from below a t an angle of 30°, and the hot wire was placed a t the mid-point of the cylinder length, and positioned near the centre of the lower row of wake vortices at a downstream location of about 5 cylinder diameters. The hot-wire probe and a small Pitot-static tube used in conjunction with a Baratron pressure gauge to measure the mean free-stream velocity were both mounted on a horizontal airfoil-shaped strut attached to a probe traverse outside the tunnel.
Transverse motions (vibrations) of the cylinder were detected with a GE H13A1

116 C. W . Van Atta and M . Gh,arih
r I
100
1 10 I00
T(newtons)
FIGURE 2. First mode natural vibration frequency of undamped cylinder versus tension. d = 0.0254 em, I = 91.2 cm. 0, measured; -, calculated.
infrared photon coupled interrupter module mounted on a vertical airfoil-shaped strut 15 cm from one of the tunnel walls. The detector contains a gallium arsenide solid state lamp optically coupled across a 3 mm gap with a silicon photo-transistor. The airfoil-shaped mount was vertically adjustable to maximize the detector output when the cylinder vibrated laterally in the gap. The frequency response of the detector was flat from 2 Hz to 10 kHz, and the smallest detectable cylinder displacement was on the order of 10 pm.
Power spectra of the hot-wire and photodetector signals were measured during the experiment with a Hewlett Packard 3561 Dynamic Signal Analyzer and plotter. The natural vibration frequencies j” of the cylinders were measured by tapping the tunnel wall and observing the spectrum of the photodetector. As shown in the example of figure 2, these measured frequencies corresponded closely with those calculated for a steel wire with the given tension, length, and diameter.
3. Results for undamped cylinders 3.1. Ordered velocity spectra produced by cylinder vibrations
A t first the wire tension was varied keeping the Reynolds number fixed to attempt to find a range of tension over which vibrations might be unimportant. It soon became apparent that no such extended range could be readily found, a t least with the values of tension attainable with our set-up. Furthermore, the qualitative nature of the hot-wire signal as well as the value of the shedding frequency depended very sensitively on the wire tension. As the tension was varied over even very small ranges the hot-wire signal varied from a nearly constant amplitude single frequency signal at the Strouhal vortex frequency to a variety of time-varying amplitude signals in which the vortex-shedding frequency signal was amplitude or frequency modulated by lower frequencies.
When the cylinder was observed not to vibrate, the hot-wire spectrum contained only a single peak a t the Strouhal frequency fs.
Vortex streets behind circulcrr c y h d e r s 117
-111 I I I
-131 . I I I

118 C. W . Van Atta and M . Gharib
When the cylinder vibrated, the detector signal frequently exhibited a strong peak at a frequency f, = mfN, an mth order harmonic of the first mode natural vibration frequency fN, sometimes accompanied by a peak a t f N or its other harmonics. The cylinder vibrations were usually too small to be detectable with the naked eye. The frequency f, was always observed to correspond to a vibration harmonic adjacent to the observed Strouhal frequency, and thus appeared to be directly caused by the response of the cylinder to the vortex street forcing. The fundamental first-mode vibration frequency of the cylinder was roughly an order of magnitude less than the Strouhal frequency, a constraint dictated by the breaking strength of the steel cylindrical wires employed. The cylinder was thus ‘tuned ’ far from its principal resonance, and hence one would expect a small amplitude response.
When the cylinder vibrated, the spectrum of the hot-wire signal exhibited strong peaks at fs, a t f,, a t a low frequency modulation frequency f 2 = f, - fs, and a t other sum and difference combinations of multiples of fs and f2. Thus, as long as fs was not an integer multiple of f N the velocity signal exhibited two-frequency quasi-periodicity, with incommensurate frequencies fs and f,.
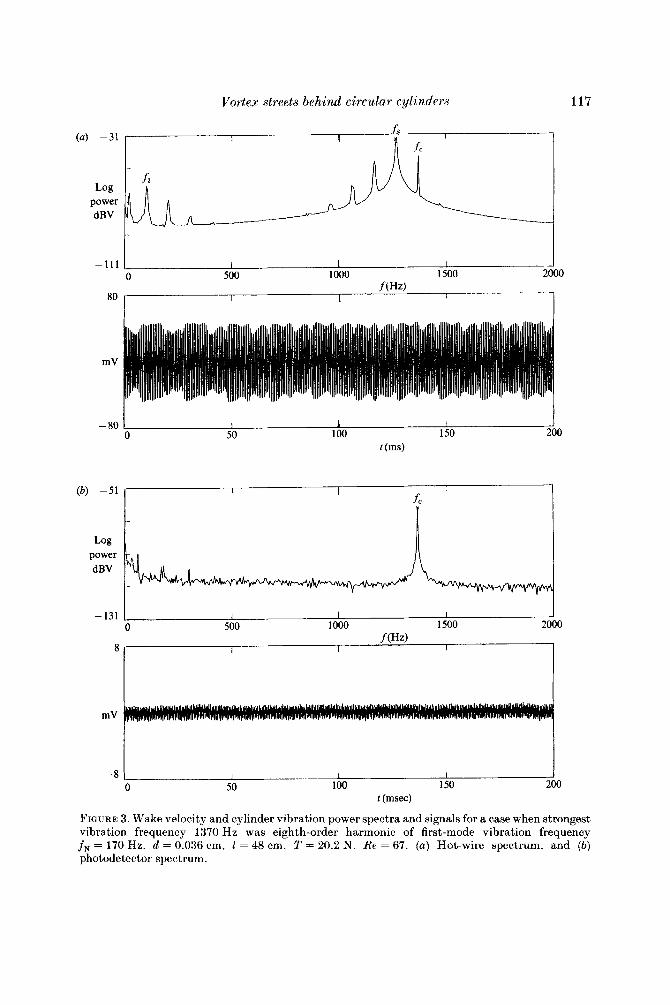
An example of this type of behaviour is shown in figure 3. Here, and in figures 4, 6 , 7 , 8 , 9 and 12 the spectral data presented are averages over ten spectral samples, the spectral power and signal are presented in arbitrary units, and the full range of the logarithmic spectral power scale is 80 dBV. The cylinder vibration spectral peak in figure 3(b ) occurs a t 1370 H z , the eighth-order harmonic of the first-mode vibration frequency of 170 Hz. In addition to the peak at the Strouhal frequency fs = 1265 Hz, the hot-wire spectrum in figure 3 ( a ) exhibits strong spectral peaks at the low-frequency modulation frequency f, = 1370- fs = 105 Hz, a t fs k f 2 , and other related frequencies. Nonlinear coupling of the vortex street with the vibrating cylinder in the manner described by Berger & Wille (1972) can account for all the observed spectral peaks except the one at 20 Hz. The relative sharpness of thefs+ f2
peak at 1370 Hz, as compared with the Strouhal peak and other peaks in the velocity spectrum, may be caused by the fact that i t represents a velocity perturbation, perhaps even a potential flow field, produced directly in the wake by cylinder vibration a t a sharply defined mechanical frequency, while the remaining peaks are due to nonlinear wake-vortex interactions.
The spectral peak near 20 Hz in the hot-wire spectrum in figure 3 (a ) and in some of the other figures is due to vibration of the cantilevered hot-wire probe support excited by a room floor vibration centred near this frequency. While its presence cannot be seen directly in the complex hot-wire signal of figure 3 ( a ) , it is clearly evident in the more regular velocity trace of figure 9 ( a ) . It appears to have no fluid dynamical significance, as no other related peaks appear in the hot-wire spectrum, and i t does not appear in the photodetector spectrum.
I n another frequent type of behaviour, the spectra of both our hot-wire and optical detector signals contained peaks at a low-frequency modulation frequency f2, at the Strouhal frequency fs, and often a t the sum and difference sidebands and other combinations of fs and f,. I n all cases the principal modulation frequency was found, within the uncertainty in frequency resolution due to finite bandwidth, to be equal to either the natural first-mode vibration frequency of the cylinder or to a low-order (second or third) harmonic or subharmonic of this frequency. Judging from contem- porary reviews of the subject, e.g. Berger & Wille (1972). subharmonic-like coupling of this kind has apparently not received the great amount of attention given to vibration of cylinders at first-mode natural frequencies or higher harmonics of the same order as the Strouhal frequency, as in the example in figure 3.
Vortex streets behind circular cylinders 119
fs I (a) -31 I I I I I
-
I I I
Log power dBV
- 1 1 1
80
mV
- 80
(b) -31 r I I I
Log power dBV
t - 1 1 1
80 I I 3
mV
- 80 I I I 0 50 100 150 1
2 (ms)
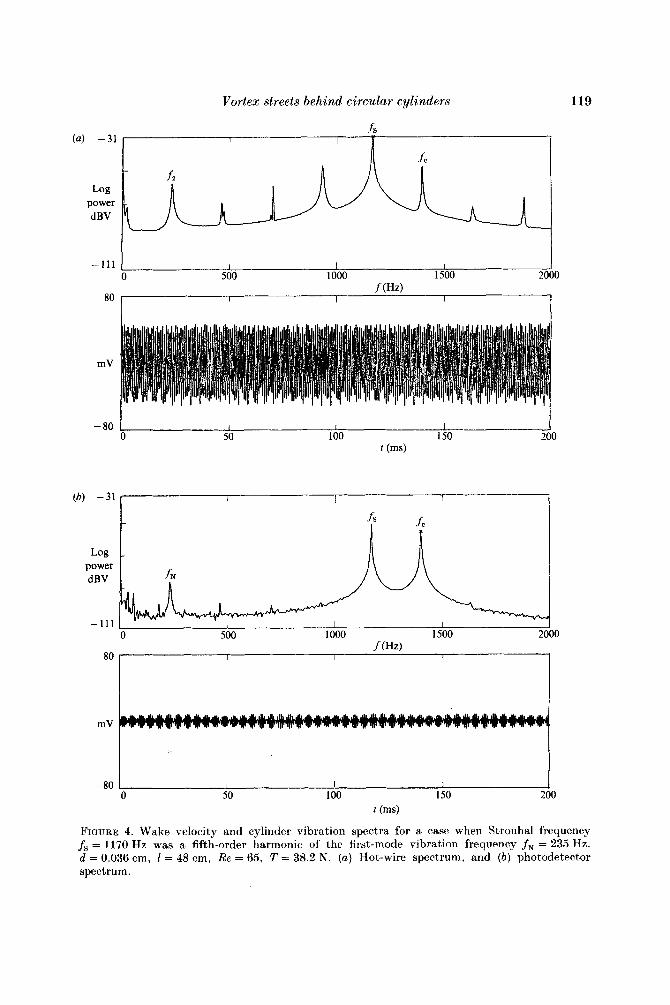
FIGURE 4. Wake velocity and cylinder vibration spectra for a case when Strouhal frequency fs = 1170 Hz was a fifth-order harmonic of the first-mode vibration frequency fN = 235 Hz. d = 0.036 cm, I = 48 cm, Re = 65, T = 38.2 N. (a ) Hot-wire spectrum, and ( 6 ) photodetector spectrum.

120
3500 fs (Hz’ 3000
2500
2000
1500
1000
C. W . Van Atta and M . Gharib
-
~
-
-
-
-
5000
4000
.A (Hz)
3000
2000
1000
0 W
00 0 0
d- 10
40 60 80 100 120
Re
4000 4500 i (b’
anQaDo 0
He 4
000-5 0
0 0 500 I I I I I
40 60 80 100 120 140 160 180 Re
FIGURE 5 . Vortex-shedding frequency versus Reynolds number. Undamped, (a) d = 0.0254 cm, 1 = 91.2 cm, T = 29.7 N. fN = 150 Hz, (b) d = 0.036 em, I = 48 cm, T = 38.2 N, fN = 235 Hz. Integers denote order of harmonic of fundamental vibration mode associated with a given frequency level. For clarity, only a few harmonics are indicated.
When the Strouhal frequency fs was an integer multiple of f N many other spectral peaks were often present in the hot-wire and detector spectra, all of which were simply related to fs and f 2 by combinations of sums and differences of multiples of fs and f2. For the example of this type of behaviour shown in figure 4 the Strouhal frequency fs = 1170 Hz is the fifth-order harmonic of the first-mode vibration frequency f N = 235 Hz. There are strong peaks in the cylinder vibration spectrum a t f N , 5fN, and f, = 6fN, and strong peaks in the wake velocity spectrum a t f 2 = f N
and all other harmonics of fN.
The second frequency f 2 appeared in the velocity signal only when the cylinder was

Vortex streets behind circular cylinders 121
f s = 1335 (a) -31 1 I 1 I
-111 I I I
0 500 1000 1500 2000 s (H4 80 I I I
' (ms)
(b) -41
power dBV
-121 I I I I
0 500 1000 1500 2
2o i mV
-20 1 I I I I 0 50 100 150 200
t (ms) FIGURE 6. Wake velocity and cylinder vibration spectra and signals. Undamped, T = 11.6 N,
d = 0.036 cm, 1 = 48 cm, fN = 135 Hz, Re = 69. (a) Hot-wire, and (b ) photodetector.
observed to be vibrating, so the quasi-periodic or harmonically related combination signals were a result of the vortex streekcylinder vibration coupling. They were not a purely fluid mechanical response of the wake of a non-vibrating cylinder, as would incorrectly be inferred if we adopted Sreenivasan's RTN interpretation for our hot-wire spectrum alone and ignored the cylinder vibration spectra.
122 C. W. I'an Atta, and M . Q'harib
(a) - 3 1
-
Log power dBV
- 121
- 1 1 1 I 1 I I
0 500 1000 1 500 20 f (Hz)
I I I
I0
power
- 20 , 0 50 100 150 200
t (ms)
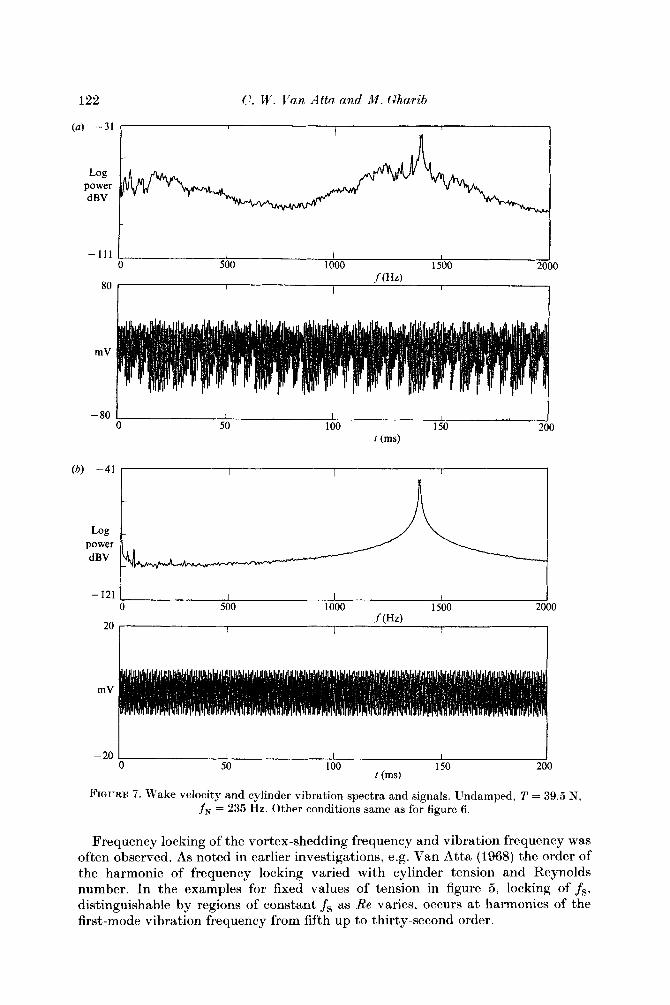
F~UUK.II I . v v a ~ e veiocig ana cylinaer VilJration spectra and signals. Undamped, 'I' = 3 Y . 5 N , fN = 235 Hz. Other conditions same as for figure 6.
Frequency locking of the vortex-shedding frequency and vibration frequency was often observed. As noted in earlier investigations, e.g. Van Atta (1968) the order of the harmonic of frequency locking varied with cylinder tension and Reynolds number. In the examples for fixed values of tension in figure 5, locking of fs, distinguishable by regions of constant fs as Re varies, occurs at harmonics of the first-mode vibration frequency from fifth up to thirty-second order.

Vortex streets behind circular cylinders 123
I
-
(a) -31
-
I I I
Log power dBV
8 I I I
mV 1
-8 I I I
- 1 1 1
80
- 80 0 50 100 150 200
Broadened hot-wire and detector spectra centred around a cylinder vibration harmonic frequency were also observed. We shall use the presence of a broadened continuous spectrum as an operational definition of chaotic behaviour, as did Sreenivasan. He also found that the dimension of the signal had non-integer values for such cases. We have not calculated the dimension.
5 F L M 174

124 C. W . Iran Atta and 41. Gharib
3.2. Order and chaos as a function of tension
For our undamped cylinders, as the tension was varied for a fixed value of the Reynolds number, ranges of tension producing ‘regions of order’ were interspersed with regions containing ‘windows of chaos ’. I n the example illustrated by figures 6 , 7 and 8 the lower value of tension (figure 6 ) yields spectra with peaks at vibration and Strouhal frequencies and their combinations. The larger value of tension (figure 7) produces a broadened (chaotic) spectrum with maximum at the same frequency as the peak in the vibration spectrum. Then, when the cylinder is damped (see $4.1) keeping the same larger value of tension, the cylinder vibrations and chaotic spectrum are simultaneously destroyed (figure 8) .
4. Results for damped cylinders 4.1. Elimination of ordered regimes by damping
To obtain more extensive data in the wake of a non-vibrating cylinder we damped the cylinder with rectangular 1.3 cm thick pieces of polystyrene packing foam mounted on the outside of the tunnel walls and pressed against the cylinder from below. I n many cases this successfully eliminated cylinder vibrations and only a single peak a t the shedding frequency appeared in the hot-wire spectrum, with no evidence of vibrations in the photodetector spectrum. For the example of damped behaviour shown in figure 9 ( a , b ) , the Reynolds number and tension are identical to those for the undamped case shown in figure 3 ( a , b ) . The increased damping simultaneously eliminated both the cylinder vibrations and the quasi-periodic or harmonically related behaviour in the hot -wire signals.
The damping we employed did not completely eliminate cylinder vibrations, but i t did restrict the Reynolds-number range in which vibrations occurred to short ‘windows of chaos’ associated with discontinuities in the slope of the shedding frequency versus Reynolds number relation. The damped runs exhibited only a few discontinuities in the slope of the f s versus Re curve compared with the corresponding undamped cases. For the examples shown in figure 10(a, b ) , the diameters, lengths, and tensions are nearly the same as those of the corresponding undamped cases of figure 5 (a , b ) . The discontinuities resemble those found by Sreenivasan (1985), Friehe (1980) and other previous investigators. I n the regions of nearly constant slope no cylinder vibrations were observed, so that the observed frequency should correspond to the natural shedding frequency of a non-vibrating cylinder. I n these regions, the measured frequency or Strouhal number was always within 2-3 yo of that calculated from the low Re empirical formula of Roshko (1954). In the ‘kink’ regions of the discontinuities, vibrations were present. The hot-wire spectrum was broadened around the shedding-frequency peak, as noted by Sreenivasan. For a given fixed-wire tension, the fs versus Re curves and the positions of the kinks were completely reproducible within a single run and from day to day. As seen in figure 10(a), for d = 0.0254 cm and 1 = 91.2 cm, four kinks persisted despite the damping. For d = 0.036 cm and 1 = 48 em, only a single kink persisted at Re = 135 in the damped case (figure l o b ) . For the same 1 and d , Sreenivasan found three kinks a t Re = 66, 81, and 130-140, suggesting that his boundary conditions and tension effectively produced a case intermediate between our undamped and damped cases.
The low-frequency first-mode cylinder vibration was difficult to damp for d = 0.0254 em, and in many cases persisted a t a low level in the photodetector

Vortex streets behind circutar cylinders 125
Log
(a) -31
-
Log power dBV
- 1 1 1
80
I
L
I I I 0 500 1000 1500 2000
- 80 0 50 100 150 200
FIGURE 9. Same conditions as for figure 3 except cylinder has been damped, i.e. d = 0.036 cm, 1 = 48 cm, T = 20.3 N, Re = 67. Low-frequency peaks in photodetector spectrum are line frequency 60 Hz and its harmonics. ( a ) Hot-wire, and (b ) photodetector.
5-2

126
fs (Hz)
C. W . Van Atta and M . Gharib
6000 I I I I 0
5000
4000
3000
2000
1000 I I I I I
40 60 80 100 120 140 Re
3500
3000
2500 h
(W 2000
1500
1000
500
0
O0
' 0
0
40 60 80 I00 120 140 160 180 Re
FIGURE 10. Vortex-shedding frequency versus Reynolds number. Nearly same conditions as for figure 5 except cylinders have been damped. (a) d = 0.0254 em, I = 91.2 cm, T = 27.5 N, f N = 145 Hz, (b) d = 0.036 cm, I = 48 em, T = 38.2 N, f N = 235 Hz. Arrows denote positions of windows of chaos.
spectra, despite the damping. The presence of the low-level vibrations was usually not evident in the hot-wire signal spectra.
4.2. Behaviour in the windows of chaos The Re locations of the discontinuities were fixed for a given value of tension, but varied as the tension was varied. From limited data, we observed that the regions of chaos occurred near Re regions in which persistent frequency locking occurred in the undamped case. In the Re range inside windows of chaos, for both the damped and undamped cases, the spectral peak was broadened, as observed by Sreenivasan.

Vortex streets behind circular cylinders 127
I I
2500
0 2500 5000 f ( H a
FIWJRE 11. Variation of individual (unaveraged) velocity spectra with time for H e inside a window of chaos. The time corresponding to individual spectra increases from bottom to top spectrum, d = 0.0254 cm, T = 26.1 N,fN = 141 Hz, Re = 65.
When the time-dependent behaviour of the spectrum over shorter intervals was examined, as in figure 11, i t was found that the spectral maximum was switching back and forth between different spectral peaks (the two peaks in this example are at 2410 and 2500 Hz), and the spectrum sporadically appeared very much broadened. The origin of the broadening thus appears to be a competition between Strouhal and vibration modes. Such mode competition appears to be a common source of chaotic behaviour, e.g. Ciliberto & Gollub (1984) have observed chaotic behaviour arising from competition between two different free-surface modes of a circular fluid layer that is forced vertically. Higher-order mode competition was sometimes present in our undamped cases, and frequently the switching was easily audible to the ear. I n one case a pattern of four distinct sequential tones was repeated a t intervals of about 20 s. The detection of possible cylinder vibrations in the damped cases was sometimes difficult. Further experiments could usefully employ a vibration detector with freedom of movement along the cylinder span, in order to avoid nodal positions in the cylinder response.
Our measurements suggest, as do some of the earlier works referenced in Friehe (1980) that discontinuities in the shedding frequency versus Re curve and their spectral manifestations in windows of chaos can be produced by competitive coupling of natural and forced vortex shedding with different cylinder vibration modes, and not simply by fluid mechanical transitions in the wake alone. Sensitive and more extensive measurements of possible cylinder vibrations, as well as simultaneous flow visualization to distinguish possible wake transitions as noted by Tritton (1959) and Berger (1964), would be required to further substantiate this conjecture.

128 C. W . Van Atta and M . Gharib
While our measurements suggest that if there were absolutely no vibration a Strouhal-Reynolds number plot would have absolutely no discontinuities, Tritton (1959) and Friehe (1980), who attempted to minimize vibrational effects, interpret similar discontinuities in their experiments as purely fluid mechanical effects. Some of the earlier experiments were done with much thicker cylinders than either the present or Sreenivasan’s experiments and any vibrations would thus be bending beam modes, not vibrating string modes, but the possibility of small amplitude vibrations was obviously still present. Some previous experiments were done in water, for which the different density ratio would change the dynamical interaction between fluid and cylinder. Thus, only the general idea and not the detailed results of the present work may be relevant to these other situations. It would be most useful, and, according to our findings, necessary at this stage to repeat some of these earlier measurements, together with a sensitive measurement of possible vibrations, in order to be certain of the earlier interpretations.
5. Behaviour of velocity spectra after transition to turbulent flow When Re was sufficiently increased, natural transition to turbulent flow occurred.
There was no appearance of spectral side bands in the immediate pre-transition period, and natural transition occurred with gradual broadening of the spectra as Re increased. Figure 12 presents an example of the hot-wire spectra for an undamped and damped cylinder a t Re = 162 after natural transition had occurred. For the undamped case (figure 12a) wire vibration is present and was detected in both the hot-wire and optical detector spectra. In contrast with the frequent destruction of spectral broadening by damping a t lower Reynolds number, as illustrated in figure 12 ( b ) , damping of the cylinder after natural transition has no effect on the broadened turbulent spectrum. Changing the value of cylinder tension also has no effect on the damped cylinder turbulent spectrum, and simply changes the location of the vibration spectral peak in the undamped case. After natural transition the position of the vibrational spectral peak is therefore unrelated to the peak in the broadened spectrum, whereas it lies near the maximum of the broadened spectra in the windows of chaos. The vibrating cylinder cannot effectively drive the relatively incoherent turbulent wake as it does the more organized, lower Reynolds number, laminar vortex motions in windows of chaos.
6. Comparison of velocity spectra of Sreenivasan with present results There are great similarities between our results and the velocity spectra reported
by Sreenivasan. The similarities, considered together with the additional information from our photodetector spectra, provide strong evidence for an aeroelastic response interpretation of his results, as an alternative to the RTN scenario.
A hot-wire spectrum measured by Sreenivasan exhibiting two-frequency periodicity is given in figure 1 of Sirovich (1985), with the explanatory remark that ‘This figure replaces Fig. 3 of Sreenivasan (1985), which was incorrectly included in that paper.’ Sreenivasan (private communication) has informed us that the replacement figure is intended to better complement the rest of the data in his paper, which was taken with a relatively short cylinder, whereas his original figure 3 was for a longer cylinder in a different wind tunnel. This spectrum, for the shorter cylinder a t Re = 58, contains narrow peaks a t the Strouhal frequency fs = 181 Hz, a t a low frequency f, = 7.8 Hz, and at various combinations of sums and differences of these two

Vortex streets beh,ind circular cylinders 129
- 1 1 1 I I I
(u) - 3 1 I I I I 1
-80 I I I I
I I
rnV
(b) - 3 1 I I I 7
-111
80
0 500 1000 1500 2000 f (Hz)
I I I I
rnV
- 80 I I I
0 50 100 150 200
FIGURE 12. Velocity spectra and signals after transition to turbulent flow d = 0.036 cm, 2 = 48 em, T = 38.5 N, f N = 237 Hz, Re = 162. ( a ) Undamped, and ( h ) damped.
frequencies. This behaviour is very similar to that shown in our figure 3, for which the low-frequency modulation fi is equal to the difference between the Strouhal frequency and an adjacent cylinder vibration harmonic. Nonlinear coupling of the vortex street with the vibrating cylinder can account for all the other observed spectral peaks.

130 C. W . Ira,n Atfa an.d 31. Gh.arib
For a longer cylinder a t Re = 54, Sreenivasan’s hot-wire spectrum (his original figure 3) contained narrow peaks a t the Strouhal frequency fs = 834 Hz, a t a one-seventh-order near-subharmonic (which we interpret as due to cylinder vibration) f, = 119.02 Hz, and at many of its higher-order harmonics. We note that & = 7.007 is essentially integer within the given frequency resolution. This behaviour is essentially of the type illustrated in our figure 4, for which the Strouhal frequency was a harmonic of the fundamental vibration frequency. This interpretation is consistent with Sreenivasan’s observation that when he picked f , by hypothesizing that the peaks nearest fs must be fs f f,. ‘the value of f, thus obtained accounts for every other significant peak as shown (in Sreenivasan’s Fig. 3 ( b ) ) actually to 4 or 5 decimal places for reasons we do not understand! ’. Sreenivasan interpreted fs and f , as independent frequencies, of purely fluid-mechanical origin.
I n a more complex case, Sreenivasan’s hot-wire spectrum at Re = 76 shows narrow peaks a t fs = 1187.7 Hz, f i = 68.3 Hz, and a t f3 = 21.9 Hz and many combinations off, and f,. Conjecturing that f3 and f, x 3.0f3 are harmonically related wire-vibration frequencies, this spectrum is generically similar to many we obtained in which more than one cylinder vibration frequency was excited.
The strong similarity between these velocity spectra of Sreenivasan and our results obtained only under conditions when the cylinder was known to be vibrating strongly suggest that the ordered velocity spectra observed by Sreenivasan were due to aeroelastic coupling between the vortex street and cylinder. Quantitative comparison of f , and other frequencies with possible vibrational coupling modes for Sreenivasan’s data is not possible since he did not measure the cylinder motion, natural vibration frequencies, or tension.
While this absence of vibrational frequency data precludes any direct attempt to reproduce Sreenivasan’s results, we attempted a brief simulation of his conditions with d = 0.036 em, 1 = 48 cm. For T = 18.6 N, f N = 179 Hz, we observed a case in which hot-wire and vibration spectra exhibited a one-seventh-order subharmonic of the shedding frequency a t the first-mode cylinder vibration frequency, and all com- binations of sum and difference frequencies as in Sreenivasan’s original figure 3. This occurred a t a Reynolds number of 47, rather than 54 as in Sreenivasan’s experiment, perhaps reflecting the differences in boundary conditions and tension. We performed a brief flow-visualization experiment for this case using a smoke wire in the horizontal plane of the cylinder and in front of it.
Photos taken with a one millisecond exposure time showed streamwise bands of greatly contorted smoke filaments between wider smooth bands of parallel filaments. The spanwise wavelength of this structure was about 6.6 cm, or about one-seventh of the total cylinder length. This is consistent with the wavelength of the vibration nodes associated with the dominant cylinder vibration spectral peak a t the seventh harmonic of the fundamental cylinder vibration frequency. I n this brief simulation, we also noted under other conditions the occurrence of more than two non- commensurate frequencies as observed by Sreenivasan, which in all cases were associated with corresponding cylinder vibration frequencies.
Sreenivasan’s velocity spectrum data have features common to both our undamped and damped cases. As the Reynolds number varied, he found a few regions of order similar to those which appeared ubiquitously in our undamped cases, but he also found a small number of windows of chaos, as in our damped cases. It thus appears that Sreenivasan’s boundary conditions were effectively ‘partially damped ’, producing a response intermediate to our two more extreme cases. As described in 54.2, the Re location of our windows of chaos depended on tension, suggesting that

I’ortex streets behind circular cylinders 131
Sreenivasan’s observat>ion that the position of his windows of chaos varied from day to day may have been caused by corresponding changes in tension.
7. Conclusions For our measurements ‘regions of order’ were found which were similar to those
interpreted by Sreenivasan as transition through quasi-periodic states in the sense of the Ruelle, Takens and Newhouse theory. In our measurements these ‘regions of order’ were found in all cases to be due to aeroelastic coupling of the vortex-wake oscillations to excited cylinder vibration modes. Our experimental results have shown the extreme sensitivity to very low amplitude cylinder mechanical vibrations of the well-known coupling of wake-vortex oscillations to excited mechanical vibrations. Cylinder vibrations much too small to be noticed with the naked eye or from audible Aeolian tones can produce a coupled wake-cylinder response which produces readily observed dramatic effects in hot-wire and cylinder vibration detector signals. The wake velocity and cylinder vibration spectra associated with these coupled motions frequently had dominant peaks a t a frequency proportional to the cylinder vibration frequency, a t the vortex-shedding frequency, and sum and difference combinations of these two frequencies.
Damping applied a t the ends of the cylinder has a profound effect on the nature and degree of the aeroelastic coupling. It proved to be very difficult to completely eliminate such coupling under the conditions we employed. For a non-vibrating cylinder no spectral peaks other than the primarily Strouhal shedding frequency f s were found. Thus, for our non-vibrating cylinder in the Reynolds-number range from 40 up to 160 there are no early stages of transition that proceed according to the scenario of Ruelle, Takens and Newhouse, contrary to the earlier conclusion of Sreenivasan obtained from consideration of wake velocity spectra alone.
In the ‘windows of chaos’ the hot-wire and vibration spectra are broadened by switching between different competing coupling modes. Both the hot-wire and cylinder vibration spectra are very sensitive to the exact boundary conditions a t the ends of the cylinder.
Sirovich (1985) has suggested that the quasi-periodic behaviour with frequencies f s and f 2 observed by Sreenivasan (1985) can be described in terms of the classical stability analysis of the von Karmdn vortex street, in which periodic perturbations of groups of four or more vortices are considered. Sirovich compares the predicted ratio f2/fs, which is a strong function of the number of vortices in each perturbed group, with experiments in order to identify which modes are excited. We find that the predicted ratios are sometimes fairly close to some of our experimental values, as also found by Sirovich for selected data of Sreenivasan, but in many cases the predictions and measured values are widely different. For example, for the data in our figure 3, f 2 / f s = 0.083, which is fairly close to the value of G.07 appropriate for a four-vortex instability for Re = 67 given in figure 4 of Sirovich (1985). However, for the data of our figure 4 at nearly the same Re, f 2 / f s = 0.2, larger by a factor of 2.5 than the largest ratios predicted by the stability analysis. Similarly, Sirovich finds that the predicted values of f 2 / f s assuming eight- and ten-vortex interactions bracket Sreenivasan’s shorter cylinder data in the range of Re from 50 to 60, for which f 2 / f s lies between 0.03 and 0.04. However, for the longer cylinder data a t Re = 54 of Sreenivasan’s original figure 3, f 2 / f s = 0.14, a value three and a half times larger than for the shorter cylinder in the same Re range and 50 O/’ greater than the largest values predicted by the stability analysis. Clearly, Sirovich’s stability
132 C. W. V u t ~ Atta and M . Gharib
analysis cannot be expected to predict the correct values of f 2 because the analysis does not include the mechanism of cylinder vibrations shown here to be essential in creating f2. However, the stability arguments might prove useful in explaining why the vortex street exhibits a strong receptivity to disturbances with frequency fi = f,- fs, which sometimes lies within the range predicted by the analysis.
Recognizing that quasi-periodic velocity and cylinder motion signals can be caused by cylinder vibrations, one can pose the question of whether the system consisting of the cylinder and its periodic wake considered as a nonlinear self-excited oscillator sometimes behaves according to the RTN scenario. This interpretation may have some merit, since, in both our experiments and those of Sreenivasan the broadened 'chaotic ' spectrum can first appear after a region of two-frequency quasi-periodicity. One also may ask whether in such a coupled system the motion of the cylinder itself could be considered truly chaotic. We note that in two recent studies Miles (1984a. b ) found that a weakly nonlinear, resonantly forced string apparently does not exhibit a chaotic response, whereas for a weakly nonlinear, damped oscillator driven by an amplitude-modulated force the envelope of the response is chaotic for certain values of the parameters. These results and the present experimental results suggest that examining the behaviour of a computational model of the coupled cylinder-vortex street system might be interesting and perhaps enlightening.
Our hot-wire measurements were all taken a t the mid-point of the cylinder length a t a fixed value of the spanwise coordinate, whereas our flow visualization suggested an important spatially periodic variation in the nature of the flow with a spanwise period determined by the particular vibration harmonic. We plan in future experi- ments to investigate the spanwise dependence and its connection with the present observations.
We wish to thank Mr M. Khazra for assistance with some of the experiments, Dr J. Starrett for his design of the strain gauge beam, and Professor K. R. Sreenivasan for a preprint of his paper and several useful discussions. The work was partially supported by NSF Grant OCE 85-11290 and the Defense Advanced Research Projects Agency University Research Initiative Program.
R E F E R E N C E S
BERGER, E. 1964 Bestimmung der hydrodynamischen Groessen einer Karmanschen Wirbelstrasse
BERGER, E. & WILLE, R. 1972 Periodic flow phenomena. Ann. Rev. Fluid Mech. 4, 313-340. BLEVINS, R. D. 1977 Flow Induced Vibrations. Van Nostrand Reinhold. CILIBERTO, S. & GOLLUB, J. P. 1984 Pattern competition leads to chaos. Phys. Rev. Lett. 52,
CURRY, J. H., HERRING, J. R., LONCARIC, J. & ORSZAG, S. A. 1984 Order and disorder in two-
FEIGENBAUM, M. J. 1978 Quantitative universality for a class of nonlinear transformation. J . Stat.
FRIEHE, C . A. 1980 Vortex shedding from cylinders at low Reynolds numbers. J . Fluid Mech. 100,
GOLLUB, J. & SWINNEY, H. L. 1975 Onset of turbulence in a rotating fluid. Phys. Rev. Lett. 35,
LIBCHABER, A. & MAURER, J. 1980 Effect of Prandtl number on the onset of turbulence in liquid
MILES, J. W. 1984a Resonant nonplanar motion of a stretched string. J . Acoust. Soc. Am. 75,
aus Hitzdrahtmessungen bei kleinen Reynoldsschen Zahlen. 2. F l u g u k . 12, 41-59.
922-925.
and three-dimensional Renard convection. J . Fluid Mech. 147, 1-38.
Phys. 19, 25-52.
237-241.
927-930.
4He. J. Phys. Lettres 41, L-515-L-518.
1505-1 5 10.

Vortex streets behind circular cylinders 133
MILES, J. W. 19846 Chaotic motion of a weakly nonlinear, modulated oscillator. Proc. Nut. Acad.
NEWHOUSE, S., RUELLE, D. & TAKENS, F. 1978 Occurrence of strange axiom A attractors near
POMEAU, Y. & MANNEVILLE, P. 1980 Intermittent transition to turbulence in dissipative systems.
RAND, D., OSTLUND, S., SETHNA, J. & SIGGIA, E . 1982 Universal transition from quasi-periodicity
ROSHKO, A. 1954 On the development of turbulent wakes from vortex streets. NACA Rep. 11W. RUELLE, D. & TAKENS, F. 1971 On the nature of turbulence. Commun. Math. Phys. 20, 167. SIROVICH, L. 1985 The Karman vortex trail and flow behind a circular cylinder. Phys . Fluids 28,
SREENIVASAN, K . R . 1985 Transition and turbulence in fluid flows and low-dimensional chaos.
TRITTON, D. J. 1959 Experiments on the flow past a circular cylinder at low Reynolds numbers.
VAN ATTA, C. W. 1968 Experiments on vortex shedding from yawed circular cylinders. AIAA J .
Sci. 81, 391S3923.
quasiperiodic flows on Tm, m 2 3. Commun. Math. Phys. 64, 35-10.
Commun. Math. Phys. 74, 189-197.
to chaos in dissipative systems. Phys. Rev. Lett. 49, 132-135.
2723-2726.
In Frontiers in Fluid Mechanics (ed. S . H. Davis & J. L. Lumley), pp. 41-67. Springer.
J . Fluid Mech. 6 , 547.
6. 931-933.