ordan economic monitor - world bank¿gó∏Ñdg øe ºgqÉ ùe ø««ª«n ∏be’g ìÉ« ùdg øe...
TRANSCRIPT
0.9375 cm
JORDAN ECONOMIC MONITOR
Poverty Reduction and Economic Management UnitMIDDLE EAST AND NORTH AFRICA REGION
The World Bankwww.worldbank.org.jo
The World Bank
MAINTAINING STABILITY AND FOSTERINGSHARED PROSPERITY AMID REGIONAL TURMOIL
SPRING 2013

The Jordan Economic Monitor provides an update on key economic developments and policies over the past six months. It also presents findings from recent World Bank work on Jordan. It places them in a longer-term and global context, and assesses the implications of these developments and other changes in policy for the outlook for the country. Its coverage ranges from the macro-economy to financial markets to indicators of human welfare and development. It is intended for a wide audience, including policy makers, business leaders, financial market participants, and the community of analysts and professionals engaged in Jordan.
The Jordan Economic Monitor is a product of the World Bank’s Jordan Poverty Reduction and Economic Management (PREM) team. It was prepared by Chadi Bou Habib (Senior Economist) and Samer Matta (Economic Analyst), under the general guidance of Eric Le Borgne (Lead Economist), Bernard Funck (Sector Manager) and Manuela Ferro (Sector Director). Special Focus contributors include Dalia Al Kadi (Economist) for the section on the impact of the Syrian conflict on Jordan, Anuja Utz (Senior Operations Officer), Jean Eric Aubert (Consultant), and Tamer El Sayed Taha (Consultant) for the focus on the transition to a knowledge economy, and Chadi Bou Habib for the section on options for fiscal consolidation. May Ibrahim (Senior Executive Assistant) provided Arabic translation and Zeina El Khalil (Communications Associate) print-produced the report.
The findings, interpretations, and conclusions expressed in this Monitor are those of World Bank staff and do not necessarily reflect the views of the Executive Board of The World Bank or the governments they represent.
For information about the World Bank and its activities in Jordan, including e-copies of this publication, please visit www.worldbank.org.jo.
To be included on an email distribution list for this Jordan Economic Monitor series and related publications, please contact Nada Abou Rizk ([email protected]).For questions and comments on the content of this publication, please contact Eric Le Borgne ([email protected]).
Questions from the media can be addressed to Mona Ziade ([email protected]).
PREFACE
JORDAN ECONOMIC MONITOR
Preface | 1

FIGURE 16. Inflation has remained stable since the Syrian crisis began . . . . . . . . . . . . . . . . . . . . . . . . . . . . . . . . . . . . . . . . . . . . . . . . . . . . . . . 15
FIGURE 17. Tourism and Syrian refugee inflows have supported growth in key services sectors . . . . . . . . . . . . . . . . 16
FIGURE 18. Trade has begun to suffer due to impediments to transit trade through Syria . . . . . . . . . . . . . . . . . . . . . . . . . . 16
FIGURE 19. Deficits widened anew since 2008 … .. . . . . . . . . . . . . . . . . . . . . . . . . . . . . . . . . . . . . . . . . . . . . . . . . . . . . . . . . . . . . . . . . . . . . . . . . . . . . . . . . . . . . . 17
FIGURE 20. … Resulting in a rapid debt accumulation . . . . . . . . . . . . . . . . . . . . . . . . . . . . . . . . . . . . . . . . . . . . . . . . . . . . . . . . . . . . . . . . . . . . . . . . . . . . . . . . . 18
FIGURE 21. Domestic revenues dropped as share to GDP between 2007 and 2011 … .. . . . . . . . . . . . . . . . . . . . . . . . . . . . . . 18
FIGURE 22. … While decline in budget spending was less acute … .. . . . . . . . . . . . . . . . . . . . . . . . . . . . . . . . . . . . . . . . . . . . . . . . . . . . . . . . . . . . 18
FIGURE 23. Jordan is well positioned on the KEI compared to other MENA countries … .. . . . . . . . . . . . . . . . . . . . . . . . . . . 22
FIGURE 24. … But remains on a relatively weak position compared to upper middle income countries. . . . . 23
LIST OF TABLES
TABLE 1. Jordan: Selected Economic Indicators, 2009-15 . . . . . . . . . . . . . . . . . . . . . . . . . . . . . . . . . . . . . . . . . . . . . . . . . . . . . . . . . . . . . . . . . . . . . . . 28
TABLE 2. Jordan at a Glance.. . . . . . . . . . . . . . . . . . . . . . . . . . . . . . . . . . . . . . . . . . . . . . . . . . . . . . . . . . . . . . . . . . . . . . . . . . . . . . . . . . . . . . . . . . . . . . . . . . . . . . . . . . . . . . . . . . . . 29
JORDAN ECONOMIC MONITOR
TABLE OF CONTENTS
PREFACE .. . . . . . . . . . . . . . . . . . . . . . . . . . . . . . . . . . . . . . . . . . . . . . . . . . . . . . . . . . . . . . . . . . . . . . . . . . . . . . . . . . . . . . . . . . . . . . . . . . . . . . . . . . . . . . . . . . . . . . . . . . . . . . . . . . . . . . . . . . . . . . . . . . . . . . . 1
EXECUTIVE SUMMARY .. . . . . . . . . . . . . . . . . . . . . . . . . . . . . . . . . . . . . . . . . . . . . . . . . . . . . . . . . . . . . . . . . . . . . . . . . . . . . . . . . . . . . . . . . . . . . . . . . . . . . . . . . . . . . . . . . . . . . . . . . . . . . . . 4
…ò«ØæàdG ¢üî∏ªdG . . . . . . . . . . . . . . . . . . . . . . . . . . . . . . . . . . . . . . . . . . . . . . . . . . . . . . . . . . . . . . . . . . . . . . . . . . . . . . . . . . . . . . . . . . . . . . . . . . . . . . . . . . . . . . . . . . . . . . . . . . . . . . . . . . . . . . . . . . . . . 5
RECENT ECONOMIC AND POLICY DEVELOPMENTS .. . . . . . . . . . . . . . . . . . . . . . . . . . . . . . . . . . . . . . . . . . . . . . . . . . . . . . . . . . . . . . . . . . . . . . . . . . . 6
Output and Demand . . . . . . . . . . . . . . . . . . . . . . . . . . . . . . . . . . . . . . . . . . . . . . . . . . . . . . . . . . . . . . . . . . . . . . . . . . . . . . . . . . . . . . . . . . . . . . . . . . . . . . . . . . . . . . . . . . . . . . . . . . . . . . . . . . . . . . . 6
Employment and Poverty . . . . . . . . . . . . . . . . . . . . . . . . . . . . . . . . . . . . . . . . . . . . . . . . . . . . . . . . . . . . . . . . . . . . . . . . . . . . . . . . . . . . . . . . . . . . . . . . . . . . . . . . . . . . . . . . . . . . . . . . . . . . . . . . 7
External Position . . . . . . . . . . . . . . . . . . . . . . . . . . . . . . . . . . . . . . . . . . . . . . . . . . . . . . . . . . . . . . . . . . . . . . . . . . . . . . . . . . . . . . . . . . . . . . . . . . . . . . . . . . . . . . . . . . . . . . . . . . . . . . . . . . . . . . . . . . . . . 8
Monetary Policy and Finance . . . . . . . . . . . . . . . . . . . . . . . . . . . . . . . . . . . . . . . . . . . . . . . . . . . . . . . . . . . . . . . . . . . . . . . . . . . . . . . . . . . . . . . . . . . . . . . . . . . . . . . . . . . . . . . . . . . . . . . . . . 9
Fiscal Policy.. . . . . . . . . . . . . . . . . . . . . . . . . . . . . . . . . . . . . . . . . . . . . . . . . . . . . . . . . . . . . . . . . . . . . . . . . . . . . . . . . . . . . . . . . . . . . . . . . . . . . . . . . . . . . . . . . . . . . . . . . . . . . . . . . . . . . . . . . . . . . . . . . . 11
PROSPECTS .. . . . . . . . . . . . . . . . . . . . . . . . . . . . . . . . . . . . . . . . . . . . . . . . . . . . . . . . . . . . . . . . . . . . . . . . . . . . . . . . . . . . . . . . . . . . . . . . . . . . . . . . . . . . . . . . . . . . . . . . . . . . . . . . . . . . . . . . . . . . . . . . 13
SPECIAL FOCUS .. . . . . . . . . . . . . . . . . . . . . . . . . . . . . . . . . . . . . . . . . . . . . . . . . . . . . . . . . . . . . . . . . . . . . . . . . . . . . . . . . . . . . . . . . . . . . . . . . . . . . . . . . . . . . . . . . . . . . . . . . . . . . . . . . . . . . . . . 14
Impact of the Syrian Conflict on Jordan’s Economy .. . . . . . . . . . . . . . . . . . . . . . . . . . . . . . . . . . . . . . . . . . . . . . . . . . . . . . . . . . . . . . . . . . . . . . . . . . . . . . . . . . . . . 14
Options for Fiscal Adjustment and Consolidation in Jordan . . . . . . . . . . . . . . . . . . . . . . . . . . . . . . . . . . . . . . . . . . . . . . . . . . . . . . . . . . . . . . . . . . . . . . . . . . 17
Making the Transition to the Knowledge Economy: The Jordanian Case . . . . . . . . . . . . . . . . . . . . . . . . . . . . . . . . . . . . . . . . . . . . . . . . . . . . . . . 21
DATA APPENDIX . . . . . . . . . . . . . . . . . . . . . . . . . . . . . . . . . . . . . . . . . . . . . . . . . . . . . . . . . . . . . . . . . . . . . . . . . . . . . . . . . . . . . . . . . . . . . . . . . . . . . . . . . . . . . . . . . . . . . . . . . . . . . . . . . . . . . . . . 27
SELECTED RECENT WORLD BANK PUBLICATIONS ON JORDAN .. . . . . . . . . . . . . . . . . . . . . . . . . . . . . . . . . . . . . . . . . . . . . . . . . . . . . 32
LIST OF FIGURES
FIGURE 1. GDP per capita shrinked after the start of the Syrian Crisis in 2011 . . . . . . . . . . . . . . . . . . . . . . . . . . . . . . . . . . . . . . . . . . . 6
FIGURE 2. Jordan Growth Perforamnce in the Regional Context . . . . . . . . . . . . . . . . . . . . . . . . . . . . . . . . . . . . . . . . . . . . . . . . . . . . . . . . . . . . . . . . . 6
FIGURE 3. Private Demand and Government Spending largely supported growth . . . . . . . . . . . . . . . . . . . . . . . . . . . . . . . . . . . . . . 7
FIGURE 4. Services and Industry were the main drivers of growth . . . . . . . . . . . . . . . . . . . . . . . . . . . . . . . . . . . . . . . . . . . . . . . . . . . . . . . . . . . . . . 7
FIGURE 5. Slight Decrease in Unemployment in 2012 . . . . . . . . . . . . . . . . . . . . . . . . . . . . . . . . . . . . . . . . . . . . . . . . . . . . . . . . . . . . . . . . . . . . . . . . . . . . . . . . 7
FIGURE 6. Oil and Petroleum Products are the main drivers of Imported Goods . . . . . . . . . . . . . . . . . . . . . . . . . . . . . . . . . . . . . . . . 7
FIGURE 7. The Central Bank Net Reserves decreased during 2012 . . . . . . . . . . . . . . . . . . . . . . . . . . . . . . . . . . . . . . . . . . . . . . . . . . . . . . . . . . . . . . 8
FIGURE 8. Current Account Deficit widened in 2012 . . . . . . . . . . . . . . . . . . . . . . . . . . . . . . . . . . . . . . . . . . . . . . . . . . . . . . . . . . . . . . . . . . . . . . . . . . . . . . . . . . 8
FIGURE 9. Due to the widening of the current account, the Balance of Payment shrank in 2012 . . . . . . . . . . . . . . . . 9
FIGURE 10. Headline and Core Inflation Jumped in Q4 2012 . . . . . . . . . . . . . . . . . . . . . . . . . . . . . . . . . . . . . . . . . . . . . . . . . . . . . . . . . . . . . . . . . . . . . . . . 9
FIGURE 11. Despite improving in 2012, Central Government Deficit is still high . . . . . . . . . . . . . . . . . . . . . . . . . . . . . . . . . . . . . . . . 10
FIGURE 12. Dollarization Rate (M2) increased (Decreased) sharply in the Fall of 2012.. . . . . . . . . . . . . . . . . . . . . . . . . . . . . . 10
FIGURE 13. Starting 2008, Debt to GDP ratio has an upward trend . . . . . . . . . . . . . . . . . . . . . . . . . . . . . . . . . . . . . . . . . . . . . . . . . . . . . . . . . . . . 11
FIGURE 14. The share of Medium Long Term Debt is increasing.. . . . . . . . . . . . . . . . . . . . . . . . . . . . . . . . . . . . . . . . . . . . . . . . . . . . . . . . . . . . . . . . 11
FIGURE 15. The accelerating influx of Syrian refugees exceeded 400,000 by April 2013 . . . . . . . . . . . . . . . . . . . . . . . . . . . . . 15
THE WORLD BANK

¬àjƒ«M ≈∏Y ¿OQC’G »a …OÉ°üàb’G •É°ûædG ßaÉM . CG
∞©°V ≈d EG kÉ«FõL Oƒ©j ∂dPh ,2013 ájGóHh 2012 ΩÉ©dG »a
á«HÉéj E’G QÉKB’G ¢†©H ≈d EGh á«LQÉîdG QÉ©°S C’G äÉeó°U Qhôe
»a ƒªædG ∫ó©e ≠∏H ,2012 ΩÉ©dG »a .ÉjQƒ°S »a áeR C’G AG qôL
∑Ó¡à°S’G äÉ≤Øf â∏μ°T ó≤a ,Ö∏£dG á«MÉf øe .%2^6 ¿OQC’G ,ƒªæ∏d á«°SÉ°SC’G äÉcôëªdG ¢UÉîdGh ΩÉ©dG q»YÉ£b πÑb øe ájOhóëe ÖÑ°ùH ∂dPh ¬WÉ°ûf ≈∏Y ¢UÉîdG ´É£≤dG ßaÉM å«M ≈∏Y á«°SÉ°SC’G äÉeóîdG ∞«dÉμJ »a OÉëdG ´ÉØJQ’G ôjôªJ ø«jQƒ°ùdG ø«ÄLÓdG ∑Ó¡à°SEG IOÉjR ≈dEGh ,á¡L øe ø«μ∏¡à°ùªdG øe ƒªædG OÉØà°SG ó≤a ,êÉàfE’G á«MÉf øe ÉeCG .iôNCG á¡L øe ,á∏°üdG äGP äÉWÉ°ûædGh áMÉ«°ùdG ´É£b √ó¡°T …òdG ¢TÉ©àfE’G ¿Gó∏ÑdG øe ºg nQÉ°ùe ø««ª«∏bE’G ìÉ«°ùdG øe ójó©dG ∫ qƒM å«M »a ƒªædG ´QÉ°ùàj ¿CG ™bƒàªdG øeh .¿OQC’G ≈dEG kÉ«æeCG áHô£°†ªdG ¿EG .%3^3 áÑ°ùf ≠∏Ñ«d ,2013 ΩÉ©dG »a »dɪLE’G »∏ëªdG èJÉædG
.πØ°SC’G ƒëf π«ªj ,äÉ©bƒàdG Ö°ùëH ,ôWÉîªdG ¿Gõ«e
á«dɪdG ä’ÓàN’G áédÉ©e …Qhô°†dG øªd ¿ EG .Ü
»a ájõcôªdG áeƒμë∏d »dɪdG ™°VƒdÉa ,샰VƒH á«LQÉîdGh
»∏ëªdG èJÉædG øe %5 áÑ°ùf ôFÉ°ùîdG âbÉa ó≤d .≥fÉN m≥«°†e óLGƒàJ ºd »àdG á∏°†©ªdG ,á«æWƒdG AÉHô¡μdG ácô°T »a »dɪLE’G øe ójõªdG π«é°ùJ ≈dEG iOCG ɪe ,ïjQÉàdG Gòg ≈àM ∫ƒ∏ëdG É¡d øjódG áÑ°ùf â©ØJQG ,∂dòd áé«àfh .ΩÉ©dG ´É£≤dG »a õé©dG »a %80 ≈dEG 2011 ΩÉ©dG ájÉ¡f »a %71 øe »dɪLE’G ΩÉ©dG ™∏°ù∏d ᫪dÉ©dG QÉ©°SC’G »a ´ÉØJQ’G iOCG óbh .2012 ΩÉ©dG ájÉ¡f ≈dEG ábÉ£dG ó«dƒàd áØ∏μªdG OƒbƒdG äÉéàæe ΩGóîà°SGh á«°SÉ°SC’G ≠∏H …òdGh ,…QÉédG ÜÉ°ùëdG »a π°UÉëdG õé©dG »a mOÉM mQƒgóJ •É≤f 6 IOÉjõH …CG ,2012 »a »dɪLE’G »∏ëªdG èJÉædG øe %18 ,õé©dG »a ™jô°ùdG ójGõàdG Gò¡d áé«àfh .2011 ΩÉ©dG øe ájƒÄe ¥hóæ°U ™e á«WÉ«àME’G äÉÑ«JôàdG ¥É£f »a ¿OQC’G πNO ó≤a ≈dhC’G á©LGôªdG ä qóYCGh ,2012 ¢ù£°ùZCG/ÜBG »a »dhódG ó≤ædG áÑ°ùædÉH ÉeCG .2013 πjôHCG/¿É°ù«f »a á«WÉ«àME’G äÉÑ«Jôà∏d ,»dɪdG õé©dG áédÉ©e É¡fCÉ°T øe »àdG á°SÉ°ùëdG äÉMÓ°UEÓd
.AÉHô¡μdG ´É£≤H ≥∏©àj Ée »a ká°UÉNh ,¿B’G ≈àM Qô≤àJ º∏a
≈∏Y kÉ©°VGƒàe kGôK CG ájQƒ°ùdG áeR C’G â∏é°S ó≤d .ê
¿Éμa »YÉ£≤dG ô«K CÉàdG Ée CG ,ïjQÉàdG Gòg ≈àM »∏μdG OÉ°üàb’G
áMÉ«°ùdG πjƒëJh ø«jQƒ°ùdG ø«ÄLÓdG ≥aóJ ºgÉ°S ó≤d . kÉ qjOÉe
»a ƒªædG ºYOh »∏ëªdG Ö∏£dG õjõ©J »a ¿OQC’G ≈dEG ᫪«∏bE’G ´QÉ°ùàªdG ≥aóàdG øμd .á∏°üdG äGP äÉeóîdGh áMÉ«°ùdG ´É£b äÉeóîdG äɪjó≤J ≈∏Y kGô«Ñc kÉ£¨°V πμ°ûæ«jQƒ°ùdG ø«ÄL qÓ∏d ø«∏eÉ©dG ø««fOQC’G ≈∏Y ôKCGh ,áeÉ©dG á«dɪdG ∞©°VCG ɪe ,áeÉ©dG ôHÉ©ªdG ¥ÓZEG ¿CG ɪc .πª©dG ¥ƒ°S øe »ª°SôdG ô«Z ´É£≤dG »a äGQOÉ°üdG »a m¢VÉØîfG ≈dEG iOCG ób ÉjQƒ°S ™e ájOhóëdG ø«ÄLÓdG πÑb øe ójGõàªdG Ö∏£dG ÖÑ°ùH äGOQGƒdG »a m ÉØJQGh
.¿OQC’G »a …QÉéàdG ¿Gõ«ªdG ∞©°VCG ɪe ,ø«jQƒ°ùdG
iOCG äGOGôj E’G »a »∏μ«¡dGh º¶àæªdG ¢VÉØîf’G ¿ EG .O
¬LƒH Oƒª°üdG ≈∏Y ¿OQC’G IQóbh áeÉ©dG á«dɪdG ±É©°V EG ≈d EG
áÑ°ùæH äGOGôjE’G π«°üëJ ¢†ØîfG óbh .á«LQÉîdG äÉeó°üdG
ΩÉ©dG ≈dEG 2007 ΩÉ©dG øe »dɪLE’G »∏ëªdG èJÉædG øe %9^4 ,2012 ΩÉ©dG »a kGQGô≤à°SG äGOGôjE’G â∏é°S ø«M »ah .2011 äÉ≤ØædG »a Iô«ÑμdG IOÉjõdG øY ¢†jƒ©à∏d kÉ«aÉc ô«Z ∂dP ¿Éc á«Ñ∏àdh ,ábÉ£dG ´É£b »a ójGõàªdG õé©dG πjƒªàd âeóîà°SG »àdG ¢ùμY á«∏ªY ºgÉ°ùJ ±ƒ°Sh .¥ÉØfE’G õjõ©àd á«Ñ©°ûdG ÖdÉ£ªdG IóYÉ≤dG ™°SƒJ ô«HGóJ ôÑY ,äGOGôjE’G »a …QGóëf’G √ÉéJ’G ,»dɪdG õq«ëdG IOÉ©à°SG »a ,»Ñjô°†dG ΩɶædG Rõ©Jh á«Ñjô°†dG ,∫ÉãªdG π«Ñ°S ≈∏Y) áeÉ©dG äÉ≤ØædG »a äÉMÓ°UE’G ≈dEG káaÉ°VEG »a ºFGódG ´ÉØJQ’G ™bGh ¢ùμ©àd AÉHô¡μdG áeóN áaô©J πjó©J ´É£b ìÓ°UEGh ,ºYódG ±Gó¡à°SG ó«°TôJh ,ábÉ£dG ó«dƒJ áØ∏c »dɪdG §¨°†dG øe óëJ ¿CG á©jô°ùdG ô«HGóà∏d øμªjh .(√É«ªdG áeRQ º«ª°üJ øe ¿OQC’G ó«Øà°ùj ób ɪc .2013 ΩÉ©dG øe kAGóàHG »dɪdG ¬©°Vh õjõ©àd ¥ÉØfE’Gh äGOGôjE’G ∫Éée »a á«dÉe ô«HGóJ QÉ£NCÓd ká°VôY ôãcC’G ø«æWGƒªdG ájɪëdh ,»éjQóJ πμ°ûH
.á«YɪàL’Gh ájOÉ°üàb’G
∑Éægh ;᪫≤dG áaô©ªdG OÉ°üàb EG ¿OQC’G QƒW .`g
…ƒHôàdG ´É£≤dG ≥≤ëj »c äÉMÓ°U E’G øe ójõe ≈d EG áLÉM
Ωƒ≤jh .∞FÉXƒdG á«Yƒfh ᫪c á«MÉf øe ¬∏bG ¢ù«dh ,¬JÉfÉμeEG
áeRÓdG ájô°ûÑdG OQGƒªdG OGóYEG »ØfOQC’G »a …ƒHôàdG ΩɶædG ≈dEG áLÉëdG ≈≤ÑJ øμdh ,åjóëdG »aô©ªdG OÉ°üàb’G IQRGDƒªd ¥ƒ°S É¡Ñ∏£àj »àdG äGQÉ¡ªdÉH ÜÓ£dG ójhõàd äÉMÓ°UE’G ôÑà©àa AɪfE’Gh çƒëÑdG ∫Éée »a á«àëàdG ≈æÑdG ÉeCG .πª©dG , kÉ«Ñ°ùf á«dÉY áLQO ≈∏Y »ª∏©dG êÉàf’G ôÑà©jh ,¿OQC’G »a áÑ∏°U äÉLÉ«àM’ÉH kÉ≤«Kh kÉ£HQ äÉfÉμeE’G ∂∏J §HQ ºàj ºd øμdh É«LƒdƒæμJ ≈∏Y áªFÉ≤dG äÉYÉæ°üdG ¿EG .πª©dG ¥ƒ°ùd á«∏©ØdG õcGôeh ájQÉéàdG äÉ«∏ª©dG ó«¡©àc ,ä’É°üJ’Gh äÉeƒ∏©ªdG Iõ«e ¿OQC’G íæªJ »àdG ä’ÉéªdG øe kÉ°†jCG »g ,∫É°üJ’G ,™°SGh πμ°ûH ájõ«∏μfE’G á¨∏dG ΩGóîà°S’ áé«àf ∂dPh ,á«∏°VÉØJ øjôªãà°ùªdG ™e ¿OQC’G É¡H ™àªàj »àdG á«îjQÉàdG §HGhôdGh å«M ,á«ë°üdG áMÉ«°ùdG ƒ¡a ôNB’G óYGƒdG ´É£≤dG ÉeCG .ÖfÉLC’G , kÉØfBG OQh Ée ≈∏Y kAÉæHh .ô«Ñc πμ°ûH ¬«a Qɪãà°S’ÉH ¿OQC’G ΩÉb IOÉYEG »a ᪰SÉM IQhô°V πμ°ûJ á«JÉ°ù°SDƒªdG äÉMÓ°UE’G ¿EÉa É«LƒdƒæμàdG ´É£b ƒëf á«ÑæLC’Gh á«∏ëªdG äGQɪãà°S’G Öjƒ°üJ
.áØãμªdG äGQÉ¡ªdG äGP äÉYÉ£≤dGh
…ò«ØæàdG ¢üî∏ªdG
JORDAN ECONOMIC MONITOR
…ò«ØæàdG ¢üî∏ªdG | 5
i. Economic activity remained buoyant in 2012 and early 2013, in part due to weak pass-through of external price shocks and to resilient domestic demand. For 2012, growth reached 2.6 percent. On the demand side, key growth drivers were public and private consumption expenditures. The latter remained buoyant in part due to the limited pass trough of surging utilities input costs to consumers and to the added consumption of Syrian refugees. From the production side, growth was driven by a rebound in tourism and related activities which partly benefited from a shift in regional tourists away from security-impacted countries. While GDP growth is projected to rise to 3.3 percent in 2013, the balance of risks to the outlook is tilted to the downside.
ii. Mounting fiscal and external imbalances have yet to be clearly addressed. Central government finances are in dire straights. With 2012 losses in excess of 5 percent of GDP at the national electricity company unresolved, the broader public sector continued to register record deficits. As a result, gross public debt soared to 80 percent of GDP at end-2012, up from 71 percent of GDP at end-2011. Rising international commodity prices and the use of expensive fuel products for power generation have led to a sharp deterioration in the current account deficit, which reached 18 percent of GDP in 2012, up 6 percentage points from 2011. As a result of these rapidly rising deficits, Jordan entered into an IMF SBA in August 2012. A first SBA review took place in April 2013. Sensitive reforms to address the fiscal deficit have yet to be decided, especially in the electricity sector.
iii. The aggregate economic impact of Syria’s conflict has been modest to date though sectoral impacts have been material. Syrian refugee inflows and the rerouting of regional tourism towards Jordan contributed to boosting domestic demand and supporting the recovery of tourism and related services. The accelerating influx of Syrian refugees, however, significantly increased pressure on public service provision, worsened public finances, and is also expected to have impacted Jordanians working
in the informal labor market. A decline in exports following closure of Syrian transit routes, combined with rising imports due to Syrian refugee demand, also worsened Jordan’s trade balance.
iv. The steady and structural decline in revenues increased the vulnerability of Jordan’s public finances to exogenous shocks. Revenue collection shrank by 9.4 percent of GDP from 2007 to 2011. While revenue stabilized in 2012, these were not sufficient to offset the large increase in expenditures to finance widening power sector deficits and to meet popular demands for additional spending. Reversing the decline in revenues through base-broadening measures and strengthened enforcement of the tax regime would help restore fiscal space, as would reforms on the expenditure side (e.g., adjusting electricity tariffs to reflect the permanent increase in the input price for electricity generation, improved targeting of subsidies, reforming the water sector). Swift measures can relieve fiscal stress starting 2013. A package of revenue and spending measures can be designed to improve the overall progressivity of public finances, and protect less well-off citizens. v. Jordan has developed a valuable knowledge economy; further reforms are needed for the sector to fulfill its potential, not least in terms of quantity and quality of jobs. Jordan’s education system is forming the human resources needed for a modern knowledge economy but reforms are needed to equip students with the skills demanded in the market. The country’s R&D infrastructure is solid and its scientific production relatively high, but these capabilities are not closely linked to the needs of the economy. ICT-based industries such as business process outsourcing and call centers are also areas in which Jordan has a comparative advantage owing to the widespread use of English and a history of links with foreign investors. Another promising sector is health tourism, in which Jordan has already invested heavily: Building on the above, institutional reforms are crucial to re-direct domestic and foreign investments towards technology and skill intensive sectors.
EXECUTIVE SUMMARY
THE WORLD BANK
4 | Executive Summary
Employment and Poverty 3. A recovery in labor-intensive sectors helped employment expand and unemployment decline in 2012, with women performing comparatively better. Mirroring the improved economic activity, and in particular the stronger performance of labor intensive sectors associated with tourism, the unemployment rate decreased by 70 basis points to 12.2 percent in 2012 compared to 2011 (Figure 5). The improvement in women’s unemployment rate was more pronounced and declined by 140
basis points to 19.9 percent. Aside from strong employment growth, the improvement in women unemployment rate also, to a smaller extent, reflects a 50 basis points drop in their already low labor force participation rate, down to 14.2 percent. To further improve employment, the government has recently started designing an active labor market program: the “Jordan Job Compact” initiative. The Compact aims to assist unskilled, semi-skilled and skilled youths to find jobs. It combines trainings, better skills matches, stimulus packages to employers, and MSME finance in order to generate more and better jobs to Jordanians.
0
0.5
1
1.5
2
2.5
3
3.5
-20
-15
-10
-5
0
5
10
15
20
Q1 Q2 Q3 Q4 Q1 Q2 Q3 Q4
2011 2012
Demand Side Contribution to Real GDP Growth
Private Demand Government Spending Public Investment Net Exports Real GDP (rhs)
Percent Percent
FIGURE 3. Private Demand and Government Spending largely supported growth
Source: Ministry of Finance, World Bank Staff Calculations.
-2.0
-1.0
0.0
1.0
2.0
3.0
4.0
Q1 Q2 Q3 Q4 Q1 Q2 Q3 Q4 Q1 Q2 Q3 Q4
2010
2011
2012
Supply Side Contribution to Real GDP Growth
Net Taxes On Product Services Industry Agriculture Real GDP
Percent
FIGURE 4. Services and Industry were the main drivers of growth
Source: Department of Statstics, World Bank Staff Calculations.
0
5
10
15
20
25
30
Q1 Q2 Q3 Q4 Q1 Q2 Q3 Q4 Q1 Q2 Q3 Q4 Q1 Q2 Q3 Q4 Q1 Q2 Q3 Q4
2008 2009 2010 2011 2012
Unemployement Rate
Male Female Total
Percent
FIGURE 5. Slight Decrease in Unemployment in 2012
Source: Department of Statstics, World Bank Staff Calculations.
-30.0%
-20.0%
-10.0%
0.0%
10.0%
20.0%
30.0%
40.0%
50.0%
Q1 Q2 Q3 Q4 Q1 Q2 Q3 Q4 Q1 Q2 Q3 Q4 Q1 Q2 Q3 Q4 Q1 Q2 Q3 Q4
2008 2009 2010 2011 2012
Contribution to Growth of Imported Goods
Other Oil and Petroleum Derivatives
Food Goods Improted
FIGURE 6. Oil and Petroleum Products are the main drivers of Imported Goods
Source: Central Bank of Jordan, World Bank Staff Calculations.
JORDAN ECONOMIC MONITOR
Recent Economic and Policy Developments | 7
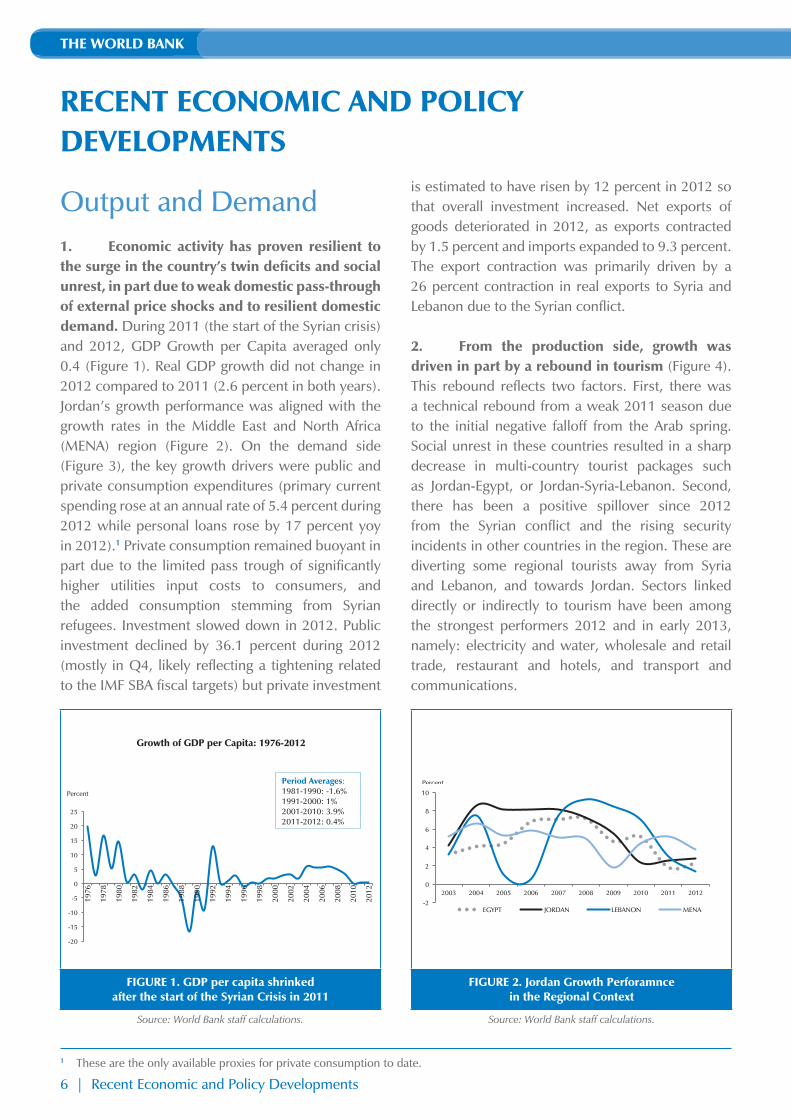
Output and Demand1. Economic activity has proven resilient to the surge in the country’s twin deficits and social unrest, in part due to weak domestic pass-through of external price shocks and to resilient domestic demand. During 2011 (the start of the Syrian crisis) and 2012, GDP Growth per Capita averaged only 0.4 (Figure 1). Real GDP growth did not change in 2012 compared to 2011 (2.6 percent in both years). Jordan’s growth performance was aligned with the growth rates in the Middle East and North Africa (MENA) region (Figure 2). On the demand side (Figure 3), the key growth drivers were public and private consumption expenditures (primary current spending rose at an annual rate of 5.4 percent during 2012 while personal loans rose by 17 percent yoy in 2012).1 Private consumption remained buoyant in part due to the limited pass trough of significantly higher utilities input costs to consumers, and the added consumption stemming from Syrian refugees. Investment slowed down in 2012. Public investment declined by 36.1 percent during 2012 (mostly in Q4, likely reflecting a tightening related to the IMF SBA fiscal targets) but private investment
is estimated to have risen by 12 percent in 2012 so that overall investment increased. Net exports of goods deteriorated in 2012, as exports contracted by 1.5 percent and imports expanded to 9.3 percent. The export contraction was primarily driven by a 26 percent contraction in real exports to Syria and Lebanon due to the Syrian conflict.
2. From the production side, growth was driven in part by a rebound in tourism (Figure 4). This rebound reflects two factors. First, there was a technical rebound from a weak 2011 season due to the initial negative falloff from the Arab spring. Social unrest in these countries resulted in a sharp decrease in multi-country tourist packages such as Jordan-Egypt, or Jordan-Syria-Lebanon. Second, there has been a positive spillover since 2012 from the Syrian conflict and the rising security incidents in other countries in the region. These are diverting some regional tourists away from Syria and Lebanon, and towards Jordan. Sectors linked directly or indirectly to tourism have been among the strongest performers 2012 and in early 2013, namely: electricity and water, wholesale and retail trade, restaurant and hotels, and transport and communications.
RECENT ECONOMIC AND POLICY DEVELOPMENTS
-20
-15
-10
-5
0
5
10
15
20
25
1976
1978
1980
1982
1984
1986
1988
1990
1992
1994
1996
1998
2000
2002
2004
2006
2008
2010
2012
Growth of GDP per Capita: 1976-2012
Percent
Period Averages: 1981-1990: -1.6% 1991-2000: 1% 2001-2010: 3.9% 2011-2012: 0.4%
FIGURE 1. GDP per capita shrinked after the start of the Syrian Crisis in 2011
Source: World Bank staff calculations.
-2
0
2
4
6
8
10
2003 2004 2005 2006 2007 2008 2009 2010 2011 2012
EGYPT JORDAN LEBANON MENA
Percent
FIGURE 2. Jordan Growth Perforamnce in the Regional Context
Source: World Bank staff calculations.
1 These are the only available proxies for private consumption to date.
THE WORLD BANK
6 | Recent Economic and Policy Developments

Employment and Poverty 3. A recovery in labor-intensive sectors helped employment expand and unemployment decline in 2012, with women performing comparatively better. Mirroring the improved economic activity, and in particular the stronger performance of labor intensive sectors associated with tourism, the unemployment rate decreased by 70 basis points to 12.2 percent in 2012 compared to 2011 (Figure 5). The improvement in women’s unemployment rate was more pronounced and declined by 140
basis points to 19.9 percent. Aside from strong employment growth, the improvement in women unemployment rate also, to a smaller extent, reflects a 50 basis points drop in their already low labor force participation rate, down to 14.2 percent. To further improve employment, the government has recently started designing an active labor market program: the “Jordan Job Compact” initiative. The Compact aims to assist unskilled, semi-skilled and skilled youths to find jobs. It combines trainings, better skills matches, stimulus packages to employers, and MSME finance in order to generate more and better jobs to Jordanians.
0
0.5
1
1.5
2
2.5
3
3.5
-20
-15
-10
-5
0
5
10
15
20
Q1 Q2 Q3 Q4 Q1 Q2 Q3 Q4
2011 2012
Demand Side Contribution to Real GDP Growth
Private Demand Government Spending Public Investment Net Exports Real GDP (rhs)
Percent Percent
FIGURE 3. Private Demand and Government Spending largely supported growth
Source: Ministry of Finance, World Bank Staff Calculations.
-2.0
-1.0
0.0
1.0
2.0
3.0
4.0
Q1 Q2 Q3 Q4 Q1 Q2 Q3 Q4 Q1 Q2 Q3 Q4
2010
2011
2012
Supply Side Contribution to Real GDP Growth
Net Taxes On Product Services Industry Agriculture Real GDP
Percent
FIGURE 4. Services and Industry were the main drivers of growth
Source: Department of Statstics, World Bank Staff Calculations.
0
5
10
15
20
25
30
Q1 Q2 Q3 Q4 Q1 Q2 Q3 Q4 Q1 Q2 Q3 Q4 Q1 Q2 Q3 Q4 Q1 Q2 Q3 Q4
2008 2009 2010 2011 2012
Unemployement Rate
Male Female Total
Percent
FIGURE 5. Slight Decrease in Unemployment in 2012
Source: Department of Statstics, World Bank Staff Calculations.
-30.0%
-20.0%
-10.0%
0.0%
10.0%
20.0%
30.0%
40.0%
50.0%
Q1 Q2 Q3 Q4 Q1 Q2 Q3 Q4 Q1 Q2 Q3 Q4 Q1 Q2 Q3 Q4 Q1 Q2 Q3 Q4
2008 2009 2010 2011 2012
Contribution to Growth of Imported Goods
Other Oil and Petroleum Derivatives
Food Goods Improted
FIGURE 6. Oil and Petroleum Products are the main drivers of Imported Goods
Source: Central Bank of Jordan, World Bank Staff Calculations.
JORDAN ECONOMIC MONITOR
Recent Economic and Policy Developments | 7
Output and Demand1. Economic activity has proven resilient to the surge in the country’s twin deficits and social unrest, in part due to weak domestic pass-through of external price shocks and to resilient domestic demand. During 2011 (the start of the Syrian crisis) and 2012, GDP Growth per Capita averaged only 0.4 (Figure 1). Real GDP growth did not change in 2012 compared to 2011 (2.6 percent in both years). Jordan’s growth performance was aligned with the growth rates in the Middle East and North Africa (MENA) region (Figure 2). On the demand side (Figure 3), the key growth drivers were public and private consumption expenditures (primary current spending rose at an annual rate of 5.4 percent during 2012 while personal loans rose by 17 percent yoy in 2012).1 Private consumption remained buoyant in part due to the limited pass trough of significantly higher utilities input costs to consumers, and the added consumption stemming from Syrian refugees. Investment slowed down in 2012. Public investment declined by 36.1 percent during 2012 (mostly in Q4, likely reflecting a tightening related to the IMF SBA fiscal targets) but private investment
is estimated to have risen by 12 percent in 2012 so that overall investment increased. Net exports of goods deteriorated in 2012, as exports contracted by 1.5 percent and imports expanded to 9.3 percent. The export contraction was primarily driven by a 26 percent contraction in real exports to Syria and Lebanon due to the Syrian conflict.
2. From the production side, growth was driven in part by a rebound in tourism (Figure 4). This rebound reflects two factors. First, there was a technical rebound from a weak 2011 season due to the initial negative falloff from the Arab spring. Social unrest in these countries resulted in a sharp decrease in multi-country tourist packages such as Jordan-Egypt, or Jordan-Syria-Lebanon. Second, there has been a positive spillover since 2012 from the Syrian conflict and the rising security incidents in other countries in the region. These are diverting some regional tourists away from Syria and Lebanon, and towards Jordan. Sectors linked directly or indirectly to tourism have been among the strongest performers 2012 and in early 2013, namely: electricity and water, wholesale and retail trade, restaurant and hotels, and transport and communications.
RECENT ECONOMIC AND POLICY DEVELOPMENTS
-20
-15
-10
-5
0
5
10
15
20
25
1976
1978
1980
1982
1984
1986
1988
1990
1992
1994
1996
1998
2000
2002
2004
2006
2008
2010
2012
Growth of GDP per Capita: 1976-2012
Percent
Period Averages: 1981-1990: -1.6% 1991-2000: 1% 2001-2010: 3.9% 2011-2012: 0.4%
FIGURE 1. GDP per capita shrinked after the start of the Syrian Crisis in 2011
Source: World Bank staff calculations.
-2
0
2
4
6
8
10
2003 2004 2005 2006 2007 2008 2009 2010 2011 2012
EGYPT JORDAN LEBANON MENA
Percent
FIGURE 2. Jordan Growth Perforamnce in the Regional Context
Source: World Bank staff calculations.
1 These are the only available proxies for private consumption to date.
THE WORLD BANK
6 | Recent Economic and Policy Developments

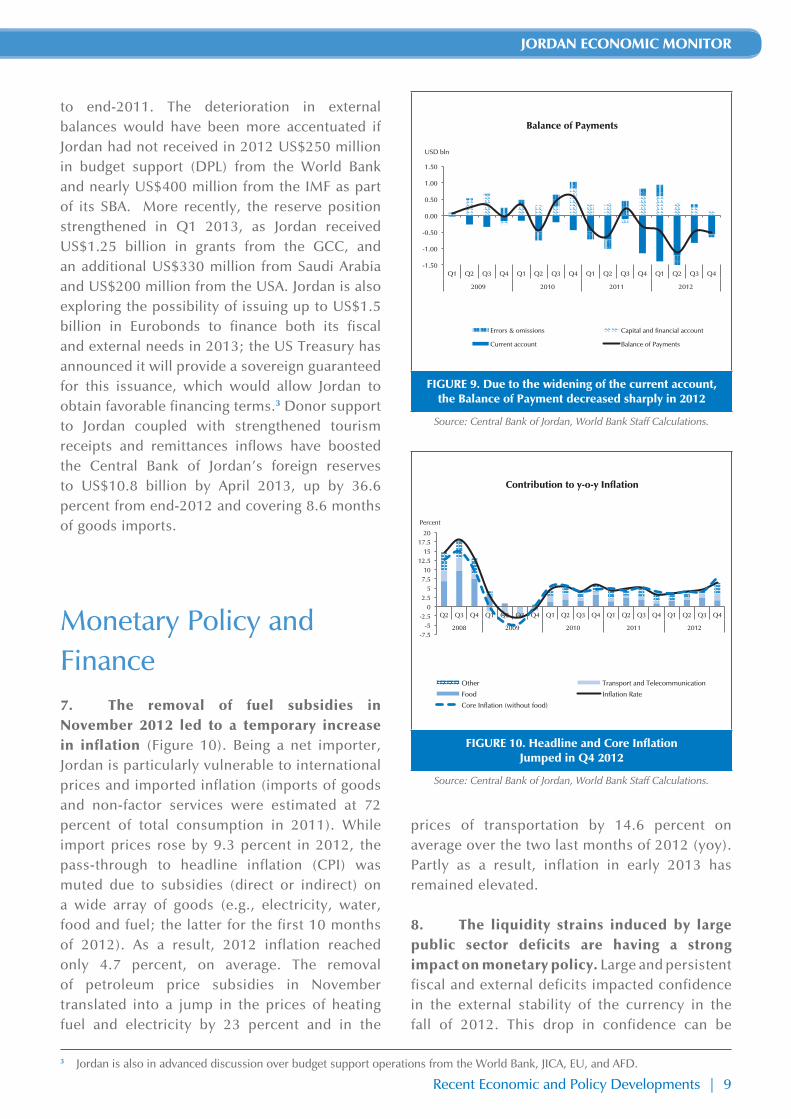
to end-2011. The deterioration in external balances would have been more accentuated if Jordan had not received in 2012 US$250 million in budget support (DPL) from the World Bank and nearly US$400 million from the IMF as part of its SBA. More recently, the reserve position strengthened in Q1 2013, as Jordan received US$1.25 billion in grants from the GCC, and an additional US$330 million from Saudi Arabia and US$200 million from the USA. Jordan is also exploring the possibility of issuing up to US$1.5 billion in Eurobonds to finance both its fiscal and external needs in 2013; the US Treasury has announced it will provide a sovereign guaranteed for this issuance, which would allow Jordan to obtain favorable financing terms.3 Donor support to Jordan coupled with strengthened tourism receipts and remittances inflows have boosted the Central Bank of Jordan’s foreign reserves to US$10.8 billion by April 2013, up by 36.6 percent from end-2012 and covering 8.6 months of goods imports.
Monetary Policy and Finance7. The removal of fuel subsidies in November 2012 led to a temporary increase in inflation (Figure 10). Being a net importer, Jordan is particularly vulnerable to international prices and imported inflation (imports of goods and non-factor services were estimated at 72 percent of total consumption in 2011). While import prices rose by 9.3 percent in 2012, the pass-through to headline inflation (CPI) was muted due to subsidies (direct or indirect) on a wide array of goods (e.g., electricity, water, food and fuel; the latter for the first 10 months of 2012). As a result, 2012 inflation reached only 4.7 percent, on average. The removal of petroleum price subsidies in November translated into a jump in the prices of heating fuel and electricity by 23 percent and in the
prices of transportation by 14.6 percent on average over the two last months of 2012 (yoy). Partly as a result, inflation in early 2013 has remained elevated.
8. The liquidity strains induced by large public sector deficits are having a strong impact on monetary policy. Large and persistent fiscal and external deficits impacted confidence in the external stability of the currency in the fall of 2012. This drop in confidence can be
3 Jordan is also in advanced discussion over budget support operations from the World Bank, JICA, EU, and AFD.
-1.50
-1.00
-0.50
0.00
0.50
1.00
1.50
Q1 Q2 Q3 Q4 Q1 Q2 Q3 Q4 Q1 Q2 Q3 Q4 Q1 Q2 Q3 Q4
2009 2010 2011 2012
Balance of Payments
Errors & omissions Capital and financial account
Current account Balance of Payments
USD bln
FIGURE 9. Due to the widening of the current account, the Balance of Payment decreased sharply in 2012
Source: Central Bank of Jordan, World Bank Staff Calculations.
-7.5 -5
-2.5 0
2.5 5
7.5 10
12.5 15
17.5 20
Q2 Q3 Q4 Q1 Q2 Q3 Q4 Q1 Q2 Q3 Q4 Q1 Q2 Q3 Q4 Q1 Q2 Q3 Q4
2008 2009 2010 2011 2012
Contribution to y-o-y Inflation
Other Transport and Telecommunication
Food Inflation Rate
Core Inflation (without food)
Percent
FIGURE 10. Headline and Core Inflation Jumped in Q4 2012
Source: Central Bank of Jordan, World Bank Staff Calculations.
JORDAN ECONOMIC MONITOR
Recent Economic and Policy Developments | 9
4. While poverty declined during 2002-2010, regional disparities remained and inequality has been on the rise again following the global crisis of 2008. The welfare gap declined in general in Jordan during 2002-2010. During that period, the share of poor households declined from 32 percent to 14.9 percent and the poverty gap contracted from 8.4 percent to 2.9 percent, indicating that most of the poor are near the poverty line. However, some disparities
remained among regions and the Gini coefficient declined in all regions, except in Amman. Access to public sector employment—both military and civilian—has been one of the main sources of poverty alleviation. Hence, the reduction in fiscal space is likely to have an adverse welfare impact. Moreover, following the 2008 crisis, growth has slowed down and inequalities increased as consumption of the richest 5 percent of households grew at faster rates than for the middle class and the poor. These observations raise the question of the inclusiveness and sustainability of the growth model in Jordan.2
External Position5. Rising international commodity prices and the use of expensive fuel products for power generation have led to a sharp deterioration in the balance of payments. Imports of goods increased by 9.3 percent (JD1.3 billion) in 2012. Around 67 percent of the overall increase is related to a 21 percent rise in the imports of crude oil and petroleum products (Figure 6). The increase by 11 percent in the imports of food items has represented 18 percent of the rise in the overall import bill. In parallel to the rise in imports, net inflow of services exports, income transfers, remittances, and capital inflows declined by 9.0 percent (JD633 million). As a result, the current account deficit widened drastically, from 12.0 percent of GDP in 2011 to 17.9 percent of GDP in 2012 (Figure 8). Excluding foreign grants, the current account deficit reached 19.0 percent of GDP in 2011 and has expanded to 22.9 percent in 2012.
6. The worsening balance of payment is took its toll on net international reserves (NIR) in 2012 while donor financing helped NIR to recover in early 2013 (Figure 7). Net foreign assets (NFA) of the banking sector declined by 29 percent or US$3.8 billion in 2012, compared
2 For more details see Mansour, Wael (2012), “The Patterns and Determinants of Household Welfare Growth in Jordan 2002–2010”, Policy Research Working Paper No 6249, World Bank, October.
3 4 5 6 7 8 9 10 11
4
5 6 7 8 9
10 11 12 13 14
Central Bank Net Reserves
Central Bank Net Reserves Months of Imports covered by CBJ net Reserves
USD Billion Months
FIGURE 7. The Central Bank Net Reserves decreased during 2012
Source: Central Bank of Jordan, World Bank Staff Calculations.
-35
-25
-15
-5
5
15
25
Q1 Q2 Q3 Q4 Q1 Q2 Q3 Q4 Q1 Q2 Q3 Q4 Q1 Q2 Q3 Q4
2009 2010 2011 2012
Composition of Balance of Payements (% of GDP)
Errors & omissions Capital and financial account Current account Balance of Payments
Percent
FIGURE 8 Current Account Deficit widened in 2012
Source: Central Bank of Jordan, World Bank Staff Calculations.
THE WORLD BANK
8 | Recent Economic and Policy Developments

Fiscal Policy10. Notwithstanding some improvement in 2012, public finances remain in dire straights, with high deficits persisting for the second consecutive year, and poor fiscal performance in early 2013 (Figure 11). After peaking at 12.7 percent of GDP in 2011, the central government’s overall fiscal deficit (excluding grants) shrank to 9.7 percent of GDP in 2012. Enhanced revenue mobilization accounts for one third of the fiscal consolidation effort, while reduction in expenditures account for the remaining two-thirds. The former primarily reflects the removal of tax exemptions on real estate transactions, the cancellation of several exemptions on sales tax, and a boost in revenues from the mining sector. The latter stems from tight spending control on goods and services, capital spending, and military spending. The fiscal impact of the removal of fuel subsidy and their replacement with cash transfers; effective since mid-November 2012; will materialize fully in 2013. These measures are expected to have a net impact of 1 percentage point of GDP in terms of fiscal savings
in 2013. The end-2012 central government deficit target endorsed by the IMF as part of the August 2012 Stand-by-Arrangement was slightly exceeded. The fiscal situation continued to deterioate in Q1 2013 with the deficit (excluding grants) widening by 113 percent (yoy) as public spending rose by 14.5 percent (yoy) and domestic revenues dropped by 2.2 percent (yoy). As a result, gross public debt increased by 1.8 percent and reached US$25.3 billion (81.6 percent of GDP).6
11. A power sector financial losses remain unresolved, the broader public sector continued to register record deficits. Taken together, the overall deficit of the central government budget and own budget agencies, such as water and electricity utilities, reached 18.7 percent of GDP in 2011 and is estimated to have remained elevated, at 16.4 percent of GDP in 2012. Aside from the central government, the main contributor to these deficits is National Electric Power Company (NEPCO). While the company was broadly in financial equilibrium prior to the sharp cutback in gas supplies from Egypt, it generated losses of about 5 percent of
6 US$297 million in foreign grants received in Q1 2013 have prevented a further deterioration of the public debt. The fiscal performance highlights the large dependency of Jordan on foreign aid and donor support and raises issues related to moral hazard and pro-cyclical fiscal policies adopted. A thorough discussion of these issues can be found in World Bank (2012),“Jordan Development Policy Review: Improving Institutions, fiscal policies and structural reforms for greater growth resilience and sustained job creation”, Report number 70706, Washington DC.
156
126 105
92
60 80
0 25 50 75
100 125 150 175 200 225 250
199
199
199
199
199
199
199
199
199
199
200
200
200
200
200
200
200
200
200
200
201
201
201
Jordan Debt to GDP Ratio(1990-2012)
Percent
FIGURE 13. Starting 2008, Debt to GDP ratio has an upward trend
Source: Ministry of Finance, and World Bank Staff Calculations.
0
5
10
15
20
25
30
Q1 Q2 Q3 Q4 Q1 Q2 Q3 Q4 Q1 Q2 Q3 Q4 Q1 Q2 Q3 Q4
2009 2010 2011 2012
Composition of Public Debt
Long-Term Medium Term Short-Term Total Debt
USD Billion
FIGURE 14. The share of Medium Long Term Debt is increasing
Source: Ministry of Finance, and World Bank Staff Calculations.
JORDAN ECONOMIC MONITOR
Recent Economic and Policy Developments | 11
captured in the rapid increase in the deposit dollarization rate that started in the fall, and to a contraction in broad money (Figure 12). This led the Central Bank of Jordan to increase its overnight rate (by 75 bps to 4.00 percent) in December 2012. The CBJ had already increased its policy rate by 50 bps in February 2012 and by another 50 bps to 3.25 percent in May 2012. The stress on liquidity has translated into a large increase (240 bps) in the yield on twelve months treasury bills to 6.18 percent in December 2012 compared to December 2011. Rates for the private sector also rose.4 The trend started reversing in December 2012/January 2013 as confidence was boosted by the CBJ’s tightening and the international community’s support through large foreign grants and concessional budget support operations. Improved tourism receipt5 and remittances inflows also supported this turn in confidence. As a result, for the first four months of 2013, liquidity and credit facilities to the private sector grew by 3.4 and 6.5 percent yoy, respectively, while dollarization rate dropped to 22.3 percent in April 2013, from 24.8 percent in end 2012.
9. Banks’ deposit growth in 2012 fell significantly short of the public sector’s large financing needs, requiring the CBJ to buy sovereign paper and leading to a drop in foreign reserves. Banks’ deposits increased by 1.1 percent (JD306) million in 2012, compared to a 7.2 percent increase in 2011 (JD1.8 billion). In parallel, net claims on the budget rose by JD1.4 billion and net claims on own budget agencies rose by JD1.3 billion. Hence, the increase in bank deposits could not provide enough resources to match the financial needs of the public sector. The resource gap was filled by (1) an increase in CBJ’s portfolio of government debt by JD829 million; (2) an increase in “Unclassified Assets” in CBJ balance-sheet by JD651 million in 2012; and (3) mobilizing free reserves which translated into a decline in banks’ deposits in Jordanian Dinars with the CBJ by JD1.7 billion. Beyond financing the public sector, the additional resources freed helped finance an increase by 6.8 percent (JD1 billion) in lending to the resident private sector, of which 60 percent went to the industrial and construction sectors. All this, however, was accomplished at the cost of a notable drop in foreign reserves.
4 From December 2011 to December 2012, interbank rates rose 139 bps to 4.31 percent, average interest rates on time deposits rose 73 bps to 4.19 percent, while the lending rate to prime customers rose 46 bps to 8.68 percent.
5 Benefiting from regional turmoil, the tourism sector has been a key driver of growth in the Kingdom so far in 2013, enhancing income receipt by 7.8 percent in the first 4 months of the year (yoy).
12
14
16
18
20
22
24
26
28
25
27
29
31
33
35
37
Monetary Indicators
M2 Dollarization
(rhs)
USD Billion Percentage
FIGURE 12. Dollarization Rate (M2) increased (Decreased) sharply in the Fall of 2012
Source: Central Bank of Jordan, World Bank Staff Calculations.
-1.4 -1.2 -1.0 -0.8 -0.6 -0.4 -0.2 0.0 0.2 0.4 0.6
0.0
0.5
1.0
1.5
2.0
2.5
3.0
3.5
4.0
Q1 Q2 Q3 Q4 Q1 Q2 Q3 Q4 Q1 Q2 Q3 Q4 Q1 Q2 Q3 Q4
2009 2010 2011 2012
Fiscal Deficit (Excluding Grants)
Total expenditures Total Domestic revenue
Budget Deficit Primary Balance (rhs)
USD Billion USD Billion
FIGURE 11. Despite improving in 2012, Central Government Deficit is still high
Source: Ministry of Finance, World Bank Staff Calculations.
THE WORLD BANK
10 | Recent Economic and Policy Developments

13. Economic activity is projected to accelerate modestly in 2013. Real GDP growth is projected to reach 3.3 percent in 2013, and to further expand to 3.5 percent in 2014. Assuming that the fiscal consolidation efforts included in the IMF SBA are implemented in a timely manner, confidence is expected to improve and the crowding out effect of the public sector to diminish. The strong public investment program supported by the GCC will also help support growth. The negative impact on GDP from fiscal consolidation is estimated to be limited by the improved mix of fiscal cuts. Private consumption is projected to accelerate, in part due to the growing demand stemming from Syrian refugees. Private investment would also improve.
14. The situation of the Balance of Payments is likely to improve, thanks to large grants. Grants are expected to reach 4 percent of GDP in 2013, up from 1.5 percent in 2012, which would positively affect the current account deficit (CAD). Also, CAD would narrow further if imports of gas from Egypt reach 100 million cubic feet as projected compared with less than 50 million cubic feet in 2012. In addition, stable or slightly decreasing global food and fuel prices and recovery in the exports of potash and phosphate would have a positive impact on the CAD. All in all, provided that all the above materializes, CAD (including grants) would improve to 10 percent of GDP in 2013 from 18 percent of GDP in 2012. Hence, a sustained and reliable containment of the CAD relies largely on measures to compress aggregate demand through enhanced fiscal consolidation. On the longer term, reaching a CAD of 4 to 5 percent relies on recovering the competitiveness of Jordanian exports and on accelerating the construction of the LNG facility expected to become operational in mid-2015.
15. The balance of risks to the outlook is tilted to the downside. Key among these risks is the one surrounding the implementation of the fiscal consolidation program agreed with the IMF. Given the rapidly escalating public debt dynamics, reducing the large overall deficit of the non-financial public sector is critical to maintaining macroeconomic
stability and growth. Tackling meaningfully the public sector deficit requires addressing the sources of NEPCO’s losses and moving further on improving the revenues trend. A proposed electricity tariff increase would credibly and meaningfully address an important source of NEPCO’s deficit; protecting or mitigating the impact of such an overall increase on poor and vulnerable Jordanians would be desirable. Another key downside risk is a worsening of the negative spillovers from the Syrian conflict (for the current impact of the Syrian conflict on Jordan’s economy, see Special Focus #1, page 9). An upside risk to the GDP growth forecast would be a higher than expected supply of Egyptian gas. This would alleviate pressure on both the external and fiscal balances, and reduce the size of any increase in electricity tariff.
PROSPECTS
JORDAN ECONOMIC MONITOR
Prospects | 13
GDP in both 2011 and 2012. These were first and foremost the result of a policy decision not to pass onto final consumers the large increase in input prices that NEPCO faced when it had to replace Egyptian gas with diesel and heavy fuel to generate its electricity. Losses from this switch can be decomposed into: (1) the loss of a cheap input supply, as Egyptian gas was contracted at prices significantly below current market prices; (2) the need to buy fuel at a time when international oil prices were elevated, (3) the creation of large inefficiencies in electricity generation due to the need to produce electricity with fuel but while using power plants designed to use gas. The government committed in its IMF SBA to adopt an action plan to return NEPCO to financial equilibrium by 2017. Increasing electricity tariffs are likely part of any medium-term plan for NEPCO as current tariffs are significantly below cost recovery. However, this decision has been delayed repeatedly.
12. As a result, gross public debt and gross financing needs are rising rapidly (Figure 14). Public debt increased by 21.6 percent (JD3.1 billion) between 2011 and 2012 and it has reached 80.2 percent of GDP at 2012 against 70.7 percent of GDP in 2011 (Figure 14). In Jordan, public debt also includes government guaranteed debt (valued at 100 percent of the principal guaranteed). The increase in the debt-to-GDP ratio is about equally divided between the financing needs of the budget and sovereign guarantees provided by the government to loans and bonds issued by own budget agencies. Most of these guarantees were provided to NEPCO. The gross financing needs of the public sector are estimated to have risen by over 10 percentage points of GDP between 2011 and 2012, to about 45 percent of GDP. These large and rapidly expanding needs increase rollover risks materially.
THE WORLD BANK
12 | Recent Economic and Policy Developments
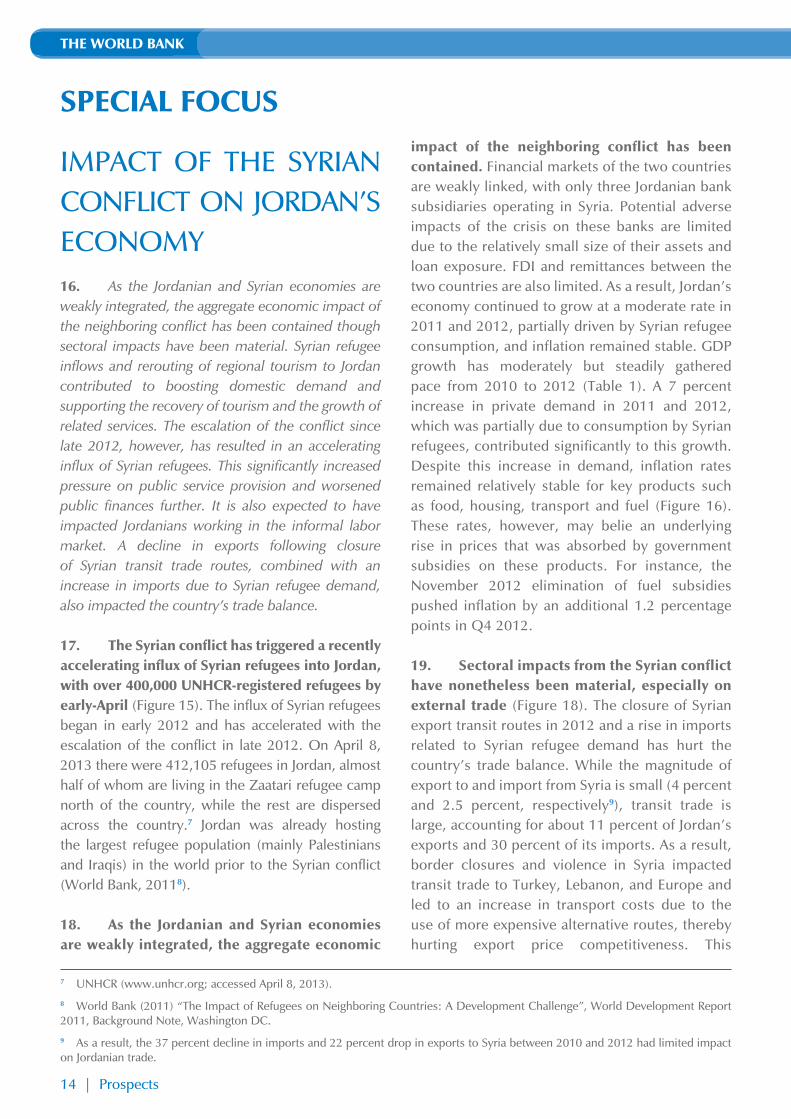
disruption contributed to the decline in export growth from 13 percent in 2011 to -1 percent in 2012. It also adversely impacted agricultural exports and in turn the agricultural sector which contracted by 9 percent in 2012. On the other hand, partly due to the large influx of Syrian refugees, Jordan’s imports have risen substantially since the beginning of the crisis, growing by 22 percent in 2011 and 9 percent in 2012. For example, imports of food increased by 23 percent in 2011 and 11 percent in 2012, and imports of oil and petroleum products shot up by 61 percent and 21 percent in 2011 and 2012, respectively (though the primary driver for this surge in petroleum imports is the disruption in gas supplies from Egypt needed for electricity generation).
20. Public finances have also been negatively impacted by the conflict and the associated surge in refugees to Jordan. The Jordanian government is incurring fiscal costs so as to provide public services to the large and rapidly growing population of Syrian refugees. This cost is adding pressures to an already difficult fiscal stance. As the inflow of Syrian refugees persists and accelerates, the fiscal costs associated with the provision of public services to these refugees could grow significantly. The authorities expect the key fiscal costs in 2013 to relate to the
financing of product subsidies (34 percent), energy and health services (34 percent), security (9 percent) and education (4 percent).
21. While unemployment rates marginally declined in 2012, the Syrian refugee inflow has likely negatively affected employment opportunities in the informal sector. The unemployment rate declined slightly from 12.9 percent in 2011 to 12.2 percent in 2012, reversing the 0.4 percentage point increase of 2011, and the inactivity rate among working age Jordanians edged up. Despite the difficulty in discerning the impact of the refugee inflow on labor market outcomes, it is unlikely that Jordanians will face labor market competition in the public sector or the formal private sector, both of which are difficult for Syrian refugees to access for legal reasons. On the other hand, Jordanians employed in the informal sector10 are likely facing competition from Syrian refugees. As the informal sector is estimated to account for a sizable 44 percent of the employed (Gatti et al., 201111), the labor market impact could be sizeable. A large impact is also expected on non-Syrian immigrant foreign workers (e.g., the large pool of Egyptians workers) as they are likely to be more directly in competition with Syrian refugees for informal sector jobs.
0
50
100
150
200
250
300
350
400
Q1 2012 Q2 2012 Q3 2012 Q4 2012 Q1 2013 Q2 2013
* An additional 63,364 Syrian refugees are awaiting registration by UNHCR, bringing the total number to 412,105
Thousands
Total Registered Syrian Refugees in Jordan*
FIGURE 15. The accelerating influx of Syrian refugees exceeded 400,000 by April 2013
Source: UNHCR.
0
1
2
3
4
5
6
7
8
9
Q1 Q2 Q3 Q4 Q1 Q2 Q3 Q4 Q1 Q2 Q3 Q4
2010 2011 2012
Contribution to y-o-y Inflation
Fuel and Electric Housing, excluding Fuel and Electric Other Transport and Telecommunication Food Inflation Rate Core Inflation
Percent
FIGURE 16. Inflation has remained stable since the Syrian crisis began
Source: CBJ, World Bank calculations.
10 An informal worker here is defined as one who does not contribute to social security.
11 Roberta Gatti, Diego Angel-Urdinola, Joana Silva, and Andras Bodor (2011) Striving for Better Jobs: The Challenge of Informality in the Middle East and North Africa, World Bank, Washington DC.
JORDAN ECONOMIC MONITOR
Special Focus | 15
IMPACT OF THE SYRIANCONFLICT ON JORDAN’SECONOMY16. As the Jordanian and Syrian economies are weakly integrated, the aggregate economic impact of the neighboring conflict has been contained though sectoral impacts have been material. Syrian refugee inflows and rerouting of regional tourism to Jordan contributed to boosting domestic demand and supporting the recovery of tourism and the growth of related services. The escalation of the conflict since late 2012, however, has resulted in an accelerating influx of Syrian refugees. This significantly increased pressure on public service provision and worsened public finances further. It is also expected to have impacted Jordanians working in the informal labor market. A decline in exports following closure of Syrian transit trade routes, combined with an increase in imports due to Syrian refugee demand, also impacted the country’s trade balance.
17. The Syrian conflict has triggered a recently accelerating influx of Syrian refugees into Jordan, with over 400,000 UNHCR-registered refugees by early-April (Figure 15). The influx of Syrian refugees began in early 2012 and has accelerated with the escalation of the conflict in late 2012. On April 8, 2013 there were 412,105 refugees in Jordan, almost half of whom are living in the Zaatari refugee camp north of the country, while the rest are dispersed across the country.7 Jordan was already hosting the largest refugee population (mainly Palestinians and Iraqis) in the world prior to the Syrian conflict (World Bank, 20118).
18. As the Jordanian and Syrian economies are weakly integrated, the aggregate economic
impact of the neighboring conflict has been contained. Financial markets of the two countries are weakly linked, with only three Jordanian bank subsidiaries operating in Syria. Potential adverse impacts of the crisis on these banks are limited due to the relatively small size of their assets and loan exposure. FDI and remittances between the two countries are also limited. As a result, Jordan’s economy continued to grow at a moderate rate in 2011 and 2012, partially driven by Syrian refugee consumption, and inflation remained stable. GDP growth has moderately but steadily gathered pace from 2010 to 2012 (Table 1). A 7 percent increase in private demand in 2011 and 2012, which was partially due to consumption by Syrian refugees, contributed significantly to this growth. Despite this increase in demand, inflation rates remained relatively stable for key products such as food, housing, transport and fuel (Figure 16). These rates, however, may belie an underlying rise in prices that was absorbed by government subsidies on these products. For instance, the November 2012 elimination of fuel subsidies pushed inflation by an additional 1.2 percentage points in Q4 2012.
19. Sectoral impacts from the Syrian conflict have nonetheless been material, especially on external trade (Figure 18). The closure of Syrian export transit routes in 2012 and a rise in imports related to Syrian refugee demand has hurt the country’s trade balance. While the magnitude of export to and import from Syria is small (4 percent and 2.5 percent, respectively9), transit trade is large, accounting for about 11 percent of Jordan’s exports and 30 percent of its imports. As a result, border closures and violence in Syria impacted transit trade to Turkey, Lebanon, and Europe and led to an increase in transport costs due to the use of more expensive alternative routes, thereby hurting export price competitiveness. This
SPECIAL FOCUS
7 UNHCR (www.unhcr.org; accessed April 8, 2013).
8 World Bank (2011) “The Impact of Refugees on Neighboring Countries: A Development Challenge”, World Development Report 2011, Background Note, Washington DC.
9 As a result, the 37 percent decline in imports and 22 percent drop in exports to Syria between 2010 and 2012 had limited impact on Jordanian trade.
THE WORLD BANK
14 | Prospects
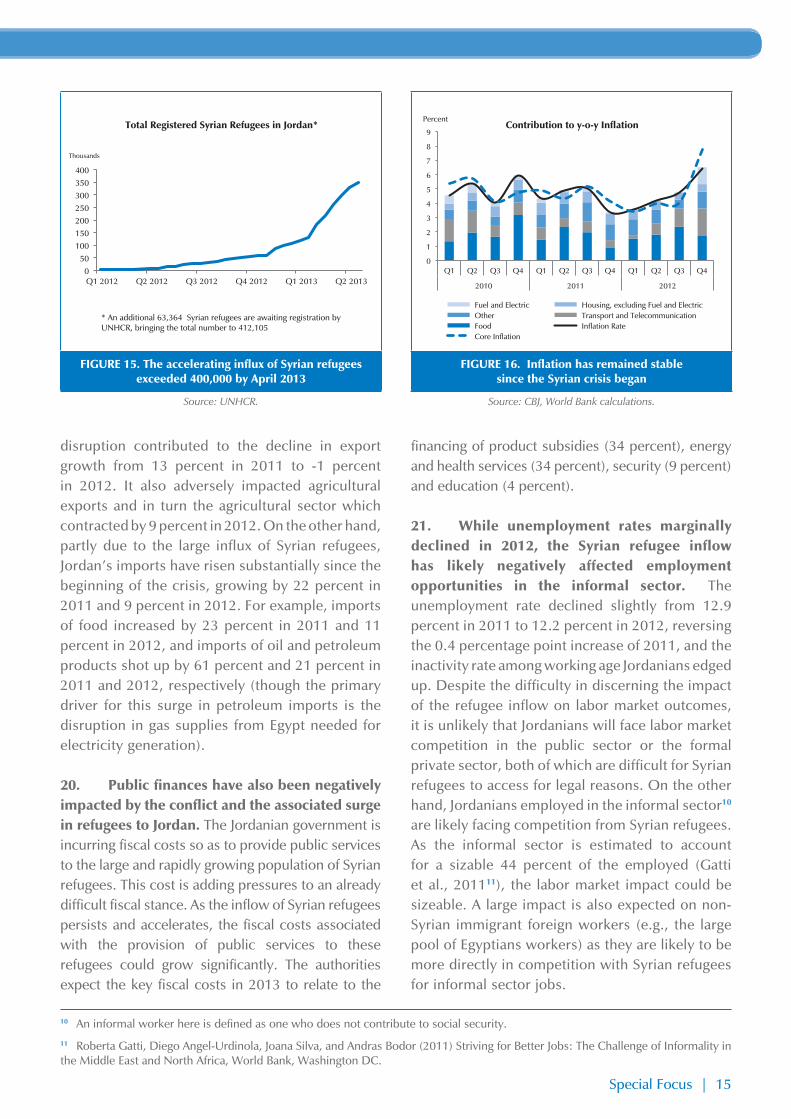
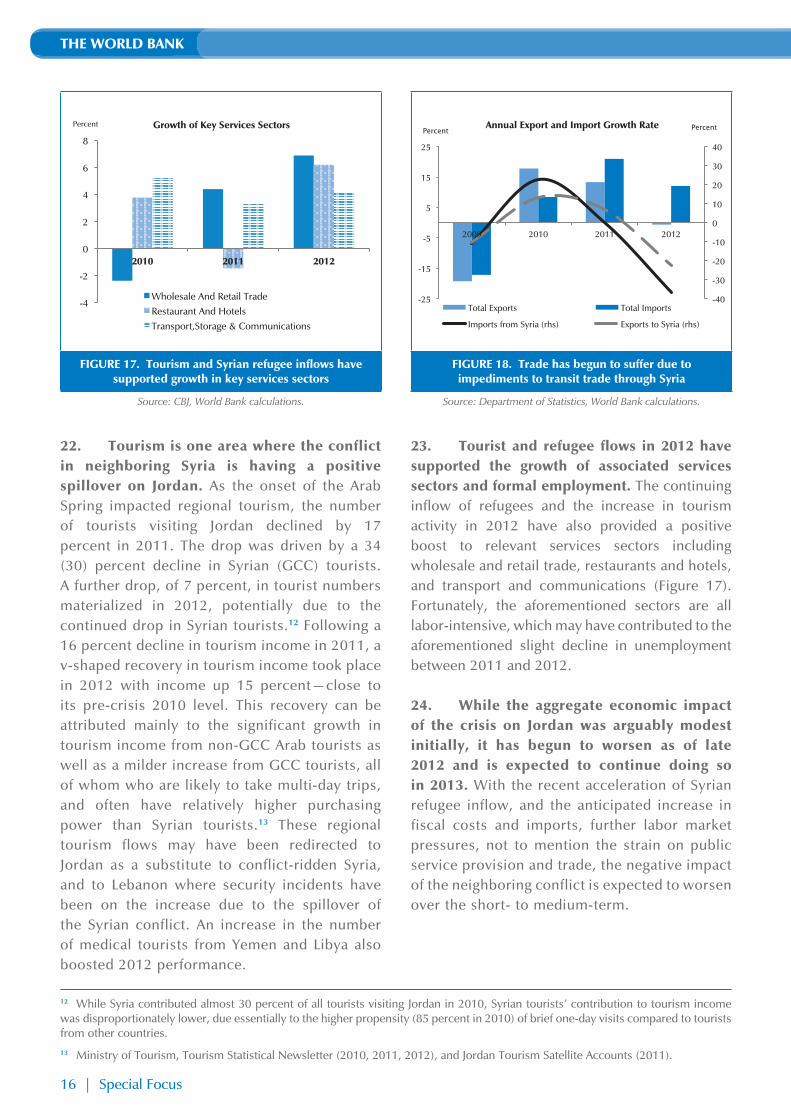
OPTIONS FOR FISCAL ADJUSTMENT AND CONSOLIDATION IN JORDAN14
25. The steady and structural decline in revenues that started in 2007 shrank fiscal space and increased the vulnerability of Jordan’s public finances to exogenous shocks. The sharp rise in spending that started in 2011—in part related to the disruption of Egyptian gas supply, and to meet popular demands for additional spending and subsidies—resulted in a significant and unsustainable worsening of public finances. Options to address this situation include both revenue and expenditure measures. The former comprise broadening the tax base and ensuring equal enforcement of existing tax laws. The latter consist of improved efficiency in current and capital spending, adjustments to the electricity tariffs to reflect the permanent increase in input prices, a better targeting of consumer subsidies, and water sector reforms. If well balanced and calibrated, revenue and spending measures can be progressive, which would enhance their acceptance.
26. Fiscal policy in Jordan has been mostly pro-cyclical which has added to macroeconomic volatility and, at times, instability (Figure 19). For instance, while GDP growth averaged 8.1 percent in 2004-2008, the primary fiscal deficit excluding grants stood at 6.6 percent of GDP and the overall deficit excluding grants averaged 9.3 percent. Because Jordan‘s capital account is open and the country is exposed to shocks, prudent macroeconomic management is crucial to reduce volatility.
27. The recent deterioration in Jordan’s public finances is not sustainable. Preliminary figures for 2012 set the budget deficit at 9.7 percent of GDP, and the overall public sector deficit at 16.4 percent of GDP. The latter includes the National Electricity Production Company’s (NEPCO’s) deficit
of 5.6 percent of GDP. NEPCO’s deficit is related to the collapse in supply of Egyptian gas, the ensuing rise in the costs of electricity generation, and the policy decision not to materially increase end-user electricity tariffs despite the large and permanent increase in the cost of back-up fuels. Hence, in 2011 NEPCO’s selling tariff to consumers was less than half the actual average buying tariff NEPCO paid to generators. In 2011 Jordan’s budget deficit reached 12.7 percent of GDP, and the overall public sector deficit reached 18.6 percent of GDP. As a result, public debt, which contracted significantly during 2000-2008, is rising sharply (Figure 20).
28. The current fiscal duress partially stems from Jordan’s policy response to the exogenous price shocks and economic swings of the last decade. The country first responded to the food and fuel price shocks of 2003–07 by increasing subsidies; this was possible thanks to substantial revenue increases witnessed over 2004–07, which was fueled by the strong economic growth over that period. In 2008, these subsidies were broadly eliminated but the fiscal space created was immediately used up by increasing salary for public sector employees and military personnel, both active and retired, and by a number of tax exemptions on consumption goods.
14 For further details, see World Bank (2012) Hashemite Kingdom of Jordan Options for Immediate Fiscal Adjustment and Longer Term Consolidation, Report No. 71979-JO, November 2012. The data and figures presented in this note rely on the latest publications from the Government and might be different from what is presented in Report No. 71979-JO.
0
1
2
3
4
5
6
7
8
9
10 -18
-16
-14
-12
-10
-8
-6
-4
-2
0 2000 2001 2002 2003 2004 2005 2006 2007 2008 2009 2010 2011 2012
Overall Fiscal Balance (Excluding Grants) Real GDP Growth (rhs)
Percent Percent
Fiscal balance over the economic cycle
FIGURE 19. Deficits widened anew since 2008 …
Source: Ministry of Finance, World Bank calculations.
JORDAN ECONOMIC MONITOR
Special Focus | 17
22. Tourism is one area where the conflict in neighboring Syria is having a positive spillover on Jordan. As the onset of the Arab Spring impacted regional tourism, the number of tourists visiting Jordan declined by 17 percent in 2011. The drop was driven by a 34 (30) percent decline in Syrian (GCC) tourists. A further drop, of 7 percent, in tourist numbers materialized in 2012, potentially due to the continued drop in Syrian tourists.12 Following a 16 percent decline in tourism income in 2011, a v-shaped recovery in tourism income took place in 2012 with income up 15 percent—close to its pre-crisis 2010 level. This recovery can be attributed mainly to the significant growth in tourism income from non-GCC Arab tourists as well as a milder increase from GCC tourists, all of whom who are likely to take multi-day trips, and often have relatively higher purchasing power than Syrian tourists.13 These regional tourism flows may have been redirected to Jordan as a substitute to conflict-ridden Syria, and to Lebanon where security incidents have been on the increase due to the spillover of the Syrian conflict. An increase in the number of medical tourists from Yemen and Libya also boosted 2012 performance.
23. Tourist and refugee flows in 2012 have supported the growth of associated services sectors and formal employment. The continuing inflow of refugees and the increase in tourism activity in 2012 have also provided a positive boost to relevant services sectors including wholesale and retail trade, restaurants and hotels, and transport and communications (Figure 17). Fortunately, the aforementioned sectors are all labor-intensive, which may have contributed to the aforementioned slight decline in unemployment between 2011 and 2012.
24. While the aggregate economic impact of the crisis on Jordan was arguably modest initially, it has begun to worsen as of late 2012 and is expected to continue doing so in 2013. With the recent acceleration of Syrian refugee inflow, and the anticipated increase in fiscal costs and imports, further labor market pressures, not to mention the strain on public service provision and trade, the negative impact of the neighboring conflict is expected to worsen over the short- to medium-term.
-4
-2
0
2
4
6
8
2010 2011 2012
Growth of Key Services Sectors
Wholesale And Retail Trade
Restaurant And Hotels
Transport,Storage & Communications
Percent
FIGURE 17. Tourism and Syrian refugee inflows have supported growth in key services sectors
Source: CBJ, World Bank calculations.
-40
-30
-20
-10
0
10
20
30
40
-25
-15
-5
5
15
25
2009 2010 2011 2012
Annual Export and Import Growth Rate
Total Exports Total Imports
Imports from Syria (rhs) Exports to Syria (rhs)
Percent Percent
FIGURE 18. Trade has begun to suffer due to impediments to transit trade through Syria
Source: Department of Statistics, World Bank calculations.
12 While Syria contributed almost 30 percent of all tourists visiting Jordan in 2010, Syrian tourists’ contribution to tourism income was disproportionately lower, due essentially to the higher propensity (85 percent in 2010) of brief one-day visits compared to tourists from other countries.
13 Ministry of Tourism, Tourism Statistical Newsletter (2010, 2011, 2012), and Jordan Tourism Satellite Accounts (2011).
THE WORLD BANK
16 | Special Focus

In addition, tax arrears have grown considerably, reaching JD1.7 billion in 2011. Forgone revenues due to the generous and complex investment incentive system were estimated at JD910 million in 2008-09. Finally, the tax reform of 2009-10 resulted in additional income tax reductions. Although there might be redundancies between these arrears, revenue gaps, and forgone revenues, they altogether amount to JD3.1 billion (14 percent of 2012 GDP).
Government Measures and Available Options31. Since 2012, the Government has renewed with fiscal consolidation by reducing both budgetary and overall public sector deficits (Figure 19). The trends in revenues and expenditures have somewhat reversed in 2012 with, for the first time in years, recovery in revenues by 1 percentage point of GDP and containment of expenditure by 2 percentage points. The former are due essentially to the removal of exemptions on real estate registration fees, increases in residency and money transfer fees, increases in taxes on cars, the introduction of sales taxes on mobile phones and air conditioners, the removal of tax exemption on agricultural inputs, an increase in taxes on air tickets and on tobacco and alcoholic products. The latter related mainly to cuts on capital spending, increases in fuel prices, and cuts to military and other current expenditures.16
32. A continued and sustained consolidation effort is needed to restore fiscal space and reduce fiscal risks. Jordan’s history of unsustainable debt dynamics of the early 1990s—the debt-to-GDP ratio reached 220 percent—forced the country to undertake painful adjustment which severely impacted growth and welfare. Jordan did not
recover its 1988 real GDP per capita level until 2006.17 Notwithstanding the adjustment efforts currently budgeted for 2013, the resulting deficit remains significantly higher than the 3.8 percent of GDP in primary deficit that is needed to stabilize Jordan’s debt dynamics. Adding NEPCO’s and other autonomous agencies’ deficits, a primary surplus of 4 percent of GDP in 2013 would be needed to stabilize Jordan’s rapidly rising debt path.
33. To reverse the revenue erosion, options include broadening the tax base and ensuring equal enforcement of existing tax laws. The former includes the eliminations of recently introduced exemptions while the latter includes the rapid collection of outstanding tax arrears and the end to the widespread practice of tax arrears. These measures would improve fairness and equity among taxpayers, which are critical components of voluntary tax compliance. More specifically, stopping the accumulation of arrears, recovering old arrears, and removing all the exemptions granted in 2008 for general sales tax (GST) and customs could generate up to 2 percent of GDP in revenues in 2013 (though given the large outstanding stock of tax arrears, agreed payments plans spread over time—with due interest charges—are likely to lower the extent to which tax arrears can be repaid upfront; in contrast to the other tax measures described, the collection of tax arrears would not be a recurrent revenue source so it would only provide a temporary boost to revenue collection).
34. On the spending side, available options include containing the growth rate of the wage bill, allowances, military spending, and additional prioritization of capital spending. Wages, and especially allowances, have increased rapidly in 2011 and continued on an upward trend in 2012. For the purpose of immediate fiscal adjustment, the government could consider containing the growth rate of the wage bill in nominal terms, and reviewing the level
16 The November 2012 removal of fuel subsidies and the introduction of the cash compensation scheme are estimated to reduce the overall public sector deficit by about 0.1 percent of GDP for 2012, and by about 1 percent of GDP for 2013.
17 World Bank (2012), “Hashemite Kingdom of Jordan Development Policy Review: Improving Institutions, Fiscal Policies and Structural Reforms for Greater Growth Resilience and Sustained Job Creation.” Report No 70706-JO, Washington, DC.
JORDAN ECONOMIC MONITOR
Special Focus | 19
Causes and Consequences of the Fiscal Imbalances29. Budgetary spending contains a large non-discretionary component which concentrates any need for adjustment on a few spending categories that exhibit large volatility. Non-discretionary spending (i.e., compensation of employees, pensions, and debt service) absorbed a large share of total spending during 2009-2012. Debt service and pensions entitlements are of
a contractual nature that is complex to adjust.15 Similarly, changing salaries and compensations is a difficult process to implement. Military expenditures, which contain a mix of discretionary and non-discretionary spending, have been volatile and growing over the past few years (from 20 percent of total spending in 2006 to 26 percent in 2011, before declining to 25.4 percent in 2012). Capital spending and subsidies, which are categories of spending that can more readily be adjusted amounted together to 16 percent of total spending during 2009-2012 against 28 percent during 2006-2008. The capital spending share declined to 9.8 percent of the total in 2012 from 21 percent in 2006 while the subsidy share rose. Capital spending is surging anew in 2013, as significant donor support is earmarked for such projects.
30. The reduction in fiscal space also resulted from a significant erosion of the revenue base. While expenditures declined by 4.2 percentage points of GDP between 2007 and 2011 (Figure 22), domestic revenues shrank by 9.4 percentage points of GDP (Figure 21). As part of a fiscal stimulus to buttress the impact of the global financial crisis, Jordan resorted in 2009 to large-scale tax cuts and exemptions and boosted capital spending. The revenue gap arising from the sales tax and customs exemptions alone is estimated at JD500 million.
15 Reform can be more easily implemented for future pensions with parametric changes to the benefits of future retirees.
0
20
40
60
80
100
120 Decomposition of Publc Debt (% of GDP)
Gross Internal Public Debt Gross External Public Debt
Gross Public Debt
Percent
FIGURE 20. … resulting in a rapid debt accumulation
Source: Ministry of Finance, World Bank calculations.
-5
0
5
10
15
20
25
30
35 Share of GDP (%) Growth (%)
Percent
FIGURE 21. Domestic revenues dropped as share to GDP between 2007 and 2011 …
Source: Ministry of Finance, World Bank calculations.
0
5
10
15
20
25
30
35
40
45 Current Spending (% of GDP) Capital Spending (% of GDP)
Percent
FIGURE 22 … while decline in budget spending was less acute …
Source: Ministry of Finance, World Bank calculations.
THE WORLD BANK
18 | Special Focus

MAKING THE TRANSITIONTO THE KNOWLEDGE ECONOMY:THE JORDANIAN CASE20
38. Jordan has developed a valuable knowledge economy over the past decade. Further reforms, however, are needed for the sector to fulfill its potential, not least in terms of quantity and quality of jobs. Jordan’s education system is forming the human resources needed for a modern knowledge economy but reforms are needed to equip students with the skills demanded in the market. The country’s R&D infrastructure is solid and its scientific production relatively high, but these capabilities are not closely linked to the needs of the economy. ICT-based industries such as business process outsourcing and call centers are also areas in which Jordan has a comparative advantage owing to the widespread use of English and a history of links with foreign investors. Another promising sector is health tourism, in which Jordan has already invested heavily: Building on the above, institutional reforms are crucial to re-direct domestic and foreign investments towards technology and skill intensive sectors.
39. Knowledge and innovation have always played a crucial role in economic and social development. But globalization and the technological revolution of the last few decades have made knowledge the key driver of competitiveness and are profoundly reshaping the patterns of the world’s economic growth and activity. In today’s increasingly knowledge-based world, more and more countries are embracing knowledge and innovation-related policies to spur growth and competitiveness.
40. A knowledge-based economy is one that acquires, creates, disseminates, and uses knowledge to enhance its growth and development.21 It is not just about information and communication technology (ICT) or high-tech
industries. The knowledge and innovation-driven approach should be seen in a broad perspective as the foundation of a development strategy, with knowledge as a powerful tool that makes it possible to increase productivity and innovation across all sectors of the economy and to develop competitive and sustainable economic activities, all of which enable countries to diversify their economies, in the process creating new enterprises and jobs. Ultimately, this approach is about economic development as a process of generating and tapping relevant knowledge and putting that knowledge to work to generate further growth and employment.
41. Many Arab countries are currently witnessing a transition on three fronts: political, economic and social (World Bank, 2013). To be able to manage the expectations coming out from these transitions and overcome the frustration due to the “jobless growth” syndrome, the Arab world needs to quickly embrace the global trend towards building a knowledge economy. It needs to embrace a new development strategy where economic growth is spurred by innovation, supported by an improved educational system, a strengthened application of ICTs and its infrastructure, and a good entrepreneurial and economic environment. Such a growth model will be helpful to accommodate the critical challenges faced by the region, especially the need to create jobs. The region suffers from the highest youth unemployment rates that attain in some countries over 40 percent; it is estimated that 40 million jobs will need to be created over the next decade to fight that unemployment. The move towards a knowledge and innovation driven economy will be important to boost competitiveness, increase productivity of all sectors of economic activity, which are both key for job creation.
42. The implementation of a knowledge- and innovation-based development strategy in the Arab countries requires, nevertheless, a clear vision followed by a strong coordination at the highest level of government since the strategy is cross-cutting in nature. In addition, there is a need
20 For more details, see World Bank (2013) Transforming Arab Economies: The Knowledge and Innovation Road, MNCMI’s report, forthcoming.
21 World Bank (2007) Building Knowledge Economies; Advanced Strategies for Development, Washington, DC
JORDAN ECONOMIC MONITOR
Special Focus | 21
of many allowances. A stronger prioritization of capital spending would also be warranted. Notwithstanding ongoing demands linked to regional instability and budgetary efforts that have started over the past two years, consideration should also be given to review the level of military spending as this spending category expanded significantly over the past half a decade.
35. A sustainable, equitable, and efficient fiscal adjustment would also require addressing the large power sector losses. The overall fiscal cost of NEPCO reached 5 to 6 percent of GDP annually in the two years through 2012. Aside from being unsustainable for Jordan given the magnitude of the fiscal drain they cause, these (direct or indirect) expenditures are also regressive—i.e., they benefit more wealthy Jordanians than poorer ones—and they generate strong inefficiencies in the economy. These efficiencies comprise the specialization of Jordan’s corporate sector in sectors where the country does not have a natural comparative advantage. Cognizant of these issues, the Government is committed to eliminating NEPCO’s losses over the medium-term (as committed through its IMF SBA program). Options to achieve cost recovery at NEPCO include electricity tariff increases—to increase the pass through from permanently higher electricity generation input prices—and increasing the supply of gas (which is significantly cheaper, more efficient,18 and greener than fuel for electricity generation).
36. Tariff and subsidies reforms are highly desirable—especially in the electricity and water sectors—on fiscal sustainability, and externality grounds. Change to the electricity tariff that protect the poorest households can be designed, for example, to generate JD320 million and reduce the losses of the electricity sector by 1.5 percent of GDP in 2013. Also, 75 percent of food subsidies could be saved, and the remaining 25 percent targeted more efficiently to poor households. These recurrent savings would amount to 0.7 percent of GDP in
2013. Scenarios to reform the water sector and water tariffs show that annual savings could reach 0.18 percent in 2013.19 Subsidies generate over-consumption compared to the no-subsidy price (by lowering the price they increase demand). Since Jordan imports 90 percent of its electricity generation needs and is the fourth water-poor country in the world, inducing Jordanians to over-consume these goods is not desirable.
37. The design of a sustainable and implementable large fiscal adjustment program warrants a strong focus on progressivity—i.e., more of the adjustment is supported by wealthier Jordanians. The tax burden has been declining since 2007 due to a mix of loose tax administration, generous exemptions, and policy reform choices. As the tax system is progressive overall, the sharp reduction in the tax effort has benefited the more well off citizens. Expenditures remain high partly due to the system of expensive fuel, food, and power subsidies, all largely regressive. As wealthier Jordanians are benefited both on the revenue and expenditure side from fiscal policy changes since 2007, fairness, equity, and social sustainability considerations would warrant limiting the impact of the ongoing fiscal adjustment on poor and vulnerable households and instead focusing on wealthier Jordanian. The latter have also more ability to bear a higher share of the burden of fiscal consolidation.
18 Higher efficiency from gas arises as Jordan’s power stations are designed for gas input. Running these with fuel generates significant technical losses in the electricity generation process.
19 Preliminary estimations show that the removal of fuel subsidies and the introduction of the cash compensation scheme decided on November 13 would generate savings of about 1 percent of GDP for 2013.
THE WORLD BANK
20 | Special Focus
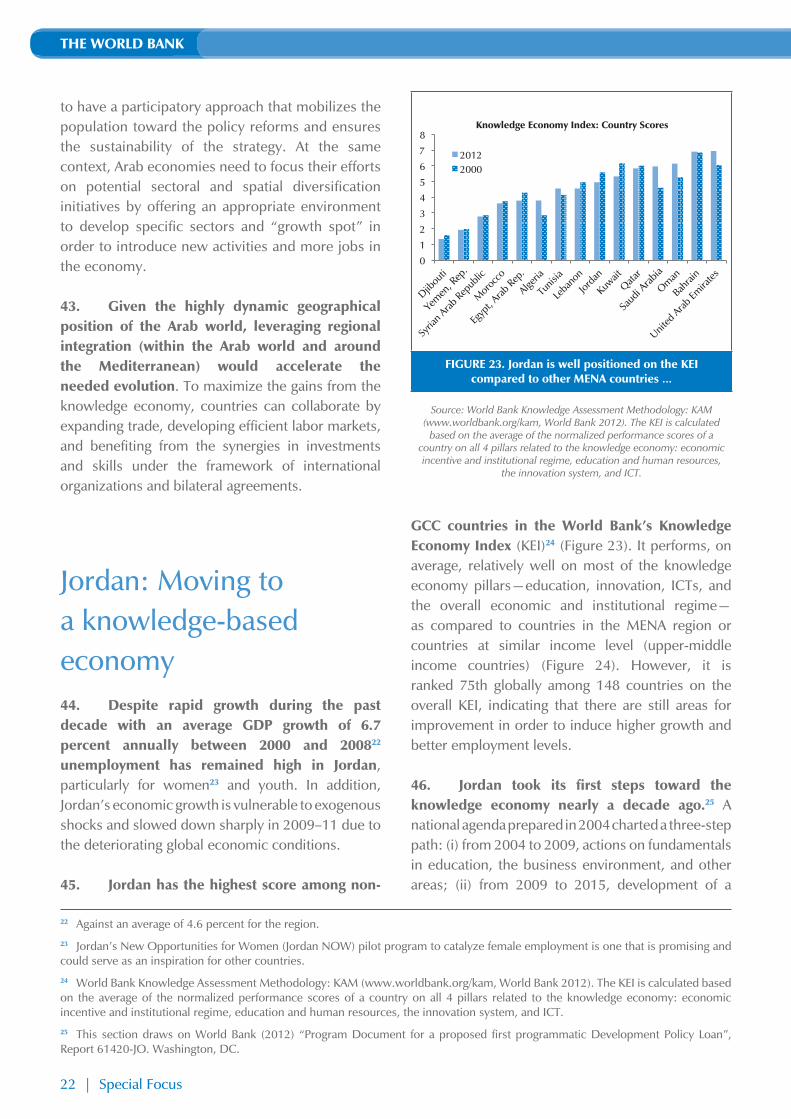
competitive manufacturing base; and (iii) after 2015, the take-off into knowledge-economy-based development. Various factors interfered with the achievement of those plans, the foremost being the difficult geopolitical environment in which the country has found itself.
47. The relative instability of the government is another complicating factor. There have been frequent changes of governments in a context of demands for more rapid democratization and greater popular participation. The institutional landscape features a complex accumulation of overlapping agencies and departments, some of which may duplicate effort and impede reform. In this context, the business environment suffers from significant drawbacks, such as high taxes, selective application of the law, inefficient regulatory measures. This has affected FDI inflows, which remains modest with respect to local investments and as a share of GDP. A law to attract foreign investment that has been in preparation for several years is still awaiting implementation. The global economic crisis has, not surprisingly, slowed the country’s economy.
Education48. Jordan benefits from a high literacy rate (more than 85 percent of the population is literate). It has also undertaken significant reforms in education and has one of the most educated populations in the region, thanks to a steadily increasing tertiary enrollment rate that grew from 28 percent in 2000 to 41 percent in 2009. The government allocates about 13 percent of its general budget, or 3.8 percent of GDP, to education compared to the OECD average of 4.7 percent of GDP.
49. But, as in other Arab countries, the labor market suffers from skills mismatch, where the outcomes of the educational system do not necessarily match with the market needs. The education system fails to equip students with the skills demanded in the market, including
soft skills such as problem-solving, teamwork, and leadership. On the one hand, a lot of low-skilled jobs are being created (notably in apparel, commerce, and construction) that do not match the aspirations of a relatively higher educated population for higher paying jobs. On the other hand, surveys show that although Jordanian CEOs rate the quality of the educational system higher than their peers in the MENA region, they also express the greatest concern about the teaching of practical skills. Thirty three percent of a recently surveyed Jordanian firms stated that they perceive the inadequately educated workforce as a major constraint (compared with 24 percent in Turkey or to 30 percent in Morocco).26
50. Such skills mismatch has led to a net outflow of talent, with 13,000 young Jordanians studying abroad (mostly in the United Kingdom or United States), who do not plan on returning to Jordan after finalizing their studies. Only 5 percent of a recent surveyed sample of Jordanian academic staff living abroad cited that they are encouraged to return to Jordan given the availability of good job opportunities and competitive salaries at Jordanian universities.27 Such brain drain is a major loss for effective knowledge transfer to the Jordanian economy.
26 Enterprise Surveys (http://www.enterprisesurveys.org), The World Bank. Accessed 14 January 2013.
0
5
10
Tariff & Nontariff Barriers, 2011
Regulatory Quality, 2009
Rule of Law, 2009
Royalty Payments and receipts(US$/pop.) 2009
(S&E Journal Articles / Mil. People, 2007
Patents Granted by USPTO / Mil. People, avg 2005-2009 Average Years of Schooling,
2010
Gross Secondary Enrollment rate, 2009
Gross Tertiary Enrollment rate, 2009
Total Telephones per 1000 People, 2009
Computers per 1000
People, 2008
$Internet Users per 1000 People, 2009
Jordan Middle East and N. Africa Upper Middle Income
Knowledge Economy Scorecard
FIGURE 24. … but remains on a relatively weak position compared to upper middle income countries
Source: World Bank
Jordan’s New Opportunities for Women (Jordan NOW) pilot program to catalyze female employment is one that is promising and could
serve as an inspiration for other countries.
JORDAN ECONOMIC MONITOR
Special Focus | 23
to have a participatory approach that mobilizes the population toward the policy reforms and ensures the sustainability of the strategy. At the same context, Arab economies need to focus their efforts on potential sectoral and spatial diversification initiatives by offering an appropriate environment to develop specific sectors and “growth spot” in order to introduce new activities and more jobs in the economy.
43. Given the highly dynamic geographical position of the Arab world, leveraging regional integration (within the Arab world and around the Mediterranean) would accelerate the needed evolution. To maximize the gains from the knowledge economy, countries can collaborate by expanding trade, developing efficient labor markets, and benefiting from the synergies in investments and skills under the framework of international organizations and bilateral agreements.
Jordan: Moving to a knowledge-based economy 44. Despite rapid growth during the past decade with an average GDP growth of 6.7 percent annually between 2000 and 200822 unemployment has remained high in Jordan, particularly for women23 and youth. In addition, Jordan’s economic growth is vulnerable to exogenous shocks and slowed down sharply in 2009–11 due to the deteriorating global economic conditions.
45. Jordan has the highest score among non-
GCC countries in the World Bank’s Knowledge Economy Index (KEI)24 (Figure 23). It performs, on average, relatively well on most of the knowledge economy pillars—education, innovation, ICTs, and the overall economic and institutional regime—as compared to countries in the MENA region or countries at similar income level (upper-middle income countries) (Figure 24). However, it is ranked 75th globally among 148 countries on the overall KEI, indicating that there are still areas for improvement in order to induce higher growth and better employment levels.
46. Jordan took its first steps toward the knowledge economy nearly a decade ago.25 A national agenda prepared in 2004 charted a three-step path: (i) from 2004 to 2009, actions on fundamentals in education, the business environment, and other areas; (ii) from 2009 to 2015, development of a
22 Against an average of 4.6 percent for the region.
23 Jordan’s New Opportunities for Women (Jordan NOW) pilot program to catalyze female employment is one that is promising and could serve as an inspiration for other countries.
24 World Bank Knowledge Assessment Methodology: KAM (www.worldbank.org/kam, World Bank 2012). The KEI is calculated based on the average of the normalized performance scores of a country on all 4 pillars related to the knowledge economy: economic incentive and institutional regime, education and human resources, the innovation system, and ICT.
25 This section draws on World Bank (2012) “Program Document for a proposed first programmatic Development Policy Loan”, Report 61420-JO. Washington, DC.
0
1
2
3
4
5
6
7
8
20122000
Knowledge Economy Index: Country Scores
FIGURE 23. Jordan is well positioned on the KEI compared to other MENA countries …
Source: World Bank Knowledge Assessment Methodology: KAM (www.worldbank.org/kam, World Bank 2012). The KEI is calculated
based on the average of the normalized performance scores of a country on all 4 pillars related to the knowledge economy: economic incentive and institutional regime, education and human resources,
the innovation system, and ICT.
THE WORLD BANK
22 | Special Focus

the creation of a National Council for Competitiveness and Innovation, among other measures. It has also embarked on the formulation of its 2012–2016 Science, Technology and Industry strategy.
Information and communication technology infrastructure55. Jordan has one of the most open and liberalized ICT markets in the region, and a high number of ICT graduates. The mobile market in Jordan can be considered the most competitive in the region. Over the last five years, the ICT sector has generated 84,000 jobs and contributed 14 percent to GDP.30 IT sector exports ($200 million in 2012) are characterized by high-value-added activities such as computer programming, data processing, and hosting. Three neighboring countries, Saudi Arabia, Iraq and the United Arab Emirates represent 60 percent of exports. Domestic revenues, however, are derived mostly from lower-value-added activities such as ICT wholesaling or installation.
56. Relatively high computer prices and mobile tariffs, compared with the average income level (partially the result of trade tariffs), hamper the penetration of ICT usage. For instance, internet penetration is still at 38 percent compared to 81 percent in Qatar and 77 percent in the UAE. Although the ICT sector favors opportunities in e-learning, e-health, telecommunications, business process outsourcing, online and mobile content, and other areas related to the spread of the knowledge economy, the level of e-commerce is still low because small and medium-sized enterprises, especially small family businesses, do not use IT. The knowledge content of ICT applications is also relatively unsophisticated, despite the government’s commitment to promoting the ICT sector and to developing e-governance.
Economic and institutionalregime57. Although Jordan is endowed with a strong human capital base there are major institutional weaknesses that represent constraints for investors. The strong human capital base includes a large number of engineers, a substantial high-skill diaspora, and an IT-savvy younger generation. To make an effective transition to the knowledge economy, it is necessary to continue to improve the business climate in order to stimulate business formation and attract foreign investment, which together foster growth and competitiveness.
58. As an example, one of the areas that Jordan needs to do more is in the area of attracting FDI. Despite the high level of FDI inflow, these are still mainly concentrated in low-value-added and non-tradable sectors that employ low-skill workers, such as in textiles, construction, and basic minerals. Consequently, 55 percent of the 300,000 to 350,000 private sector jobs created between 2000 and 2010, went to foreign workers. A few capital-intensive industrial projects that require the latest technological equipment and expatriate personnel (as in wind and solar energy) are exceptions to the rule.
59. Jordan’s weak attractiveness of high-value-added FDI partly reflects the relatively small size of the market and the lack of integration and stability of the region. Other factors impacting high-value-added FDI are traceable to the weak and inefficient institutional environment. Jordan ranks 71 in the World Economic Forum’s 2011/12 Global Competitiveness Report, ahead of Morocco (73) but behind Tunisia (40) and the Gulf economies. The country has fallen from 50th position in 2009 because of deterioration in its institutional environment, government bureaucracy, and financial markets.
60. In the same context, Jordan’s FDI is typically concentrated in free-trade zones, development areas, and industrial zones (several dozen). Despite this elaborate framework and active investment
30 MoICT – ICT Economic Impact. http://www.rbiproject.com/event2-presentations_files/Jordan%20ICT%20Sector_Jul_2011_Sector%20Presentation.pdf.
JORDAN ECONOMIC MONITOR
Special Focus | 25
51. Given this, the government embarked on a major effort to reform the education system at the early childhood, basic, and secondary levels to produce graduates with the skills needed for the knowledge economy. The Education Reform for the Knowledge Economy (ErfKE) project, for example, was launched almost 10 years ago at the primary and secondary levels to prepare students for the knowledge economy. The government plans to continue the major education reform efforts that it has embarked on over the past decade in order to improve the quality, relevance, and coherence of higher education. In addition, the second phase of the Education Reform for Knowledge Economy (ERfKE II, 2010–14) includes better targeting of higher education and vocational training toward evolving market needs and opportunities in the region, with a strong emphasis on innovation, competitiveness, and R&D. Numerous efforts are underway to improve educational quality (general education and higher education), enhance technical and vocational training, and raise the prestige of the vocational (nonacademic) learning stream. Jordan has taken steps to become a regional center of ICT development, with partnerships with Microsoft and Cisco, to provide more attractive job opportunities for highly skilled young graduates.
Innovation52. The country has a significant entrepreneurial class with good innovative potential, but a poor science and technology basis. The country’s level of investment in R&D is low (at 0.3 percent of GDP). The R&D landscape is also relatively scattered between 10 public universities, 12 private ones and 12 scientific centers. The governance of R&D is divided between two public bodies—the Ministry of Higher Education and Scientific Research and the Higher Council for
Science and Technology. These R&D institutions are relatively isolated to meet the productive needs of the economy. For instance, Jordan’s score on university-industry collaboration is low—35.8 on the 10–70 scale of the Global Innovation Index,28 well below Tunisia (51.3) but higher than Morocco (34.9). Therefore, there is a room for improvement in order to stimulate the integration between academia and industry, to increase the flow of knowledge between the two. Existing regulations at universities fail to create incentives for professors to engage in R&D activities that meet market needs. In addition, a lack of awareness among businesses and the public has prevented available intellectual property rights from protecting R&D outcomes. The Jordanian government needs to continue its efforts of the 2007–09 executive program, led by the Ministry of Planning and International Cooperation (MOPIC), which insisted on technology transfer and linking the objectives of universities and research centers with those of the industrial sector.
53. But there are some bright spots. The 2011 Global Innovation Index (GII) ranks 125 countries and economies in terms of their innovation capacity and results.29 Jordan is a notable exception in the GII—it ranks 4th among the MENA countries covered by the index and 41st overall. Its position is notable because it is more than 25 positions ahead of its closest competitor in the same region and income group, Tunisia (66). Although Jordan is only eighth in the region on innovation inputs, it is third in output. Jordan’s leverage comes from creative outputs, with a strong dynamism at the level of residents’ trademark registrations at the national level (where it is placed first in the region) and a relatively high level of exports of creative goods.
54. Thus, exploiting the potential for innovation can give a significant boost to Jordan’s development. Over the last few years, the government has taken a series of steps to improve the innovation climate through
27 Istaiteyeh, R. (2011) “Economic Development and Highly Skilled Returnees: The impact of Human Capital Circular Migration on the Economy of Origin Countries: The case of Jordan,” International Labor Migration, Vol. 10., Kassel University Press.
28 INSEAD and WIPO (World Intellectual Property Organization) (2011) The Global Innovation Index 2012: Accelerating Growth and Development. Fontainebleau, France: INSEAD.
29 INSEAD (2011) The Global Innovation Index 2011: Accelerating Growth and Development. Fontainebleau, France: INSEAD. http://www.globalinnovationindex.org/gii/main/fullreport/index.html.
THE WORLD BANK
24 | Special Focus

DATA APPENDIX
JORDAN ECONOMIC MONITOR
Data Appendix | 27
promotion by the Jordan Investment Board and the bodies governing the above-mentioned structures, the regulations and laws governing investment appear to be confusing to investors.
61. However, the government has initiated a series of interventions to improve the business climate. A committee to accelerate improvements to the business environment has been put in place. Wide-ranging legislative changes and reforms of financial infrastructure have also been initiated in order to broaden access to financial services. A particular priority is widening access by small and medium-sized enterprises to financing. More broadly, new laws and institutions have been established to enhance the transparency and accountability of state institutions. However, the limited capacity of the implementing institutions is a major issue, one that has become a focus of government attention.
Sectoral initiatives62. Some sectors also present attractive prospects for job creation. ICT-based industries such as business process outsourcing (BPO) and call centers are areas in which Jordan has a comparative advantage owing to the widespread use of English and a history of linkages with American and other foreign investors. Another promising sector is health tourism, in which Jordan has already invested heavily: the kingdom now enjoys a solid hospital infrastructure. There is a need, however, to raise the skills of nurses and intermediary medical workers, which could help fill several thousand jobs. Finally, the water sector is a source of massive technical and industrial effort, along with appropriate institutional arrangements, in view of water’s vital importance for the country.
Moving forward63. The current structure of the Jordanian economy, driven largely by low-value-added
activities, has a strong impact on the level of unemployment among university graduates. A key objective for Jordan is thus to move up the value chain, as for example, in textiles, where it would do well to gradually exit the lower end of this sector, where international competition with lower-cost producers is stiff. It would also seem appropriate to diversify the industrial structure and reorient public support to higher value-added sectors (such the pharmaceutical sector). Any of these policies, however, needs to be supported by institutional reforms to change how the state interacts with the private sector and deep administrative reforms to upgrade public services. Improving the environment for innovation may also facilitate moving up the technological ladder. To date, the country’s innovation policy has been (i) too narrowly cast, addressing mostly technological innovation and largely missing out on today’s important non-technological sources of innovation, and (ii) suffering a high level of complexity with too many organizations and poorly differentiated mandates. Resources to support innovation are spread too thin, and key priority agencies lack adequate resources to perform their functions.
64. Therefore, there is a need to launch a knowledge- and innovation policy initiative that could accelerate reform and mobilize popular support. Such an initiative would consist of a multiyear national effort to turn Jordan into the region’s most innovative economy within 3–5 years, so as to dramatically lift the country’s growth and job-creation potential and offer a clearly visible response to the aspirations of the country’s youth. This initiative would need to be developed as a process, with the capacity to span successive government tenures and to engage many stakeholders (government, private sector, and civil society) as well as a range of partners in a continuous flow of gradual reforms. All this should also be accomplished within a broader strategy of international cooperation and regional integration.
THE WORLD BANK
26 | Special Focus
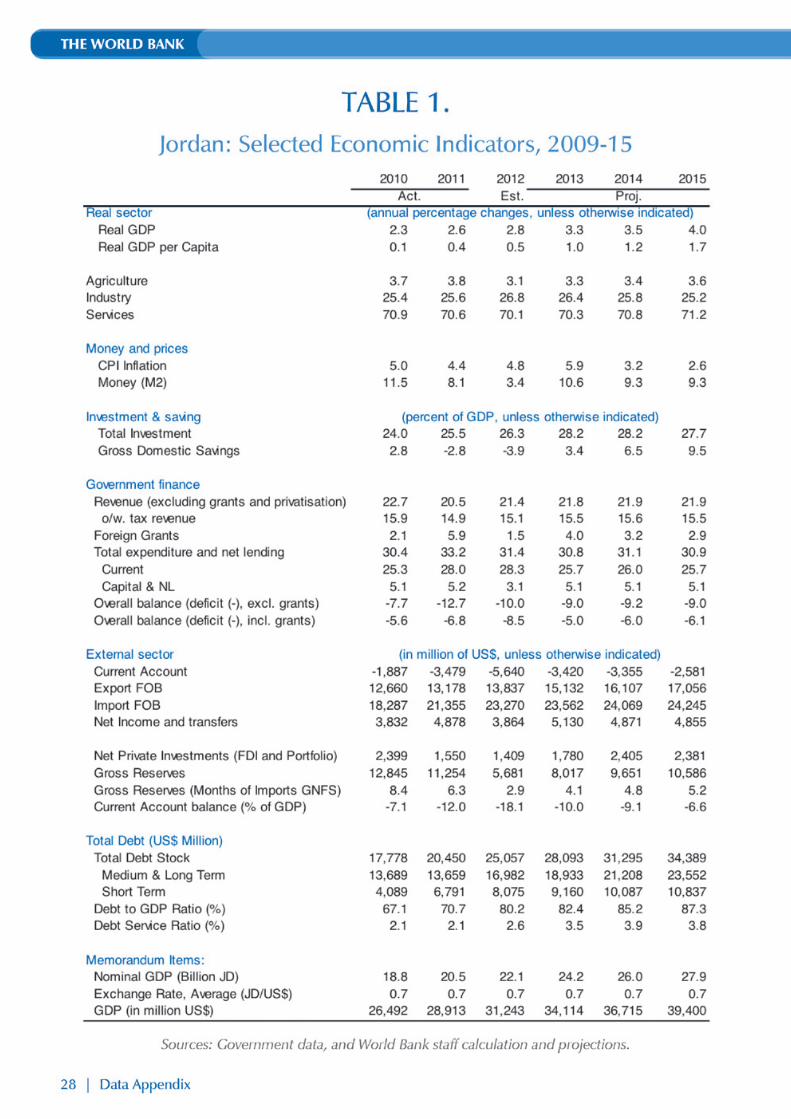

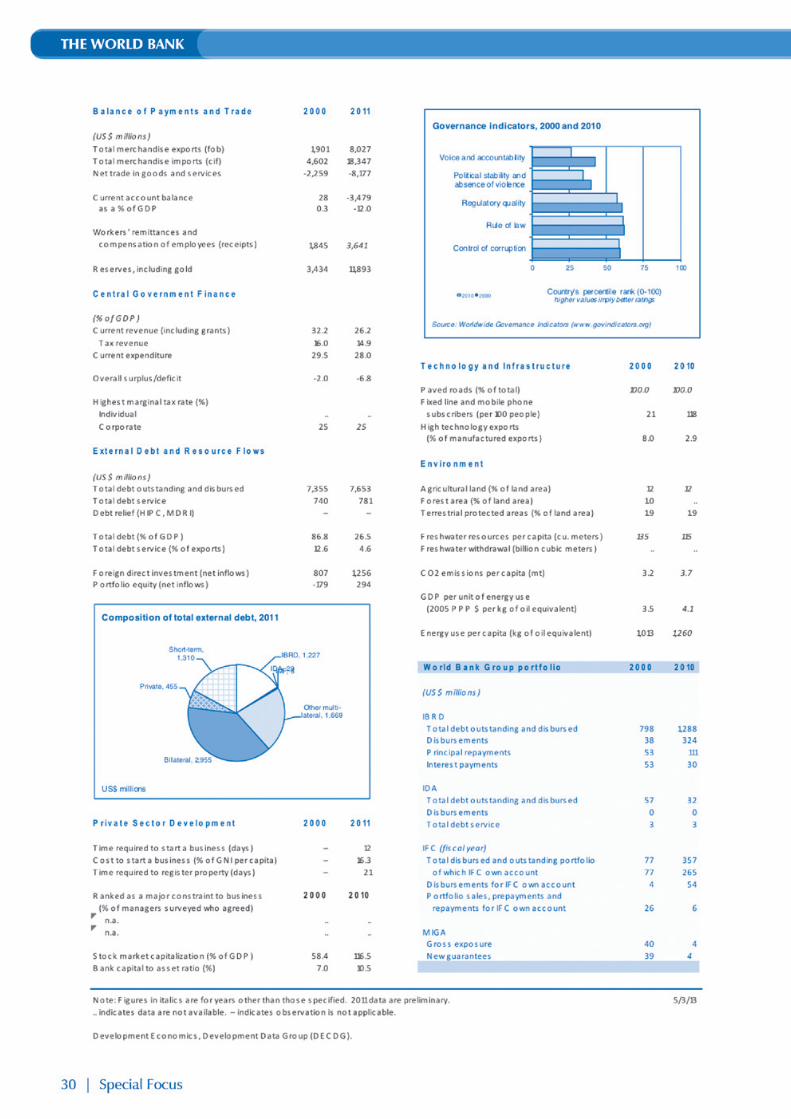


0.9375 cm
JORDAN ECONOMIC MONITOR
Poverty Reduction and Economic Management UnitMIDDLE EAST AND NORTH AFRICA REGION
The World Bankwww.worldbank.org.jo
The World Bank
MAINTAINING STABILITY AND FOSTERINGSHARED PROSPERITY AMID REGIONAL TURMOIL
SPRING 2013