orbigate datasheet orbigate - dv ingenieria · analysis algorithms. orbigate allows the user to...
TRANSCRIPT

ORBIGate DATASHEET
M002-114-2 1
DATASHEET
Industries
> Power Generation
> Oil and Gas
> Chemical
> Petrochemical
> Marine
Introduction
ORBIGate is the OROS portable and dedicated solution for the measurement of industrial rotating machinery vibration. Featuring simultaneous acquisition on up to 32 dynamic channels, an entire machine train may be tested. ORBIGate is used on any combination of machines ranging from turbines, motors and generators, as well as pumps and compressors. Machine trains can be directly coupled or coupled through a gear box. The system acquires and analyzes shaft and casing vibration. Typical graphics are orbits, shaft centerline, spectra, bode and polar diagrams, trends, waterfall, overall peak to peak, 1X (amplitude and phase). In a typical situation the OROS instrument is connected to the outputs of the monitoring system as shown in Fig1.
ORBIGate The Turbomachinery Vibration Software
Fig1: Application example: a full machine train set-up
Machines
> Turbines (gas, steam, hydro)
> Motors
> Gear boxes
> Pumps
> Compressors
> Generators
> Cogeneration machine trains
> Compression groups
> Power generation groups
> Turbochargers
Applications
> Manufacturers workshops & test cells o Acceptance tests o Overhaul o String tests
> Field testing: power and chemical plants, offshore
o Commissioning o Predictive maintenance o Diagnostics and troubleshooting
> Relative shaft vibration (journal bearings), absolute casing vibration, run-up, steady state and shut down signatures
> Balancing

ORBIGate DATASHEET
M002-114-2 2
Table of Content
Introduction .............................................................................................................................................. 1
Table of Content ...................................................................................................................................... 2
Description ............................................................................................................................................... 3
Acquisition ........................................................................................................................................... 4
Post-analysis ....................................................................................................................................... 4
Data Navigation ................................................................................................................................... 4
Software Configuration ............................................................................................................................ 4
Machine ............................................................................................................................................... 5
Sensors ............................................................................................................................................... 5
Inputs ................................................................................................................................................... 5
Rotating Speed.................................................................................................................................... 5
Analysis ............................................................................................................................................... 5
Displays ............................................................................................................................................... 5
Results, displays and turbomachinery tools ............................................................................................ 6
Rotating machinery vibration graphics ................................................................................................ 6
Full shaft motion .................................................................................................................................. 6
1X and polar diagrams: start-up results for balancing ........................................................................ 6
SUB1X ................................................................................................................................................. 6
Gap voltage reference ......................................................................................................................... 7
Run out compensation ........................................................................................................................ 7
Export and reporting ............................................................................................................................ 7
A powerful and flexible plateform for your needs .................................................................................... 7
Specifications........................................................................................................................................... 8
Data Management ............................................................................................................................... 8
Machine Train Configuration ............................................................................................................... 8
Bearings and Sensors Configuration .................................................................................................. 8
Input & Tach Configuration ................................................................................................................. 8
Tach Configuration .............................................................................................................................. 8
Analysis ............................................................................................................................................... 8
Displays ............................................................................................................................................... 9
Analysis tools .................................................................................................................................... 10
Navigation ......................................................................................................................................... 10
Reporting ........................................................................................................................................... 10
Import/Export ..................................................................................................................................... 10
Preference and units ......................................................................................................................... 10
Ordering Information .............................................................................................................................. 11
Examples of instrument configurations ............................................................................................. 11
ORBIGate DATASHEET
M002-114-2 3
Description
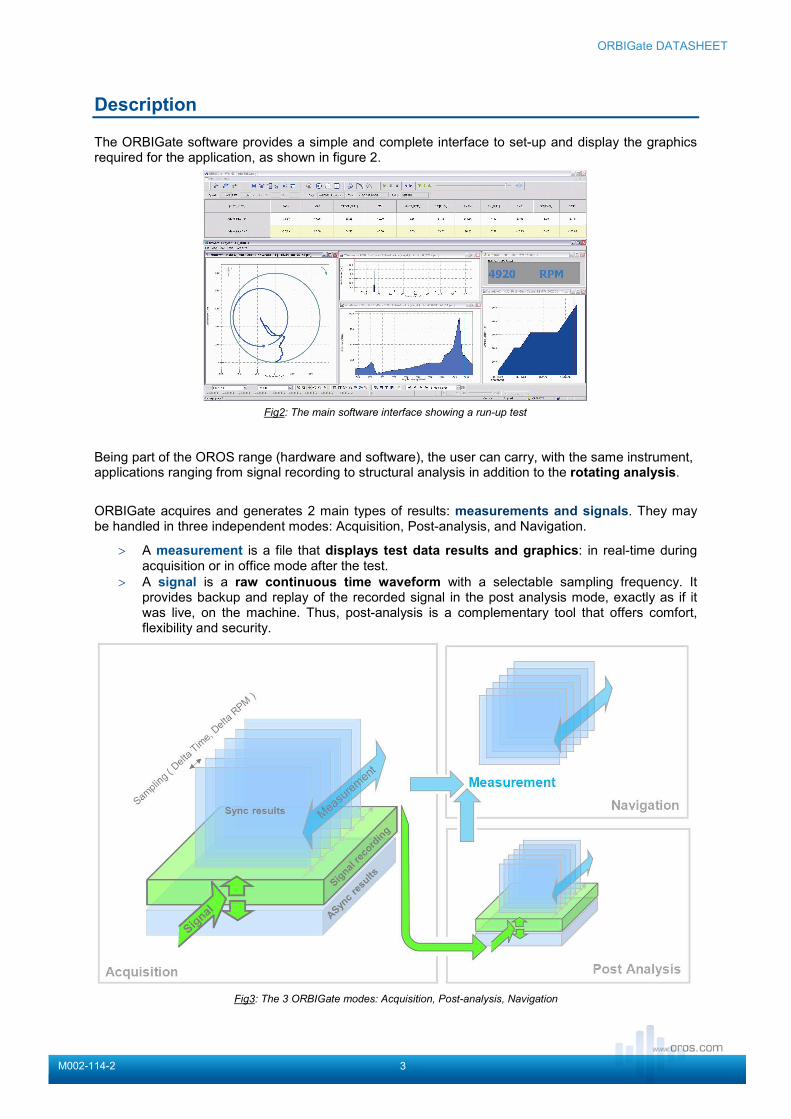
The ORBIGate software provides a simple and complete interface to set-up and display the graphics required for the application, as shown in figure 2.
Being part of the OROS range (hardware and software), the user can carry, with the same instrument, applications ranging from signal recording to structural analysis in addition to the rotating analysis.
ORBIGate acquires and generates 2 main types of results: measurements and signals. They may be handled in three independent modes: Acquisition, Post-analysis, and Navigation.
> A measurement is a file that displays test data results and graphics: in real-time during acquisition or in office mode after the test.
> A signal is a raw continuous time waveform with a selectable sampling frequency. It provides backup and replay of the recorded signal in the post analysis mode, exactly as if it was live, on the machine. Thus, post-analysis is a complementary tool that offers comfort, flexibility and security.
Fig3: The 3 ORBIGate modes: Acquisition, Post-analysis, Navigation
Fig2: The main software interface showing a run-up test

ORBIGate DATASHEET
M002-114-2 4
Acquisition
> The data required for rotating analysis is collected and recorded through Synchronous Order Analysis (SOA) algorithm that has a configurable sampling rate (delta.time, delta RPM, or a combination of both).
> FFT analysis (asynchronous analysis). This analysis allows one to monitor vibration even when no keyphasor is detected.
> Continuous signal recording: recording of the continuous time waveform signal allows post-analysis of the signal afterhand in the post analysis mode. Continuous signal recording may be triggered independently from the standard measurement data recording (provides a back up of the critical test periods) even during several hours of tests. Maximum continuous signal sampling frequency is 102.4 kHz and it is selected by the user.
Post-analysis
Based on the recorded signal, post-analysis of the results can be carried out. Signals are played back and the results can be monitored and saved as if being on-site. One great advantage is that a modified analysis set-up can be selected for a different view of the data. Post-analysis can be achieved based on the integrated software license (USB double based).
Data Navigation
The data navigation mode is especially designed for investigating recorded results. The master navigation cursor allows the user to navigate through the pile of recorded data. When doing that, all cursors are synchronized in order to display the data at the chosen instant (RPM, absolute date or relative date). Data navigation mode features special functions such as display speed control and range selection, allowing to concentrate on one part of a long measurement. The navigation mode also allows automated report generation.
Software Configuration
Software configuration is achieved through 6 main steps:
> Machine
> Sensors
> Inputs
> Keyphasors
> Analysis
> Displays
Each of the configuration steps may be accessed individually through interface icons or sequentially through a dedicated wizard. Setups are saved in a project and can be reloaded. A machine database allows the user to reload an existing machine configuration when creating a new project on an existing machine.
Fig4: Post-analysis

ORBIGate DATASHEET
M002-114-2 5
Machine
Machine trains can be direct driven or indirect driven (gear box based). A machine train using a gear box requires the analysis system to process order tracking on 2 shaft rotating speeds simultaneously: this function is available in ORBIGate. Keyphasors can be 2 physical sensors or calculated keyphasors (simulated or gear ratio based). This solution is able to monitor combined cycle machine train with independent rotating speeds as well.
Sensors
Bearing clearance can be entered. Sensors angular positions can be configured easily by steps of 1°. Labels are chosen and input channels selected. The machine configuration, including gap reference voltages, and bearing clearance values are saved and can be reloaded from the machine library. Actually, hardware and software integrate all functions for signals coming from proximity probes, velocity probes and accelerometers (including ICP
® power).
Inputs
Each input setting is configured and saved as part of the project. Sensors, selected from the sensor database, cover all vibration sensors ranging from proximity probes to accelerometers. Accelerometer conditioning functions include ICP
® which allows
the user to connect the accelerometer directly to the OROS system without the need for an external power supply. Inputs’ range goes up to ±40 V on OR36, Mobi-Pack and OR38 allowing to connect directly to the condition monitoring system. The AC/DC/Float selection allows choosing the appropriate coupling.
Rotating Speed
Up to 2 independent rotating speeds can be monitored: this provides 2 separate Synchronous Order Analysis algorithms. ORBIGate allows the user to capture nX (1X, 0.5X etc …) amplitude and phase considering each rotor independently. The rotating speed can be captured based on keyphasor or optical sensors, on manual values, on computed keyphasor
® based on a gear ratio (gear box
situation) or on any combination of these inputs.
Analysis
Analysis is configured based on an interactive display that allows having a clear overview of the frequency settings as well as the order tracking settings. Standard default orders are 1X, 2X, 3X. Additional orders can be customized including sub harmonics (0.5X). In case of a 2 shafts machine, the analysis of each shaft is configured thanks to 2 graphs as shown on the screen copy displayed (Fig6).
Displays
A number of layouts containing graphic windows can be easily created and saved in the project as well. The user can browse freely from one layout to another increasing the display capacity of the screen.
Fig6: A 2 shafts machine train configuration
Fig5: Configuration of a large machine train

ORBIGate DATASHEET
M002-114-2 6
Results, displays and turbomachinery tools
Rotating machinery vibration graphics
For analyzing rotating machinery vibration, ORBIGate features the following graphics and displays:
> Scalar values such as vector data (nX orders amplitude and phase), overall, gap, SUB1X, and SMax: displayed in a configurable table
> Frequency and order spectrum, waterfall
> Trends, Bode and polar plots
> Orbits (overall and nX), time blocks
> Shaft centerline and full shaft motion
> Raw signal and zoomed signal
Full shaft motion
> The full shaft motion graph displays on the same plot and for each bearing, the shaft centerline, the orbits and the clearance circle. In that case, the orbit is displayed with its gap voltage component. This graph displays the full shaft motion for each bearing and provides a descriptive picture of the machine train within the bearing clearance.
1X and polar diagrams: start-up results for balancing
> 1X amplitude and phase is provided directly from the Synchyronous Order Analysis. It can be displayed in ORBIGate either in the main result grid, in Bode diagrams or in dedicated polar diagrams. The polar diagrams are displayed with all usual conventions: phase lag, shaft rotation direction, probe orientations, keyphasor position display. 1X results can also be exported into files for further processing.
SUB1X
> SUB1X allows tracking the vibration content in the subharmonic region. Many serious defects appear in that frequency band: in particular oil whip, oil whirl and rubbing. One should be able to follow that, even with a changing speed.
Fig7: The most common rotating machinery displays
Fig8: The Full Shaft Motion display
Fig9: A dedicated polar diagram
Fig7: The most common rotating
machinery displays
Fig10: The SUB1X parameter range

ORBIGate DATASHEET
M002-114-2 7
Fig13: Rotating machinery dedicated reports
Gap voltage reference
> Reference voltage should be determined in order to position the shaft position graphic relatively to the clearance circle. This can be done in several ways. For horizontal machines, the rotor is assumed to be laying on the bottom part of the bearing. For vertical machines (hydro turbines or vertical pumps), the assumption of having the rotor at the center can be taken. The reference measurement is typically achieved with the machine stopped.
Run out compensation
> Run out compensation can be processed based on a slow roll measurement. Slow roll position is selected either during measurement or in the navigation mode at a chosen time and speed. A run out correction order spectrum is derived from the selected measurement point. The correction is a vector compensation (amplitude and phase) and is applied to the test data.
Export and reporting
> Run-up, steady-state or shut down plotting sessions can be selected. Templates and legends are fully adapted to rotating machinery reports. Copy/paste or instant reporting can be used for any fast and manual reports. For large and standard reports, the full batch reporting feature is preferably used. Results can be exported to text or Microsoft Excel files.
A powerful and flexible plateform for your needs
ORBIGate runs on all 3-Series analyzers providing flexible choices of the hardware platform size.
> OR38: 8, 16, 24, 32 channels
> OR36: 4, 8, 12, 16 channels
> Mobi Pack: 4, 8, 12, 16 channels
> OR35 : 4, 6, 8 channels
> OR34 : 2, 4 channels The ORBIGate solution can also run in combination with the SmartRouter, the controller unit, allowing the system to be a fully stand-alone unit in the field. ORBIGate belongs to the comprehensive OROS Energy and Process industry product line. Other software modules such as torsion, balancing, structural (ODS and modal) and acoustics are provided on the same hardware platform.
Fig11: Setting-up a gap reference
Fig12: Run out slow roll selection raw and uncorrected
ORBIGate DATASHEET
M002-114-2 8
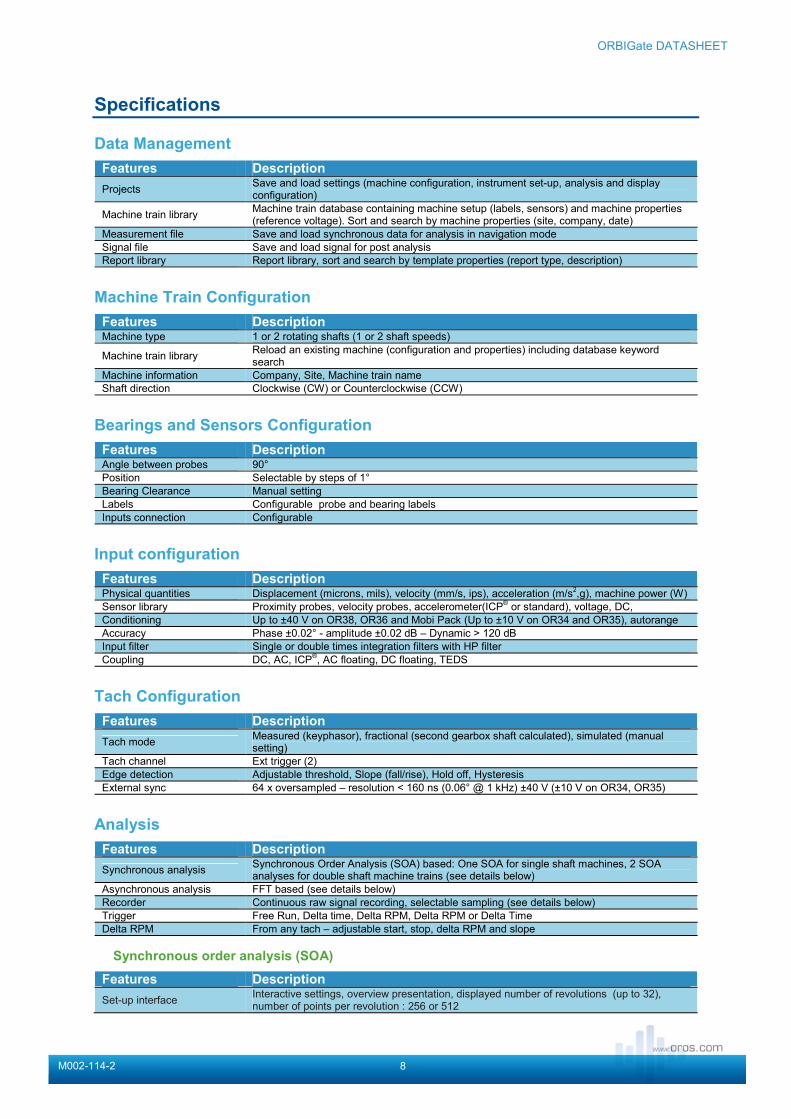
Specifications
Data Management
Features Description
Projects Save and load settings (machine configuration, instrument set-up, analysis and display configuration)
Machine train library Machine train database containing machine setup (labels, sensors) and machine properties (reference voltage). Sort and search by machine properties (site, company, date)
Measurement file Save and load synchronous data for analysis in navigation mode
Signal file Save and load signal for post analysis
Report library Report library, sort and search by template properties (report type, description)
Machine Train Configuration
Features Description Machine type 1 or 2 rotating shafts (1 or 2 shaft speeds)
Machine train library Reload an existing machine (configuration and properties) including database keyword search
Machine information Company, Site, Machine train name
Shaft direction Clockwise (CW) or Counterclockwise (CCW)
Bearings and Sensors Configuration
Features Description Angle between probes 90°
Position Selectable by steps of 1°
Bearing Clearance Manual setting
Labels Configurable probe and bearing labels
Inputs connection Configurable
Input configuration
Features Description Physical quantities Displacement (microns, mils), velocity (mm/s, ips), acceleration (m/s
2,g), machine power (W)
Sensor library Proximity probes, velocity probes, accelerometer(ICP® or standard), voltage, DC,
Conditioning Up to ±40 V on OR38, OR36 and Mobi Pack (Up to ±10 V on OR34 and OR35), autorange
Accuracy Phase ±0.02° - amplitude ±0.02 dB – Dynamic > 120 dB
Input filter Single or double times integration filters with HP filter
Coupling DC, AC, ICP®, AC floating, DC floating, TEDS
Tach Configuration
Features Description
Tach mode Measured (keyphasor), fractional (second gearbox shaft calculated), simulated (manual setting)
Tach channel Ext trigger (2)
Edge detection Adjustable threshold, Slope (fall/rise), Hold off, Hysteresis
External sync 64 x oversampled – resolution < 160 ns (0.06° @ 1 kHz) ±40 V (±10 V on OR34, OR35)
Analysis
Features Description
Synchronous analysis Synchronous Order Analysis (SOA) based: One SOA for single shaft machines, 2 SOA analyses for double shaft machine trains (see details below)
Asynchronous analysis FFT based (see details below)
Recorder Continuous raw signal recording, selectable sampling (see details below)
Trigger Free Run, Delta time, Delta RPM, Delta RPM or Delta Time
Delta RPM From any tach – adjustable start, stop, delta RPM and slope
Synchronous order analysis (SOA)
Features Description
Set-up interface Interactive settings, overview presentation, displayed number of revolutions (up to 32), number of points per revolution : 256 or 512

ORBIGate DATASHEET
M002-114-2 9
Type Time domain re-sampling and interpolation function of tachometer
Span / Resolution Max order 6.25X to 200X - 1 to 1/32 order resolution
Tracked orders 1 to 6 independent orders tracked per channels
Averaging Angular or order domain: exponential
Multiple pulse/rev 1 to 1024
Window Uniform
Capacity 1 or 2 SOA plug-ins with independent setups and tachometer. Independent from other analysis (FFT and Recorder)
Phase conventions Lag conventions, Phase display (0/360°, -180°/180°, or n rotations)
FFT
Features Description Bandwidths / Resolution DC to 40 kHz - 101 to 6401 lines
Window Hanning
Averaging Exponential
Overlap 0 – 99.9%
Overall analysis Low and High cut off frequency selection
Recorder
Features Description Dynamic channels throughput
Selectable recording sampling frequency (Up to 102.4 Ks/s). Independent from the measurement analysis settings.
Ext sync throughput Max throughput: 6.4 Mb/s (32 Ch. X 40 kHz). Records ext. synch at over sampled resolution.
Mode Multiple records on one file
Recording support On Hard Disk, On PC
Post analysis player Tracks update: Sensitivities, Units, Labels, Selectable playback speed
Displays
General
Features Description Multitrace and multigraph Plots can be multitrace (several bearing in the same plot, or several nX in the same plot),
or multigraph (several graph in the same window).
Windows management 1 to 16 layouts – 1 to 32 windows/layout/linked cursors between windows
Trace management Multitrace-Multigraph-Magnitude gathering
Zoom and translation Mouse driven X, Y or Z translation – Area/axis zoom, Adjustable X, Y, Z scale.
Scale Auto scale (continuous auto scale up), adjustable fixed scales by physical units
Markers / Cursors Dual cursors with Dx/Dy – peaks and max automatic detection (interpolated) – adjustable labels, sideband, harmonic, power band.
Display types
Features Description Acq. Post.
Nav
Scalar values grid Configurable grid view of synchronous results: GAP, GAP V, Overall (Pk-Pk, 0-Pk, RMS), nX Vectors (0.5X, 1X, 2X, 3X custom X) amplitude and phase, machine power (W), SMax, SUB1X
� �
RPM profile RPM vs. time (Absolute or Relative) � �
Overall orbit Overall on order range, configurable number of revolution, 256 or 512 points per rev. Selectable number of revs.
� �
Signal vs angle Synchronous order tracking time block (vs. revolutions), configurable number of revolutions
� �
nX orbit Synthesized out of the order tracking analyzer: 1x, 2x, 3x are default + 3 additional custom orders
� �
Shaft centerline DC (GAP) value display, reference gap voltage determination, RPM or time labels
� �
Full shaft motion Shaft centerline, Clearance circle, Orbits (Overall, nX) on the same plot. Reference voltage determination.
� �
Trend plot Overall (Pk-Pk, 0-Pk, RMS), Smax, SUB1X, nX (Amplitude), GAP,GAP Voltage, vs. time (absolute or relative), or vs. RPM
� �
Bode plot nX (amplitude and phase), overall vs. RPM, or vs. time (trend, absolute or relative), Selectable phase range (n rotations)
� �
Polar plot Oriented referenced to sensor positions, keyphasor position indication, shaft rotation
� �
Sync Order spectrum Order spectrum with selectable max order and resolution. Dedicated markers (free, harmonics, side band etc …).
� �

ORBIGate DATASHEET
M002-114-2 10
Sync Frequency spectrum Frequency spectrum with selectable max frequency and resolution. Dedicated markers (free, harmonics, side band etc …).
� �
Sync view-meters Configurable grid view: GAP, GAP V, Overall (Pk-Pk, 0-Pk, RMS), nX amplitude and phase vectors (0.5x, 1x, 2x, 3x, custom x) amplitude and phase, machine power (W), RPM – Display mode: Digital, Magnitude/Phase – Continuous with colored alarms
� �
Waterfall Sync frequency and order spectrum. 3D (orthogonal or isometric views) or Color spectrogram. Profile/Freq extraction views – Sections management - Spectra and side views displayed vs. index, time, or RPM as Z reference axis.
�
Cascade Sync frequency and order spectra, Async spectrum �
Recorded signal Raw signal vs. absolute or relative time �
Monitoring signal Front end signal � Shaft view Unwrapped signal view along shaft profile – polar cursors – direct angle
reading �
ASync frequency spectrum FFT based spectrum analysis for monitoring with no tach detection. �
ASync view- meters FFT based overall analysis for monitoring with no tach detection: Overall with (adjustable low and high cut off frequencies). RMS, Pk-Pk, 0-Pk, Max level, Min level, Crest factor
�
Analysis tools
Type Description Gap reference voltage Gap reference voltage determination for shaft centerline (0,0) initial position
Reference values edition Manual, measured, or saved in the measurement
Reference shaft positions Shaft at rest (bearing bottom), shaft at center
GAP Monitoring Allows to monitor and capture gap values even when no tach is detected (machine at rest)
Run-out correction (slow roll compensation)
Order vectors correction (complex (amplitude and phase) correction for all nX orders)
Navigation
Type Description Measurement replay Continuous replay, replay speed adjustment, by step forward/backward (icons or keys)
Cursors Master cursor for linked displays or window cursors for localized graph work
Range selection Start, stop selection. Reduce grid number function.
Reference values RPM for all shafts, Absolute and relative date.
Reporting
Type Description Template library Default template library, Customizable templates
Report template Microsoft Word® (2003, 2007, 2010) based
Batch reporting Produce a report with a predefined format (no need to display graphics to be reported)
Instant reporting Produce a report with windows displayed on the active layout
Manual reporting Copy/paste WMF
Import/Export
Type Export format Signal import (raw time) OROS wav – Audio wav (with frequency conversion) – UFF (58) – Txt
Export format CSV, Excel, Export whole measurement (or selected range), Export current grid
Export options Export per sensor or per result type
Preference and units
Type Metric / Imperial
Displacement microns, mils
Velocity inch/s, mm/s
Acceleration g, m/s2
Others Volts, Watt
ORBIGate
® is based on OROS 3-Series technology and benefits of NVGate
® display possibilities. Keyphasors
® is a registered
trademark of GE Energy/Bently Nevada. ICP® is a registered trademark of PCB Piezotronics. Windows XP, Vista and 7, Word
and Excel are trademarks of Microsoft Corp. NVGate® et ORBIGate
® are trademarks of OROS SA.

ORBIGate DATASHEET
M002-114-2 11
Ordering Information
The ORBIGate Solution can be ordered as a full license, as well as an office license allowing post analysis, or a simple reader license.
Reference Description ORNVS-ORBI 1 Full licence (Acquisition + Post Analysis + Navigation)
+ 1 Office licence (Post Analysis + Navigation) Features 1 full license to acquire measurements and signals as well as an office license.
ORNVS-ORBI-O 1 Office licence (Post Analysis + Navigation) Let the user post-process a signal and navigate through a measurement, in office mode.
ORNVS-ORBI-R 1 Reader license (Navigation) Allows navigating through a measurement in the navigation mode.
Examples of instrument configurations
Reference Description ORMP-ORBI-16 ORBIGate package – 16 ch Mobi Pack based Full options hardware package
OR38-ORBI-24 ORBIGate package – 24 ch OR38 based Full options hardware package
OR38-ORBI-32 ORBIGate package – 32 ch OR38 based Full options hardware package

ORBIGate DATASHEET
M002-114-2 12
OROS, Leadership through Innovation
About Us Now approaching 30-years in business, OROS’ designs and manufacturing have been renowned for providing the best in noise and vibration analyzers as well as in specific application solutions.
Our Philosophy Reliability and efficiency are our ambition everyday. We know you require the same for your measurement instruments: comprehensive solutions providing performance and assurance, designed to fit the challenges of your demanding world.
Our Emphasis Continuously paying attention to your needs, OROS collaborates with a network of proven scientific affiliates to offer the latest of the technology, always based on innovation.
Worldwide Presence OROS products are marketed in more than 35 countries, through our authorized network of representatives, offices and accredited maintenance centers.
Want to know more? OROS headquarters www.oros.com OROS Inc www.orosinc.com OROS French Sales Office www.orosfrance.fr OROS GmbH www.oros-deutschland.com OROS China www.oros.com