orange financial results - mediatheque.orange.com filedisclaimer this presentation may contain...
TRANSCRIPT
#Q3_2018 Orange financial results
Ramon Fernandez Deputy CEO, Finance, Performance and Europe
25 October 2018

Disclaimer
This presentation may contain forward-looking statements about Orange, particularly objectives and trends regarding Orange’s financial situation, investments, results of operations, business and strategy. These forward-looking statements do not represent forecasts within the meaning of European Regulation No. 809/2004 and although we believe they are based on reasonable assumptions, they are subject to numerous risks and uncertainties, including matters not yet known to us or not currently considered material by us, and there can be no assurance that anticipated events will occur or that the objectives set out will actually be achieved. More detailed information on the potential risks that could affect our financial results is included in the Registration Document filed on April 4, 2018 with the French Autorité des Marchés Financiers (AMF) and in the annual report on Form 20-F filed on April 4, 2018 with the U.S. Securities and Exchange Commission. Forward-looking statements speak only as of the date they are made. Other than as required by law, Orange does not undertake any obligation to update them in light of new information or future developments.
2 2

Section one Q3 2018 highlights
4
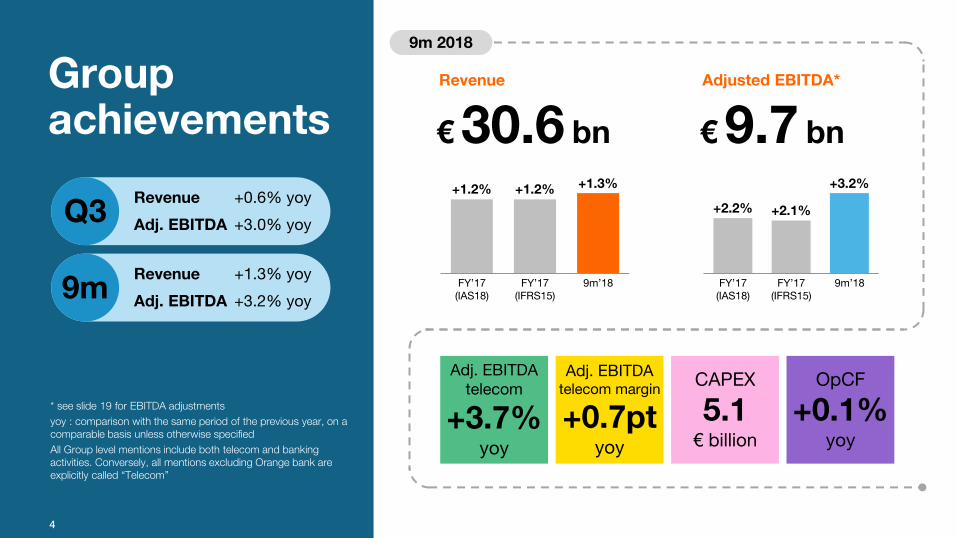
€ 30.6 bn
Revenue
€ 9.7 bn
Adjusted EBITDA*
Adj. EBITDA telecom
+3.7% yoy
Adj. EBITDA telecom margin
+0.7pt yoy
CAPEX
5.1 € billion
OpCF
+0.1% yoy
Group achievements
+1.2% +1.2% +1.3%
FY’17 (IAS18)
FY’17 (IFRS15)
9m’18
+2.2% +2.1%
+3.2%
FY’17 (IAS18)
9m’18 FY’17 (IFRS15)
* see slide 19 for EBITDA adjustments
yoy : comparison with the same period of the previous year, on a comparable basis unless otherwise specified
All Group level mentions include both telecom and banking activities. Conversely, all mentions excluding Orange bank are explicitly called “Telecom”
9m Revenue +1.3% yoy
Adj. EBITDA +3.2% yoy
Q3 Revenue +0.6% yoy
Adj. EBITDA +3.0% yoy
9m 2018
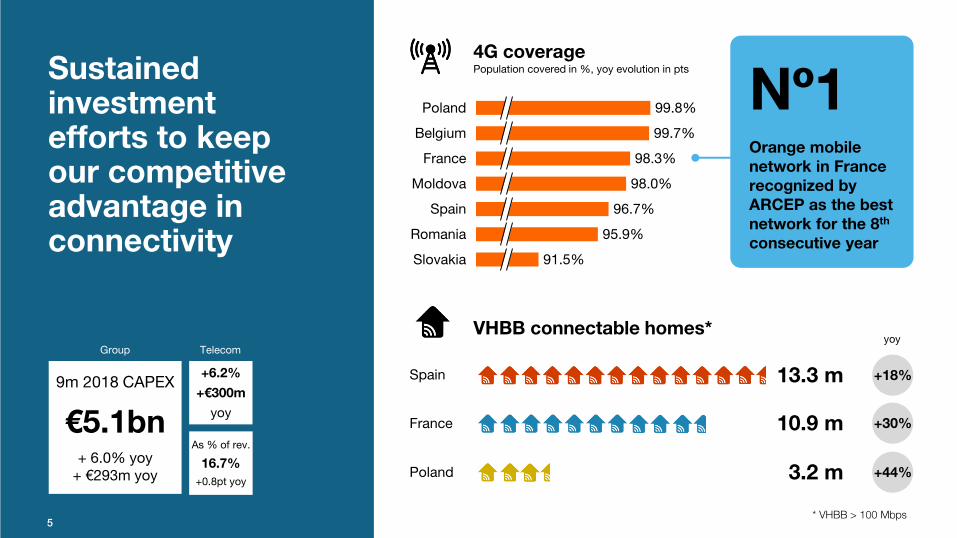
Sustained investment efforts to keep our competitive advantage in connectivity
5
9m 2018 CAPEX
€5.1bn
+ 6.0% yoy + €293m yoy
+6.2%
+€300m
yoy
4G coverage Population covered in %, yoy evolution in pts
VHBB connectable homes*
Spain 13.3 m +18%
France 10.9 m +30%
Poland 3.2 m +44%
yoy
As % of rev.
16.7%
+0.8pt yoy
Telecom
* VHBB > 100 Mbps
98.0%
98.3%
Slovakia
99.7%
95.9%
France
Spain
Romania
96.7%
91.5%
99.8%
Belgium
Moldova
Poland Nº1 Orange mobile network in France recognized by ARCEP as the best network for the 8th consecutive year
Group
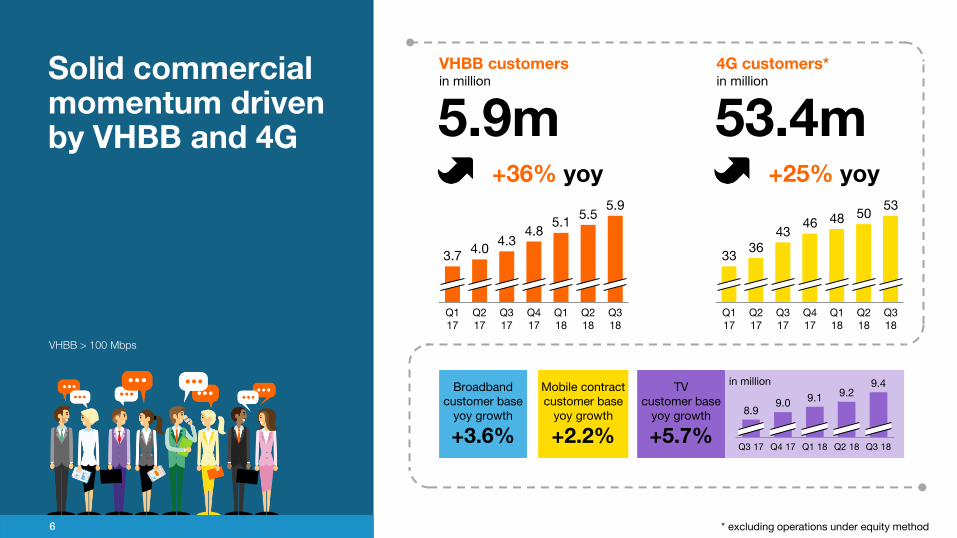
5.9m
6
VHBB customers in million
53.4m
4G customers* in million
Broadband customer base
yoy growth
+3.6%
Mobile contract customer base
yoy growth
+2.2%
TV customer base
yoy growth
+5.7%
+36% yoy +25% yoy
Solid commercial momentum driven by VHBB and 4G
* excluding operations under equity method
VHBB > 100 Mbps
Q1 18
Q4 17
5.5
3.7
Q1 17
Q2 17
Q3 17
Q2 18
4.0
Q3 18
4.3
5.1
5.9
4.8
Q3 17
Q4 17
48 50 53
36
Q2 17
Q1 17
Q1 18
Q2 18
46
Q3 18
43
33
in million
9.0
Q1 18 Q3 17 Q4 17 Q2 18 Q3 18
9.4
8.9
9.2 9.1
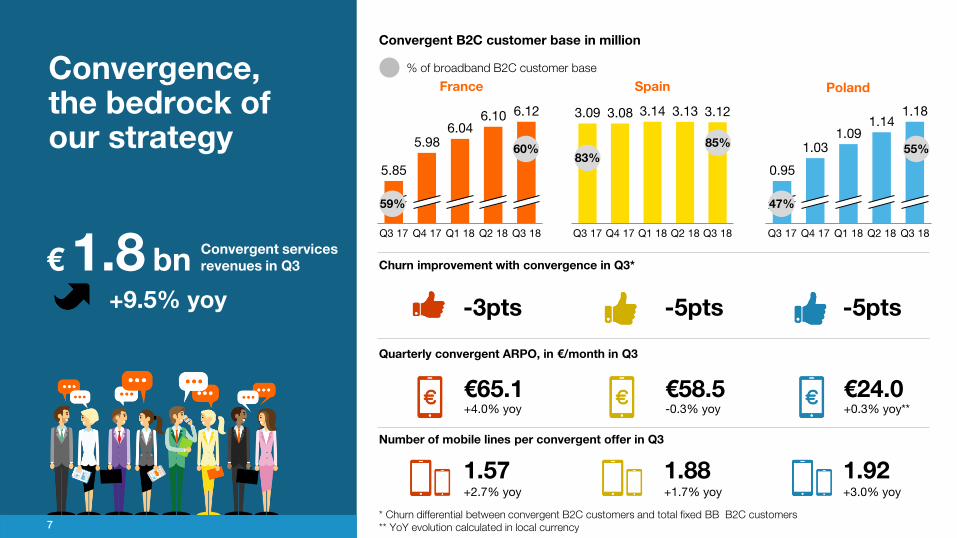
Convergence, the bedrock of our strategy
7
Convergent B2C customer base in million
Churn improvement with convergence in Q3*
Quarterly convergent ARPO, in €/month in Q3
Number of mobile lines per convergent offer in Q3
-3pts -5pts -5pts
* Churn differential between convergent B2C customers and total fixed BB B2C customers ** YoY evolution calculated in local currency
6.10
Q3 17 Q4 17 Q1 18 Q2 18 Q3 18
5.85
5.98 6.04
6.12
Q3 17
3.08 3.13
Q4 17 Q3 18
3.09
Q1 18 Q2 18
3.14 3.12
Q1 18 Q3 17 Q4 17
0.95
Q2 18 Q3 18
1.03 1.09
1.14 1.18
France Spain Poland
60% 85%
55%
% of broadband B2C customer base
1.88 +1.7% yoy
1.92 +3.0% yoy
1.57 +2.7% yoy
59%
83%
47%
€65.1 +4.0% yoy
€58.5 -0.3% yoy
€24.0 +0.3% yoy**
€ 1.8 bn Convergent services revenues in Q3
+9.5% yoy

Section two Business review

Q3 2018 France Strong Retail services growth driven by convergent services
Revenue evolution (in €m)
+109
+19
Mobile only
4,533
Convergent Q3 17 cb
-15
Broadband only
-55
PSTN
-18
Wholesale, Equipment
& Other
Q3 18
4,572
Retail services excl. PSTN +5.0% yoy
9
Mobile only ARPO Quarterly ARPO in €
Broadband only ARPO Quarterly ARPO in €
Q4 17 Q2 18
65.1 65.1
Q3 17
62.5 63.8
64.8
Q1 18 Q3 18
+1.2€
17.3
Q3 17
Q4 17
Q1 18
17.2
16.9
17.2 17.2
Q3 18
Q2 18
+0.3€
38.7
Q4 17
39.0 39.0
Q2 18
Q3 17
39.0
Q3 18
37.8
Q1 18
+0.5€
Convergent B2C ARPO Quarterly ARPO in € ePresse/Audio Book
ePresse/Audio Book ePresse/Audio Book
*B2C only
in €m Q3 18 yoy cb 9m 18 yoy cb Revenues 4,572 +0.9% 13,524 +1.2%
Retail services 2,755 +2.1% 8,238 +2.4%
Convergent services* 1,126 +10.7% 3,322 +12.3%
Mobile only services 587 -2.5% 1,770 -2.1%
Fixed only services 1,041 -3.4% 3,146 -4.0%
Fixed only broadband 644 +3.1% 1,925 +1.9%
Fixed only narrowband 397 -12.2% 1,221 -12.0%
Wholesale 1,355 -2.2% 3,970 -2.1%
Equipment sales 349 +2.6% 959 +4.3%
Other revenues 114 +2.5% 355 +2.8%
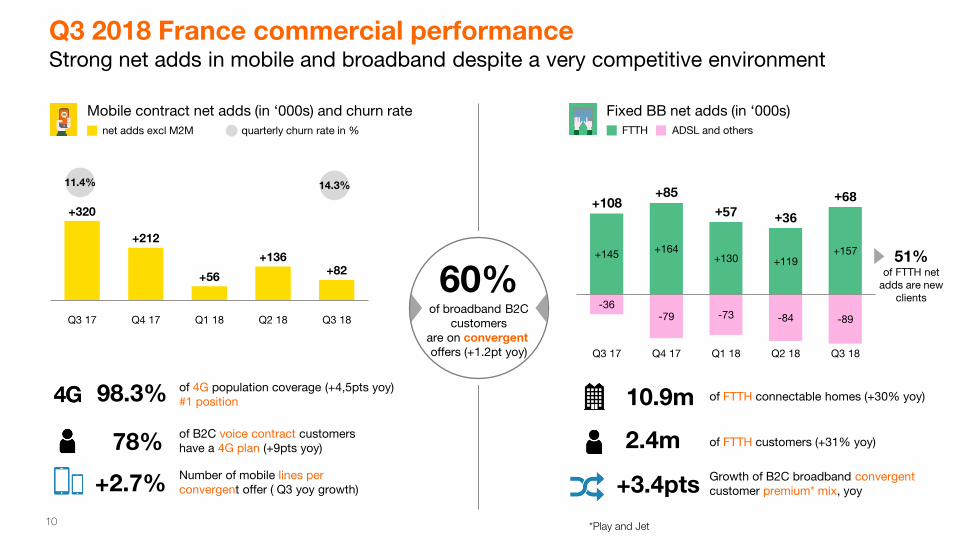
51% of FTTH net
adds are new clients
FTTH ADSL and others
+320
+212
+56
+136 +82
Q1 18 Q2 18 Q4 17 Q3 17 Q3 18
Q3 2018 France commercial performance Strong net adds in mobile and broadband despite a very competitive environment
+145 +164 +130 +119
+157
-36 -79 -73 -84 -89
+108
Q1 18 Q3 17 Q4 17 Q2 18 Q3 18
+57
+85
+36
+68
Mobile contract net adds (in ‘000s) and churn rate
14.3%
Fixed BB net adds (in ‘000s)
net adds excl M2M quarterly churn rate in %
of B2C voice contract customers have a 4G plan (+9pts yoy) 78% Number of mobile lines per convergent offer ( Q3 yoy growth) +2.7%
of FTTH connectable homes (+30% yoy) 10.9m
Growth of B2C broadband convergent customer premium* mix, yoy +3.4pts
of FTTH customers (+31% yoy) 2.4m
*Play and Jet
98.3% of 4G population coverage (+4,5pts yoy) #1 position
11.4%
60% of broadband B2C
customers are on convergent offers (+1.2pt yoy)
10

Q3 2018 Spain Fixed Broadband net-adds back to positive trend supported by FTTH and the success of football offers
11
FTTH net adds in ‘000s
Broadband net adds in ‘000s
685
Q3 18 Q1 18 Q3 17 Q4 17 Q2 18
593
626 641 639
+15%
TV customer base in ‘000s and yoy growth in %
-11
-16 -13
-16
+13
Q3 18 Q1 18 Q3 17 Q4 17 Q2 18
85% Convergence as % of broadband B2C customer base
66% Fiber penetration in BB customer base
60% 4G penetration in mobile customer base
17% TV penetration in BB customer base
+16pts yoy
+2pts yoy
+3pts yoy
+2pts yoy
in €m Q3 18 yoy cb 9m 18 yoy cb Revenues 1,340 +0.5% 3,974 +2.2%
Retail services 973 -0.2% 2,893 +1.7%
Convergent services* 539 +0.8% 1,603 +3.6%
Mobile only services 309 -1.9% 918 -0.8%
Fixed only services 125 -0.9% 370 +0.2%
Wholesale 211 +6.4% 582 +3.8%
Equipment sales 155 -2.1% 499 +3.0%
*B2C only
+137
+175 +169
+135
+158
Q3 17 Q4 17 Q2 18 Q1 18 Q3 18
FTTH net adds leadership in Spain
Q3 Revenue growth excl. MTR impact
+1.4% yoy
Market leader in terms of 4G customers 4G
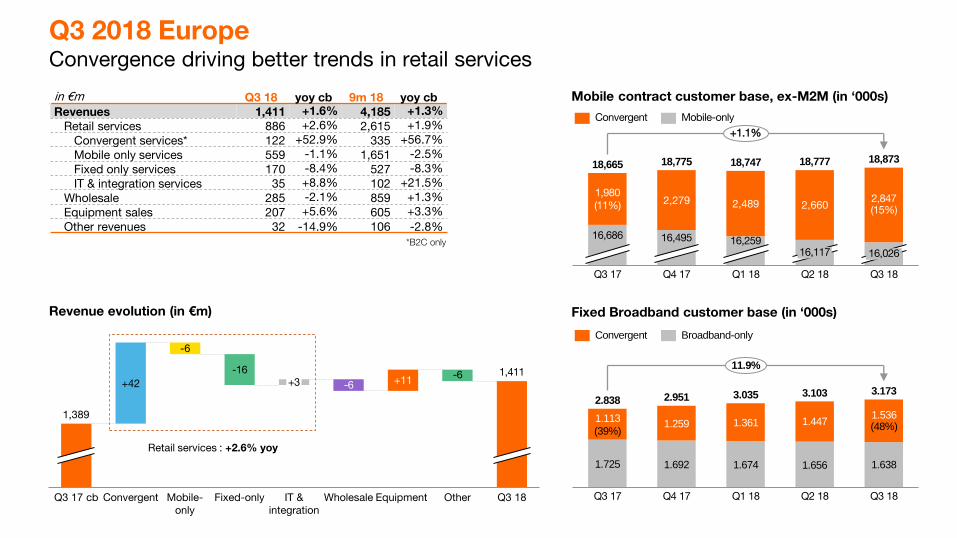
Q3 2018 Europe Convergence driving better trends in retail services
Revenue evolution (in €m)
+42 +11
Q3 17 cb
-16
Convergent Mobile-only
-6
Fixed-only
+3
IT & integration
-6
Wholesale Equipment
-6
Other Q3 18
1,389
1,411
Retail services : +2.6% yoy
Fixed Broadband customer base (in ‘000s)
Mobile contract customer base, ex-M2M (in ‘000s)
1.674
Q1 18
1.113
(39%) 1.259
1.725
Q4 17 Q3 17
1.361
1.692
1.447
1.656
Q2 18
1.536 (48%)
1.638
3.035
Q3 18
3.173 2.838 2.951 3.103
11.9%
Convergent Broadband-only
2,279 2,489 2,660
16,686
Q3 17
16,117
16,495 16,259 16,026
Q4 17 Q1 18 Q2 18
2,847 (15%)
Q3 18
1,980 (11%)
18,665 18,775 18,747 18,777 18,873
+1.1%
Convergent Mobile-only
*B2C only
in €m Q3 18 yoy cb 9m 18 yoy cb Revenues 1,411 +1.6% 4,185 +1.3%
Retail services 886 +2.6% 2,615 +1.9%
Convergent services* 122 +52.9% 335 +56.7%
Mobile only services 559 -1.1% 1,651 -2.5%
Fixed only services 170 -8.4% 527 -8.3%
IT & integration services 35 +8.8% 102 +21.5%
Wholesale 285 -2.1% 859 +1.3%
Equipment sales 207 +5.6% 605 +3.3%
Other revenues 32 -14.9% 106 -2.8%

Q3 2018 Africa & Middle East Continued revenue growth sustained by solid Retail dynamic
13
Retail services and Wholesale contribution to revenue growth rate
Orange Money customers** In million, yoy growth in %
Q1 18
38.7
Q3 17 Q4 17 Q2 18 Q3 18
32.1
34.1
36.7
40.2 +25%
13.6
of growth coming from
new operations*
~1/3
active customers
** Incl. the changes in customer base accounting * Namely DRC, Burkina Faso, Liberia and Sierra Leone
in €m Q3 18 yoy cb 9m 18 yoy cb Revenues 1,310 +3.7% 3,834 +5.0%
Retail services 1,079 +6.7% 3,148 +7.6%
Mobile only services 964 +6.5% 2,821 +8.1%
Fixed only services 113 +7.3% 318 +2.5%
IT & integration services 2 +82.6% 9 +85.9%
Wholesale 204 -11.7% 607 -8.3%
Equipment sales 18 +16.8% 58 +35.2%
Other revenues 9 +62.3% 22 -2.5%
0.1pt
4.9pt
6.8pt 6.2pt 5.4pt
-2.2pt -1.3pt -1.1pt
-2.1pt
0.3pt 0.6pt
FY 17 Q1 18 Q2 18
0.5pt
Q3 18
Other
Retail
Wholesale
3.0%
6.2%
5.2% 3.7%
15.1m 4G customers** +57%
yoy

Q3 2018 Enterprise Underlying revenue stabilizing, with growth for IT&IS, and data and voice under pressure
Mobile contract net adds excl.M2M (mostly France) in ‘000s
+16% yoy Cyberdefense YTD revenue growth
+10% yoy Cloud YTD revenue growth
+32
+24 +22
+46
+31
Q4 17 Q3 17 Q1 18 Q3 18 Q2 18
+21
-32
+1
Q3 17 cb Q3 18 Mobile only
+1
Wholesale Equipment sales
-31
Fixed only IT & IS
1,825
1,785
Revenue evolution (in €m)
Mobile*
Voice & Data
*Mobile = Mobile Only Services + Equipment Sales + Wholesale
in €m Q3 18 yoy cb 9m 18 yoy cb Revenues 1,785 -2.2% 5,314 -0.7%
Fixed only services 992 -3.0% 2,988 -2.7%
Voice 342 -5.1% 1,040 -3.8%
Data 650 -1.9% 1,948 -2.1%
IT & integration services 561 +4.0% 1,610 +4.7%
Mobile* 232 -11.8% 716 -4.0%
14
Stable excl. the significant equipment contract in Q3 17

Section three 2018 guidance

Short and mid-term guidance
2018 2019-2020
Adjusted EBITDA Higher growth rate vs 2017 Growth
CAPEX €7.4bn (peak) Decrease
Operating Cash Flow * Higher growth rate vs 2017 Growth
Net debt / Adjusted EBITDA (telecom) Around 2x in the medium term
Dividend €70 cent** ( +€5 cent)
New floor of €70 cent
* Adjusted EBITDA – CAPEX ** Subject to shareholders’ approval *** ex-date December 4th, record date December 5th, payment date December 6th
December 6th, 2018*** 2018 interim of €0.30
16

Appendices
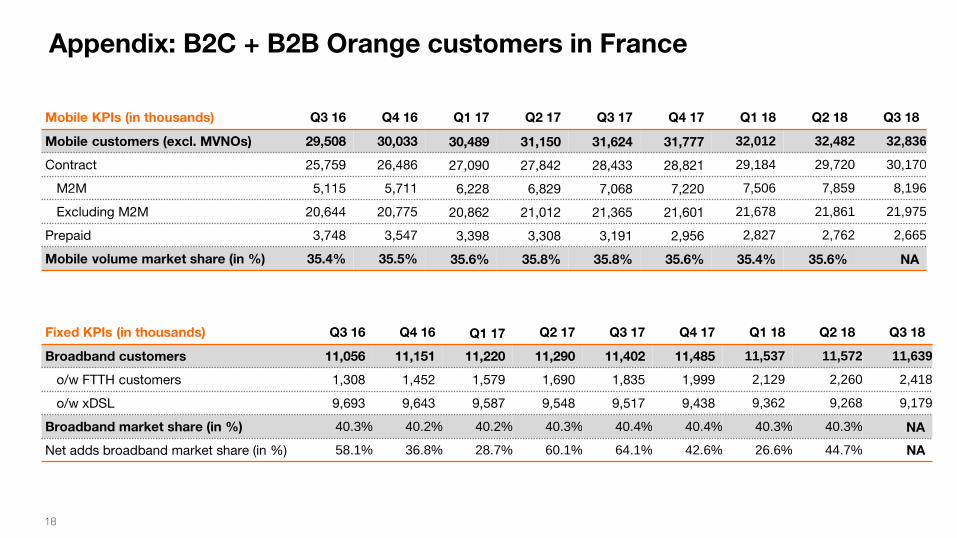
Appendix: B2C + B2B Orange customers in France
Mobile KPIs (in thousands) Q3 16 Q4 16 Q1 17 Q2 17 Q3 17 Q4 17 Q1 18 Q2 18 Q3 18
Mobile customers (excl. MVNOs) 29,508 30,033 30,489 31,150 31,624 31,777 32,012 32,482 32,836
Contract 25,759 26,486 27,090 27,842 28,433 28,821 29,184 29,720 30,170
M2M 5,115 5,711 6,228 6,829 7,068 7,220 7,506 7,859 8,196
Excluding M2M 20,644 20,775 20,862 21,012 21,365 21,601 21,678 21,861 21,975
Prepaid 3,748 3,547 3,398 3,308 3,191 2,956 2,827 2,762 2,665
Mobile volume market share (in %) 35.4% 35.5% 35.6% 35.8% 35.8% 35.6% 35.4% 35.6% NA
Fixed KPIs (in thousands) Q3 16 Q4 16 Q1 17 Q2 17 Q3 17 Q4 17 Q1 18 Q2 18 Q3 18
Broadband customers 11,056 11,151 11,220 11,290 11,402 11,485 11,537 11,572 11,639
o/w FTTH customers 1,308 1,452 1,579 1,690 1,835 1,999 2,129 2,260 2,418
o/w xDSL 9,693 9,643 9,587 9,548 9,517 9,438 9,362 9,268 9,179
Broadband market share (in %) 40.3% 40.2% 40.2% 40.3% 40.4% 40.4% 40.3% 40.3% NA
Net adds broadband market share (in %) 58.1% 36.8% 28.7% 60.1% 64.1% 42.6% 26.6% 44.7% NA
18

EBITDA adjustments
in €m Q3 17 cb Q3 18 9m 17 cb 9m 18
Adjusted EBITDA 3,581 3,687 9,372 9,671
restructuring and integration -15 -74 -77
litigations -6 -61 -38
labour related -29 -91 -87 -115
o\w Senior Part Time -29 -91 -106 -115
portfolio review and others - - - -
Reported EBITDA 3,552 3,574 9,151 9,440
19