oral presentationniewgraph summary: the nasa gleru1 research
TRANSCRIPT

Oral PresentationNiewgraph Summary:
The NASA Gleru1 Research Center (GRC) has been testing high efficiency free-piston Stirling convertors for potential use in radioisotope power systems since 1999. Stirling convertors are being operated for many years to demonstrate a radioisotope power system capable of providing reliable power for potential multi-year missions. Techniques used to monitor the convertors for change in performance include measurements of temperature, pressure, energy addition, and energy rejection. Micro-porous bulk insulation is used in the Stirling convertor test set up to minimize the loss of thermal energy from the electric heat source to the envirorunent. The insulation is characterized before extended operation, enabling correlation of the net thermal energy addition to the convertor. Aging microporous bulk insulation changes insulation efficiency, introducing errors in the correlation for net thermal energy addition. A thin-mm heat flux sensor was designed and fabricated to directly measure the net thermal energy addition to the Stirling convertor. The fabrication techniques include slip casting and using Physical Vapor Deposition (PVD). One micron thick noble metal thermocouples measure temperature on the surface of an Alumina ceramic disc and heat flux is calculated. Fabrication, integration, and test results of a thinfilm heat flux sensor arc presented.
https://ntrs.nasa.gov/search.jsp?R=20120016444 2018-02-19T01:00:52+00:00Z

· ~ .
Fabrication and Testing of a Thin-Film Heat Flux Sensor for a Stirling Convertor
Sest, Illc.
AIAA 173859
presented at the 2009 IECEC
by
Scott D. Wilson
Sest, Inc.
Middleburg Heights, OH
August 4, 2009
Glenn Research Center at Lewis Field
• Introduction - Stirling convertor testing
- Heat flux sensor purpose
• Thermal Analysis - Assumptions and results
• Fabrication - Ceramic substrates
Outline
- Thin-film thermocouple deposition
• Component testing - Thermal and load testing
- Output signal characterization
• System Integration - Sensor subassembly signal checkout
- Wire soldering
- Cold junction compensation scheme
- Heat flux calculation
- Installation and use
Sest, Illc. Glenn Research Center at Lewis Field 2
'- .
Stirling Convertor Testing
• GRC Stirling Supporting Technology Development Effort Consists of tasks in areas of
• Reliability • Convertor testing
• High-temperature materials
• Structures • Advanced analysis
• Organics • Permanent magnets
Convertor testing and performance data • Data used to monitor convertors for change in performance include
• Temperature
• Pressure • Piston position • Energy addition
============. __ E_n_e_rg_y __ re_je_c_ti_o_n _____________________________________ ,~ Glenn Research Center at Lewis Field ~ Sest, Inc.

. - .
Net Heat Input
• Why measure heat flux? Micro-porous bulk insulation is used to minimize thermal energy losses from electric heat source to environment
• Insulation is characterized before extended operation, enabling correlation of net thermal energy addition to the convertor
• Aging microporous bulk insulation changes insulation efficiency, introducing errors in the correlation for net thermal energy addition
Heat flux sensor proposed to directly measure heat transfer from heat source to Stirling convertor heat collector
• Thin-film heat flux sensor was designed and fabricated to directly measure the net thermal energy addition to the Stirling convertor
Sest, Illc. Glenn Research Center at Lewis Field

Thermal Analysis Setup
• FEA used to simulate heat transfer in the assembly Estimate temperatures of the assembly • Heat source, heat collector, heat flux sensor
• Determine temperature distribution on the face of the sensor
Boundary conditions nickel alumina heat fI ux sensor • Red = Heat input from cartridge heaters
• Blue = Constant temperature
• Gray = Adiabatic
• Insulation losses neglected
Material properties • Nickel 201 (f"of Temp)
• Alumina (fn of Temp)
- Mesh
• Mesh independence study performed
Sest, Inc.
heat source
nickel spacer discs
Glenn Research Center at Lewis Field
nickel heat collector
5

Thermal Analysis Results • Heat flux sensor assembly
Red surface
Gross heat input
CW)
300 315-
Heater max temperatures = 818 °C
Heat flux sensor temperatures for conditions expected during Stirling operation
• Face max temperature spread ::::: 30 °C
• Only 3 "C spread across heat transfer area, remaining temperature spread is in area where wire attachments are made
• Sensor faces have good uniform temperature distribution uniformity
Blue HFS face Cheater HFS face CStirling Sensor heat surface side) side) transfer
Constan Max Min Ave Max Min Ave Net heat
t input
temp temp temp temp temp temp temp
("e) ("e) C°C) ("C) COe) ("e) C°C) CW)
630 746 715 737 721 689 698 217 630 751 720 743 725 692 702 227
heat
heat fiux
330 630 758 724 749 730 695 705 237 Heat source side
345 630 764 728 754 735 698 708 248 Heat collector side
' ...... (c-..)
." .. .. ,. '" , rn ,~
'" ,~
m
'" no
'" ,., .., ... '" ... '" ... • »
"' ,~ (Celsius)
no
'" n.
'"" 1ST . 'so '50 TOT TO, TO" reg
". "., T2T n, n. m ,u "" T07
"'. '00
Temperature gradients shown •
==-------- .. Glenn Research Center at Lewis Field
360 630 770 733 760 739 700 712 258 -allticipated operating point
Sest, Inc. 6

,- .
Fabrication • Fabrication
Pt-Rh13% films were
peeling
Ceramic fabrication - slipcasting • bisque firing, fully sintering, finish machining, and
measuring the ceramic thermophysical properties
Thin-film fabrication - Physical Vapor Deposition and parallel gap welding
• One-micron-thick thin-film thermocouples deposited onto ceramic substrate, small diameter noble metal wires welded onto thin-films
• .,/ •
alumina ceramic substrates
Pt vs. Pt-Rh13% on mullite substrate Investigated early in program
completed Au VS . Pt sensor Au VS . Pt sensor with .003 inch dia. wires
Sest, Illc. Glenn Research Center at Lewis Field 7
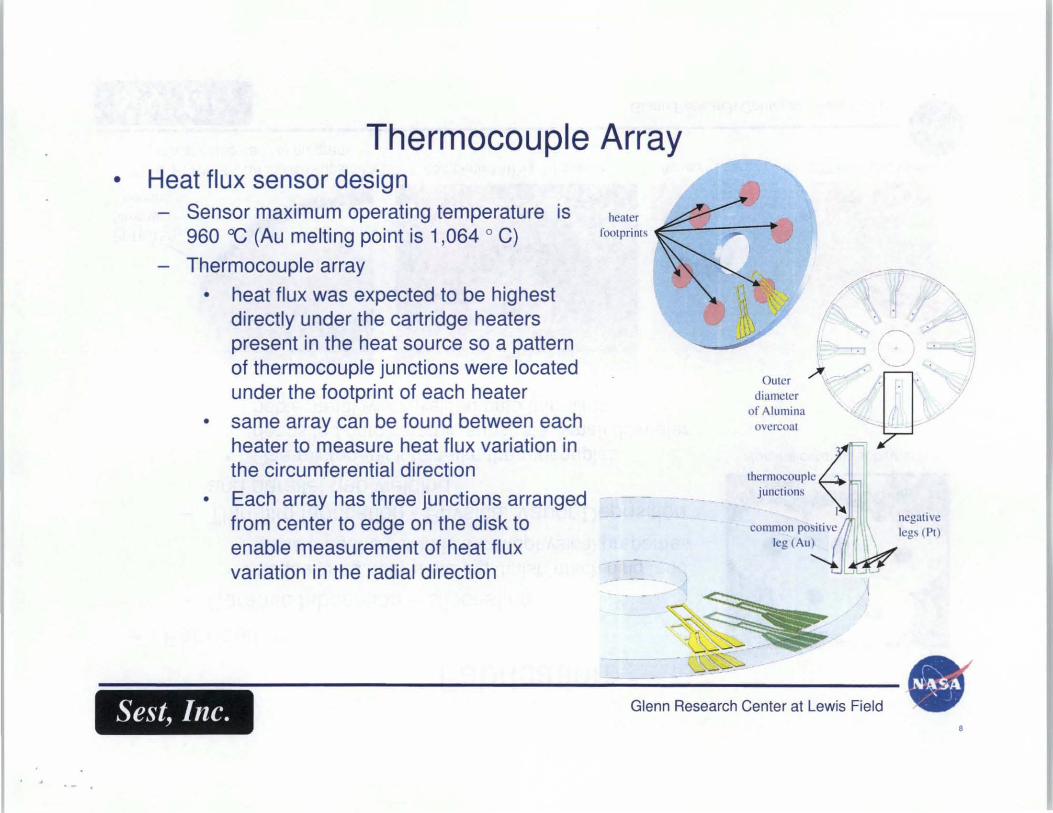
Thermocouple Array • Heat flux sensor design
Sensor maximum operating temperature is heater
960 "c (Au melting point is 1 ,064 0 C) footprints
Thermocouple array
• heat flux was expected to be highest directly under the cartridge heaters present in the heat source so a pattern of thermocouple junctions were located under the footprint of each heater
• same array can be found between each heater to measure heat flux variation in the circumferential direction
• Each array has three junctions arranged from center to edge on the disk to enable measurement of heat flux variation in the radial direction
. -
A-/
( ...;. (~ , ---
"~~~~. '\ -t J thermocouple / I
Juncl>ons ~ .. I I negative
common posItive ,II \ legs (Pt) leg (Au) / II II ~
Sest, Illc. Glenn Research Center at Lewis Field 8

Thermal and Load Component Testing
• Thermal and load testing Performed to characterize the survivability and identify areas of improvement for design and/or fabrication techniques Test Results
• Maximum temperature change rate tested provides a 100% margin over the 0.25 OC/sec expected in Stirling test
• Maximum load tested provides about a 60% margin over the 300 Ib load expected in Stirling test
Indentified • Need to control the spacer geometry more
closely in order to minimize contact resistance and prevent rough surfaces from damaging the thin films on the sensor
• Need for additional layer of aluminum oxide deposited on nickel spacers and sensor to electrically insulate the thermocouple array and provide protection against chemical reaction
ComponentTest Rig
Load assemblL and heat sou/ce
Test article
Simulated Stirling heat collecto ~ and coolingjacke~
==--------~ Glenn Research Center at Lewis Field ~ Sest, Inc.
9

Sensor Bench Top Test Setup
• Purpose Performed to characterize the stability and repeatability of the Au VS. Pt thin-film thermocouples fabricated at GRC and to test the proposed data acquisition process
Test setup includes Au vs. Pt thin-film and small diameter wire thermocouple, heater, and cold junction thermocouple
Au vs. Pt thin-film thermocouple
Au vs . Pt wire reference
thermocouple ceramic paste
------•• -------+-1 alumina substrate • i
Q; Qj • .§ :; E C .!11 .0, <{
B
'" Q) Ol .s "0 > ~
E Q)
!. ........................ fl~~r .. I~~~I~:'~~...... .......... U •••••••• • U • • J~~~tl;:~::~::~:::r: ... ; Au & Pt wire - - - - - - - - Bench top Test Setup •
=========cgu~e~xt~en~s~ion~w~ir~e~::::=-_______________________________________________ • •
Glenn Research Center at Lewis Field Sest, Illc. 10

• Results Results
Bench Top Test Results
50 to 450 "C, then allowed to cool to 50 "C before another thermal cycle was automatically performed, 15 thermal cycles completed
• LabVIEW recorded emf voltages at scan frequency of 2 seconds • 39,000 data points collected • Maximum temperature difference of 9 'C between thin-film and wire
thermocouples, probably due to thermal resistance of ceramic paste • Residuals computed for heat up periods only • Maximum temperature variation did not exceed ±3.S m"C
emf Output forAu vs. ptThin-rtlm Thermocouple and Au vs. Pt .003" Diameter Wire Thermocouple
6.000 ,-------------
5.000 - 39,OOOdala poinls, ----./--:;"""" '--~ 4.000 - 15 Ihennal cycles ___ =,~ __ ,; ./ !t 3,000 I-------./--:;"""'~----~ 2,000 f------""---,..,,,..~------
1.000 1--.---- -:0000-""----------0"--"""'-----------
o 100 200 300 400 500
Rererence Temperature, °c - reference wire themlOcouple -thin-film themlOcou ple
4
3
u 2 °E I ,;; '0 0 , ~ - I • 0: -2
-3
-4
0
Au vs. Pt Thin-Film Thermocouple Output Residuals
100 200 300 400
ReferenceTemperature, OC
500
Ocyc1e I
Dcycle 2
Acycle 3
XcycJe4
x cycle 5
e cycle6
1" cycle 7
• cycle 8
- cycle9
o cycle 10
o cycle 11
A cycle J 2
cycle 13
cycle 14
cycle 15
Sest, Inc. Glenn Research Center at Lewis Field
"

System Integration
• Integration tasks Sensor signal checkout of subassembly - complete Wire soldering to custom feed through
• Small diameter Au and Pt wires soldered to larger Cu extension wire to get signal to data acquisition system
• Feed through used to get signal out of argon environment
Cold junction compensation for all signals Heat Flux Calculation
• Currently using simple averaging scheme based on assumption of uniform temperature distribution across heat transfer area of sensor
• Could apply area weighted scheme (or other) to calculate heat flux through sensor
Installation and testing • To be installed and tested in ASC-E #1 and #4 test
setup in 2009
Custom wire feed through
ASC-E #1 and #4 Test Setup
Sest, Illc. Glenn Research Center at Lewis Field 12
Summary • Purpose
- Heat flux sensor designed and fabricated for use in Stirling convertor testing
• Analysis and component testing performed to characterize parts in heat flux sensor assembly - Provided insight into how to fabricate and how the sensor will perform
• Techniques for fabrication of ceramic substrates and thin-film thermocouple
• System Integration outlined - Sensor subassembly signal checkout - complete
- Wire soldering - complete
- Cold junction compensation scheme- complete
- Heat flux calculation - complete
- Installation and use - scheduled for Aug/Sept 2009
============~-----------------------------G-I-en-n-R-es-e-ar-Ch-c-e-nt-e-ra-t -Le-W-iS-F-ie-ld- ·<IIIr Sest, Illc.
13

Acknowledgements
• Thermal Energy Conversion Branch - Nissim Lugasy, Terry Jansen, Wayne Gerber
• Sensors and Instrumentation Branch - Gus Fralick, John Wrbanek, Charles Blaha
• Ceramics Branch - Ali Sayir, Tom Sabo
Sest, Illc. "
==--_____ AItr' Glenn Research Center at Lewis Field ~

" ,
Sest, Illc.
Questions?
Glenn Research Center at Lewis Field 15

.. .
NIST Reference Functions • NIST Au VS. Pt Reference Functions
Investigation quantified the stability and reproducibility of Au vs. Pt thermocouples
•
Wire thermocouple used for characterization
Reference functions Convert voltage to temperature for Au vs. Pt thermocouples
Inverse functions to convert temperature to voltage for cold junction compensation
Sest, Inc.
I S.OOO > 16.000 =. 14.000 ~ 12.000 l! 10 000 o . > S.OOO "[ 6,000
~ 4.000 2.000
o
NlST: Au vs. PI Thermocouple Output Volatage aod Seebeck Coemcient
I I
I I ~ I ~ ---. / , :/ ...,. ./'
, V ...,. Stirling. heal nux sensor ~ -- operating (emperature.~
30 :.> -25 > =.
20 i ~
' 0; 15 ::
10 8 '"
5 ] ~
o Jl o 200 400 600 SOO 1000
Tempera ture, C
Glenn Research Center at Lewis Field 16