oral health and dental care in australia
TRANSCRIPT

Oral health and dental care in Australia Key facts and figures 2015
This report is the latest in the Oral health and dental care in Australia: key facts and figures suite of printed publications and web products. It presents the most recent key information on the oral health and dental care of the Australian population. Between 1994 and 2013, there was an overall increase in the proportion of people who were uncomfortable about their dental appearance, from 20% to nearly 27%. The proportion who reported experiencing a toothache over the previous 12 months increased from around 11% to 16% over the same period.
Oral health and dental care in Australia: key facts and figures 2015
AIH
W


Australian Institute of Health and Welfare Canberra
Cat. no. DEN 229
Oral health and dental care in Australia
Key facts and figures
2015

The Australian Institute of Health and Welfare is a major national agency which provides reliable, regular and relevant information and statistics
on Australia’s health and welfare. The Institute’s mission is authoritative information and statistics to promote better health and wellbeing.
© Australian Institute of Health and Welfare and the University of Adelaide 2016
This product, excluding the AIHW logo, Commonwealth Coat of Arms and any material owned by a third party or protected by a trademark, has been released under a Creative Commons BY 3.0 (CC-BY 3.0) licence. Excluded material owned by third parties may include, for example, design and layout, images obtained under licence from third parties and signatures. We have made all reasonable efforts to identify and label material owned by third parties.
You may distribute, remix and build upon this work. However, you must attribute the AIHW as the copyright holder of the work in compliance with our attribution policy available at <www.aihw.gov.au/copyright/>. The full terms and conditions of this licence are available at <http://creativecommons.org/licenses/by/3.0/au/>.
A complete list of the Institute’s publications is available from the Institute’s website <www.aihw.gov.au>.
ISBN 978-1-74249-883-6 (PDF) ISBN 978-1-74249-884-3 (Print)
Suggested citation AIHW: Chrisopoulos S, Harford JE & Ellershaw A 2016. Oral health and dental care in Australia: key facts and figures 2015. Cat. no. DEN 229. Canberra: AIHW.
Australian Institute of Health and Welfare Board Chair Dr Mukesh C Haikerwal AO
Acting Director Mr Andrew Kettle
Any enquiries about copyright or comments on this publication should be directed to: Digital and Media Communications Australian Institute of Health and Welfare GPO Box 570 Canberra ACT 2601 Tel: (02) 6244 1000 Email: [email protected]
Published by the Australian Institute of Health and Welfare This publication is printed in accordance with ISO 14001 (Environmental Management Systems) and ISO 9001 (Quality Management Systems). The paper is sourced from sustainably managed certified forests.
Please note that there is the potential for minor revisions of data in this report. Please check the online version at <www.aihw.gov.au> for any amendments.

iii
Contents Acknowledgments............................................................................................................................... v
Abbreviations ...................................................................................................................................... vi
Summary ............................................................................................................................................. vii
1. Introduction .................................................................................................................................... 1
Oral health ....................................................................................................................................... 1
Use of dental services .................................................................................................................... 2
Hospital separations ...................................................................................................................... 2
Financial barriers ............................................................................................................................ 2
Private health insurance ................................................................................................................ 3
Expenditure ..................................................................................................................................... 3
Dental workforce ............................................................................................................................ 3
2 Oral health ...................................................................................................................................... 4
2.1 Caries experience of children ................................................................................................ 4
2.2 Caries experience of adults .................................................................................................... 8
2.3 Periodontal disease ............................................................................................................... 11
2.4 Tooth retention and loss ....................................................................................................... 12
2.5 Social impact .......................................................................................................................... 17
3 Use of dental services ................................................................................................................. 24
3.1 Time since last dental visit ................................................................................................... 24
3.2 Reason for last dental visit ................................................................................................... 27
3.3 Type of practice visited at last dental visit ........................................................................ 30
3.4 Dental visiting patterns for adults ...................................................................................... 34
3.5 Dental services received ....................................................................................................... 36
3.6 Fissure sealants in children .................................................................................................. 41
4 Hospitalisations ........................................................................................................................... 43
4.1 Potentially preventable hospital separations .................................................................... 43
4.2 Hospital separations for oral health procedures involving general anaesthetic ......... 49
5 Financial barriers ......................................................................................................................... 51
6 Private health insurance ............................................................................................................. 59
7 Use of private health insurance ................................................................................................ 61
8 Expenditure .................................................................................................................................. 62
9 Dental workforce ......................................................................................................................... 66

iv
9.1 Size and distribution of the dental workforce .................................................................. 66
9.2 Characteristics of employed dentists ................................................................................. 67
9.3 Dental specialists ................................................................................................................... 70
Appendix A: Data collections used in this report ........................................................................ 71
Child Dental Health Survey........................................................................................................ 71
National Survey of Adult Oral Health ...................................................................................... 72
Health expenditure data .............................................................................................................. 72
National Dental Telephone Interview Survey ......................................................................... 73
National Health Workforce Data Set ......................................................................................... 74
National Hospital Morbidity Database ..................................................................................... 77
Appendix B: Data tables for figures ............................................................................................... 78
Appendix C: Confidence intervals for estimates in tables ......................................................... 87
Glossary .............................................................................................................................................. 111
References .......................................................................................................................................... 113
List of tables ...................................................................................................................................... 114
List of figures .................................................................................................................................... 120

v
Acknowledgments The authors wish to acknowledge all those who contributed to the data collections used in this report. Authors in the AIHW’s Expenditure and Workforce Unit contributed the sections on expenditure and workforce and provided comment and advice on the overall report.
This research was supported by the Department of Health.

vi
Abbreviations AHPRA Australian Health Practitioner Regulation Agency
AIHW Australian Institute of Health and Welfare
CDHS Child Dental Health Survey
CI confidence interval
dmft the count of deciduous teeth that are decayed (d), missing due to caries (m) and filled due to caries (f)
DMFT the count of permanent teeth that are decayed (D), missing due to caries (M) and filled due to caries (F)
ICD-10-AM International Statistical Classification of Diseases and Related Health Problems, tenth revision, Australian modification
NDTIS National Dental Telephone Interview Survey
NRAS National Registration and Accreditation Scheme
NSAOH National Survey of Adult Oral Health
PPH potentially preventable hospitalisation
SDS school dental service
States and territories
NSW New South Wales
Vic Victoria
Qld Queensland
WA Western Australia
SA South Australia
Tas Tasmania
ACT Australian Capital Territory
NT Northern Territory
Symbols — nil or rounded to zero
. . not applicable
n.a. not available

vii
Summary This report presents the most recent key information on the oral health and dental care of the Australian population.
Oral health In 2010, 55% of 6-year-olds had experienced decay in their baby (deciduous) teeth and 48% of 12-year-olds had experienced decay in their permanent teeth. These data do not include data for New South Wales or Victoria.
In 2013, 16% of adults with natural teeth had experienced toothache in the previous 12 months and 27% reported feeling uncomfortable about their dental appearance. Adults who were uninsured (20%), and those who were eligible for public dental care (20%), were more likely to have experienced toothache than other adults.
In 2013, approximately 19% of adults aged 65 and over had no natural teeth. The proportions were similar for females (21%) and males (17%). Of those aged 65 and over with natural teeth, nearly half (42%) wore dentures.
Use of dental services In 2013, 64% of people aged 5 and over had visited a dental practitioner in the previous year. Almost half (44%) of adults aged 18 and over had regular dental check-ups with the same dental provider (a favourable visiting pattern). The rate of potentially preventable hospitalisations due to dental conditions was lowest for Major cities (2.6 per 1,000 people) and highest for Very remote (4.0 per 1,000 people).
Paying for dental services In 2013, half (50%) of people aged 5 and over had some level of private health insurance with dental cover. More people living in Major cities (53%) had insurance than in Inner regional (45%) and Outer regional areas (44%). People living in lower income households were less likely to have dental insurance than those in higher income households.
In 2013, most (77%) adults with some level of health insurance that covered dental made co-contributions towards the cost of dental visits. One (1) in 10 insured adults (10%) paid all their own expenses. Of these, approximately 19% reported that this caused a large financial burden.
Total expenditure on dental services (except those in hospitals) in Australia was $8,706 million in 2012–13, an increase from $5,945 million (adjusted for inflation) in 2002–03. The largest source of funds for this overall dental expenditure was individuals, paying directly out of pocket for 58% of total dental costs.
Dental workforce Overall, in 2013, there were approximately 56 dentists, 5 dental prosthetists, 5 dental hygienists, 3 dental therapists and 3 oral health therapists employed per 100,000 people. The majority of dentists (90%) were general dentists and the remainder were specialists. Across remoteness areas, Major cities had the highest number per 100,000 population of practising dentists (63.1) and Remote/Very remote areas had the lowest (25.7).


Oral health and dental care in Australia: key facts and figures 2015 1
1. Introduction This report summarises the latest key findings on the state of oral health of the Australian population and key trends in dental care. Data were sourced from surveys managed by the Australian Research Centre for Population Oral Health and from data sets maintained by the Australian Institute of Health and Welfare (AIHW). Topics in this report are described below. Some data have been previously reported, but are included here so that a comprehensive picture is presented that uses the latest available data. Data sources used in this report are described in detail at Appendix A.
Oral health This report presents data on the dental caries (tooth decay) experience and periodontal (gum) health of children attending public school dental services derived from Child Dental Health Survey (CDHS) data. The most recent year for which data are available is 2010. This publication also reports on the oral health of adults from the National Survey of Adult Oral Health (NSAOH) 2004–06 and the National Dental Telephone Interview Survey (NDTIS). Results from the NSAOH have been published previously. The most recent year for which data from the NDTIS are available is 2013, and these data are published for the first time in this release.
Dental caries Deciduous caries experience (dmft) is recorded as the number of deciduous (‘baby’) teeth that are either decayed (d), missing (m) because of dental caries or filled (f) because of dental caries. It is based on the World Health Organization protocol (WHO 1997), with additional guidelines from Palmer et al. (1984). These results have been updated from the CDHS 2010.
Permanent caries experience (DMFT) is recorded as the number of permanent teeth that are either decayed (D), missing (M) because of dental caries, or filled (F) because of dental caries, and is also based on the WHO protocol (WHO 1997). These results have been updated from the CDHS 2010.
Periodontal disease Periodontal status is based on the definition used by the Centers for Disease Control and Prevention, which defines periodontal disease using a combination of deep periodontal pockets, clinical attachment loss and the number of sites affected (Page & Eke 2007). These results are from the NSAOH 2004–06.
Tooth loss About 90% of all tooth loss can be attributed to dental caries and periodontal disease (AHMAC 2001). Tooth loss occurs primarily because of a treatment decision to extract one or more teeth. Teeth are usually extracted because of extensive disease precluding other treatments, the preference of the patient and the recommendation of the dentist (Slade et al. 2007). Measures of tooth loss include prevalence of complete tooth loss (edentulism) and the average number of missing teeth. These results are from the NSAOH 2004–06.

2 Oral health and dental care in Australia: key facts and figures 2015
Health impacts Dental problems may result in the experience of pain, avoidance of certain foods and a feeling of discomfort about appearance. The social impacts of these experiences may include withdrawal behaviours or a reduced ability to participate in certain activities. These results have been updated from the NDTIS 2013.
Use of dental services Many factors influence how often people use dental services. The reason a person seeks dental care influences the type of care they are likely to receive and the level of untreated problems they may have at any time. People who visit a dental professional for a routine check-up are most likely to benefit from early detection and treatment and receive preventive services. Those who seek care for a dental problem may receive less comprehensive treatment and are less likely to receive preventive services. Generally, people who seek regular and routine care report low levels of extractions and relatively low levels of fillings (Ellershaw & Spencer 2011).
Comparisons of the use of dental services—including time since last visit, usual visiting pattern and type of practice last visited—are presented by age, sex, insurance status and annual household income. These results have been updated from the NDTIS 2013.
Hospital separations Potentially preventable hospitalisations (PPHs) are those conditions where hospitalisation is thought to have been avoidable if timely and adequate non-hospital care had been provided. PPHs therefore have potential as indicators of the quality or effectiveness of non-hospital care. A high rate of PPHs may indicate an increased prevalence of the conditions in the community, poorer functioning of the non-hospital care system or an appropriate use of the hospital system to respond to greater need (AIHW 2012).
Hospitalisations where the principal diagnosis was a dental-related condition are considered dental PPHs for this report. The rate of these PPHs for adults and children is reported in this publication. These results have been updated to 2012–13.
Financial barriers Financial burden is often cited as a reason why people do not seek regular dental care or comply with recommended treatment (AIHW 2014). Financial burden reflects the direct and indirect cost of dental services to the individual, the disposable income of a household and the number of people dependent on that income. Respondents to the NDTIS were asked a range of questions relating to the financial burden of dental care. These questions included whether they had avoided or delayed dental care due to cost, whether cost had prevented dental treatment recommended by a dental professional, whether dental visits in the previous 12 months had been a large financial burden, and what level of difficulty they would experience in paying a $200 dental bill. The cost of a basic preventive dental-care package was originally selected as the threshold for measuring the level of difficulty in paying a dental bill. In 2012, the Australian Dental Association Dental Fees Survey reported that the mean cost for a dental visit comprising a dental examination, two bitewing X-rays

Oral health and dental care in Australia: key facts and figures 2015 3
and a scale and clean service was approximately $200. These results have been updated to the NDTIS 2013.
Private health insurance In Australia, coverage of dental costs by private health insurance is based on individuals or families purchasing a health insurance policy, which covers all or part of the cost of visiting a private dentist. This report provides information on the proportion of Australian adults who were covered by private health insurance that included cover for dental care in the 2013 NDTIS, and their use of dental services. These results have been updated to the NDTIS 2013.
Expenditure Expenditure on dental services is reported from the AIHW health expenditure database 2012–13. It includes expenditure on a range of services provided by registered dental practitioners as well as oral and maxillofacial surgery items, orthodontic, pedodontic and periodontic services, cleft lip and palate services; dental assessment and treatment; and other dental items listed in the Medicare Benefits Schedule. Hospital costs are not included.
Dental workforce The dental workforce—consisting of registered dentists, dental therapists, dental hygienists, oral health therapists and dental prosthetists—plays a vital role in maintaining and improving the oral health of Australians by providing preventive and restorative dental services. This report provides an overview of the characteristics of the dental workforce. These results have been updated to the National Health Workforce Data Set 2013.

4 Oral health and dental care in Australia: key facts and figures 2015
2 Oral health
2.1 Caries experience of children Caries experience describes the number of teeth that have been affected by tooth decay. Children are affected by decay if teeth are decayed (d), missing (m) due to caries or filled (f) because of caries. Decay can occur in either their deciduous teeth (dmft) or their permanent teeth (DMFT). The combined caries experience (dmft + DMFT) indicates the total amount of disease seen in children attending a school dental service (SDS).
In 2010, the proportion of children with caries experience (dmft + DMFT >0)—in either their deciduous or permanent teeth—varied from 48.2% for children aged 5 to 68.7% for children aged 9 (Table 2.1). (These data do not include data from New South Wales or Victoria.)
Table 2.1: Prevalence of deciduous and permanent caries experience (dmft + DMFT >0) by age, children attending a school dental service, 2010 (per cent)
Age (years)
5 6 7 8 9 10 11 12
dmft + DMFT >0 48.2 56.6 60.3 66.5 68.7 66.1 57.4 57.0
Notes
1. The 95% confidence intervals for these estimates are available in Appendix Table C2.1.
2. New South Wales was excluded from the data collection due to a lack of representativeness of the sample.
3. Data from Victoria were not available.
Source: Child Dental Health Survey 2010.
The average number of deciduous teeth with decay experience for children attending an SDS varied between 1.78 for children aged 10 and 2.63 for children aged 8. Decay experience was lowest for children aged 10, as fewer deciduous teeth remain at this age.
Children aged 5 and 6 had higher rates of untreated decay than older children (1.83 and 1.74 teeth, respectively), while numbers of filled teeth were highest for children aged 8 and 9 (1.29 and 1.28 teeth, respectively) (Table 2.2).
Table 2.2: Number of deciduous teeth with caries experience by age, children attending a school dental service, 2010 (average)
Age (years) Decayed teeth (d) Missing teeth (m) Filled teeth (f) dmft
5 1.83 0.15 0.34 2.32
6 1.74 0.22 0.62 2.58
7 1.37 0.21 0.95 2.53
8 1.15 0.19 1.29 2.63
9 1.02 0.14 1.28 2.43
10 0.67 0.08 1.03 1.78
Notes
1. Total dmft may not equal the sum of parts due to rounding.
2. The 95% confidence intervals for these estimates are available in Appendix Table C2.2.
3. New South Wales was excluded from the data collection due to a lack of representativeness of the sample.
4. Data from Victoria were not available.
Source: Child Dental Health Survey 2010.

Oral health and dental care in Australia: key facts and figures 2015 5
The proportion of children with decay experience in their deciduous teeth varied from 47.7% for children aged 5 to 62.4% for children aged 8 (Table 2.3).
Table 2.3: Prevalence of deciduous caries experience (dmft >0) by age, children attending a school dental service, 2010 (per cent)
Age (years)
5 6 7 8 9 10
dmft >0 47.7 55.1 57.5 62.4 63.0 54.2
Notes
1. The 95% confidence intervals for these estimates are available in Appendix Table C2.3.
2. New South Wales was excluded from the data collection due to a lack of representativeness of the sample.
3. Data from Victoria were not available.
Source: Child Dental Health Survey 2010.
Decay experience in permanent teeth was associated with age, varying from 0.13 for children aged 6 to 2.63 for children aged 15 (Table 2.4). This reflects both the higher number of permanent teeth in older children and the longer time they have been exposed to the risk of decay.
The average number of teeth with untreated decay ranged from 0.11 in children aged 6 to 1.41 for those aged 15, while the average number of filled teeth ranged from 0.01 in children aged 6 to 1.16 in children aged 15.
Table 2.4: Number of permanent teeth with caries experience by age, children attending a school dental service, 2010 (average)
Age (years) Decayed teeth (D) Missing teeth (M) Filled teeth (F) DMFT
6 0.11 — 0.01 0.13
7 0.22 — 0.04 0.26
8 0.28 0.01 0.13 0.43
9 0.38 0.02 0.26 0.66
10 0.41 0.02 0.30 0.73
11 0.50 0.02 0.43 0.95
12 0.74 0.06 0.54 1.34
13 0.89 0.05 0.72 1.66
14 1.28 0.08 1.00 2.37
15 1.41 0.06 1.16 2.63
Notes
1. Total DMFT may not equal the sum of parts due to rounding.
2. The 95% confidence intervals for these estimates are available in Appendix Table C2.4.
3. New South Wales was excluded from the data collection due to a lack of representativeness of the sample.
4. Data from Victoria were not available.
Source: Child Dental Health Survey 2010.

6 Oral health and dental care in Australia: key facts and figures 2015
The proportion of children with decay experience in their permanent teeth was also associated with age, ranging from 7.0% for children aged 6 to 64.1% for children aged 14 (Table 2.5). The association between caries prevalence and age reflects the length of time teeth have been exposed to factors putting them at risk of decay.
Table 2.5: Prevalence of permanent caries experience (DMFT >0) by age, children attending a school dental service, 2010 (%)
Age (years) DMFT >0
6 7.0
7 14.9
8 21.7
9 30.7
10 32.9
11 38.6
12 48.3
13 51.9
14 64.1
Notes
1. Missing teeth scores were based on missing teeth because of pathology recorded at clinical examination.
2. The 95% confidence intervals for these estimates are available in Appendix Table C2.5.
3. New South Wales was excluded from the data collection due to a lack of representativeness of the sample.
4. Data from Victoria were not available.
Source: Child Dental Health Survey 2010.
Deciduous decay experience in children aged 6 attending an SDS decreased from 3.19 in 1978 to 1.45 in 1996, followed by a gradual increase to 2.58 in 2010. The overall caries experience of children aged 12 followed a similar pattern, decreasing from 4.79 in 1977 to 0.84 in 2000, and then increasing, with some fluctuation, to 1.34 in 2010 (Figure 2.1; Appendix Table B2.1).

Oral health and dental care in Australia: key facts and figures 2015 7
Notes
1. From 1977 to 1988, data are from the Australian School Dental Scheme evaluation. From 1989, data are from the Child Dental Health Survey.
2. New South Wales data were excluded from the data collection from 2001 due to lack of representativeness of the sample.
3. Data have not been available from Victoria since 2005.
Source: Appendix Table B2.1.
Figure 2.1: Average dmft (at age 6) and DMFT (at age 12), Australia, 1977 to 2010

8 Oral health and dental care in Australia: key facts and figures 2015
2.2 Caries experience of adults In 2004–2006 (the latest period for which data are available), average DMFT scores for adults were higher for older age groups, ranging from 3.17 for the 15–24 age group to 23.70 for those aged 65 and over. For people aged 15–64, filled teeth contributed the most to the DMFT score. For those aged 65 and over, missing teeth contributed the most to the DMFT score (Table 2.6).
Table 2.6: Number of permanent teeth with caries experience by age, dentate people aged 15 and over, 2004–2006 (average)
Age (years) Decayed (D) Missing (M) Filled (F) DMFT
15–24 0.62 0.60 1.96 3.17
25–44 0.74 1.55 6.05 8.33
45–64 0.50 7.27 12.07 19.84
65+ 0.44 12.85 10.40 23.70
All people aged 15 and over 0.61 4.55 7.69 12.85
Notes
1. Missing teeth scores were based on missing teeth because of pathology recorded at clinical examination.
2. Total DMFT may not equal the sum of parts due to rounding.
3. The 95% confidence intervals for these estimates are available in Appendix Table C2.6.
Source: National Survey of Adult Oral Health 2004–2006.
In 2004–2006, males had a higher number of teeth with untreated decay than females (0.70 and 0.51, respectively). Females had more teeth that had been treated with a filling (8.14 and 7.24, respectively) (Table 2.7).
People living in Inner regional areas had the highest DMFT, at 14.75 teeth. Filled teeth contributed the most to DMFT in all remoteness areas, contributing the most to DMFT in Major cities, at 61.8%. Inner regional areas had the highest average number of teeth missing due to decay.
Uninsured people had a higher number of teeth with untreated decay and teeth missing due to decay, with a lower number of filled teeth. The pattern of more teeth that have been filled, but fewer teeth with untreated decay or missing teeth for insured people, is consistent with their receiving more timely dental care.
Total DMFT was associated with household income. The three lowest household income groups all had a higher average DMFT score than the four highest household income groups. The number of teeth missing due to decay was highest in the lowest household income group, and lowest for higher household income groups. These estimates are not age standardised.

Oral health and dental care in Australia: key facts and figures 2015 9
Table 2.7: Number of permanent teeth with caries experience by selected characteristics, dentate people aged 15 and over, 2004–2006 (average)
Decayed (D) Missing (M) Filled (F) DMFT
Sex
Male 0.70 4.47 7.24 12.42
Female 0.51 4.64 8.14 13.29
Remoteness area
Major cities 0.54 4.16 7.61 12.31
Inner regional 0.78 5.80 8.17 14.75
Outer regional 0.68 4.98 7.40 13.06
Remote/Very remote 0.97 3.68 6.40 11.07
Insurance status
Insured 0.38 4.17 8.99 13.54
Uninsured 0.81 5.04 6.79 12.64
Eligibility for public dental care
Eligible 0.86 7.58 7.39 15.83
Ineligible 0.52 3.51 7.81 11.84
Annual household income ($)
<12,000 1.06 11.02 7.66 19.74
12,000–<20,000 0.89 9.59 7.98 18.45
20,000–<30,000 0.55 7.21 8.36 16.11
30,000–<40,000 0.79 5.17 8.45 14.41
40,000–<60,000 0.68 3.97 8.22 12.87
60,000–<80,000 0.50 2.82 7.56 10.89
80,000–<100,000 0.41 3.07 8.11 11.59
100,000+ 0.43 2.64 7.77 10.84
Notes
1. Total DMFT may not equal the sum of parts due to rounding.
2. The 95% confidence intervals for these estimates are available in Appendix Table C2.7.
3. These estimates are not age standardised.
Source: National Survey of Adult Oral Health 2004–2006.
The proportion of people with untreated decay was highest for adults aged 25–44 (28.5%) and lowest for people aged 65 and over (21.8%) (Table 2.8).
Table 2.8: Prevalence of untreated decay, dentate people aged 15 and over, 2004–2006 (%)
Age (years)
15–24 25–44 45–64 65+ All people
Untreated decay
24.4 28.5 23.8 21.8 25.5
Note: The 95% confidence intervals for these estimates are available in Appendix Table C2.8.
Source: National Survey of Adult Oral Health 2004–2006.

10 Oral health and dental care in Australia: key facts and figures 2015
A higher proportion of males had untreated decay (28.2%) than females (22.7%) (Table 2.9).
The proportion of people with untreated decay ranged from 23.5% in Major cities to 37.6% in Remote/Very remote areas.
Table 2.9: Prevalence of untreated decay by sex and remoteness area, dentate people aged 15 and over, 2004–2006 (%)
Sex Remoteness area
Male Female Major cities Inner regional Outer regional Remote/
Very remote
Untreated decay 28.2 22.7 23.5 29.8 30.4 37.6
Note: The 95% confidence intervals for these estimates are available in Appendix Table C2.9.
Source: National Survey of Adult Oral Health 2004–2006.
A higher proportion of uninsured people (31.1%) had untreated decay than insured people (19.4%). Similarly, a higher proportion of people eligible for public dental care had untreated decay (32.9%) than those who were ineligible (22.9%) (Table 2.10).
Table 2.10: Prevalence of untreated decay by insurance status and eligibility for public dental care, dentate people aged 15 and over, 2004–2006 (%)
Insurance status Public dental care eligibility
Insured Uninsured Eligible Ineligible
Untreated decay 19.4 31.1 32.9 22.9
Note: The 95% confidence intervals for these estimates are available in Appendix Table C2.10.
Source: National Survey of Adult Oral Health 2004–2006.
Overall, the proportion of people with untreated decay was higher at lower levels of household income. The highest proportion was for people living in households earning less than $12,000 per year (35.4%), while the lowest was for people living in households earning $100,000 or more per year (16.5%) (Table 2.11).
Table 2.11: Prevalence of untreated decay by annual household income, dentate people aged 15 and over, 2004–2006 (%)
Annual household income ($)
<12,000 12,000– <20,000
20,000– <30,000
30,000– <40,000
40,000– <60,000
60,000– <80,000
80,000– <100,000 100,000+
Untreated decay 35.4 35.1 23.6 28.9 31.0 22.3 22.2 16.5
Note: The 95% confidence intervals for these estimates are available in Appendix Table C2.11.
Source: National Survey of Adult Oral Health 2004–2006.
Between 1987–88 and 2004–06, the average decay experience in adults decreased from 14.94 teeth to 12.85 teeth. The decrease in the average number of teeth with caries experience was due to the decline in the average number of teeth with untreated decay (from 1.47 to 0.61 teeth) and the average number of missing teeth due to caries (from 5.70 to 4.55) (Table 2.12).

Oral health and dental care in Australia: key facts and figures 2015 11
Table 2.12: Number of permanent teeth with caries experience, dentate people aged 15 and over, 1987–88 and 2004–2006 (average)
Year Decayed (D) Missing (M) Filled (F) DMFT
1987–88 1.47 5.70 7.77 14.94
2004–06 0.61 4.55 7.69 12.85
Note: The 95% confidence intervals for these estimates are available in Appendix Table C2.12.
Sources: National Oral Health Survey, Australia 1987–88; National Survey of Adult Oral Health 2004–2006.
2.3 Periodontal disease Periodontal disease (or periodontitis) is the inflammation of tissues surrounding the tooth. It affects the gums, ligaments and the bones, and is caused by bacterial infection. This inflammation can cause pockets or gaps to develop between the tooth and its surrounding gum and the loss of ligaments and bone that support the tooth. In severe forms of periodontal disease, there can be extensive loss of the bone that supports the tooth, resulting in the tooth becoming loose and even being lost.
In 2004–2006, the prevalence of moderate or severe periodontal disease was higher at older ages and varied from 2.7% for those aged 15–24 to 53.4% at age 65 and over (Table 2.13).
Table 2.13: Prevalence of moderate or severe periodontal disease by age, dentate people aged 15 and over, 2004–2006 (%)
Age (years)
15–24 25–44 45–64 65+ All people
Periodontal disease 2.7 15.3 35.3 53.4 22.9
Note: The 95% confidence intervals for these estimates are available in Appendix Table C2.13.
Source: National Survey of Adult Oral Health 2004–2006.
Males were one-and-a-half times more likely than females to have moderate or severe periodontal disease (26.8% compared with 19.0%) (Table 2.14).
People in Major cities had the lowest occurrence of periodontal disease (22.1%) while those from Remote/Very remote areas had the highest (36.3%).
Table 2.14: Prevalence of periodontal disease by sex and remoteness, dentate people aged 15 and over, 2004–2006 (%)
Sex Remoteness area
Male Female
Major cities Inner regional Outer regional Remote/
Very remote
Periodontal disease 26.8 19.0 22.1 23.0 28.5 36.3
Note: The 95% confidence intervals for these estimates are available in Appendix Table C2.14.
Source: National Survey of Adult Oral Health 2004–2006.

12 Oral health and dental care in Australia: key facts and figures 2015
A lower proportion of insured (19.4%) than uninsured (27.0%) people had periodontal disease. Similarly, those eligible for public dental care had higher rates of periodontal disease (33.6%) than those ineligible for public care (19.5%) (Table 2.15).
Table 2.15: Prevalence of periodontal disease by insurance status and eligibility for public dental care, dentate people aged 15 and over, 2004–2006 (%)
Insurance status Public dental care eligibility
Insured Uninsured Eligible Ineligible
Periodontal disease 19.4 27.0 33.6 19.5
Note: The 95% confidence intervals for these estimates are available in Appendix Table C2.15.
Source: National Survey of Adult Oral Health 2004–2006.
The proportion of people with periodontal disease was lower for higher household income groups. It varied from 42.3% for people in households earning less than $12,000 per year to 14.3% for people in households earning $100,000 or more per year (Table 2.16).
Table 2.16: Prevalence of periodontal disease by annual household income, dentate people aged 15 and over, 2004–2006 (%)
Annual household income ($)
<12,000 12,000– <20,000
20,000– <30,000
30,000– <40,000
40,000– <60,000
60,000– <80,000
80,000– <100,000 100,000+
Periodontal disease 42.3 41.0 31.8 26.8 24.8 19.8 15.2 14.3
Note: The 95% confidence intervals for these estimates are available in Appendix Table C2.16.
Source: National Survey of Adult Oral Health 2004–2006.
2.4 Tooth retention and loss In 2013, the proportion of people aged 15 and over who had no natural teeth (edentulous) was 4.4%. There was no statistically significant difference in the rates of edentulism between males and females (3.9% and 4.9%, respectively). The proportion who were edentulous was negligible for the 25–44 age group (0.1%) and highest for the 65 and over group (19.1%) (Table 2.17).
Table 2.17: Prevalence of edentulism by age and sex, people aged 15 and over, 2013 (%)
Age (years)
15–24 25–44 45–64 65+ All people
Male — — 3.2 17.4 3.9
Female — 0.2 3.1 20.5 4.9
All people aged 15 and over — 0.1 3.2 19.1 4.4
Note: The 95% confidence intervals for these estimates are available in Appendix Table C2.17.
Source: National Dental Telephone Interview Survey 2013.

Oral health and dental care in Australia: key facts and figures 2015 13
The proportion of dentate people aged 15 and over who wore dentures was 12.2%, ranging from 1.5% for those aged 15–24 to 41.7% for those aged 65 and over (Table 2.18).
Table 2.18: Prevalence of denture wearing by sex and age, dentate people aged 15 and over, 2013 (%)
Age (years)
15–24 25–44 45–64 65+ All people
Male 1.4 3.9 12.0 39.4 11.5
Female 1.6 2.8 13.7 43.9 13.0
All people aged 15 and over 1.5 3.3 12.9 41.7 12.2
Note: The 95% confidence intervals for these estimates are available in Appendix Table C2.18.
Source: National Dental Telephone Interview Survey 2013.
Overall, females had more missing teeth than males (5.4 and 4.8 teeth, respectively). Across age groups, the average number of missing teeth varied from 1.8 teeth for people aged 15–24 to 10.8 teeth for those aged 65 and over (Table 2.19).
Across remoteness areas, people in Inner regional areas had more missing teeth than those in Major cities (6.2 and 4.8 missing teeth, respectively). Those aged 45–64 in Inner regional areas had more missing teeth (7.0 teeth) than those in Major cities (5.3 teeth). There were no other statistically significant differences.
The number of missing teeth was also associated with insurance status, with uninsured adults having more missing teeth than those with insurance (5.6 and 4.7 teeth, respectively). Differences by insurance status were also seen for adults aged 45–64 and 65 and over (Table 2.19).
People eligible for public dental care had more missing teeth, on average, than those ineligible for public dental care (8.1 and 4.0 teeth, respectively). Across age groups, differences between those eligible and not eligible for public dental care were statistically significant only for those aged 45 and over (Table 2.19).
There was an almost linear relationship between the number of missing teeth and annual household income. Lower household income was associated with a higher number of missing teeth, ranging from 8.6 teeth for individuals in a household earning less than $30,000 per year to 3.2 teeth in those earning more than $140,000 per year. The gradient by income was most evident in the two older age groups (45–54 years and 65+ years) (Table 2.19).
Across remoteness areas, people with insurance living in Inner regional areas had more tooth loss overall than insured people living in Major cities and Outer regional areas (5.6, 4.5 and 4.4 missing teeth, respectively). For people without insurance, those living in Inner regional areas had more missing teeth than those living in Major cities (6.8 and 5.2 teeth, respectively) (Table 2.20).
Across annual household income categories, there were generally no statistical differences in the number of missing teeth between people with and without insurance. An exception to this was those with household incomes of $30,000 to less than $60,000 per year, where those insured had more missing teeth than those without insurance (4.7 and 6.1 teeth, respectively) (Table 2.20).

14 Oral health and dental care in Australia: key facts and figures 2015
Table 2.19: Number of missing teeth by age group and selected other characteristics, dentate people aged 15 and over, 2013 (average)
Age (years)
15–24 25–44 45–64 65+ All people
Sex
Male 1.5 2.9 5.5 10.6 4.8
Female 2.3 3.4 6.0 11.0 5.4
Remoteness area
Major cities 2.0 3.1 5.3 10.4 4.8
Inner regional 1.6 3.2 7.0 11.8 6.2
Outer regional 1.2 3.5 6.2 10.4 5.5
Remote/Very remote 2.3 3.2 6.7 12.7 5.4
Insurance status
Insured 2.1 3.3 4.9 8.9 4.7
Uninsured 1.7 3.0 7.1 12.8 5.6
Eligibility for public dental care
Eligible 1.8 3.8 8.8 11.8 8.1
Ineligible 1.9 3.0 5.2 8.6 4.0
Annual household income ($)
<30,000 1.6 4.0 8.6 12.3 8.6
30,000–<60,000 1.7 2.9 6.2 9.6 5.3
60,000–<90,000 1.9 2.9 5.6 8.4 4.3
90,000–<140,000 1.4 3.3 4.9 6.0 3.9
140,000+ 1.9 3.1 4.0 4.9 3.2
All people aged 15 and over 1.8 3.2 5.8 10.8 5.1
Notes
1. The number of missing teeth was derived from the self-reported number of natural teeth at the time of the interview and includes all missing teeth, regardless of reason.
2. The 95% confidence intervals for these estimates are available in Appendix Table C2.19.
Source: National Dental Telephone Interview Survey 2013.

Oral health and dental care in Australia: key facts and figures 2015 15
Table 2.20: Number of missing teeth by annual household income and selected other characteristics, dentate people aged 15 and over, 2013 (average)
Annual household income ($)
Insurance status <30,000 30,000–<60,000
60,000–<90,000
90,000–<140,000 140,000+
All people
Insured
Major cities 7.7 5.9 4.8 3.9 3.2 4.5
Inner regional 8.1 7.3 4.3 4.7 3.8 5.6
Outer regional 7.0 4.7 3.8 4.4 3.4 4.4
Remote/Very remote 9.8 5.6 4.4 5.4 3.3 4.6
All insured 7.7 6.1 4.6 4.1 3.3 4.7
Uninsured
Major cities 8.5 4.0 3.9 3.6 3.1 5.2
Inner regional 10.3 5.9 4.8 3.1 4.9 6.6
Outer regional 10.6 6.0 4.2 4.6 1.6 6.8
Remote/Very remote 8.1 7.4 3.7 4.4 2.9 6.6
All uninsured 9.1 4.7 4.1 3.6 3.2 5.6
All people
Major cities 8.3 4.8 4.4 3.8 3.2 4.8
Inner regional 9.7 6.4 4.6 4.1 4.0 6.1
Outer regional 9.9 5.4 4.0 4.5 2.8 5.7
Remote/Very remote 8.4 6.9 4.1 5.2 3.2 5.5
All people aged 15 and over 8.6 5.3 4.3 3.9 3.2 5.1
Note: The 95% confidence intervals for these estimates are available in Appendix Table C2.20.
Source: National Dental Telephone Interview Survey 2013.

16 Oral health and dental care in Australia: key facts and figures 2015
Between 1994 and 2013, the average number of missing teeth among dentate people aged 15 and over decreased from 6.2 to 5.1 teeth per person. The number of remaining teeth increased from 25.8 in 1994 to 27.0 in 2013 (Figure 2.2; Appendix Table B2.2.2).
Notes
1. Data in this figure relate to dentate adults only.
2. Directly age standardised to the 2001 Australian population.
Source: Appendix Table B2.2.2.
Figure 2.2: Number of teeth and number of missing teeth, dentate people aged 15 and over, 1994–2013 (average)

Oral health and dental care in Australia: key facts and figures 2015 17
International comparisons in tooth loss Australian adults were less likely than New Zealanders to have lost all of their teeth (5.5% compared with 9.4%); however, similar proportions of Australians and Canadians had no remaining natural teeth (4.4% compared with 6.4%, respectively) (Table 2.21). While more up-to-date estimates are available for Australia, these have not been used for international comparisons to ensure comparable time periods.
Table 2.21: Prevalence of complete tooth loss among adults in Australia, New Zealand and Canada (%)
Australia(a) New
Zealand(b)
Age group (years) Australia(a) Canada(c)
All people aged 18 and over 5.5 9.4 All people aged 20–79 4.4 6.4
18–24 years — 0.1 20–39 years 0.1 . .(d)
25–34 years — —
35–44 years 0.3 1.7 40–59 years 3.1 4.4
45–54 years 3.0 3.2
55–64 years 8.5 14.6 60–79 years 15.2 21.7
65–74 years 15.1 29.6
75 years and over 27.9 39.6
(a) 2010.
(b) 2009.
(c) 2007–09.
(d) Estimate not provided in Canadian report because of extreme sampling variability or small sample size.
Note: The 95% confidence intervals for these estimates are in Appendix Table C2.21.
Sources: Canadian data sourced from Statistics Canada; New Zealand data sourced from New Zealand Ministry of Health.
2.5 Social impact Measures of social impact give insight into the effect of oral conditions on day-to-day living from the individual’s perspective. Experience of social impact reflects not only the level of oral disease experienced, but also whether that disease had been treated in a timely fashion. The following data are from the NDTIS in which people are asked about their experience of toothache, how they feel about their dental appearance and whether or not they avoid eating certain foods.
Toothache In 2013, about 1 in 7 (16.2%) dentate people aged 15 and over reported that they had experienced toothache in the previous 12 months. This ranged from 8.9% of those aged 65 and over to 20.6% of those aged 25–44.
Experience of toothache was more prevalent for uninsured people than for insured people (20.2% and 12.3%, respectively), and for those who were eligible for public dental care than for those who were not (20.4% and 14.7%, respectively).
Toothache experience was also associated with household income, with a higher proportion of people in the lower income categories experiencing toothache in the previous 12 months than in the higher income categories. There was a two-fold difference in toothache between

18 Oral health and dental care in Australia: key facts and figures 2015
the two lowest income categories (less than $30,000, and $30,000 to less than $60,000) and the two highest ($90,000 to less than $140,000, and $140,000+) (23.8% and 18.5% compared with 12.1% and 9.1%, respectively).
There were no statistical differences in toothache experience by sex, age group and remoteness areas (Table 2.22).
Table 2.22: Prevalence of toothache experience in the previous 12 months by selected characteristics, dentate people aged 15 and over, 2013 (%)
Age (years)
15–24 25–44 45–64 65+ All people
Sex
Male 14.5 18.4 14.4 8.3 15.0
Female 14.5 22.9 16.4 9.5 17.4
Remoteness area
Major cities 14.3 20.8 14.6 9.4 16.2
Inner regional 18.1 18.4 16.2 4.7 15.0
Outer regional 7.4 21.3 19.3 13.3 17.2
Remote/Very remote 8.0 26.4 15.6 26.1 21.7
Insurance status
Insured 11.8 15.1 11.7 7.7 12.3
Uninsured 16.2 25.8 20.6 9.7 20.2
Eligibility for public dental care
Eligible 20.0 33.6 28.1 9.3 20.4
Ineligible 12.8 18.1 12.8 8.0 14.7
Annual household income ($)
<30,000 33.0 37.1 30.6 10.5 23.8
30,000–<60,000 18.0 25.7 18.2 6.0 18.5
60,000–<90,000 11.0 25.3 13.9 9.3 18.1
90,000–<140,000 7.6 14.5 11.8 2.1 12.1
140,000+ 11.1 9.3 7.6 5.9 9.1
All people aged 15 and over 14.5 20.6 15.4 8.9 16.2
Note: The 95% confidence intervals for these estimates are available in Appendix Table C2.22.
Source: National Dental Telephone Interview Survey 2013.
Oral health and dental care in Australia: key facts and figures 2015 19
Dental appearance Approximately one-quarter (27.0%) of all people over the age of 15 reported that they had felt uncomfortable about their dental appearance in the previous 12 months, ranging from 21.7% for those aged 65 and over to 30.7% for those aged 45–64 (Table 2.23).
Females were more likely to be uncomfortable about their appearance than males (30.9% compared with 22.6%). Both males and females aged 65 and over were less likely to report feeling uncomfortable about their dental appearance than those aged 45–64.
Among dentate adults, those aged 45–64 were more likely to feel uncomfortable with their dental appearance (30.6%) than those aged 15–24 (22.3%) and 65 and over (22.4%). A similar pattern held for edentulous adults. Those aged 45–64 were more likely to feel uncomfortable about their dental appearance than those aged 65 and over (33.6% and 18.6%, respectively).
There were no statistically significant differences in discomfort about dental appearance across remoteness areas.
Uninsured people were more likely than insured people to be uncomfortable with their dental appearance (30.9% compared with 23.3%) as were people eligible for dental care than those who were ineligible (32.8% compared with 24.7%).
People living in lower income households were more likely to report feeling uncomfortable about their dental appearance than those living in higher income households. The difference across household incomes was most evident in the two middle age groups where there was at least a two-fold difference between the lowest and highest income groups (46.3% compared with 17.9%, respectively, for age group 25–44; 44.5% compared with 15.7%, respectively, for age group 45–64) (Table 2.23).

20 Oral health and dental care in Australia: key facts and figures 2015
Table 2.23: Prevalence of feeling uncomfortable about dental appearance in the previous 12 months by selected characteristics, people aged 15 and over, 2013 (%)
Age (years)
15–24 25–44 45–64 65+ All people
Sex
Male 19.1 24.0 25.9 16.5 22.6
Female 25.6 31.6 35.0 25.9 30.9
Dentate status
Dentate 22.3 28.0 30.6 22.4 27.2
Edentulous — 37.7 33.6 18.6 22.2
Remoteness area
Major cities 19.5 29.6 29.8 21.0 26.9
Inner regional 32.9 21.7 32.3 22.9 27.3
Outer regional 30.6 24.7 34.3 21.8 28.0
Remote/Very remote 11.7 21.4 33.5 37.2 27.0
Insurance status
Insured 22.1 23.5 23.9 22.2 23.3
Uninsured 23.3 31.9 39.7 21.2 30.9
Eligibility for public dental care
Eligible 28.8 44.9 47.0 22.4 32.8
Ineligible 20.3 24.8 26.9 20.0 24.7
Annual household income ($)
<30,000 27.9 46.3 44.5 23.1 33.1
30,000–<60,000 14.7 30.4 36.1 22.1 29.0
60,000–<90,000 30.2 29.1 33.1 24.7 30.2
90,000–<140,000 19.5 25.0 25.2 21.2 24.5
140,000+ 23.1 17.9 15.7 24.7 18.0
All people aged 15 and over 22.3 28.0 30.7 21.7 27.0
Note: The 95% confidence intervals for these estimates are available in Appendix Table C2.23.
Source: National Dental Telephone Interview Survey 2013.

Oral health and dental care in Australia: key facts and figures 2015 21
Avoiding certain foods Approximately 20.9% of adults reported avoiding eating certain foods due to problems with their teeth, ranging from 14.5% of people aged 15–24 to 23.6% of those aged 45–64 (Table 2.24).
Dentate people were less likely to avoid eating certain foods because of problems with their teeth than edentulous adults (20.3% and 34.3%, respectively). Dentate people aged 15–24 had the lowest rates of avoiding certain foods (14.5%) compared with older age groups (ranging from 20.5% for those aged 25–44 to 22.8% for those aged 45–64).
The proportion who avoided food was higher for women than for men (23.8% compared with 17.9%), for uninsured people than for insured people (24.8% compared with 17.0%) and for people eligible for public dental care than for those who were ineligible (28.5% compared with 17.9%).
Avoiding certain foods because of dental problems was more frequent in the two lowest household income groups (32.2% and 23.8%, respectively) than in the two highest household income groups (16.7% and 11.1%, respectively) (Table 2.24).

22 Oral health and dental care in Australia: key facts and figures 2015
Table 2.24: Prevalence of avoiding certain foods in the previous 12 months by selected characteristics, people aged 15 and over, 2013 (%)
Age (years)
15–24 25–44 45–64 65+ All people
Sex Male 12.0 18.2 19.8 19.7 17.9
Female 17.2 22.8 27.2 25.8 23.8
Dentate status
Dentate 14.5 20.5 22.8 21.2 20.3
Edentulous — 43.4 47.8 30.3 34.3
Remoteness area
Major cities 14.2 20.8 22.0 23.8 20.5
Inner regional 15.3 16.2 26.2 18.9 20.2
Outer regional 17.7 24.6 28.3 28.9 25.8
Remote/Very remote 10.0 24.6 22.5 8.6 20.5
Insurance status
Insured 12.8 17.6 17.2 18.8 17.0
Uninsured 17.0 22.5 32.1 26.5 24.8
Eligibility for public dental care Eligible 17.0 31.4 41.5 25.3 28.5
Ineligible 13.8 18.4 19.6 16.2 17.9
Annual household income ($) <30,000 25.1 34.3 45.3 26.4 32.2
30,000–<60,000 18.3 24.0 29.2 19.2 23.8
60,000–<90,000 12.1 22.3 19.9 19.4 19.8
90,000–<140,000 13.2 19.3 15.2 11.9 16.7
140,000+ 11.0 11.6 10.4 16.0 11.1
All people aged 15 and over 14.5 20.5 23.6 23.0 20.9
Note: The 95% confidence intervals for these estimates are available in Appendix Table C2.24.
Source: National Dental Telephone Interview Survey 2013.
Between 1994 and 2013, there was an overall increase in the proportion of people aged 15 and over who reported any oral health impact. The proportion ranged between 31.4% in 1994 to 39.9% in 2008 (Figure 2.3; Appendix 2.3).
The highest percentage point increase over the period from 1994 to 2013 was in the proportion of people who were uncomfortable about their dental appearance, increasing 6.7 percentage points (from 20.0% to 26.7%).
The prevalence of people avoiding certain foods because of problems with their teeth increased by 3.1 percentage points over the same period (from 20.2% to 17.1%).
The proportion of people who reported experiencing a toothache over the previous 12 months increased from 10.9% to 16.2% over the same period (a 5.3 percentage point difference).

Oral health and dental care in Australia: key facts and figures 2015 23
Note: Directly age standardised to the 2001 Australian population.
Source: Appendix 2.3.
Figure 2.3: Prevalence of any oral health impact, adults aged 15 and over 1994 to 2013 (%)
The proportion of children aged 5 to 14 reporting any oral health impact was lower than that for adults for every year reported (Figure 2.4; Appendix 2.4). Overall, the proportion reporting any oral health impact ranged from 10.0% in 2002 to 16.3% in 2005.
Note: Directly age standardised to the 2001 Australian population.
Source: Appendix 2.4.
Figure 2.4: Prevalence of any oral health impact, children aged 5 to 14, 1994 to 2013 (%)

24 Oral health and dental care in Australia: key facts and figures 2015
3 Use of dental services
3.1 Time since last dental visit In 2013, approximately two-thirds (64.4%) of people aged 5 and over had made a dental visit in the previous 12 months. More females had visited within the previous year than males (67.5% and 61.2%, respectively) (Table 3.1).
Almost 4 in 5 (78.8%) children aged 5–14 had made a dental visit in the previous 12 months, with 90.6% having visited within the previous 2 years.
In contrast, over half (55.2%) of all adults aged 25–44 had made a dental visit in the previous 12 months, with three-quarters (75.3%) having visited in the previous 2 years.
Table 3.1: Time since last dental visit by age and sex, dentate people aged 5 and over, 2013 (%)
Time since last visit
<12 months 1–<2 years 2–<5 years 5+ years or never
Sex
Male 61.2 17.2 11.5 10.0
Female 67.5 17.4 9.6 5.5
Age (years)
5–14 78.8 11.8 2.7 6.8
15–24 66.6 19.7 9.4 4.3
25–44 55.2 20.1 15.1 9.7
45–64 63.8 18.0 9.9 8.3
65+ 70.1 12.4 10.4 7.1
All people aged 5 and over 64.4 17.3 10.6 7.8
Note: The 95% confidence intervals for these estimates are available in Appendix Table C3.1.
Source: National Dental Telephone Interview Survey 2013.
The proportion of dentate people aged 15 and over who made a dental visit within the previous 12 months was higher for those living in Major cities (64.1%) than for those living in Inner regional and Outer regional areas (57.7% and 56.3%, respectively) (Table 3.2).
Almost three-quarters of dentate adults with insurance (73.7%) made a dental visit within the previous year, compared with around half of those without insurance (51.0%) (Table 3.2).
There was no statistically significant difference in time since last dental visit between dentate adults eligible for public dental care (61.5%) and those who were not eligible (62.3%) (Table 3.2).
Across annual household income categories, those in the lowest two household income categories (less than $30,000, and $30,000 to less than $60,000; 57.1% and 56.8%, respectively) had statistically significantly lower rates of visiting in the previous 12 months than those in the two highest income categories ($90,000 to $140,000, and $140,000 plus; 66.9% and 67.9%, respectively) (Table 3.2).

Oral health and dental care in Australia: key facts and figures 2015 25
Table 3.2: Time since last dental visit by selected characteristics, dentate people aged 15 and over, 2013 (%)
Time since last visit
<12 months 1–<2 years 2–<5 years 5+ years or never
Sex
Male 58.3 18.0 13.1 10.7
Female 65.8 18.4 10.6 5.2
Remoteness area
Major cities 64.1 17.2 11.0 7.7
Inner regional 57.7 19.9 13.8 8.5
Outer regional 56.3 20.6 15.5 7.7
Remote/Very remote 54.6 28.4 7.1 10.0
Insurance status
Insured 73.7 15.0 7.5 3.7
Uninsured 51.0 21.2 15.5 12.3
Eligibility for public dental care
Eligible 61.5 18.2 12.1 8.2
Ineligible 62.3 18.2 11.7 7.8
Annual household income ($)
<30,000 57.1 18.0 14.2 10.7
30,000–<60,000 56.8 20.1 13.7 9.4
60,000–<90,000 59.8 18.9 11.5 9.8
90,000–<140,000 66.9 17.0 10.5 5.6
140,000+ 67.9 17.1 9.1 5.9
All people aged 15 and over 62.1 18.2 11.8 7.9
Note: The 95% confidence intervals for these estimates are available in Appendix Table C3.2.
Source: National Dental Telephone Interview Survey 2013.

26 Oral health and dental care in Australia: key facts and figures 2015
Trends in time since last dental visit The proportion of people aged 15 and over who made a dental visit in the previous 12 months was higher in 2013 than in 1994 (60.3% and 56.4%, respectively). The proportion of children aged 5–14 making a dental visit in the previous 12 months remained largely unchanged between 1994 and 2013, ranging from around 78% to around 83% (Figure 3.1; Appendix Table B).
Notes
1. Data in this figure relate to dentate people only.
2. Directly age standardised to the 2001 Australian population.
Source: Appendix Table B3.1.
Figure 3.1: Last dental visit was in the previous 12 months, children aged 5–14 and adults aged 15 and over, 1994 to 2013 (%)

Oral health and dental care in Australia: key facts and figures 2015 27
International comparisons in time since last dental visit Across age groups, Australians were, on average, more likely to have made a dental visit in the previous 12 months than New Zealanders. However, Australians were less likely than Canadians in all three age groups to have made a dental visit in the previous 12 months (Table 3.3). While more up-to-date estimates are available for Australia, these have not been used for international comparisons to ensure comparable time periods.
Table 3.3: Proportions of adults who made a dental visit in the previous 12 months, Australia, New Zealand and Canada (%)
Age group (years) Australia(a) New
Zealand(b)
Age group (years) Australia(a) Canada(c,d)
18–24 55.7 36.9 20–39 54.9 67.9
25–34 58.7 44.6
35–44 56.6 43.3 40–59 61.1 78.5
45–54 59.9 55.7
55–64 62.6 55.7 60–79 60.2 79.3
65–74 59.1 47.7
75 and over 54.7 40.3
All persons aged 18 and over 60.7 47.1
(a) 2010.
(b) 2009.
(c) 2007–09.
(d) In Canada, participants were asked: ‘When was the last time you saw a dental professional?’.
Note: The 95% confidence intervals for these estimates are in Appendix Table C3.3.
Sources: Canadian data sourced from Statistics Canada; New Zealand data sourced from New Zealand Ministry of Health.
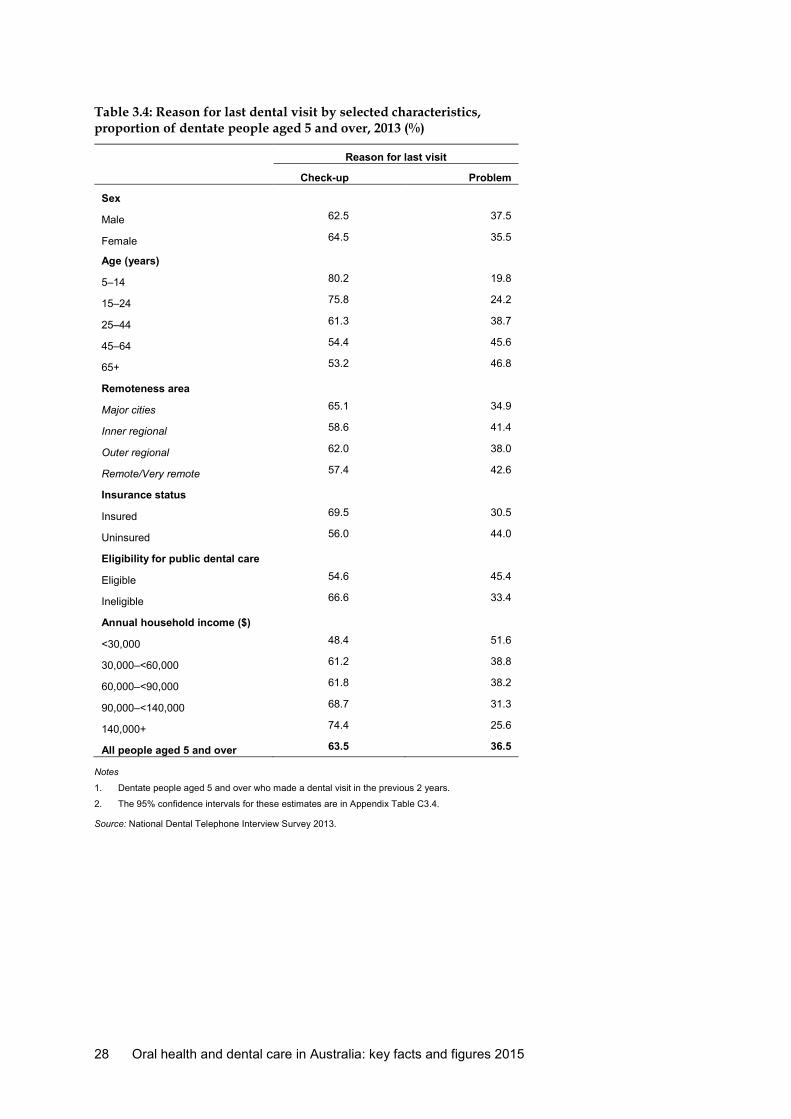
3.2 Reason for last dental visit In 2013, among those who made a dental visit in the previous two years, younger people were more likely to attend for a check-up than adults. More than 4 in 5 people aged under 25 reported that their last dental visit was for a check-up (80.2% for those aged 5–14 and 75.8% for those aged 15–24). In contrast, people aged 45 and over had the lowest rates of visiting for a check-up (54.4% for those aged 45–64, and 53.2% for those aged 65 and over).
People living in Major cities had higher rates of visiting for a check-up (65.1%) than those living in Inner regional areas (58.6%).
People with insurance (69.5%) were more likely to report their last visit was for a check-up than those without insurance (56.0%).
Fewer people who were eligible for public dental care (54.6%) reported that their last visit was for a check-up than those who were not eligible for public dental care (66.6%).
Across household income groups, the proportion of individuals who last visited a dentist for a check-up ranged from 48.4% for those in the $30,000 or less income group to 74.4% for those in the $140,000 and over income group (Table 3.4).
28 Oral health and dental care in Australia: key facts and figures 2015
Table 3.4: Reason for last dental visit by selected characteristics, proportion of dentate people aged 5 and over, 2013 (%)
Reason for last visit
Check-up Problem
Sex
Male 62.5 37.5
Female 64.5 35.5
Age (years) 5–14 80.2 19.8
15–24 75.8 24.2
25–44 61.3 38.7
45–64 54.4 45.6
65+ 53.2 46.8
Remoteness area
Major cities 65.1 34.9
Inner regional 58.6 41.4
Outer regional 62.0 38.0
Remote/Very remote 57.4 42.6
Insurance status
Insured 69.5 30.5
Uninsured 56.0 44.0
Eligibility for public dental care
Eligible 54.6 45.4
Ineligible 66.6 33.4
Annual household income ($)
<30,000 48.4 51.6
30,000–<60,000 61.2 38.8
60,000–<90,000 61.8 38.2
90,000–<140,000 68.7 31.3
140,000+ 74.4 25.6
All people aged 5 and over 63.5 36.5
Notes
1. Dentate people aged 5 and over who made a dental visit in the previous 2 years.
2. The 95% confidence intervals for these estimates are in Appendix Table C3.4.
Source: National Dental Telephone Interview Survey 2013.

Oral health and dental care in Australia: key facts and figures 2015 29
The proportion of adults aged 15 and over whose last visit was for a check-up increased from 48.3% in 1994 to 60.5% in 2013. After declining from 80.0% in 1994 to 70.8% in 1996, the proportion of children aged 5–14 who visited for a check-up steadily increased until it reached a high of 83.1% in 2010 and 80.7% in 2013 (Figure 3.2; Appendix Table B).
Notes
1. Data in this figure relate to dentate adults who made a dental visit in the previous 12 months.
2. Directly age standardised to the 2001 Australian population.
Source: Appendix Table B3.2.
Figure 3.2: Last dental visit was for a check-up, children aged 5–14 and adults aged 15 and over, 1994 to 2013 (%)

30 Oral health and dental care in Australia: key facts and figures 2015
International comparisons of reason for last dental visit Australian adults in all age groups other than the youngest (18–24 years) and the oldest (75 years and over) were more likely than their New Zealand counterparts to have last visited a dentist for a check-up. The difference across age groups ranged from 14.7 percentage points in the 25–34 year and 35–44 year age groups to 3.7 percentage points in the 18–24 year age group (Table 3.5).
Table 3.5: Proportion of adults who last visited for a check-up, Australia and New Zealand (%)
Age group (years) Australia(a) New Zealand(b)
18–24 76.1 76.9 25–34 61.5 46.9 35–44 59.7 46.1 45–54 54.8 44.0 55–64 50.4 40.5 65–74 51.5 39.6 75 and over 57.5 43.2
All people aged 18 and over 59.7 47.9
(a) 2010.
(b) 2009.
Note: The 95% confidence intervals for these estimates are available in Appendix Table C3.5.
Source: New Zealand data sourced from New Zealand Ministry of Health.
3.3 Type of practice visited at last dental visit The majority of dental services in Australia are private dental practices. There are only a limited range of public dental practices and these primarily provide services to specific target populations. The data reflect this. In 2013, most people aged 5 and over (84.4%) reported that their last dental visit was to a private dental practice, compared with 9.5% to a public dental service and 4.2% to an SDS (Table 3.6).
Just over 1 in 5 (21.4%) children aged 5–14 attended an SDS for their last dental visit and nearly two-thirds (63.6%) attended a private practice.
Among adults, people aged 65 and over were more likely to have visited a public dental service than those aged 25–44 or 45–54 (14.0% compared with 7.5% and 5.6%, respectively).
Across remoteness areas, use of an SDS was lower in Major cities (3.2%) than in Inner regional and Outer regional areas (6.3% and 8.1%, respectively). The proportion of people using public dental services was lower in Major cities (8.3%) than in Remote/Very remote regions (24.2%) (Table 3.6).
People with insurance were more likely to report visiting a private practice (93.2%) and less likely to access public care (3.1%) or an SDS (2.6%) than those without insurance (71.4%, 18.8% and 6.7%, respectively).
People who were eligible for public dental care were less likely to report accessing private care (70.3%) and more likely to report accessing public care (24.3%) at their last visit than those who were not eligible for public dental care (89.0% and 4.6%, respectively) (Table 3.6).
Across annual household income groups, those in the lowest two income groups had higher rates of public dental service visits than those in the two highest income groups. Almost one-

Oral health and dental care in Australia: key facts and figures 2015 31
third of dentate people in the $30,000 and under income group (30.0%) and one-tenth of those in the $30,000 to less than $60,000 income group (11.3%) visited a public dental service at their last visit, compared with 2.7% and 2.3% for those in the two highest income categories. SDS use was relatively even across all income groups (Table 3.6).
Table 3.6: Type of practice visited at last dental visit by selected characteristics, proportion of dentate people aged 5 and over who visited in last 12 months, 2013 (%)
Type of practice visited at last dental visit
Private Public SDS Other
Sex
Male 83.5 9.9 3.9 2.7
Female 85.1 9.2 4.5 1.1
Age (years)
5–14 63.6 13.8 21.4 1.1
15–24 82.7 11.2 3.9 2.2
25–44 89.2 7.5 — 3.3
45–64 93.0 5.6 — 1.4
65+ 85.3 14.0 — 0.6
Remoteness area
Major cities 86.6 8.3 3.2 1.9
Inner regional 80.3 12.2 6.3 1.2
Outer regional 76.9 11.6 8.1 3.3
Remote/Very remote 66.1 24.2 7.6 2.2
Insurance status
Insured 93.2 3.1 2.6 1.1
Uninsured 71.4 18.8 6.7 3.1
Eligibility for public dental care
Eligible 70.3 24.3 4.5 0.9
Ineligible 89.0 4.6 4.1 2.2
Annual household income ($)
<30,000 65.2 30.0 3.5 1.4
30,000–<60,000 82.3 11.3 5.3 1.1
60,000–<90,000 85.8 6.7 5.8 1.7
90,000–<140,000 90.3 2.7 5.0 2.0
140,000+ 92.1 2.3 3.6 2.1
All people aged 5 and over 84.4 9.5 4.2 1.9
Note: The 95% confidence intervals for these estimates are available in Appendix Table C3.6.
Source: National Dental Telephone Interview Survey 2013.

32 Oral health and dental care in Australia: key facts and figures 2015
The proportion of adults who visited a private dental practice remained stable between 1994 and 2013 (Figure 3.3).
Notes
1. Data in this figure relate to dentate adults aged 15 and over who made a dental visit in the previous 12 months.
2. Directly age standardised to the 2001 Australian population.
Source: Appendix Table B3.3.
Figure 3.3: Type of practice visited at last dental visit, dentate adults aged 15 and over, 1994 to 2013 (%)
Oral health and dental care in Australia: key facts and figures 2015 33
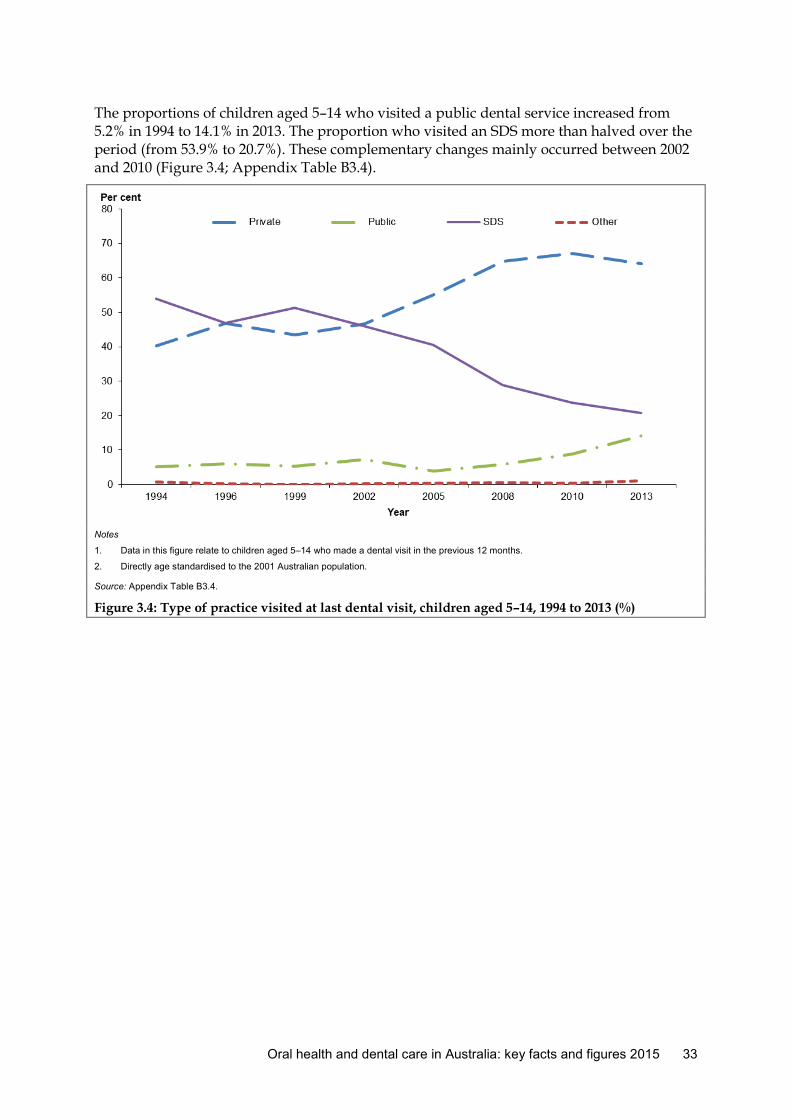
The proportions of children aged 5–14 who visited a public dental service increased from 5.2% in 1994 to 14.1% in 2013. The proportion who visited an SDS more than halved over the period (from 53.9% to 20.7%). These complementary changes mainly occurred between 2002 and 2010 (Figure 3.4; Appendix Table B3.4).
Notes
1. Data in this figure relate to children aged 5–14 who made a dental visit in the previous 12 months.
2. Directly age standardised to the 2001 Australian population.
Source: Appendix Table B3.4.
Figure 3.4: Type of practice visited at last dental visit, children aged 5–14, 1994 to 2013 (%)

34 Oral health and dental care in Australia: key facts and figures 2015
3.4 Dental visiting patterns for adults The measure ‘visiting patterns’ is derived from characteristics of people’s dental attendance; people were asked about this in the NDTIS. Favourable attendance is visiting a dentist once or more per year (usually for a check-up) and having a usual dental provider. Unfavourable attendance is visiting less than once every 2 years (and usually for a problem), or visiting once every 2 years (usually for a problem) and without a regular dental provider. The remaining combinations are classified as intermediate visiting patterns (Ellershaw & Spencer 2011).
Overall, in 2013, almost half (44.1%) of all dentate adults over the age of 18 had favourable visiting patterns and nearly one-quarter (23.5%) had unfavourable visiting patterns. Females were more likely to have favourable visiting patterns (49.6%) than males (38.4%) (Table 3.7).
Dentate adults aged 25–44 had the lowest rate of favourable attendance (37.5%). For the remaining age groups, there was no statistically significant difference, with rates ranging from 47.7% to 49.3%. The group aged 18–24 had a lower rate of unfavourable visiting (14.7%) than the 25–44 and 45–54 age groups (27.0% and 23.9%, respectively).
Across remoteness areas, dentate adults in Major cities had higher rates of favourable attendance (46.8%) and lower rates of unfavourable attendance (21.7%) than dentate adults in Inner regional areas (38.6% and 27.5%, respectively) and Outer regional areas (36.8% and 29.8%, respectively) (Table 3.7).
Almost two-thirds (60.9%) of insured dentate adults had favourable visiting patterns, compared with just under one-third (26.5%) of those without insurance (Table 3.7).
Just over one-third (34.7%) of eligible dentate adults had favourable visiting patterns, compared with almost one-half (47.3%) of ineligible dentate adults (Table 3.7).
Visiting patterns varied by annual household income. Just over one-quarter (27.4%) of adults in the lowest income group had favourable visiting patterns, compared with more than one-half (57.1%) of those in the highest income group. Conversely, lower income groups had higher rates of unfavourable visiting than higher income groups, ranging from 35.1% for the $30,000 or less household income group to 12.4% for the $140,000 and over income group.

Oral health and dental care in Australia: key facts and figures 2015 35
Table 3.7: Dental visiting pattern by selected characteristics, proportion of dentate people aged 18 and over, 2013 (%)
Dental visiting pattern
Favourable Intermediate Unfavourable
Sex
Male 38.4 34.4 27.3
Female 49.6 30.6 19.8
Age (years)
18–24 49.3 35.9 14.7
25–44 37.5 35.5 27.0
45–64 47.7 28.4 23.9
65+ 48.4 30.4 21.2
Remoteness area
Major cities 46.8 31.6 21.7
Inner regional 38.6 34.0 27.5
Outer regional 36.8 33.3 29.8
Remote/Very remote 31.4 39.5 29.1
Insurance status
Insured 60.9 26.7 12.4
Uninsured 26.5 38.0 35.6
Eligibility for public dental care
Eligible 34.7 34.6 30.7
Ineligible 47.3 31.7 21.0
Annual household income ($)
<30,000 27.4 37.5 35.1
30,000–<60,000 38.6 32.7 28.7
60,000–<90,000 42.4 33.1 24.5
90,000–<140,000 52.1 28.7 19.2
140,000+ 57.1 30.5 12.4
All people aged 18 and over 44.1 32.5 23.5
Note: The 95% confidence intervals for these estimates are available in Appendix Table C3.7.
Source: National Dental Telephone Interview Survey 2013.

36 Oral health and dental care in Australia: key facts and figures 2015
Between 1999 and 2013, there was an overall increase in the proportion of adults aged 18 and over who had favourable visiting patterns, increasing from 36.3% to 43.9%. Despite some year-to-year fluctuation, the overall rate of unfavourable visiting patterns has remained relatively steady, ranging between 22.1% and 28.6% for all years other than 2002 (Figure 3.5; Appendix Table B).
Notes
1. Data in this figure relate to dentate adults aged 18 and over.
2. Directly age standardised to the 2001 Australian population.
Source: Appendix Table B3.5.
Figure 3.5: Dental visiting pattern, dentate adults aged 18 and over, 1999 to 2013 (%)
3.5 Dental services received In 2013, dentate people aged 5 and over who visited a dentist in the last 12 months made, on average, 2.41 visits. On average, they received 1.09 scale and clean services, 0.65 fillings and 0.27 extractions. There was no statistically significant difference in the average number of services between males and females (Table 3.8).
Across age groups, adults aged 25–44 had a lower average number of dental visits (2.12) than those aged 15–24 (2.80) and those aged 65 and over (2.58). Adults aged 65 and over had, on average, more fillings (0.80) than those aged 5–14 (0.42) and those aged 15–24 (0.48). Children aged 5–14 had, on average, fewer scale and clean services (0.92) than older age groups (between 1.09 and 1.18).
Across remoteness areas, people in Major cities made, on average, more dental visits (2.50) than people in Outer regional areas (1.98) and Remote/Very remote areas (1.97). Residents of Major cities also had more scale and clean services (1.15) than those of Inner regional (0.96) and Outer regional (0.88) areas.

Oral health and dental care in Australia: key facts and figures 2015 37
There was no statistically significant difference between people with and without insurance in the average number of visits they made in the previous 12 months, or in the number of extractions or fillings that they had. However, people with insurance had a higher number of scale and clean services (1.19) than uninsured individuals (0.94) (Table 3.8).
There was no statistically significant difference in the number of visits between people who were eligible for public dental care and people who were not. However, people who were eligible for public dental care received more fillings (0.77 compared with 0.61) and fewer scale and clean services (1.01 compared with 1.11) than those who were not eligible.
The average number of dental visits made in the past 12 months by dentate people aged 5 and over ranged from 2.28 to 2.67 visits across annual household income groups, although there was no statistically significant difference.
People in the two highest income categories had, on average, fewer extractions (0.16 and 0.17, respectively) and fewer fillings (0.62 and 0.47, respectively) than those in the lowest income group (0.47 extractions and 0.91 fillings). Those in the $30,000 or less income group and the $60,000 to less than $90,000 group had fewer scale and clean services (0.99) than individuals in the highest income group (1.19) (Table 3.8).
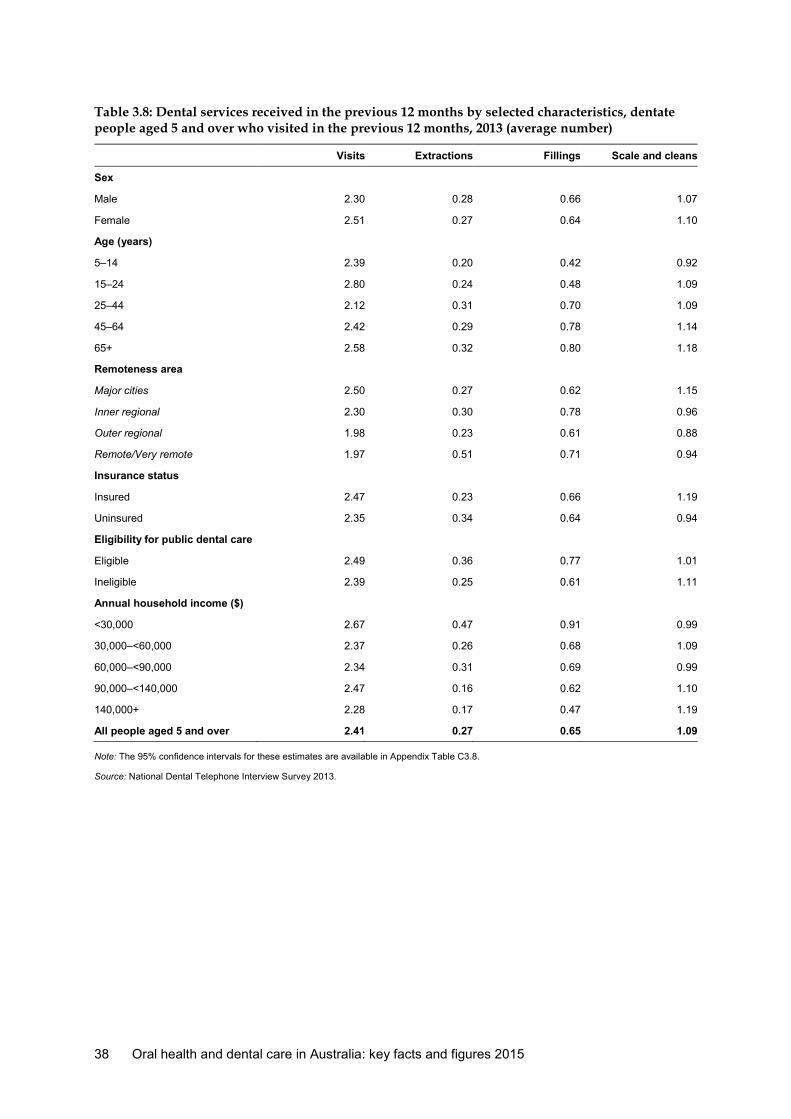
38 Oral health and dental care in Australia: key facts and figures 2015
Table 3.8: Dental services received in the previous 12 months by selected characteristics, dentate people aged 5 and over who visited in the previous 12 months, 2013 (average number)
Visits Extractions Fillings Scale and cleans
Sex
Male 2.30 0.28 0.66 1.07
Female 2.51 0.27 0.64 1.10
Age (years)
5–14 2.39 0.20 0.42 0.92
15–24 2.80 0.24 0.48 1.09
25–44 2.12 0.31 0.70 1.09
45–64 2.42 0.29 0.78 1.14
65+ 2.58 0.32 0.80 1.18
Remoteness area
Major cities 2.50 0.27 0.62 1.15
Inner regional 2.30 0.30 0.78 0.96
Outer regional 1.98 0.23 0.61 0.88
Remote/Very remote 1.97 0.51 0.71 0.94
Insurance status
Insured 2.47 0.23 0.66 1.19
Uninsured 2.35 0.34 0.64 0.94
Eligibility for public dental care
Eligible 2.49 0.36 0.77 1.01
Ineligible 2.39 0.25 0.61 1.11
Annual household income ($)
<30,000 2.67 0.47 0.91 0.99
30,000–<60,000 2.37 0.26 0.68 1.09
60,000–<90,000 2.34 0.31 0.69 0.99
90,000–<140,000 2.47 0.16 0.62 1.10
140,000+ 2.28 0.17 0.47 1.19
All people aged 5 and over 2.41 0.27 0.65 1.09
Note: The 95% confidence intervals for these estimates are available in Appendix Table C3.8.
Source: National Dental Telephone Interview Survey 2013.

Oral health and dental care in Australia: key facts and figures 2015 39
Adults aged 15 and over who made a dental visit in the previous 12 months, made an average number of 2.3 to 2.4 visits over this time.
A small decline, year by year, in the average number of fillings resulted in an overall decrease from 0.90 in 1994 to 0.70 in 2013. There was an overall increase in the average number of scale and clean services received, from 0.97 to 1.12 over the entire period. The average number of extractions fluctuated over the period (Figure 3.6).
Notes
1. Data in this figure relate to dentate adults aged 15 and over who made a dental visit in the previous 12 months.
2. Directly age standardised to the 2001 Australian population.
3. Data for Scale and cleans was not collected in 2005.
Source: Appendix Table B3.6.
Figure 3.6: Types of services received by adults aged 15 and over, 1994 to 2013 (average number)

40 Oral health and dental care in Australia: key facts and figures 2015
Among children aged 5–14 who made a recent dental visit, the average number of visits remained stable at between 2.14 and 2.39 over the period 1994 to 2013. There were no clear changes in individual service types (extractions, fillings or fluoride treatment) over this time period (Figure 3.7; Appendix Table B3.7).
Notes
1. Data in this figure relate to children aged 5 to 14 who made a dental visit in the previous 12 months.
2. Directly age standardised to the 2001 Australian population.
3. Data on fluoride treatments was not collected prior to 2008.
Source: Appendix Table B3.7.
Figure 3.7: Types of services received by children aged 5–14, 1994 to 2013 (average number)

Oral health and dental care in Australia: key facts and figures 2015 41
3.6 Fissure sealants in children A common and effective preventive practice to halt the development of active decay in permanent teeth is to seal or cover the pits and fissures of teeth (normally molars) with a resin or glass-ionomer (cement) material. This prevents the future build-up of plaque and bacteria in the more decay-susceptible tooth grooves.
In 2010, children with permanent tooth decay experience (DMFT >0) were more likely to have a fissure sealant than children with no permanent decay experience at every age (Table 3.9).
Table 3.9: Children with fissure-sealed teeth by DMFT status and age, children attending a school dental service, 2010 (%)
Age (years)
5 6 7 8 9 10 11 12 13 14
DMFT = 0 0.4 1.8 8.5 19.4 23.3 27.0 24.2 24.0 24.9 27.0
DMFT >0 2.9 3.3 13.5 23.3 21.3 26.2 27.2 26.1 33.3 35.0
Notes
1. New South Wales was excluded from the data collection due to a lack of representativeness of the sample.
2. Data from Victoria were not available.
3. The 95% confidence intervals for these estimates are available in Appendix Table C3.9.
Source: Child Dental Health Survey 2010.
The average number of fissure-sealed teeth in children attending an SDS ranged from 0.01 teeth in children aged 5 to 1.05 teeth in children aged 14 (Table 3.10).
Table 3.10: Fissure-sealed teeth by age, children attending a school dental service, 2010 (average number)
Age (years)
5 6 7 8 9 10 11 12 13 14
Average 0.01 0.05 0.27 0.58 0.67 0.76 0.69 0.73 0.93 1.05
Note: The 95% confidence intervals for these estimates are available in Appendix Table C3.10.
Source: Child Dental Health Survey 2010.

42 Oral health and dental care in Australia: key facts and figures 2015
Figure 3.8 shows the mean number of fissure-sealed teeth among children aged 12 in Australia from 1989 to 2010. The average number of teeth with fissure sealants fluctuated around 0.8 teeth over this time period.
Source: Appendix Table B3.8.
Figure 3.8: Teeth with fissure sealants, Australian children aged 12, 1989 to 2010 (average number)
Oral health and dental care in Australia: key facts and figures 2015 43
4 Hospitalisations Two measures of dental services provided in hospitals are reported:
• Potentially preventable hospital separations (PPHs) are one of the key performance indicators for the National Oral Health Plan 2004-2013 and provide important information about the extent to which timely and adequate dental care has been provided.
• A small proportion of Australians receive dental care under general anaesthetic. This is usually the result of severe disease, behavioural problems in children or medical/physical complications. Provision of dental care under general anaesthetic carries a small risk and is resource intensive, both for patients and the community. Understanding the extent of use of general anaesthetic for dental services and changes over time can inform the development of appropriate service provision and reorient primary dental services so that the demand for treatment under a general anaesthetic might be reduced (Jamieson & Roberts-Thomson 2006).
There is some overlap between these two indicators. Many PPHs will require a general anaesthetic. However, not all dental care provided under general anaesthetic is for potentially preventable care. There are also, potentially, hospital admissions for dental care that are not included in either of these categories. These would include admissions that are not potentially preventable and that are not performed under general anaesthetic.
4.1 Potentially preventable hospital separations PPHs are those conditions where hospitalisation is thought to have been avoidable if timely and adequate non-hospital care had been provided. PPHs therefore have potential as indicators of the quality or effectiveness of non-hospital care. A high rate of PPHs may indicate an increased prevalence of the conditions in the community, poorer functioning of the non-hospital care system or an appropriate use of the hospital system to respond to greater need (AIHW 2012). Separation rates, or rates of completed episodes of care for dental-related PPHs, therefore provide an indicator of potential inadequacy of dental care in the community.
In 2013–14, the total number of PPHs related to dental conditions was 63,456, or 2.7 separations per 1,000 population. The age-standardised separation rate in 2013–14 ranged from 2.1 separations per 1,000 population in the Australian Capital Territory to 3.8 in Western Australia (Table 4.1).
The number of PPHs increased from 57,955 in 2007–08 to 63,589 in 2012–13 and then decreased to 63,456 in 2013–14. The overall increase in the number of separations for PPHs was in line with population growth, as the age-standardised separation rate remained steady at 2.7/2.8 per 1,000 population (Table 4.1).

44 Oral health and dental care in Australia: key facts and figures 2015
Table 4.1: Hospital separations for potentially preventable hospitalisations due to dental conditions(a), state or territory of usual residence, 2007–08 to 2013–14
Year NSW Vic Qld WA SA Tas ACT NT Total(b)
Number(c)
2007–08 16,274 15,868 11,488 7,160 5,047 929 635 531 57,955
2008–09 15,799 16,356 11,836 7,765 5,025 874 726 773 59,174
2009–10 15,757 16,583 12,592 7,919 5,002 1,105 610 663 60,251
2010–11 16,102 15,937 12,173 8,461 5,350 1,099 725 707 60,590
2011–12 16,420 16,699 12,769 8,949 5,801 1,108 770 763 63,327
2012–13 16,869 14,892 13,020 9,550 6,090 1,570 761 787 63,589
2013–14 16,735 15,652 12,548 9,514 5,836 1,599 773 773 63,456
Separation rate(d)
2007–08 2.4 3.1 2.7 3.4 3.2 1.9 2.0 2.2 2.8
2008–09 2.3 3.1 2.7 3.6 3.2 1.8 2.2 3.2 2.8
2009–10 2.3 3.1 2.9 3.6 3.2 2.3 1.8 2.8 2.8
2010–11 2.3 2.9 2.7 3.7 3.3 2.3 2.1 2.9 2.7
2011–12 2.3 3.0 2.7 3.8 3.5 2.2 2.2 3.0 2.8
2012–13 2.3 2.7 2.8 3.9 3.7 3.1 2.1 3.0 2.8
2013–14 2.3 2.8 2.7 3.8 3.5 3.2 2.1 3.0 2.7
(a) Potentially preventable hospitalisations related to dental care are defined as the following ICD-10-AM 6th edn (see NCCH 2008) Principal diagnosis categories: K02 Dental caries; K03 Other diseases of hard tissues of teeth; K04 Diseases of pulp and periapical tissues; K05 Gingivitis and periodontal diseases; K06 Other diseases of gingival and edentulous alveolar ridge; K08 Other disorders of teeth and supporting structures; K09.8 Other cysts of oral region, not elsewhere classified; K09.9 Cyst of oral region, unspecified; K12 Stomatitis and related lesions; K13 Other diseases of lip and oral mucosa. Data for 2013–14 are defined using ICD-10-AM 8th edn.
(b) Includes Other territories.
(c) Excludes records with care type of Newborn (without qualified days), Hospital boarders and Posthumous organ procurement.
(d) Number of separations per 1,000 population. Separation rates were directly age standardised to the Australian population, using the estimated resident populations as at 30 June for the respective year.
Sources: AIHW Hospital Morbidity database 2007–08, 2013–14.
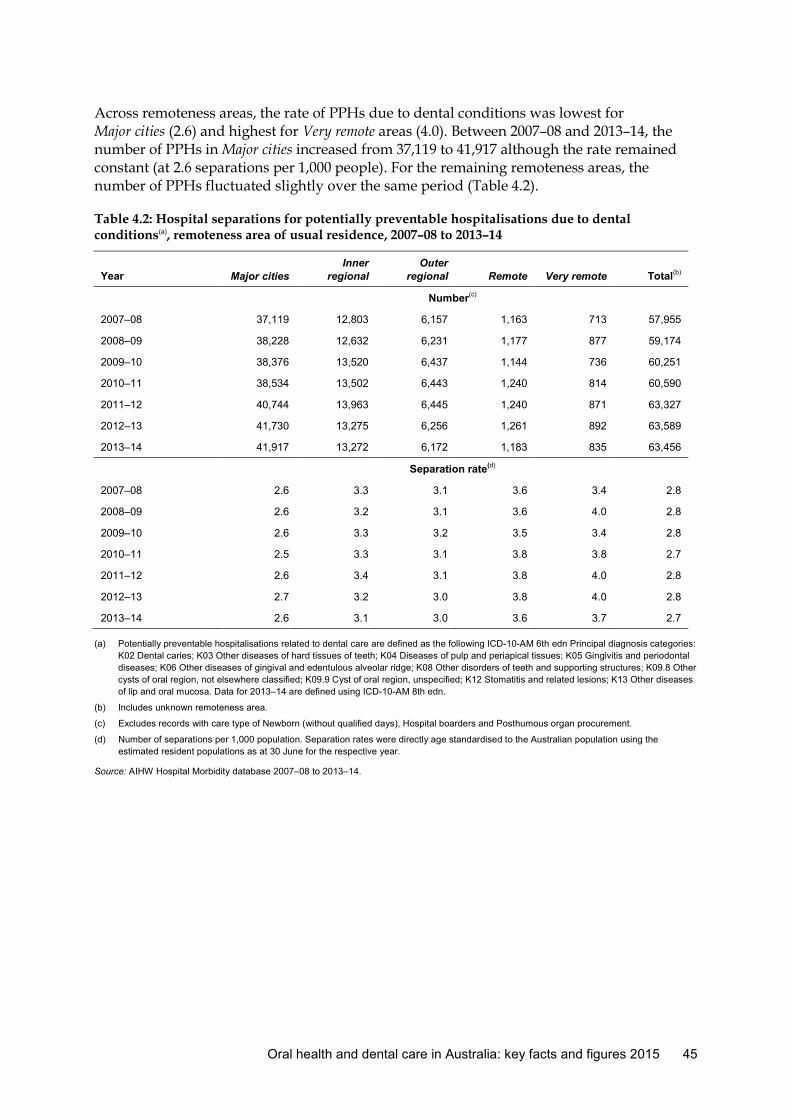
Oral health and dental care in Australia: key facts and figures 2015 45
Across remoteness areas, the rate of PPHs due to dental conditions was lowest for Major cities (2.6) and highest for Very remote areas (4.0). Between 2007–08 and 2013–14, the number of PPHs in Major cities increased from 37,119 to 41,917 although the rate remained constant (at 2.6 separations per 1,000 people). For the remaining remoteness areas, the number of PPHs fluctuated slightly over the same period (Table 4.2).
Table 4.2: Hospital separations for potentially preventable hospitalisations due to dental conditions(a), remoteness area of usual residence, 2007–08 to 2013–14
Year Major cities Inner
regional Outer
regional Remote Very remote Total(b)
Number(c)
2007–08 37,119 12,803 6,157 1,163 713 57,955
2008–09 38,228 12,632 6,231 1,177 877 59,174
2009–10 38,376 13,520 6,437 1,144 736 60,251
2010–11 38,534 13,502 6,443 1,240 814 60,590
2011–12 40,744 13,963 6,445 1,240 871 63,327
2012–13 41,730 13,275 6,256 1,261 892 63,589
2013–14 41,917 13,272 6,172 1,183 835 63,456
Separation rate(d)
2007–08 2.6 3.3 3.1 3.6 3.4 2.8
2008–09 2.6 3.2 3.1 3.6 4.0 2.8
2009–10 2.6 3.3 3.2 3.5 3.4 2.8
2010–11 2.5 3.3 3.1 3.8 3.8 2.7
2011–12 2.6 3.4 3.1 3.8 4.0 2.8
2012–13 2.7 3.2 3.0 3.8 4.0 2.8
2013–14 2.6 3.1 3.0 3.6 3.7 2.7
(a) Potentially preventable hospitalisations related to dental care are defined as the following ICD-10-AM 6th edn Principal diagnosis categories: K02 Dental caries; K03 Other diseases of hard tissues of teeth; K04 Diseases of pulp and periapical tissues; K05 Gingivitis and periodontal diseases; K06 Other diseases of gingival and edentulous alveolar ridge; K08 Other disorders of teeth and supporting structures; K09.8 Other cysts of oral region, not elsewhere classified; K09.9 Cyst of oral region, unspecified; K12 Stomatitis and related lesions; K13 Other diseases of lip and oral mucosa. Data for 2013–14 are defined using ICD-10-AM 8th edn.
(b) Includes unknown remoteness area.
(c) Excludes records with care type of Newborn (without qualified days), Hospital boarders and Posthumous organ procurement.
(d) Number of separations per 1,000 population. Separation rates were directly age standardised to the Australian population using the estimated resident populations as at 30 June for the respective year.
Source: AIHW Hospital Morbidity database 2007–08 to 2013–14.

46 Oral health and dental care in Australia: key facts and figures 2015
In 2013–14, children aged 5–9 had the highest number of PPHs due to dental conditions (13,504 separations or 9.3 separations per 1,000 children aged 5–9) (Table 4.3). Children aged 10–14 had the lowest number of separations for PPHs due to dental conditions (3,423, 2.4 separations per 1,000 children aged 10–14), although adults aged 25–44 had the lowest hospital separation rate overall (1.7 separations per 1,000 people).
Table 4.3: Number and rate of hospital separations for potentially preventable hospitalisations due to dental conditions(a), by sex and age group, 2013–14
Age (years)
Sex 0–4 5–9 10–14 15–24 25–34 35–44 45–54 55–64 65+ Total
Number(b)
Male 3,810 6,849 1,694 2,827 2,816 2,738 3,007 3,168 3,753 30,662
Female 3,293 6,655 1,729 3,697 2,861 2,801 3,697 3,746 4,315 32,794
Total 7,103 13,504 3,423 6,524 5,677 5,539 6,704 6,914 8,068 63,456
Separation rate(c)
Male 4.9 9.2 2.4 1.8 1.7 1.7 2.0 2.4 2.4 2.7
Female 4.5 9.4 2.5 2.4 1.7 1.7 2.4 2.8 2.4 2.8
Total 4.7 9.3 2.4 2.1 1.7 1.7 2.2 2.6 2.4 2.7
(a) Potentially preventable hospitalisations related to dental care are defined as the following ICD-10-AM 6th edn Principal diagnosis categories: K02 Dental caries; K03 Other diseases of hard tissues of teeth; K04 Diseases of pulp and periapical tissues; K05 Gingivitis and periodontal diseases; K06 Other diseases of gingival and edentulous alveolar ridge; K08 Other disorders of teeth and supporting structures; K09.8 Other cysts of oral region, not elsewhere classified; K09.9 Cyst of oral region, unspecified; K12 Stomatitis and related lesions; K13 Other diseases of lip and oral mucosa. Data for 2013–14 are defined using ICD-10-AM 8th edn.
(b) Excludes records with care type of Newborn (without qualified days) and records for Hospital boarders and Posthumous organ procurement.
(c) The separation rates in this table (number of separations per 1,000 population) are crude age-specific population rates based on the 2013 estimated resident population.
Source: AIHW Hospital Morbidity database 2013–14.

Oral health and dental care in Australia: key facts and figures 2015 47
Between 2007–08 and 2013–14, the greatest increase in the number of PPHs due to dental conditions was for the 65 and over age group, increasing from 5,866 to 8,068—a 38% increase. The only age group where there was a decrease was the 35–44 group, from 5,819 to 5,539—a 5% decrease (Table 4.4).
Table 4.4: Number and rate of hospital separations for potentially preventable hospitalisations due to dental conditions(a), by age group, all people, 2007–08 to 2013–14
Age (years)
Year 0–4 5–9 10–14 15–24 25–34 35–44 45–54 55–64 65+ Total
Number(b)
2007–08 7,740 11,533 3,227 6,024 5,304 5,819 6,487 5,985 5,866 57,985
2008–09 7,765 11,724 3,349 6,307 5,332 5,614 6,466 6,345 6,273 59,175
2009–10 7,648 12,236 3,256 6,160 5,344 5,667 6,703 6,566 6,664 60,244
2011–12 7,787 13,503 3,458 6,465 5,630 5,711 6,815 6,571 7,383 63,323
2010–11 7,768 12,694 3,394 6,018 5,399 5,726 6,678 6,388 6,518 60,583
2012–13 7,421 13,511 3,463 6,850 5,889 5,691 6,558 6,517 7,689 63,589
2013–14 7,103 13,504 3,423 6,524 5,677 5,539 6,704 6,914 8,068 63,456
Separation rate(c)
2007–08 5.8 8.7 2.3 2.1 1.8 1.9 2.3 2.6 2.1 2.8
2008–09 5.6 8.8 2.4 2.1 1.8 1.8 2.2 2.7 2.2 2.8
2009–10 5.4 9.1 2.3 2.0 1.8 1.8 2.2 2.7 2.3 2.8
2010–11 5.3 9.3 2.5 2.0 1.7 1.8 2.2 2.6 2.2 2.7
2011–12 5.3 9.7 2.5 2.1 1.8 1.8 2.2 2.6 2.4 2.8
2012–13 5.0 9.5 2.5 2.2 1.8 1.8 2.1 2.5 2.4 2.8
2013–14 4.7 9.3 2.4 2.1 1.7 1.7 2.2 2.6 2.4 2.7
(a) Potentially preventable hospitalisations related to dental care are defined as the following ICD-10-AM 6th edn Principal diagnosis categories: K02 Dental caries; K03 Other diseases of hard tissues of teeth; K04 Diseases of pulp and periapical tissues; K05 Gingivitis and periodontal diseases; K06 Other diseases of gingival and edentulous alveolar ridge; K08 Other disorders of teeth and supporting structures; K09.8 Other cysts of oral region, not elsewhere classified; K09.9 Cyst of oral region, unspecified; K12 Stomatitis and related lesions; K13 Other diseases of lip and oral mucosa. Data for 2013–14 are defined using ICD-10-AM 8th edn.
(b) Excludes records with care type of Newborn (without qualified days) and records for Hospital boarders and Posthumous organ procurement.
(c) The separation rates in this table (number of separations per 1,000 population) are crude age-specific population rates based on the estimated resident population as at 30 June for the respective year. The separation rate for the total column is directly age standardised to the Australian population, using the estimated resident populations as at 30 June for the respective year.
Source: AIHW Hospital Morbidity database 2007–08 to 2013–14.

48 Oral health and dental care in Australia: key facts and figures 2015
For the Aboriginal and Torres Strait Islander population, the separation rate for PPHs due to dental conditions varied, with no clear trend between 2010–11 (4.3 per 1,000 population) and 2011–12 (4.2) (Table 4.5).
Table 4.5: Number and rate of hospital separations for potentially preventable hospitalisations due to dental conditions(a), by age group, Aboriginal and Torres Strait Islander people(b), 2010–11 to 2013–14
Age (years)
Year 0–4 5–9 10–14 15–24 25–34 35–44 45–54 55–64 65+ Total
Number(c)
2010–11 757 876 202 255 266 210 134 66 38 2,804
2011–12 816 976 206 295 268 240 153 78 31 3,063
2012–13 745 1019 215 278 288 253 162 72 29 3,061
2013–14 706 939 194 287 306 230 156 66 37 2,921
Separation rate(d)
2010–11 9.1 11.1 2.6 2.0 3.0 2.6 2.2 1.9 1.8 4.3
2011–12 9.8 12.3 2.6 2.2 2.9 2.9 2.4 2.1 1.4 4.6
2012–13 9.0 12.7 2.7 2.0 3.1 3.1 2.5 1.9 1.2 4.5
2013–14 8.5 11.5 2.5 2.0 3.1 2.8 2.3 1.6 1.5 4.2
(a) Potentially preventable hospitalisations related to dental care are defined as the following ICD-10-AM 6th edn Principal diagnosis categories: K02 Dental caries; K03 Other diseases of hard tissues of teeth; K04 Diseases of pulp and periapical tissues; K05 Gingivitis and periodontal diseases; K06 Other diseases of gingival and edentulous alveolar ridge; K08 Other disorders of teeth and supporting structures; K09.8 Other cysts of oral region, not elsewhere classified; K09.9 Cyst of oral region, unspecified; K12 Stomatitis and related lesions; K13 Other diseases of lip and oral mucosa. Data for 2013–14 are defined using ICD-10-AM 8th edn.
(b) In 2011–12, it was estimated that 88% of Indigenous patients were correctly identified in Australian public hospitals (AIHW 2013). The overall quality of the data provided for Indigenous status in 2012–13 needs some improvement, and varied between states and territories.
(c) Excludes records with care type of Newborn (without qualified days) and records for Hospital boarders and Posthumous organ procurement.
(d) The separation rates used in this table (number of separations per 1,000 population) are crude population rates based on the estimated resident population of Aboriginal and Torres Strait Islander Australians as at 30 June for the respective year.
Sources: AIHW Hospital Morbidity database 2010–11 to 2013–14; Australian Bureau of Statistics, Projected Aboriginal and Torres Strait Islander population, series B, June 2013.

4.2 Hospital separations for oral health procedures involving general anaesthetic
In 2013–14, the total number of hospital separations for dental procedures requiring a general anaesthetic was 130,792, or 5.9 separations per 1,000 population. Across age groups, people aged 15–24 had the highest number of separations (52,670, or 16.9 per 1,000 people aged 15–24), and those aged 65 and over had the lowest (5,744, or 1.7 per 1,000 people aged 65 and over) (Table 4.6).
Between 2007–08 and 2013–14, there was a 7% increase in the total number of separations (from 122,422 to 130,792); however, this increase was broadly consistent with population growth, as the number of separations per 1,000 population remained at 5.9.
Table 4.6: Number and rate of hospital separations for hospitalisations requiring general anaesthesia for procedures related to dental conditions(a), by age group, Australia, 2007–08 to 2013–14
Age (years)
Year 0–4 5–9 10–14 15–24 25–34 35–44 45–54 55–64 65+ Total
Number(b)
2007–08 7,565 11,810 7,587 50,773 19,127 9,443 6,811 5,030 4,276 122,422
2008–09 7,815 12,038 7,405 48,599 18,964 9,642 6,820 4,843 4,228 120,354
2009–10 7,761 12,720 7,850 52,280 19,786 9,802 7,167 5,422 4,721 127,509
2010–11 7,679 13,054 7,847 51,216 19,077 9,505 7,115 5,458 4,803 125,754
2011–12 7,890 14,234 8,161 51,364 19,491 9,641 7,098 5,545 5,288 128,712
2012–13 7,932 14,788 8,208 52,434 19,990 9,393 7,079 5,595 5,680 131,099
2013–14 7,716 14,880 8,375 52,670 19,279 9,351 6,957 5,820 5,744 130,792
Separation rate(c)
2007–08 5.7 8.9 5.5 17.5 6.6 3.1 2.4 2.2 1.6 5.8
2008–09 5.7 9.0 5.4 16.3 6.4 3.1 2.3 2.0 1.5 5.9
2009–10 5.4 9.4 5.7 17.2 6.5 3.1 2.4 2.2 1.6 5.9
2010–11 5.3 9.6 5.7 16.7 6.1 3.0 2.4 2.2 1.6 5.8
2011–12 5.4 10.3 5.9 16.8 6.1 3.0 2.3 2.2 1.7 5.9
2012–13 5.3 10.4 5.9 17 6.1 2.9 2.3 2.2 1.8 5.7
2013–14 5.1 10.2 6.0 16.9 5.7 2.9 2.3 2.2 1.7 5.9
(a) Hospital separations for any of the dental conditions listed that required a general anaesthesia. Dental conditions are as defined by following Australian Classification of Health interventions 6th edn block numbers and procedure codes: 457 Nonsurgical removal of tooth; 458 Surgical removal of tooth; 462 Pulp treatment; 463 Periradicular surgery; 465 Metallic restoration; 466 Tooth-coloured restoration; 468 Inlay, onlay, indirect; 469 Other restorative dental service; 470 Crown; 471 Bridge; 472 Other dental service on crown and bridge; 97241−00 Tooth root resection, per root; 97387−00 Replantation and splinting of tooth; 97388−00 Transplantation of tooth or tooth bud; 97445-00 Exploration or negotiation of calcified root canal, per canal; 97455-00 Irrigation and dressing of root canal system; 97457-00 Obturation of resorption defect or perforation; 97458-00 Interim therapeutic root filling; 97772−00 Provision of resin splint, indirect; 97773−00 Provision of metal splint, indirect; 97778-00 Metallic inlay for denture tooth. Data for 2013–14 are defined using ICD-10-AM 8th edn.
(b) Excludes records with care type of Newborn (without qualified days) and records for Hospital boarders and Posthumous organ procurement.
(c) The separation rates used in this table (number of separations per 1,000 population) are crude population rates based on the estimated resident population as at 30 June for the respective year. The separation rate for the total column is directly age-standardised to the Australian population using the estimated resident populations as at 30 June for the respective year.
Source: AIHW Hospital Morbidity database, 2007–08 to 2013–14.
Oral health and dental care in Australia: key facts and figures 2015 49

50 Oral health and dental care in Australia: key facts and figures 2015
For the Aboriginal and Torres Strait Islander population, the total number of hospital separations for dental procedures requiring a general anaesthetic was 3,157 in 2013–14, or 4.5 per 1,000 Aboriginal and Torres Strait Islander population. Children aged 5–9 had the highest number of separations (923, or 11.3 per 1,000 children aged 5–9), followed by those aged 0–4 (679, or 8.1 per 1,000 children aged 0–4). Adults aged 65 and over had the lowest number of separations for dental procedures requiring a general anaesthetic (20, or 0.8 per 1,000 Aboriginal and Torres Strait Islander people aged 65 and over) (Table 4.7).
Table 4.7: Number and rate of hospital separations for hospitalisations requiring general anaesthesia for procedures related to dental conditions(a), by sex and age group, Aboriginal and Torres Strait Islander people, 2010–10 to 2013–14
Age (years)
Year 0–4 5–9 10–14 15–24 25–34 35–44 45–54 55–64 65+ Total
Number(b)
2010-11 687 805 186 453 294 174 97 46 17 2,759
2011-12(c) 758 955 227 553 317 195 100 55 14 3,174
2012-13 700 984 232 552 345 180 102 33 16 3,144
2013-14 679 923 208 574 376 188 136 53 20 3,157
Separation rate(d)
2010-11 8.2 10.2 2.4 3.5 3.3 2.1 1.6 1.3 0.8 4.2
2011-12(c) 9.1 12 2.9 4.1 3.5 2.4 1.6 1.5 0.6 4.7
2012-13 8.4 12.2 3 4 3.7 2.2 1.6 0.8 0.7 4.6
2013-14 8.1 11.3 2.7 4 3.8 2.3 2 1.3 0.8 4.5
(a) Hospital separations requiring general anaesthesia for dental conditions as defined by following Australian Classification of Health interventions 6th edn block numbers and procedure codes: 457 Nonsurgical removal of tooth; 458 Surgical removal of tooth; 462 Pulp treatment; 463 Periradicular surgery; 465 Metallic restoration; 466 Tooth-coloured restoration; 468 Inlay, onlay, indirect; 469 Other restorative dental service; 470 Crown; 471 Bridge; 472 Other dental service on crown and bridge; 97241−00 Tooth root resection, per root; 97387−00 Replantation and splinting of tooth; 97388−00 Transplantation of tooth or tooth bud; 97445-00 Exploration or negotiation of calcified root canal, per canal; 97455-00 Irrigation and dressing of root canal system; 97457-00 Obturation of resorption defect or perforation; 97458-00 Interim therapeutic root filling; 97772−00 Provision of resin splint, indirect; 97773−00 Provision of metal splint, indirect; 97778-00 Metallic inlay for denture tooth. Data for 2013–14 are defined using ICD-10-AM 8th edn.
(b) Excludes records with care type of Newborn (without qualified days) and records for Hospital boarders and Posthumous organ procurement. (c) In 2011–12, it was estimated that 88% of Indigenous patients were correctly identified in Australian public hospitals (AIHW 2013). The
overall quality of the data provided for Indigenous status in 2012–13 needs some improvement, and varied between states and territories. (d) The separation rates used in this table (number of separations per 1,000 population) are crude population rates based on the estimated
resident population of Aboriginal and Torres Strait Islander Australians as at 30 June for the respective year.
Sources: AIHW Hospital Morbidity database, 2010–11 to 2013–14; Australian Bureau of Statistics, Projected Aboriginal and Torres Strait Islander population, series B, June 2013.

Oral health and dental care in Australia: key facts and figures 2015 51
5 Financial barriers Respondents to the 2013 National Dental Telephone Interview Survey were asked a range of questions relating to the financial burden of dental care. These questions included whether they had avoided or delayed visiting a dentist due to cost, whether cost had prevented them from receiving the recommended treatment, whether dental visiting in the previous year had caused a large financial burden, and whether they would have a lot of difficulty paying for a basic preventive dental care package. In the case of children, an appropriate adult was asked to answer the relevant question on their behalf.
In 2013, the overall proportion of people aged 5 and over who avoided or delayed visiting a dentist due to cost was 31.7%, ranging from 10.7% for children aged 5–14 to 44.9% for adults aged 25–44. Both males and females showed the same pattern of avoidance due to cost by age group. Overall, females had higher rates of avoidance due to cost than males (34.1% compared with 29.4%) (Table 5.1).
There were no statistically significant differences in avoidance due to cost across geographic remoteness regions, ranging from 31.4% in Major cities to 33.5% in Outer regional areas (Table 5.1).
People with insurance had lower rates of avoidance due to cost than those without insurance (20.2% and 43.7%, respectively). Across age groups, people with insurance reported lower rates of avoidance due to cost (ranging from 6.3% to 30.2%) than people without insurance (ranging from 15.5% to 57.5%) (Table 5.1).
Overall, people who were eligible for public dental care were more likely to report avoiding visiting a dentist due to cost (37.9%) than those who were not eligible (29.4%). People aged 25–44 and 45–64 eligible for public dental care reported higher rates of avoidance due to cost than those who were not eligible (62.8% and 59.5%, respectively for those age 25–44; 41.0% and 30.9%, respectively, for those aged 45–64) (Table 5.1).
Those in lower household income groups had higher rates of avoiding or delaying a visit to a dentist due to cost than those in higher income groups (ranging from 40.9% and 42.1% for those in the lowest two income groups to 16.8% for those in the highest income group) (Table 5.1).
Across all income groups, those aged 25–44 and 45–64 were more likely to avoid or delay seeing a dentist, although this pattern was most prevalent in the lower income groups (Table 5.1).

52 Oral health and dental care in Australia: key facts and figures 2015
Table 5.1: Proportion of people who avoided or delayed visiting a dentist due to cost, by selected characteristics, dentate people aged 5 and over, 2013 (%)
Age (years)
5–14 15–24 25–44 45–64 65+ All people
Sex
Male 11.3 20.0 42.7 32.9 20.1 29.4
Female 10.1 26.3 47.1 38.7 26.6 34.1
Remoteness area
Major cities 10.1 22.0 44.5 34.8 23.5 31.4
Inner regional 14.5 26.8 47.5 36.5 18.7 31.8
Outer regional 5.8 26.0 42.9 41.2 35.1 33.5
Remote/Very remote 4.7 21.9 43.7 36.5 28.8 32.2
Insurance status
Insured 6.3 13.4 30.2 22.2 15.0 20.2
Uninsured 15.5 32.6 57.5 54.6 31.9 43.7
Eligibility for public dental care
Eligible 12.5 29.2 62.8 59.5 25.5 37.9
Ineligible 10.0 21.2 41.0 30.9 18.8 29.4
Annual household income ($)
<30,000 14.1 30.0 56.3 63.4 28.9 40.9
30,000–<60,000 15.0 34.6 62.5 47.0 23.2 42.1
60,000–<90,000 12.0 23.3 49.2 33.8 13.5 33.3
90,000–<140,000 6.2 20.4 37.1 28.4 11.8 26.3
140,000+ 5.3 12.4 25.8 15.4 6.5 16.8
All people aged 5 and over 10.7 23.1 44.9 35.8 23.5 31.7
Note: The 95% confidence intervals for these estimates are available in Appendix Table C5.1.
Source: National Dental Telephone Interview Survey 2013.

Oral health and dental care in Australia: key facts and figures 2015 53
Between 1994 and 2013, there was an overall increase in the proportion of adults aged 15 and over avoiding or delaying visiting a dentist due to cost, from 25.0% to 35.0%. For children aged 5–14, there was no overall change, although there was some year-to-year variation (Figure 5.1; Appendix Table B5.1).
Note: Directly age standardised to the 2001 Australian population.
Source: Appendix Table B5.1.
Figure 5.1: Proportion of dentate people aged over 5 who avoided or delayed visiting a dentist due to cost, 1994 to 2013 (%)
In 2013, nearly 20% of people aged 5 and over who visited a dentist in the previous 12 months indicated that cost prevented them from receiving the recommended dental treatment (Table 5.2).
Cost was less likely to prevent recommended care for children aged 5–14 (6.0%) than for adults. Adults aged 25–44 and 45–64 had the highest rates of not receiving recommended dental treatment due to cost (27.9% and 26.2%, respectively).
There was no statistically significant difference in affordability across remoteness areas, ranging from 18.4% in Outer regional areas to 29.3% in Remote/Very remote areas.
People without insurance reported higher rates of not receiving recommended treatment due to cost than people with insurance (25.1% and 15.6%, respectively).
People who were eligible for public dental care were more likely than ineligible people to have cost prevent recommended care (23.3% compared with 18.2%).
Across household income groups, the overall proportion of people not receiving recommended dental treatment due to cost was highest for the two lowest household income groups (27.6% and 24.5%, respectively) and lowest for the two highest groups (17.0% and 11.4%, respectively).

54 Oral health and dental care in Australia: key facts and figures 2015
Table 5.2: Proportion of people reporting that cost prevented recommended dental treatment, by selected characteristics, dentate people aged 5 and over, 2013 (%)
Age (years)
5–14 15–24 25–44 45–64 65+ All people
Sex
Male 5.5 15.5 28.7 23.9 11.7 18.8
Female 6.5 11.1 27.2 28.3 15.7 20.2
Remoteness area
Major cities 5.4 11.0 27.0 26.2 14.2 19.1
Inner regional 9.7 22.1 28.2 27.3 11.4 20.6
Outer regional 4.0 15.4 31.7 22.0 11.6 18.4
Remote/Very remote 0.1 13.1 36.1 42.0 60.8 29.3
Insurance status
Insured 4.7 9.0 20.5 20.4 14.5 15.6
Uninsured 7.7 16.7 37.8 38.2 13.5 25.1
Eligibility for public dental care
Eligible 9.2 19.3 39.9 42.2 15.5 23.3
Ineligible 5.2 11.6 25.3 23.5 10.2 18.2
Annual household income ($)
<30,000 16.7 23.8 42.1 38.5 19.4 27.6
30,000–<60,000 7.9 10.2 42.2 35.3 12.7 24.5
60,000–<90,000 5.3 15.7 32.4 24.8 10.9 20.8
90,000–<140,000 3.5 9.3 23.5 24.6 2.5 17.0
140,000+ 2.9 9.6 15.3 13.8 29.9 11.4
All people aged 5 and over 6.0 13.3 27.9 26.2 13.9 19.5
Notes
1. Data in this table relate to people who made a dental visit in the previous 12 months.
2. The 95% confidence intervals for these estimates are available in Appendix Table C5.2.
Source: National Dental Telephone Interview Survey 2013.

Oral health and dental care in Australia: key facts and figures 2015 55
For the period 1994 to 2013, the proportion of adults aged 15 and over who visited a dentist in the previous 12 months and reported that cost prevented the recommended treatment fluctuated between 13.5% in 2002 and 22.5% in 2013. For children aged 5–14, there was no overall change, fluctuating between 4.3% in 2005 and 8.3%in 1996 (Figure 5.2).
Notes
1. Directly age standardised to the 2001 Australian population.
2. Figures relate to people who visited a dentist in the previous 12 months.
Source: Appendix Table B5.2.
Figure 5.2: Proportion of people stating cost prevented recommended dental treatment, dentate people, 1994 to 2013 (%)
In 2013, 11.7% of dentate people who made a dental visit in the previous 12 months indicated that their dental visits placed a large financial burden on them, ranging from 7.9% for adults aged 65 and over to 15.9% for adults age 45–64 (Table 5.3).
Across remoteness regions, people in Remote/Very remote areas (5.3%) were less likely to report a financial burden due to dental visiting in the previous year than people living in Major cities (12.2%) and Inner regional areas (11.6%).
People with insurance were less likely to report a financial burden (10.2%) than those without insurance (14.2%).
The proportion of people reporting that dental visiting was a large burden was higher for people in the lowest two household income groups (15.3% and 14.5%, respectively) than those in the highest income group (6.6%).

56 Oral health and dental care in Australia: key facts and figures 2015
Table 5.3: Proportion of people stating dental visits were a large financial burden, by selected characteristics, dentate people aged 5 and over, 2013 (%)
Age (years)
5–14 15–24 25–44 45–64 65+ All people
Sex
Male 6.8 9.4 14.1 12.1 3.2 10.0
Female 11.4 7.0 12.3 19.4 11.7 13.2
Remoteness area
Major cities 10.2 9.1 13.1 15.9 8.8 12.2
Inner regional 8.3 6.2 17.7 16.0 6.3 11.6
Outer regional 4.6 4.2 12.8 14.9 5.9 9.6
Remote/Very remote 0.5 1.2 2.0 26.1 — 5.3
Insurance status
Insured 7.2 8.0 11.7 12.7 7.2 10.2
Uninsured 11.5 9.3 15.3 22.9 9.1 14.2
Eligibility for public dental care
Eligible 9.6 12.2 21.7 18.7 8.0 12.7
Ineligible 8.9 7.1 11.1 15.4 7.8 11.2
Annual household income ($)
<30,000 16.4 17.5 19.5 23.0 8.9 15.3
30,000–<60,000 11.9 10.6 20.8 19.3 6.1 14.5
60,000–<90,000 7.3 7.7 17.4 17.6 11.0 13.6
90,000–<140,000 9.0 8.2 9.9 11.9 0.4 9.8
140,000+ 5.6 4.7 7.5 7.7 12.2 6.6
All people aged 5 and over 9.1 8.2 13.1 15.9 7.9 11.7
Notes
1. Data in this table relate to people who made a dental visit in the previous 12 months.
2. The 95% confidence intervals for these estimates are available in Appendix Table C5.3.
Source: National Dental Telephone Interview Survey 2013.
For the period 1994 to 2013, the proportion of adults aged 15 and over who visited a dentist in the previous 12 months and reported that doing so placed a large financial burden fluctuated between 9.8% in 1994 and 13.9% in 1999. There was no overall statistically significant increase over the time period. For children aged 5–14, there was no overall change, fluctuating between 5.3% in 1999 and 9.5% in 2013 (Figure 5.3; Appendix Table B5.3).

Oral health and dental care in Australia: key facts and figures 2015 57
Notes
1. Directly age standardised to the 2001 Australian population.
2. Figures relate to people who visited a dentist in the previous 12 months.
Source: Appendix Table B5.3.
Figure 5.3: Proportion of people stating dental visits were a financial burden, dentate people aged 5 and over, 1994 to 2013 (%)
The cost of a basic preventive dental care package was originally selected as the threshold for measuring the level of difficulty in paying a dental bill. In 2013, the Australian Dental Association Dental Fees Survey reported that the mean cost for a dental visit comprising a dental examination, two bitewing X-rays and a scale and clean service was $206.
When adults aged 18 and over were asked if they would have a lot of difficulty paying a $200 dental bill, 28.3% indicated that they would. A higher proportion of adults aged 18–24 (37.9%) reported that they would have a lot of difficulty paying a $200 dental bill than older adults (Table 5.4).
The proportion reporting a lot of difficulty in paying a $200 dental bill was lower for males than females (22.9% compared with 33.7%). It was also lower for adults with private health insurance that included cover for dental expenses than for those adults without insurance (16.8% compared with 39.5%) and for those ineligible for public dental care than for those who were eligible (22.1% compared with 45.7%). (There may be some overlap between these various groups.)
Difficulty in paying a $200 dental bill was also associated with household income. The proportion indicating that they would have a lot of difficulty ranged from 53.9% for the $30,000 or less income group to 9.9% for those in the $140,000 and over income group.

58 Oral health and dental care in Australia: key facts and figures 2015
Table 5.4: Proportion of people who stated they would have a lot of difficulty paying for a basic preventive visit, by selected characteristics, dentate people aged 18 and over, 2013 (%)
Age (years)
18–24 25–44 45–64 65+ All people
Sex
Male 30.5 22.8 19.8 22.9 22.9
Female 45.7 33.8 32.9 25.6 33.7
Remoteness area
Major cities 39.2 27.3 25.7 23.7 27.9
Inner regional 35.3 35.0 27.5 21.7 29.6
Outer regional 39.7 29.1 28.1 30.9 30.3
Remote/Very remote 10.6 13.6 26.6 35.1 20.0
Insurance status
Insured 32.6 15.4 16 11.8 16.8
Uninsured 43.1 38.9 40.3 36.6 39.5
Eligibility for public dental care
Eligible 50.6 57.3 64.6 28.3 45.7
Ineligible 34.1 22.3 18.6 15.1 22.1
Annual household income ($)
<30,000 67.3 63.7 65.4 39.4 53.9
30,000–<60,000 38.9 43.1 40.2 12.1 35.4
60,000–<90,000 26.6 29.1 24.7 2.9 24.9
90,000–<140,000 37.3 14.8 7.3 3.4 13.8
140,000+ 27.2 6.5 5.9 6.5 9.9
All people aged 18 and over 37.9 28.3 26.4 24.3 28.3
Notes
1. The cost of a basic preventive visit in 2012 was approximately $200.
2. The item ‘Difficulty paying a $200 dental bill’ was collected only for adults aged 18 and over.
3. The 95% confidence intervals for these estimates are available in Appendix Table C5.4.
Source: National Dental Telephone Interview Survey 2013.

Oral health and dental care in Australia: key facts and figures 2015 59
6 Private health insurance In Australia, the private health insurance system is based on individuals or families purchasing insurance that covers all or part of the cost of private health care, including (for some types of insurance) visiting a private dentist. This section reports the proportion of Australians who held private health insurance cover for dental expenses at the time of the survey.
Half (49.7%) of all people over the age of 5 reported having some level of private health insurance cover for dental expenses. Adults aged 45–64 had the highest rate of coverage (57.0%) and those aged 15–24 had the lowest rate (43.7%). About half of dentate adults (50.5%) aged 15 and over reported having insurance for dental expenses, with rates ranging from 43.7% in the 15–24 age group to 58.1% for those aged 45–64. Edentulous adults had much lower rates of insurance for dental expenses, with 23.6% of adults aged 45–64 and 25.3% aged 65 and over having some level of cover (Table 6.1).
Table 6.1: Proportion of people with insurance by age and dentate status, people aged 5 and over, 2013 (%)
Dentate status
Age (years) Dentate Edentulous All persons
5–14 52.0 — 52.0
15–24 43.7 — 43.7
25–44 46.8 — 46.7
45–64 58.1 23.6 57.0
65+ 51.2 25.3 46.2
All people aged 5 and over 50.7 24.7 49.7
Note: The 95% confidence intervals for these estimates are available in Appendix Table C6.1.
Source: National Dental Telephone Interview Survey 2013.
The proportion of people with some insurance was higher in Major cities (53.1%) than in Inner regional and Outer regional areas (44.6% and 43.8%, respectively) (Table 6.2).
People eligible for public dental care had lower rates of insurance than those who were not eligible (30.6 and 57.9%, respectively).
Over two-thirds of people in the annual household income groups over $90,000 had some level of insurance, compared with around one-third of adults in the bottom two income groups (23.4% and 38.7%, respectively).

60 Oral health and dental care in Australia: key facts and figures 2015
Table 6.2: Proportion of people with private health insurance cover for dental care by selected characteristics, dentate people aged 5 and over, 2013 (%)
Age (years)
5–14 15–24 25–44 45–64 65+ All people
Sex
Male 53.5 43.2 44.2 56.7 50.4 49.5
Female 50.4 44.3 49.3 59.4 51.8 51.8
Remoteness area
Major cities 55.7 46.4 47.2 62.6 54.3 53.1
Inner regional 42.1 36.9 44.3 48.5 46.5 44.6
Outer regional 44.7 35.3 44.3 47.5 41.8 43.8
Remote/Very remote 60.9 52.2 60.2 51.9 53.1 57.1
Eligibility for public dental care
Eligible 26.2 21.6 21.3 22.5 45.1 30.6
Ineligible 60.3 51.2 52.2 65.4 65.8 57.9
Annual household income ($)
<30,000 11.5 14.1 17.5 22.8 31.9 23.4
30,000–<60,000 32.8 27.0 25.1 44.6 66.9 38.7
60,000–<90,000 45.6 44.9 40.7 59.7 78.0 50.2
90,000–<140,000 66.1 57.7 68.3 69.4 75.1 67.1
140,000+ 83.5 71.7 72.5 85.6 74.9 77.9
All people aged 5 and over 52.0 43.7 46.8 58.1 51.2 50.7
Note: The 95% confidence intervals for these estimates are available in Appendix Table C6.2.
Source: National Dental Telephone Interview Survey 2013.

Oral health and dental care in Australia: key facts and figures 2015 61
7 Use of private health insurance In 2013, the majority of adults with some form of private health insurance that included cover for dental care reported that their insurance paid some (77.3%) or all (8.5%) of the dental costs of their last visit. Only 10.4% of insured adults paid all their own dental expenses (Table 7.1).
Table 7.1: Proportion of people with insurance who reported that health insurance paid all or some of the cost of their care by source of payment, people aged 18 and over, 2013 (%)
Paid all own expenses
Insurance paid some/patient
paid some
Insurance paid all/patient paid none
Govt paid some/patient or insurance
paid some
Govt paid all/ patient paid
none Other payment
option
Per cent 10.4 77.3 8.5 1.5 1.5 0.8
Note: The 95% confidence intervals for these estimates are available in Appendix Table C7.1.
Source: National Dental Telephone Interview Survey 2013.
Almost one-fifth (18.6%) of insured adults who were required to pay all their own dental expenses indicated that dental care caused a large financial burden. This compared with 4.1% of those for whom insurance paid all expenses, and 10.3% of those who co-contributed (along with their insurer) to the cost of their dental care (Table 7.2).
Table 7.2: Proportion of people who reported that dental care caused a large financial burden by source of payment, insured people aged 18 and over, 2013 (%)
Paid all own
expenses Insurance paid some
Insurance paid all
Govt paid some/patient or insurance
paid some
Govt paid all/patient paid none
Other payment option
All insured people
Per cent 18.6 10.3 4.1 14.4 8.9 8.4 10.4
Note: The 95% confidence intervals for these estimates are available in Appendix Table C7.2.
Source: National Dental Telephone Interview Survey 2013.

62 Oral health and dental care in Australia: key facts and figures 2015
8 Expenditure Recurrent expenditure on dental services in Australia was $8,706 million in 2012–13, up from $5,945 million, adjusted for inflation, in 2002–03. Dental services, in this context, cover a range of services provided by registered dental practitioners, including oral maxillofacial surgery items; orthodontic, pedodontic and periodontic services; cleft lip and palate services; dental assessment and treatment; and other dental items listed in the Medicare Benefits Schedule. Hospital costs—including for potentially preventable hospitalisation due to dental conditions, and hospitalisation for oral health procedures involving general anaesthetic—are not included. In the AIHW health expenditure database, these costs are included in hospital costs.
Total expenditure on dental services increased every year from 2002–03 to 2012–13. Between 2011–12 and 2012–13, expenditure by the Australian and state and territory governments decreased while expenditure by the non-government sector, including individuals and health insurance funds, increased.
In 2012–13, individuals were the largest source of funds for total dental expenditure, paying directly out of pocket for 58.2% of dental costs. A further 16.0% was paid via health insurance funds. Australian Government premium rebates accounted for 7.0% of dental expenditure. Other government contributions to dental expenditure accounted for 18.3% of total expenditure—10.8% from Australian Government direct outlay and 7.5% from state and territory governments (Table 8.2).
In 2012–13, per capita expenditure on dental services was $380, an increase from $303 in 2002–03, adjusted for inflation. Most of this ($284 in 2012–13) was spending by the non-government sector. This was an increase from $248 in 2002–03, adjusted for inflation. Over the period, Australian Government per capita expenditure also increased (from $25 to $68), while state and territory per capita expenditure remained relatively stable at around $29 (Figure 8.1).

Oral health and dental care in Australia: key facts and figures 2015 63
Table 8.1: Total dental expenditure, by sources of funds, constant prices, 2002–03 to 2012–13 ($ million)
Government Non-government
Australian Government
Year
Department of Veterans’
Affairs
Department of Health and other
Premium rebates Total
State/territory and local Total
Health insurance
funds Individuals Other Total Total
expenditure
2002–03 96 11 392 499 583 1,082 954 3,893 16 4,863 5,945
2003–04 90 11 390 492 602 1,093 967 4,088 11 5,066 6,160
2004–05 90 12 396 498 633 1,131 932 4,245 11 5,188 6,319
2005–06 102 13 416 531 626 1,157 948 4,292 12 5,252 6,409
2006–07 116 12 417 545 601 1,146 978 4,364 11 5,353 6,499
2007–08 117 124 460 701 629 1,330 1,007 4,287 11 5,305 6,636
2008–09 108 458 447 1,013 711 1,725 1,086 4,308 24 5,418 7,142
2009–10 110 671 517 1,297 672 1,969 1,093 4,383 33 5,509 7,478
2010–11 107 818 536 1,461 738 2,199 1,140 4,636 36 5,811 8,010
2011–12 106 971 617 1,694 739 2,433 1,200 4,809 35 6,044 8,477
2012–13 100 843 606 1,550 657 2,207 1,396 5,066 37 6,500 8,706
Notes
1. Column/row totals may not sum to total because of rounding of estimates.
2. Constant prices adjust current prices for the effects of inflation. Constant prices estimates indicate what expenditure would have been had 2012–13 prices applied in all years.
Source: AIHW health expenditure database.

64 Oral health and dental care in Australia: key facts and figures 2015
Table 8.2: Contribution of government and non-government funding sources to total dental expenditure, 2008–09 to 2012–13 (%)
Government Non-government
Australian Government
Year
Department of Veterans’
Affairs
Department of Health and other
Premium rebates Total
State/territory and local Total
Health insurance
funds Individuals Other Total Total
expenditure
2002–03 1.6 0.2 6.6 8.4 9.8 18.2 16.0 65.5 0.3 81.8 100.0
2003–04 1.5 0.2 6.3 8.0 9.8 17.7 15.7 66.4 0.2 82.2 100.0
2004–05 1.4 0.2 6.3 7.9 10.0 17.9 14.7 67.2 0.2 82.1 100.0
2005–06 1.6 0.2 6.5 8.3 9.8 18.1 14.8 67.0 0.2 81.9 100.0
2006–07 1.8 0.2 6.4 8.4 9.2 17.6 15.0 67.1 0.2 82.4 100.0
2007–08 1.8 1.9 6.9 10.6 9.5 20.0 15.2 64.6 0.2 79.9 100.0
2008–09 1.5 6.4 6.3 14.2 10.0 24.2 15.2 60.3 0.3 75.9 100.0
2009–10 1.5 9.0 6.9 17.3 9.0 26.3 14.6 58.6 0.4 73.7 100.0
2010–11 1.3 10.2 6.7 18.2 9.2 27.5 14.2 57.9 0.4 72.5 100.0
2011–12 1.3 11.5 7.3 20.0 8.7 28.7 14.2 56.7 0.4 71.3 100.0
2012–13 1.1 9.7 7.0 17.8 7.5 25.4 16.0 58.2 0.4 74.7 100.0
Source: AIHW health expenditure database.

Oral health and dental care in Australia: key facts and figures 2015 65
Source: Appendix Table B8.1.
Figure 8.1: Expenditure on dental services per capita by source of funds, constant prices, 2002–03 to 2012–13
2002–03 2003–04 2004–05 2005–06 2006–07 2007–08 2008–09 2009–10 2010–11 2011–12 2012–13
Year
0
50
100
150
200
250
300
350
400
450
500
Total dental expenditureState/territory and local governmentNon-governmentAustralian government
Amount ($)

66 Oral health and dental care in Australia: key facts and figures 2015
9 Dental workforce
9.1 Size and distribution of the dental workforce In 2013, there were 15,479 dentists registered of whom 88% where employed in their field. There were 1,195 dental prosthetists, 1,759 dental hygienists, 943 oral health therapists and 1,093 dental therapists registered. In each of the professions, 85% or over were employed in their field (Table 9.1).
Table 9.1: Dental practitioners registered and employed, 2013
Practitioner type Registered
(no.) Employed
(%)
Dentists 15,479 88
Dental prosthetists 1,195 94
Dental hygienists 1,759 85
Oral health therapists 943 88
Dental therapists 1,093 88
Source: AIHW National health workforce data set 2013.
In 2013, the number of employed dental practitioners per 100,000 population was 56.0 dentists, 5.0 dental prosthetists, 4.9 dental hygienists, 3.2 oral health therapists and 3.2 dental therapists (Table 9.2).
Across jurisdictions, the number of dentists per 100,000 population ranged from 37.7 in Tasmania to 65.9 in the Australian Capital Territory (Table 9.2).
Table 9.2: Full-time equivalent dental practitioners per 100,000 population, 2013
Practitioner type NSW Vic Qld WA SA Tas ACT NT Australia
Dentists 58.5 52.5 58.3 54.0 58.6 37.7 65.9 38.7 56.0
Dental prosthetists 5.1 5.8 5.2 3.3 3.1 8.3 4.1 1.1 5.0
Dental hygienists 3.6 3.8 4.3 8.4 11.0 2.8 9.5 5.0 4.9
Oral health therapists 2.5 3.0 4.9 1.2 5.2 1.6 4.0 2.0 3.2
Dental therapists 2.0 1.9 3.3 8.2 3.8 7.4 2.7 5.9 3.2
Note: Column/row totals may not sum to total because of rounding of estimates.
Source: AIHW National health workforce data set 2013.
Across remoteness areas, Major cities had the highest number per 100,000 population of dentists (63.1), dental hygienists (5.8) and oral health therapists (3.4).
The number of practising dental prosthetists was highest in Inner regional areas (6.0).
Remote/Very remote regions had the lowest rates of all practitioners—except for dental therapists, who had the highest rate in Remote/Very Remote (5.1) (Table 9.3).

Oral health and dental care in Australia: key facts and figures 2015 67
Table 9.3: Full-time equivalent dental practitioners employed per 100,000 population, by remoteness area, 2013
Practitioner type Major cities Inner regional Outer regional Remote/
Very remote
Dentists 63.1 41.1 38.2 25.7
Dental prosthetists 5.0 6.0 3.3 0.9
Dental hygienists 5.8 2.8 3.3 2.5
Oral health therapists 3.4 2.8 2.9 0.7
Dental therapists 2.9 3.8 4.4 5.1
Note: Column/row totals may not sum to total because of rounding of estimates.
Source: AIHW National health workforce data set 2013.
Approximately 85% of dentists worked in the private sector in their main practice, ranging from 91% in the Australian Capital Territory to 70% in the Northern Territory (Table 9.4).
Table 9.4: Full time equivalent dentists employed per 100,000 population in the public and private sectors, states and territories, 2013
NSW Vic Qld WA SA Tas ACT NT Total
Public 7.6 7.9 10.3 8.6 11.0 6.5 6.1 11.7 8.6
Private 50.8 44.6 48.0 45.4 47.6 31.2 59.9 27.0 47.4
Total 58.5 52.5 58.3 54.0 58.6 37.7 65.9 38.7 56.0
Note: Column/row totals may not sum to total because of rounding of estimates.
Source: AIHW National health workforce data set 2013.
9.2 Characteristics of employed dentists In 2013, there were 13,555 dentists employed in Australia; 38% of these were women and 23% were aged over 50. On average, dentists worked 36 hours a week and just over one-third worked part time. The majority received their initial qualification in Australia (Table 9.5).

68 Oral health and dental care in Australia: key facts and figures 2015
Table 9.5: Selected characteristics of employed dentists by sector, 2011 to 2013
2011 2012 2013
Number 12,599 13,266 13,555
Average weekly hours worked 37.3 37.0 36.3
Full-time equivalent number 12,377.7 12,927.4 12,937.7
Full-time equivalent rate 55.4 56.9 55.9
Part time (%) 30.8 31.7 34.4
Full-time equivalent rate of Major cities 62.8 64.3 63.1
Full time equivalent rate of Inner regional areas 41.3 42.2 41.1
Full-time equivalent rate of Outer regional areas 34.4 36.1 38.1
Full-time equivalent rate of Remote/Very remote areas 22.6 21.5 21.4
Aged 30 and under (%) 19.9 19.6 21.0
Aged 55 and over (%) 22.8 23.4 23.2
Women (%) 35.2 36.5 38.0
Indigenous (%) 0.2 0.2 0.3
Initial qualification Australia (%) n.a. 69.1 64.6
Initial qualification New Zealand (%) n.a. 4.5 4.0
Initial qualification Other countries (%) n.a. 22.8 23.0
Source: AIHW National health workforce data set 2013.

Oral health and dental care in Australia: key facts and figures 2015 69
Dentists predominantly worked in group private practices (52.5%) (Table 9.6).
Table 9.6: Number of dentists by main employment setting, states and territories, 2013
NSW Vic Qld WA SA Tas ACT NT Australia
Solo private practice 1,425 848 581 354 237 45 54 9 3,553
Group private practice 2,162 1,748 1,534 770 575 115 163 43 7,111
Locum private practice 44 14 25 29 6 3 1 2 124
Aboriginal health service 25 11 16 5 1 — 1 5 64
Health promotion service 5 1 — — 1 — — — 7
Other community health-care service 13 15 9 5 4 — — — 46
Hospital 283 143 158 38 68 6 4 6 708
Other residential health-care facility — 4 1 2 — — — — 7
Tertiary educational facility 55 36 68 35 33 1 — — 228
Public clinic (including school dental clinic) 120 262 198 125 66 26 11 12 820
Other educational facility 2 1 3 1 — — — — 7
Correctional service 7 4 2 2 1 — — — 16
Defence forces 33 16 39 11 8 — 14 9 130
Other government department or agency 4 7 4 5 4 1 1 2 28
Other 72 14 15 5 15 1 — 1 123
Unknown/not stated 223 126 125 45 41 6 12 5 583
Total 4,473 3,250 2,778 1,432 1,060 204 261 94 13,555
Note: Column/row totals may not sum to total because of rounding of estimates.
Source: AIHW National health workforce data set 2013.

70 Oral health and dental care in Australia: key facts and figures 2015
9.3 Dental specialists Around 10% of employed dentists were specialists. Nearly 4 in 5 specialists (77.0%) were men. The largest group were orthodontists (535 people, 38%) (Table 9.7).
Table 9.7: Dental specialists: number employed by area of specialty, 2013
Area of specialty Men Women Persons
Oral pathology 4 — 4
Special needs dentistry 5 8 13
Dental-maxillofacial radiology 6 2 8
Forensic odontology 7 3 10
Public health dentistry 7 2 9
Oral medicine 18 10 28
Oral surgery 22 4 26
Paediatric dentistry 36 58 94
Endodontics 111 29 140
Periodontics 142 49 191
Prosthodontics 144 29 173
Oral and maxillofacial surgery 158 14 172
Orthodontics 420 115 535
Total 1,080 323 1,403
Source: AIHW National health workforce data set 2013.

Oral health and dental care in Australia: key facts and figures 2015 71
Appendix A: Data collections used in this report
Child Dental Health Survey
Purpose The Child Dental Health Survey (CDHS) provides time-series data on the oral health status of Australian children attending school dental services (SDS). The aims of the survey are to:
• examine changes over time in oral health status among children • examine the distribution of oral health status by geographic location and demographic
factors. The CDHS has been collected annually since 1977. Data were not available for New South Wales for 2001 to 2006 and 2008 to 2010, and for Victoria from 2005.
Data collection and weighting The CDHS is an ongoing national surveillance program which monitors the dental health of children enrolled in school and community dental services operated by the health departments or authorities of Australia’s state and territory governments. In all jurisdictions, children from both public and private schools are eligible for SDS care. The care typically provided includes dental examinations, preventive services and restorative treatment as required. However, there are some variations among state and territory programs with respect to priority age groups and the nature of services. For example, in some states, caries risk assessment is used to determine recall interval and preventive treatment, while other states do not use caries risk assessment. Hence, there are variations in the extent of enrolments in each SDS, with some jurisdictions serving more than 80% of primary school children and others serving smaller proportions.
In the 2010 collection, data for Victoria were not included as they were not provided by the Victorian Department of Health and Human Services. New South Wales was excluded from the data collection due to a lack of representativeness of the sample. Children are seen in the New South Wales public dental service only if they have been identified as having treatment needs, such as having decay. This means that the oral health of these children does not represent the oral health of the entire child population of New South Wales, many of whom do not have treatment needs.
Data are collected from a random sample of children attending these services in Western Australia and Queensland. Data from the remaining states and territories, excluding Victoria and New South Wales, are collected in full enumeration. The weighting methodology reflected the sample design that was implemented in each state and territory. Data sourced from the annual CDHS were weighted by individual age at the regional level, with regions based on the 2006 Australian Standard Geographical Classification. Where sample size was adequate, regions within a capital city were defined as the Australian Bureau of Statistics’ Statistical Subdivisions, and regions outside capital city areas were defined as Statistical Divisions. Where children received more than one examination during the calendar year,

72 Oral health and dental care in Australia: key facts and figures 2015
only the first record of the year is included in the survey. The higher probability of being selected associated with multiple visits was accounted for in the weighting procedure.
A data quality statement for the CDHS collection is available at <http://meteor.aihw.gov.au/content/index.phtml/itemId/586149>.
National Survey of Adult Oral Health
Purpose The purpose of this collection was to provide a descriptive ‘snapshot’ of oral health in the adult population of Australia. The findings are intended to provide up-to-date evidence that could contribute to the development of oral health policies and programs in Australia.
Data collection The National Survey of Adult Oral Health was conducted in 2004–2006. Information was collected using telephone interviews and standardised dental examinations that were conducted among a sample of residents aged 15 years and older.
Self-reported information about oral health and characteristics associated with it was obtained though telephone interviews.
Information about clinical oral status was collected during standardised dental examinations conducted by dentists who undertook training in the survey procedures. Examinations were limited to people who reported having some of their own natural teeth at the time of the interview. Examining dentists followed a standardised protocol to record levels of tooth loss, dental decay experience, tooth wear and—for participants with no medical contraindications to periodontal probing—signs of gum disease.
Sampling procedure and weighting A three-stage stratified clustered sampling design was used to select people from the target population of Australian residents aged 15 and older. Details of sampling procedure are published in Australia’s dental generations (Slade, Spencer et al. 2007).
Data were weighted to compensate for individuals’ different probabilities of selection and survey participation rates. For the telephone interview survey, weights were adjusted to ensure that survey estimates were consistent with the 2005 Australian Bureau of Statistics estimated resident population data. For the oral examination survey, which was restricted to dentate people aged 15 and over, estimates of the dentate population were derived from the telephone interview survey and used to derive examination weights.
Health expenditure data Health expenditure data, collected and reported annually through AIHW’s Health expenditure Australia, includes estimates of expenditure on dental services—private and public—for state and territory governments and the Australian Government.
The AIHW compiles its health expenditure database from a wide range of government and non-government sources. The data are mainly administrative in nature, though some survey information is included. Since 2008–09, the main source of government expenditure data has

Oral health and dental care in Australia: key facts and figures 2015 73
been the Government Health Expenditure National Minimum Data Set. This data set was developed with the advice of the Health Expenditure Advisory Committee, and reporting is mandatory for all state and territory governments.
Total health expenditure excludes some types of health-related expenditure, including health-related Australian Defence Force expenditure, some local government expenditure and some non-government organisation expenditure.
A data quality statement for this health expenditure database collection is available at <http://meteor.aihw.gov.au/content/index.phtml/itemId/589638>.
National Dental Telephone Interview Survey
Purpose The purposes of the National Dental Telephone Interview Survey (NDTIS) are to:
• collect basic features of oral health and dental care within the Australian population • provide information on the broader parameters of oral health and access to services • monitor the extent of social inequalities within the dental sector • investigate the underlying reasons behind dental behaviours, and the consequences of
these behaviours.
Data collection Data reported in this publication are from the 2013 NDTIS, conducted between May 2013 and March 2014. Data were collected from a random sample of people across Australia via telephone interview. The AIHW Dental Statistics and Research Unit was responsible for the selection and management of the data collection phase. Experienced interviewers conducted telephone interviews using computer-assisted telephone interview software. Data collected included measures of self-reported oral health status, use of and access to dental services, social impact of oral health, financial burden of dental care, and private health insurance that covered dental expenses.
Sampling procedure and weighting The 2013 NDTIS involved a random sample of Australian residents aged 5 and over in all states and territories. In contrast to previous NDTIS surveys, the 2013 sample was sourced from an overlapping dual sampling frame design. The first sampling frame was created from the electronic product ‘Australia on Disc 2012 Residential’ supplied by United Directory Systems. This product is an electronic listing of people/households listed in the White Pages across Australia and is updated annually. Both landline and mobile telephone numbers were provided on records where applicable.
A stratified two-stage sample design was used to select a sample of people from this sampling frame. Records listed on the frame were stratified by state/territory and region where region was defined as Greater Capital City/Rest of State. A systematic sample of records was selected from each stratum using specified sampling fractions. Once telephone contact was made with a selected household, one person aged 18 and over was selected, using the birthdates of adults usually resident in the household. On completion of the adult

74 Oral health and dental care in Australia: key facts and figures 2015
questionnaire, if the household contained children aged 5–17, one child was randomly selected to participate in the survey.
To include households that were not listed in the White Pages, a second sampling frame was used that consisted of 20,000 randomly generated mobile telephone numbers. This sampling frame was supplied by Sampleworx and the mobile telephone numbers were created by appending randomly generated suffix numbers to all known Australian mobile prefix numbers. As the mobile numbers did not contain address information, the sampling frame could not be stratified by geographic region. A random sample of mobile numbers was selected from the frame and contacted to establish the main user of the mobile phone. Providing this person was aged 18 or over, they were asked to participate in the survey. On completion of the adult questionnaire, if the adult’s household contained children aged 5–17, one child was randomly selected to participate in the survey.
The NDTIS sample consisted of 6,931 people participating from the electronic White Pages sampling frame and 1,025 people participating from the randomly generated mobile number sampling frame. In total, a sample of 7,956 people aged 5 and over participated in the survey.
Data were weighted to account for the overlapping dual frame sample design. People selected from the Mobile sampling frame who were listed in the White Pages had a higher chance of being selected in the survey than people who were not listed in the White Pages. A person’s initial weight was calculated as the inverse of their probability of selection in the survey, which was based on the combined probability of the person’s being selected from either sampling frame. To ensure the weighted sample distribution closely reflected the Australian population distribution for a range of sociodemographic characteristics, initial weights were fed into a SAS® Raking macro (Izrael et al. 2009). This macro adjusted the weights iteratively until the weighted sample distributions reflected the 2011 Census distributions. Sociodemographic characteristics used in the raking process were highest qualification attained by age, country of birth, dwelling ownership and household size. Phone ownership was also used in the raking process to ensure appropriate representation of people who were not contactable by the electronic White Pages listing. The raked weights were then further adjusted to ensure consistency with the Australian Bureau of Statistics 2013 age by sex Estimated Residential Population counts for each geographic region.
A data quality statement for this collection is available at <http://meteor.aihw.gov.au/content/index.phtml/itemId/629709>.
National Health Workforce Data Set
Purpose The AIHW National Health Workforce Data Set contains information on the demographics, employment characteristics, primary work location and work activity of all health practitioners in Australia who renewed their registration with their respective health profession board with the National Registration and Accreditation Scheme (NRAS).
The NRAS began on 1 July 2010 and was established by state and territory governments by introducing consistent legislation in all jurisdictions. The Australian Health Practitioner Regulation Agency (AHPRA) administers the NRAS.

Oral health and dental care in Australia: key facts and figures 2015 75
The AIHW National Health Workforce Data Set provides information on the following types of dental practitioners:
• dentists • dental hygienists • dental prosthetists • dental therapists • oral health therapists
Data collection The AIHW National Health Workforce Data Set is a combination of registration and survey data collected through the practitioner registration renewal process.
Registration data Dentists, dental hygienists, dental prosthetists, dental therapists and oral health therapists must be registered to practise in Australia. This requirement applies to those who trained both in Australia and overseas.
Practitioners can renew their registration through the NRAS, either online via the AHPRA website or using a paper form provided by the AHPRA. For initial registration, practitioners must use a paper form and provide supplementary supporting documentation. Limited and provisional registrations also complete paper forms.
Whether for initial registration or renewal, this information is referred to as ‘registration data’. Data collected include demographic information such as age, sex, country of birth, details of health qualification(s) and registration status. This is the compulsory component of the registration process.
The majority of health professionals are due to renew their registration on 30 November each year. Provisional and limited registrants renew on the anniversary of their last registration/renewal.
Registration details on the AIHW National Health Workforce Data Set 2013 were collected either from the compulsory registration renewal form or new registrations. Copies of registration forms for new registrants are available on the relevant board websites, which can be accessed from the AHPRA website <http://www.ahpra.gov.au/>.
Survey data When practitioners renew their registration online, they are asked to complete a non-mandatory online survey customised for each profession. The survey asks about the person’s work in the week before the survey, including their role and the location of their work. It also asks about where people obtained their qualification(s), and about their Indigenous status. Copies of the survey forms are available at <http://www.aihw.gov.au/workforce>.
Database creation The AHPRA stores both online registration data and survey information in separate databases. It sends the two data sets (in de-identified form) to the AIHW. The AIHW processes the data and the final data set is known as the National Health Workforce Data Set.

76 Oral health and dental care in Australia: key facts and figures 2015
Processing involves combining survey and registration data, imputing for non-response and deriving estimates.
Survey responses The response rates for each of the profession surveys are listed in Table A1.
Table A1: National Health Workforce Data Set survey response rates, states and territories, 2013
Practitioner type NSW Vic Qld WA SA Tas ACT NT Australia(a)
Dentists 91.4 90.1 89.2 89.2 88.8 89.9 94.1 92.4 90.0
Dental hygienists 93.0 94.0 95.5 95.8 94.2 100.0 94.3 85.7 94.4
Dental prosthetists 93.3 86.6 91.0 94.3 94.3 100.0 93.3 100.0 91.3
Dental therapists 97.8 95.9 98.0 95.9 97.9 98.0 100.0 100.0 97.1
Oral health therapists 79.8 81.1 91.9 38.6 73.6 70.0 88.2 100.0 81.4
(a) Includes health workers who did not state or adequately describe their state or territory, and those who were overseas.
Source: AIHW National Health Workforce Data Set survey 2013.
Estimation procedures The AIHW uses registration data together with survey data to derive estimates for the total health practitioner workforce for items in the survey. Not all practitioners who receive a survey respond, because it is not mandatory to do so. In deriving the estimates, two sources of non-response to the survey are accounted for:
• item non-response—occurs as some respondents return partially completed surveys. Some survey records were so incomplete that it was decided to omit them from the reported survey data
• survey non-response—occurs because not all registered medical practitioners who receive a questionnaire respond.
Imputation methods are used to account for item non-response and survey non-response.
Imputation: estimation for item non-response
If possible, a reasonable assumption is made about missing information based on responses to other survey questions.
Missing values remaining after this process are considered for their suitability for further imputation based on the level of non-response to that item.
The known probabilities of particular responses occurring are used to assign a response to each record.
Imputation: estimation for population non-response
In 2013, the methodology for population non-response was changed from a weighting-based methodology to a hot deck based imputation
Imputations were made using survey data from records that have similar registration details grouped by registration type, specialty category, sex, age group, remoteness area and state, in that order.

Oral health and dental care in Australia: key facts and figures 2015 77
Because the data were imputed and not weighted, some data may be affected in different ways from those previously published. For example, because a practitioner’s location of main job is most likely to be the same as their registration address, this has been used for the location estimation of non-respondents. Using this estimate rather than weighting will improve the accuracy of estimates for small geographic areas, as previously weighted data would scale up data for individuals across the state/territory and the registration information for records would not be taken into account.
For variables not used in the imputation, it is assumed that respondents and non-respondents have similar characteristics. To the extent assumption is incorrect, the estimates will have some bias.
The data include employed health practitioners who did not state or adequately describe their location, as well as employed health practitioners who were overseas. The national estimates include these groups.
A data quality statement for the AIHW National Workforce Data Set collection is available at <http://meteor.aihw.gov.au/content/index.phtml/itemId/596359>.
National Hospital Morbidity Database The National Hospital Morbidity Database is a collection of records from admitted patient data collection systems in Australian hospitals. The data supplied in this database are based on the National Minimum Data Set for Admitted Patient Care. The AIHW compiles the database from data supplied by the state and territory health authorities. It contains demographic, administrative and length-of-stay data as well as data on the diagnoses of the patients and the procedures they underwent in hospital.
Dental services are classified according to the Australian Classification of Health Interventions, which is the Australian national standard for procedure and intervention coding in Australian hospitals. Principal diagnoses were recorded using the International statistical classification of diseases and related health problems, tenth revision, Australian modification (ICD-10-AM).
More information about the National Hospital Morbidity Database collection is available at <http://www.aihw.gov.au/hospitals-data/national-hospital-morbidity-database/>.
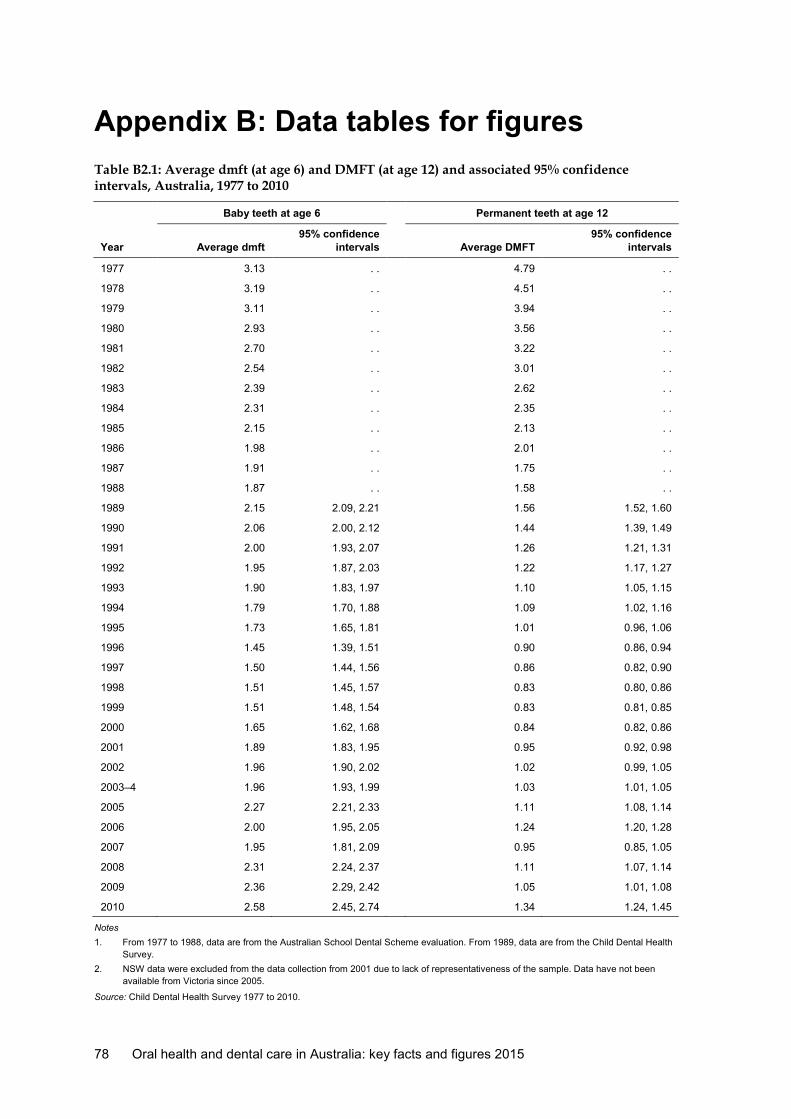
78 Oral health and dental care in Australia: key facts and figures 2015
Appendix B: Data tables for figures Table B2.1: Average dmft (at age 6) and DMFT (at age 12) and associated 95% confidence intervals, Australia, 1977 to 2010
Baby teeth at age 6 Permanent teeth at age 12
Year Average dmft 95% confidence
intervals
Average DMFT 95% confidence
intervals
1977 3.13 . . 4.79 . .
1978 3.19 . . 4.51 . .
1979 3.11 . . 3.94 . .
1980 2.93 . . 3.56 . .
1981 2.70 . . 3.22 . .
1982 2.54 . . 3.01 . .
1983 2.39 . . 2.62 . .
1984 2.31 . . 2.35 . .
1985 2.15 . . 2.13 . .
1986 1.98 . . 2.01 . .
1987 1.91 . . 1.75 . .
1988 1.87 . . 1.58 . .
1989 2.15 2.09, 2.21 1.56 1.52, 1.60
1990 2.06 2.00, 2.12 1.44 1.39, 1.49
1991 2.00 1.93, 2.07 1.26 1.21, 1.31
1992 1.95 1.87, 2.03 1.22 1.17, 1.27
1993 1.90 1.83, 1.97 1.10 1.05, 1.15
1994 1.79 1.70, 1.88 1.09 1.02, 1.16
1995 1.73 1.65, 1.81 1.01 0.96, 1.06
1996 1.45 1.39, 1.51 0.90 0.86, 0.94
1997 1.50 1.44, 1.56 0.86 0.82, 0.90
1998 1.51 1.45, 1.57 0.83 0.80, 0.86
1999 1.51 1.48, 1.54 0.83 0.81, 0.85
2000 1.65 1.62, 1.68 0.84 0.82, 0.86
2001 1.89 1.83, 1.95 0.95 0.92, 0.98
2002 1.96 1.90, 2.02 1.02 0.99, 1.05
2003–4 1.96 1.93, 1.99 1.03 1.01, 1.05
2005 2.27 2.21, 2.33 1.11 1.08, 1.14
2006 2.00 1.95, 2.05 1.24 1.20, 1.28
2007 1.95 1.81, 2.09 0.95 0.85, 1.05
2008 2.31 2.24, 2.37 1.11 1.07, 1.14
2009 2.36 2.29, 2.42 1.05 1.01, 1.08
2010 2.58 2.45, 2.74 1.34 1.24, 1.45
Notes 1. From 1977 to 1988, data are from the Australian School Dental Scheme evaluation. From 1989, data are from the Child Dental Health
Survey. 2. NSW data were excluded from the data collection from 2001 due to lack of representativeness of the sample. Data have not been
available from Victoria since 2005.
Source: Child Dental Health Survey 1977 to 2010.

Oral health and dental care in Australia: key facts and figures 2015 79
Table B2.2: Number of teeth and number of missing teeth, dentate people aged 15 and over, 1994 to 2013
1994 1996 1999 2002 2005 2008 2010 2013
Number of teeth (average)
25.8 26.2 26.5 26.6 26.5 26.5 26.8 27.0
95% CI* 25.6, 26.0 26.0, 26.4 26.2, 26.7 26.3, 26.8 26.4, 26.6 26.3, 26.7 26.6, 26.9 26.9, 27.2
Number of missing teeth (average)
6.2 5.8 5.5 5.4 5.5 5.5 5.2 5.0
95% CI 6.0, 6.5 5.6, 6.0 5.3, 5.8 5.2, 5.7 5.4, 5.6 5.4, 5.7 5.1, 5.4 4.8, 5.1
* CI = confidence interval.
Note: Directly age standardised to the 2001 Australian population.
Sources: National Dental Telephone Interview Surveys, 1994 to 2013.
Table B2.3: Prevalence of any oral health impact, people age 15 and over, 1994 to 2013 1994 1996 1999 2002 2005 2008 2010 2013
Per cent
Toothache experience 10.9 12.2 14.1 13.7 14.9 16.6 14.9 16.2
Uncomfortable with appearance 20.0 19.4 21.7 20.3 24.8 26.3 24.5 26.7
Avoided certain foods 15.2 15.0 17.7 14.8 17.3 20.2 17.1 20.8
Any oral health impact 31.4 33.0 35.5 33.3 38.4 39.9 35.4 38.9
95% confidence intervals
Toothache experience 9.9, 12.0 11.0, 13.4 12.8, 15.5 12.4, 15.1 14.1, 15.7 15.2, 18.0 13.7, 16.2 14.8, 17.6
Uncomfortable with appearance 18.7, 21.3 18.1, 20.8 20.2, 23.2 18.9, 21.8 23.8, 25.7 24.8, 27.9 22.9, 26.1 25.0, 28.5
Avoided certain foods 14.1, 16.4 13.8, 16.2 16.4, 19.0 13.6, 16.1 16.5, 18.1 18.9, 21.6 15.9, 18.4 19.4, 22.2
Any oral health impact 30.0, 32.9 31.4, 34.6 33.8, 37.1 31.7, 35.0 37.3, 39.4 38.2, 41.4 33.9, 37.1 37.2, 40.6
Note: Directly age standardised to the 2001 Australian population.
Sources: National Dental Telephone Interview Surveys, 1994 to 2013.

80 Oral health and dental care in Australia: key facts and figures 2015
Table B2.4: Prevalence of any oral health impact, children aged 5 to 14, 1994 to 2013
1994 1996 1999 2002 2005 2008 2010 2013
Per cent
Toothache experience 7.4 6.2 7.2 5.2 10.4 7.6 8.0 6.8
Avoided certain foods 9.9 8.2 10.0 7.6 10.8 9.3 10.1 12.9
Any oral health impact 13.1 12.4 13.9 10.0 16.3 13.2 13.4 14.9
95% confidence intervals
Toothache experience 5.5, 9.9 4.4, 8.6 5.1, 10.0 3.7, 7.2 8.5, 12.6 5.5, 10.3 6.6, 9.7 4.7, 9.8
Avoided certain foods 7.8, 12.6 6.3, 10.6 7.7, 13.0 5.5, 10.2 8.9, 13.0 7.1, 12.2 8.6, 11.9 10.2, 16.1
Any oral health impact 10.7, 16.1 9.9, 15.5 11.1, 17.4 7.8, 12.8 14.0, 18.9 10.4, 16.4 11.6, 15.4 12.1, 18.3
Note: Directly age standardised to the 2001 Australian population.
Sources: National Dental Telephone Interview Surveys, 1994 to 2013.
Table B3.1: Last dental visit was in the previous 12 months, children aged 5–14 and adults aged 15 and over, 1994 to 2013
1994 1996 1999 2002 2005 2008 2010 2013
Per cent
Children (5–14 years) 79.6 82.3 78.9 81.5 83.0 78.3 78.0 78.4
Adults (15+ years) 56.4 58.3 57.2 58.1 62.1 59.8 60.1 60.3
95% confidence intervals
Children (5–14 years) 76.0, 82.8 79.1, 85.2 74.7, 82.6 77.7, 84.7 80.4, 85.3 74.4, 81.8 75.4,80.4 74.7, 81.7
Adults (15+ years) 54.7, 58.0 56.5, 60.0 55.3, 59.1 56.2, 59.9 61.0, 63.2 58.1, 61.6 60.1, 63.4 60.3, 63.8
Note: Directly age standardised to the 2001 Australian population.
Sources: National Dental Telephone Interview Surveys, 1994 to 2013.

Oral health and dental care in Australia: key facts and figures 2015 81
Table B3.2: Reason for last dental visit, children aged 5–14 and adults aged 15 and over, 1994 to 2013 1994 1996 1999 2002 2005 2008 2010 2013
Per cent
Children (5–14 years)
Check-up 80.0 70.8 73.0 74.6 79.7 80.9 83.1 80.7
Problem 20.0 29.2 27.0 25.4 20.3 19.1 16.9 19.3
Adults (15+ years)
Check-up 48.3 43.4 45.7 51.1 55.5 55.7 61.4 60.5
Problem 51.7 56.6 54.3 48.9 44.5 44.3 38.6 39.5
95% confidence intervals
Children (5–14 years)
Check-up 76.4, 83.1 66.6, 74.7 68.5, 77.0 70.3, 78.6 76.7, 82.4 76.9, 84.3 80.6,85.3 76.8, 84.1
Problem 16.9, 23.6 25.3, 33.4 23.0, 31.5 21.4, 29.7 17.6, 23.3 15.7, 23.1 14.7, 19.4 15.9, 23.2
Adults (15+ years)
Check-up 46.0, 50.5 41.1, 45.8 43.3, 48.2 48.6, 53.6 54.3, 56.7 53.8, 57.7 59.6, 63.2 58.5, 62.4
Problem 49.5, 54.0 54.2, 58.9 51.8, 56.7 46.4, 51.4 43.3, 45.7 42.3, 46.2 36.8, 40.4 37.6, 41.5
Note: Directly age standardised to the 2001 Australian population.
Sources: National Dental Telephone Interview Surveys, 1994 to 2013.
Table B3.3: Type of practice visited at last dental visit, dentate adults aged 15 and over who visited in last 12 months, 1994 to 2013
Type of practice 1994 1996 1999 2002 2005 2008 2010 2013
Per cent
Private 87.8 88.7 87.2 88.9 89.3 89.6 92.5 88.5
Public 9.6 9.7 9.5 9.0 7.9 7.9 5.5 8.7
SDS 1.0 0.8 1.5 0.7 1.3 0.8 0.9 0.7
Other 1.6 0.8 0.6 1.4 1.5 1.7 1.1 2.1
95% confidence intervals
Private 86.3, 89.1 87.1, 90.1 85.5, 88.8 87.4, 90.2 88.4, 90.2 88.0, 90.9 91.4, 93.5 86.9, 89.9
Public 8.4, 10.9 8.3, 11.2 8.2, 11.0 7.8, 10.3 7.1, 8.7 6.8, 9.3 4.7, 6.5 7.5, 10.1
SDS 0.8, 1.4 0.6,1.2 1.1, 2.2 0.4, 1.1 1.0, 1.7 0.5, 1.2 0.7, 1.2 0.4,1.1
Other 1.1, 2.3 0.5, 1.3 0.3, 1.0 1.0, 2.1 1.2, 1.9 1.1, 2.6 0.7, 1.6 1.5, 3.0
Note: Directly age standardised to the 2001 Australian population.
Sources: National Dental Telephone Interview Surveys, 1994 to 2013.

82 Oral health and dental care in Australia: key facts and figures 2015
Table B3.4: Type of practice visited at last dental visit, children aged 5 to 14 who visited in last 12 months, 1994 to 2013
Type of practice 1994 1996 1999 2002 2005 2008 2010 2013
Per cent
Private 40.2 46.8 43.4 46.6 55.2 64.8 67.2 64.1
Public 5.2 6.1 5.3 7.3 3.9 5.8 8.8 14.1
SDS 53.9 46.9 51.4 46.0 40.6 28.9 23.7 20.7
Other 0.7 0.2 — 0.1 0.3 0.6 0.3 1.1
95% confidence intervals
Private 36.1, 44.5 42.5, 51.2 38.5, 48.4 41.9, 51.3 51.5, 58.9 59.9, 69.4 64.1, 70.1 59.4, 68.4
Public 3.4, 7.8 4.2, 8.7 3.3, 8.4 5.0, 10.6 2.7, 5.6 3.8, 8.6 7.1, 10.9 10.8, 18.2
SDS 49.7, 58.0 42.6, 51.2 46.4, 56.3 41.5, 50.6 37.0, 44.3 24.6, 33.6 21.1, 26.5 17.3, 24.6
Other 0.2, 2.4 0.0, 0.7 — 0.0, 0.9 0.1, 0.8 0.2, 1.6 0.1, 0.8 0.5, 2.5
Note: Directly age standardised to the 2001 Australian population.
Sources: National Dental Telephone Interview Surveys, 1994 to 2013.
Table B3.5: Dental visiting pattern, dentate adults aged 18 and over, 1999 to 2013
Visiting pattern 1999 2002 2005 2008 2010 2013
Per cent
Favourable 36.3 43.5 39.6 37.5 45.6 43.9
Intermediate 37.5 41.2 31.9 33.9 32.3 32.6
Unfavourable 26.1 15.2 28.6 28.6 22.1 23.5
95% confidence intervals
Favourable 34.5, 38.2 41.6, 45.5 38.5, 40.7 35.8, 39.2 43.8, 47.4 42.2, 45.7
Intermediate 35.7, 39.4 39.3, 43.2 30.8, 32.9 32.2, 35.6 30.6, 34.0 30.8, 34.4
Unfavourable 24.5, 27.8 13.9, 16.7 27.5, 29.6 27.0, 30.3 20.6, 23.6 21.9, 25.1
Note: Directly age standardised to the 2001 Australian population.
Sources: National Dental Telephone Interview Surveys,1994 to 2013.
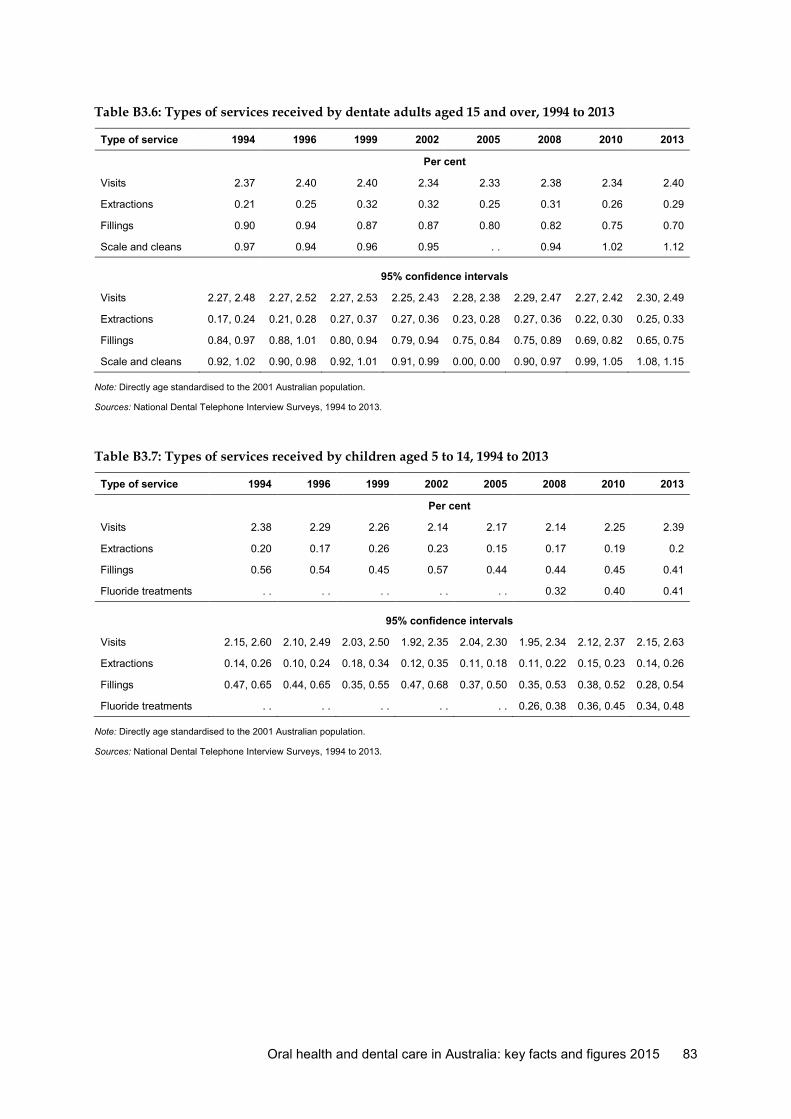
Oral health and dental care in Australia: key facts and figures 2015 83
Table B3.6: Types of services received by dentate adults aged 15 and over, 1994 to 2013
Type of service 1994 1996 1999 2002 2005 2008 2010 2013
Per cent
Visits 2.37 2.40 2.40 2.34 2.33 2.38 2.34 2.40
Extractions 0.21 0.25 0.32 0.32 0.25 0.31 0.26 0.29
Fillings 0.90 0.94 0.87 0.87 0.80 0.82 0.75 0.70
Scale and cleans 0.97 0.94 0.96 0.95 . . 0.94 1.02 1.12
95% confidence intervals
Visits 2.27, 2.48 2.27, 2.52 2.27, 2.53 2.25, 2.43 2.28, 2.38 2.29, 2.47 2.27, 2.42 2.30, 2.49
Extractions 0.17, 0.24 0.21, 0.28 0.27, 0.37 0.27, 0.36 0.23, 0.28 0.27, 0.36 0.22, 0.30 0.25, 0.33
Fillings 0.84, 0.97 0.88, 1.01 0.80, 0.94 0.79, 0.94 0.75, 0.84 0.75, 0.89 0.69, 0.82 0.65, 0.75
Scale and cleans 0.92, 1.02 0.90, 0.98 0.92, 1.01 0.91, 0.99 0.00, 0.00 0.90, 0.97 0.99, 1.05 1.08, 1.15
Note: Directly age standardised to the 2001 Australian population.
Sources: National Dental Telephone Interview Surveys, 1994 to 2013.
Table B3.7: Types of services received by children aged 5 to 14, 1994 to 2013
Type of service 1994 1996 1999 2002 2005 2008 2010 2013
Per cent
Visits 2.38 2.29 2.26 2.14 2.17 2.14 2.25 2.39
Extractions 0.20 0.17 0.26 0.23 0.15 0.17 0.19 0.2
Fillings 0.56 0.54 0.45 0.57 0.44 0.44 0.45 0.41
Fluoride treatments . . . . . . . . . . 0.32 0.40 0.41
95% confidence intervals
Visits 2.15, 2.60 2.10, 2.49 2.03, 2.50 1.92, 2.35 2.04, 2.30 1.95, 2.34 2.12, 2.37 2.15, 2.63
Extractions 0.14, 0.26 0.10, 0.24 0.18, 0.34 0.12, 0.35 0.11, 0.18 0.11, 0.22 0.15, 0.23 0.14, 0.26
Fillings 0.47, 0.65 0.44, 0.65 0.35, 0.55 0.47, 0.68 0.37, 0.50 0.35, 0.53 0.38, 0.52 0.28, 0.54
Fluoride treatments . . . . . . . . . . 0.26, 0.38 0.36, 0.45 0.34, 0.48
Note: Directly age standardised to the 2001 Australian population.
Sources: National Dental Telephone Interview Surveys, 1994 to 2013.

84 Oral health and dental care in Australia: key facts and figures 2015
Table B3.8: Average number of teeth with fissure sealants, Australian children aged 12, 1989 to 2010
Number of fissure sealants
Year Average 95% confidence
interval
1989 0.38 0.37, 0.41
1990 0.54 0.52, 0.57
1991 0.68 0.66, 0.72
1992 0.66 0.64, 0.70
1993 0.72 0.70, 0.76
1994 0.68 0.65, 0.74
1995 0.96 0.93, 1.01
1996 0.98 0.96, 1.02
1997 0.97 0.95, 1.01
1998 0.91 0.89, 0.95
1999 0.95 0.94, 0.97
2000 0.88 0.87, 0.90
2001 1.05 1.03, 1.09
2002 0.96 0.94, 0.99
2003–4 0.87 0.86, 0.89
2005 0.62 0.61, 0.65
2006 0.57 0.56, 0.60
2007 0.65 0.57, 0.72
2008 0.75 0.72, 0.79
2009 0.91 0.87, 0.94
2010 0.73 0.68, 0.79
Notes
1. New South Wales data were excluded from the data collection from 2001 due to lack of representativeness of the sample.
2. Data have not been available from Victoria since 2005.
Source: Child Dental Health Surveys, 1989 to 2010.
Table B5.1: Proportion of people who avoided or delayed visiting a dentist due to cost, dentate people, 1994 to 2013 (%)
1994 1996 1999 2002 2005 2008 2010 2013
Per cent
Adults (15+ years) 25.0 26.9 26.9 26.9 30.2 32.8 30.3 35.0
Children (5–14 years) 13.8 8.6 10.3 10.7 8.5 17.0 13.6 10.7
95% confidence intervals
Adults (15+ years) 23.6, 26.5 25.3, 28.5 25.2, 28.5 25.3, 28.6 29.2, 31.2 31.1, 34.5 28.7, 31.9 33.3, 36.7
Children (5–14 years) 11.2, 16.9 6.6, 11.2 7.8, 13.5 8.3, 13.8 6.8, 10.5 13.8, 20.7 11.7, 15.8 8.4, 13.4
Note: Directly age standardised to the 2001 Australian population.
Sources: National Dental Telephone Interview Surveys, 1994 to 2013.

Oral health and dental care in Australia: key facts and figures 2015 85
Table B5.2: Proportion of people stating cost prevented recommended dental treatment, dentate people, 1994 to 2013 (%)
1994 1996 1999 2002 2005 2008 2010 2013
Per cent
Adults (15+ years) 18.4 21.4 21.8 13.5 20.5 19.2 21.0 22.5
Children (5–14 years) 5.0 8.3 6.5 4.4 4.3 7.1 4.9 5.9
95% confidence intervals
Adults (15+ years) 17.1, 19.7 19.9, 22.9 20.3, 23.3 12.3, 14.9 19.6, 21.5 17.5, 21.1 19.2, 22.8 20.7, 24.5
Children (5–14 years) 3.5, 7.1 6.2, 11.0 4.6, 9.0 2.9, 6.6 3.1, 6.0 5.0, 10.0 3.7, 6.4 4.2, 8.3
Notes
1. Directly age standardised to the 2001 Australian population.
2. Data in this table relate to people who made a dental visit in the previous 12 months.
Sources: National Dental Telephone Interview Surveys, 1994 to 2013.
Table B5.3: Proportion of people stating dental visits were a financial burden, dentate people aged 5 and over, 1994 to 2013 (%)
1994 1996 1999 2002 2005 2008 2010 2013
Per cent
Adults (15+ years) 9.8 10.5 13.9 10.0 13.6 13.1 11.5 12.2
Children (5–14 years) 6.0 7.5 5.3 8.0 9.4 7.7 8.7 9.5
95% confidence intervals
Adults (15+ years) 8.5, 11.2 9.1, 12.0 12.2, 15.8 8.7, 11.5 12.7, 14.6 11.6, 14.7 10.3, 12.9 10.8, 13.8
Children (5–14 years) 4.1, 8.8 5.4, 10.4 3.5, 8.1 5.6, 11.3 7.6, 11.7 5.5, 10.6 7.2, 10.5 7.0, 12.8
Note: Directly age standardised to the 2001 Australian population.
Sources: National Dental Telephone Interview Surveys, 1994 to 2013.

86 Oral health and dental care in Australia: key facts and figures 2015
Table B8.1: Expenditure on dental services per person, by source of funds constant prices, 2002–03 to 2012–13
Australian Government
State/territory and local government
Non-government Total
Per person expenditure ($)
2002–03 25.4 29.8 248.1 303.3
2003–04 24.8 30.4 255.5 310.7
2004–05 24.9 31.6 258.8 315.2
2005–06 26.1 30.8 258.6 315.5
2006–07 26.4 29.1 259.5 315.1
2007–08 33.3 29.9 252.4 315.7
2008–09 47.2 33.1 252.3 332.6
2009–10 59.3 30.7 252.0 342.0
2010–11 65.9 33.3 262.1 361.3
2011–12 75.2 32.8 268.4 376.4
2012–13 67.6 28.7 283.5 379.8
Source: AIHW health expenditure database.

Oral health and dental care in Australia: key facts and figures 2015 87
Appendix C: Confidence intervals for estimates in tables Table C2.1: Prevalence of deciduous and permanent caries experience (dmft + DMFT >0) by age, children attending a school dental service, 2010 (95% confidence intervals)
Age (years
5 6 7 8 9 10 11 12
dmft + DMFT >0 46.1, 50.2 54.4, 58.7 58.0, 62.6 64.0, 69.0 66.0, 71.3 63.9, 68.2 55.2, 59.5 53.8, 60.1
Notes
1. New South Wales was excluded from the data collection due to a lack of representativeness of the sample.
2. Data from Victoria were not available.
Source: Child Dental Health Survey 2010.
Table C2.2: Number of deciduous teeth with caries experience by age, children attending a school dental service, 2010 (95% confidence intervals)
Age (years) Decayed teeth (d) Missing teeth (m) Filled teeth (f) dmft
5 1.71, 1.95 0.10, 0.19 0.31, 0.38 2.19, 2.46
6 1.63, 1.86 0.18, 0.25 0.58, 0.67 2.45, 2.71
7 1.28, 1.45 0.18, 0.24 0.88, 1.03 2.41, 2.66
8 1.07, 1.23 0.17, 0.22 1.20, 1.37 2.50, 2.76
9 0.95, 1.09 0.11, 0.16 1.20, 1.36 2.31, 2.55
10 0.62, 0.72 0.07, 0.09 0.97, 1.09 1.68, 1.87
* CI = confidence interval.
Notes
1. New South Wales was excluded from the data collection due to a lack of representativeness of the sample.
2. Data from Victoria were not available.
Source: Child Dental Health Survey 2010.
Table C2.3: Prevalence of deciduous caries experience (dmft >0) by age, children attending a school dental service, 2010 (95% confidence intervals)
Age (years)
5 6 7 8 9 10
dmft >0 45.7, 49.7 52.9, 57.3 55.2, 59.8 59.9, 64.9 60.4, 65.5 52.4, 56.7
Notes
1. New South Wales was excluded from the data collection due to a lack of representativeness of the sample.
2. Data from Victoria were not available.
Source: Child Dental Health Survey 2010.

88 Oral health and dental care in Australia: key facts and figures 2015
Table C2.4: Number of permanent teeth with caries experience by age, children attending a school dental service, 2010 (95% confidence intervals)
Age (years) Decayed (D) Missing (M) Filled (F) DMFT
6 0.09, 0.13 — 0.01, 0.02 0.11, 0.15
7 0.19, 0.24 — 0.04, 0.05 0.24, 0.29
8 0.25, 0.31 0.01, 0.02 0.12, 0.15 0.39, 0.46
9 0.35, 0.42 0.01, 0.04 0.23, 0.29 0.61, 0.72
10 0.37, 0.45 0.01, 0.02 0.27, 0.33 0.68, 0.78
11 0.45, 0.54 0.02, 0.03 0.39, 0.47 0.89, 1.01
12 0.66, 0.82 0.04, 0.07 0.50, 0.59 1.24, 1.45
13 0.77, 1.02 0.04, 0.07 0.64, 0.79 1.50, 1.82
14 1.12, 1.45 0.05, 0.10 0.92, 1.09 2.18, 2.55
15 1.22, 1.59 0.05, 0.08 1.04, 1.28 2.41, 2.86
Notes
1. New South Wales was excluded from the data collection due to a lack of representativeness of the sample.
2. Data from Victoria were not available.
Source: Child Dental Health Survey 2010.
Table C2.5: Prevalence of permanent caries experience (DMFT >0) by age, children attending a school dental service, 2010 (%) (95% confidence intervals)
Age (years) DMFT >0
6 5.8, 8.4
7 13.7, 16.2
8 20.0, 23.4
9 28.7, 32.9
10 31.2, 34.8
11 36.6, 40.6
12 45.1, 51.4
13 48.7, 55.0
14 60.8, 67.3
Notes
1. New South Wales was excluded from the data collection due to a lack of representativeness of the sample.
2. Data from Victoria were not available.
Source: Child Dental Health Survey 2010.

Oral health and dental care in Australia: key facts and figures 2015 89
Table C2.6: Number of permanent teeth with caries experience by age, dentate people aged 15 and over, 2004–2006 (95% confidence intervals)
Age (years) Decayed (D) Missing (M) Filled (F) DMFT
15–24 0.42, 0.82 0.37, 0.82 1.42, 2.50 2.43, 3.91
25–44 0.60, 0.87 1.35, 1.74 5.70, 6.40 7.89, 8.78
45–64 0.41, 0.60 6.91, 7.64 11.71, 12.42 19.50, 20.18
65+ 0.35, 0.53 12.25, 13.45 9.87, 10.94 23.32, 24.08
All people aged 15 and over 0.54, 0.68 4.31, 4.80 7.40, 7.99 12.41, 13.30
Source: National Survey of Adult Oral Health 2004–2006.
Table C2.7: Number of permanent teeth with caries experience by selected characteristics, dentate people aged 15 and over, 2004–2006 (95% confidence intervals)
Decayed (D) Missing (M) Filled (F) DMFT
Sex
Male 0.60, 0.81 4.14, 4.80 6.80, 7.69 11.76, 13.08
Female 0.43, 0.59 4.32, 4.95 7.77, 8.52 12.72, 13.86
Remoteness area
Major cities 0.47, 0.62 3.87, 4.45 7.25, 7.97 11.77, 12.85
Inner regional 0.57, 0.99 5.30, 6.31 7.54, 8.80 13.91, 15.60
Outer regional 0.48, 0.88 4.10, 5.86 6.58, 8.22 11.63, 14.49
Remote/Very remote 0.69, 1.25 2.37, 4.99 5.75, 7.08 9.55, 12.58
Insurance status
Insured 0.31, 0.45 3.85, 4.49 8.54, 9.45 12.91, 14.18
Uninsured 0.69, 0.93 4.68, 5.40 6.45, 7.13 12.08, 13.21
Eligibility for public dental care
Eligible 0.71, 1.01 6.99, 8.17 6.93, 7.86 15.01, 16.65
Ineligible 0.45, 0.59 3.28, 3.74 7.45, 8.16 11.35, 12.33
Annual household income ($)
<12,000 0.52, 1.60 9.72, 12.32 6.70, 8.63 18.33, 21.15
12,000–<20,000 0.67, 1.10 8.65, 10.52 7.33, 8.64 17.37, 19.53
20,000–<30,000 0.40, 0.70 6.38, 8.03 7.57, 9.14 14.83, 17.40
30,000–<40,000 0.53, 1.05 4.47, 5.88 7.72, 9.19 13.36, 15.47
40,000–<60,000 0.55, 0.80 3.55, 4.40 7.61, 8.84 12.01, 13.74
60,000–<80,000 0.36, 0.65 2.46, 3.19 6.86, 8.27 9.93, 11.84
80,000–<100,000 0.27, 0.55 2.48, 3.66 7.27, 8.95 10.42, 12.76
100,000+ 0.23, 0.62 2.28, 3.01 7.00, 8.55 9.88, 11.80
Source: National Survey of Adult Oral Health 2004–2006.

90 Oral health and dental care in Australia: key facts and figures 2015
Table C2.8: Prevalence of untreated decay, dentate people aged 15 and over, 2004–2006 (%) (95% confidence intervals)
Age (years)
15–24 25–44 45–64 65+ All people
With untreated decay 18.8, 30.0 25.3, 31.6 21.4, 26.3 18.6, 24.9 23.6, 27.3
Source: National Survey of Adult Oral Health 2004–2006.
Table C2.9: Prevalence of untreated decay, dentate people aged 15 and over, 2004–2006 (%) (95% confidence intervals)
Sex Remoteness area
Male Female Major cities Inner regional Outer regional Remote/ Very
remote
With untreated decay 25.4, 31.0 20.4, 24.9 21.3, 25.8 25.4, 34.2 25.0, 35.7 33.2, 42.0
Source: National Survey of Adult Oral Health 2004–2006.
Table C2.10: Prevalence of people with untreated decay by insurance status and eligibility for public dental care, dentate people aged 15 and over, 2004–2006 (%) (95% confidence intervals)
Insurance status Public dental care eligibility
Insured Uninsured Eligible Ineligible
With untreated decay 16.8, 22.0 28.5, 33.8 29.2, 36.7 20.9, 25.1
Source: National Survey of Adult Oral Health 2004–2006.
Table C2.11: Prevalence of untreated decay by annual household income, dentate people aged 15 and over, 2004–2006 (%) (95% confidence intervals)
Annual household income ($)
<12,000 12,000– <20,000
20,000– <30,000
30,000– <40,000
40,000– <60,000
60,000– <80,000
80,000– <100,000 100,000+
With untreated decay 28.1, 42.6 30.1, 40.2 18.8, 28.5 23.1, 34.7 26.8, 35.1 18.2, 26.5 15.8, 28.7 11.6, 21.3
Source: National Survey of Adult Oral Health 2004–2006.
Table C2.12: Number of permanent teeth with caries experience, dentate people aged 15 and over, 1987–88 and 2004–2006 (average) (95% confidence intervals)
Decayed (D) Missing (M) Filled (F) DMFT
1987–88 1.38, 1.56 5.46, 5.94 7.53, 8.01 14.65, 15.24
2004–06 0.54, 0.68 4.31, 4.80 7.40, 7.99 12.41, 13.30
Source: National Survey of Adult Oral Health 2004–2006.
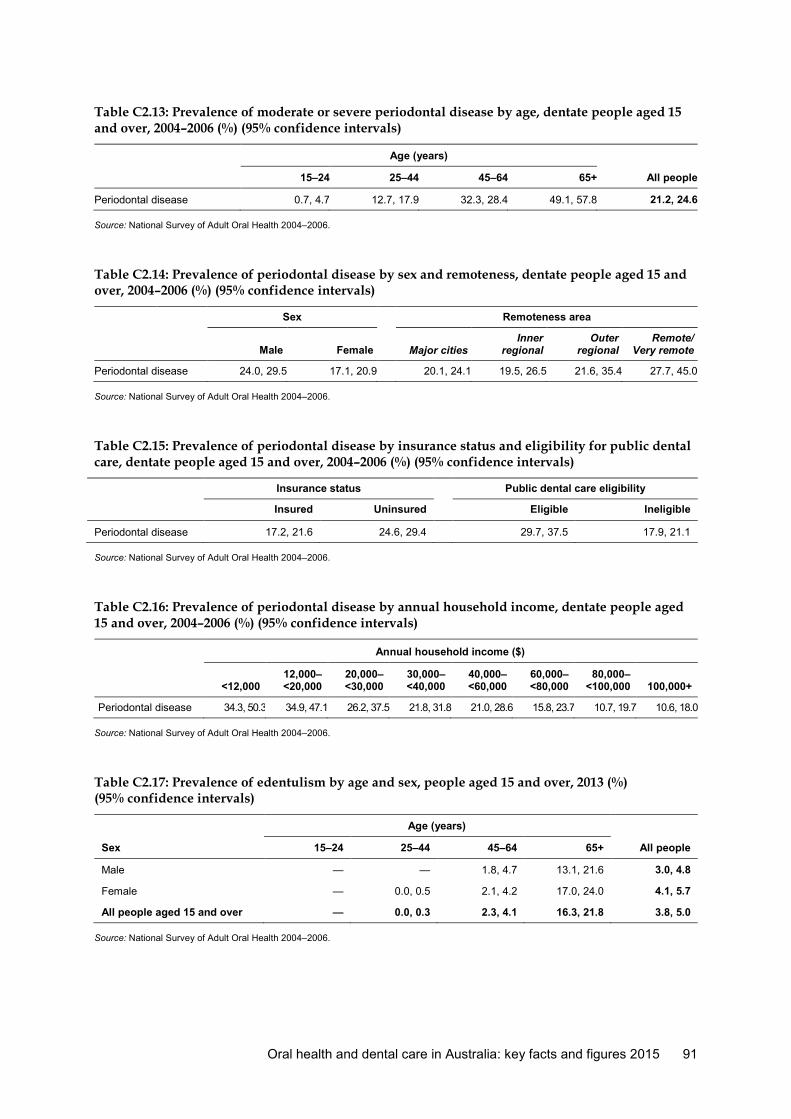
Oral health and dental care in Australia: key facts and figures 2015 91
Table C2.13: Prevalence of moderate or severe periodontal disease by age, dentate people aged 15 and over, 2004–2006 (%) (95% confidence intervals)
Age (years)
15–24 25–44 45–64 65+ All people
Periodontal disease 0.7, 4.7 12.7, 17.9 32.3, 28.4 49.1, 57.8 21.2, 24.6
Source: National Survey of Adult Oral Health 2004–2006.
Table C2.14: Prevalence of periodontal disease by sex and remoteness, dentate people aged 15 and over, 2004–2006 (%) (95% confidence intervals)
Sex Remoteness area
Male Female
Major cities Inner
regional Outer
regional Remote/
Very remote
Periodontal disease 24.0, 29.5 17.1, 20.9 20.1, 24.1 19.5, 26.5 21.6, 35.4 27.7, 45.0
Source: National Survey of Adult Oral Health 2004–2006.
Table C2.15: Prevalence of periodontal disease by insurance status and eligibility for public dental care, dentate people aged 15 and over, 2004–2006 (%) (95% confidence intervals)
Insurance status Public dental care eligibility
Insured Uninsured Eligible Ineligible
Periodontal disease 17.2, 21.6 24.6, 29.4 29.7, 37.5 17.9, 21.1
Source: National Survey of Adult Oral Health 2004–2006.
Table C2.16: Prevalence of periodontal disease by annual household income, dentate people aged 15 and over, 2004–2006 (%) (95% confidence intervals)
Annual household income ($)
<12,000 12,000– <20,000
20,000– <30,000
30,000– <40,000
40,000– <60,000
60,000– <80,000
80,000– <100,000 100,000+
Periodontal disease 34.3, 50.3 34.9, 47.1 26.2, 37.5 21.8, 31.8 21.0, 28.6 15.8, 23.7 10.7, 19.7 10.6, 18.0
Source: National Survey of Adult Oral Health 2004–2006.
Table C2.17: Prevalence of edentulism by age and sex, people aged 15 and over, 2013 (%) (95% confidence intervals)
Age (years)
Sex 15–24 25–44 45–64 65+ All people
Male — — 1.8, 4.7 13.1, 21.6 3.0, 4.8
Female — 0.0, 0.5 2.1, 4.2 17.0, 24.0 4.1, 5.7
All people aged 15 and over — 0.0, 0.3 2.3, 4.1 16.3, 21.8 3.8, 5.0
Source: National Survey of Adult Oral Health 2004–2006.
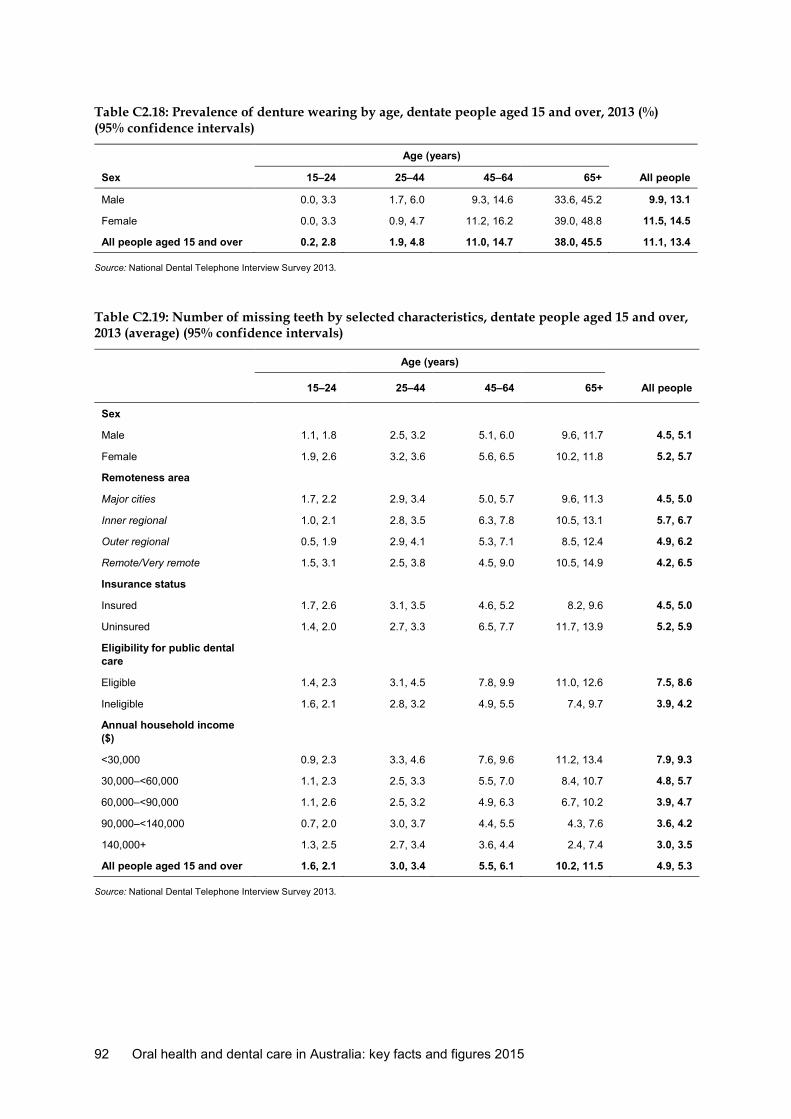
92 Oral health and dental care in Australia: key facts and figures 2015
Table C2.18: Prevalence of denture wearing by age, dentate people aged 15 and over, 2013 (%) (95% confidence intervals)
Age (years)
Sex 15–24 25–44 45–64 65+ All people
Male 0.0, 3.3 1.7, 6.0 9.3, 14.6 33.6, 45.2 9.9, 13.1
Female 0.0, 3.3 0.9, 4.7 11.2, 16.2 39.0, 48.8 11.5, 14.5
All people aged 15 and over 0.2, 2.8 1.9, 4.8 11.0, 14.7 38.0, 45.5 11.1, 13.4
Source: National Dental Telephone Interview Survey 2013.
Table C2.19: Number of missing teeth by selected characteristics, dentate people aged 15 and over, 2013 (average) (95% confidence intervals)
Age (years)
15–24 25–44 45–64 65+ All people
Sex
Male 1.1, 1.8 2.5, 3.2 5.1, 6.0 9.6, 11.7 4.5, 5.1
Female 1.9, 2.6 3.2, 3.6 5.6, 6.5 10.2, 11.8 5.2, 5.7
Remoteness area
Major cities 1.7, 2.2 2.9, 3.4 5.0, 5.7 9.6, 11.3 4.5, 5.0
Inner regional 1.0, 2.1 2.8, 3.5 6.3, 7.8 10.5, 13.1 5.7, 6.7
Outer regional 0.5, 1.9 2.9, 4.1 5.3, 7.1 8.5, 12.4 4.9, 6.2
Remote/Very remote 1.5, 3.1 2.5, 3.8 4.5, 9.0 10.5, 14.9 4.2, 6.5
Insurance status
Insured 1.7, 2.6 3.1, 3.5 4.6, 5.2 8.2, 9.6 4.5, 5.0
Uninsured 1.4, 2.0 2.7, 3.3 6.5, 7.7 11.7, 13.9 5.2, 5.9
Eligibility for public dental care
Eligible 1.4, 2.3 3.1, 4.5 7.8, 9.9 11.0, 12.6 7.5, 8.6
Ineligible 1.6, 2.1 2.8, 3.2 4.9, 5.5 7.4, 9.7 3.9, 4.2
Annual household income ($)
<30,000 0.9, 2.3 3.3, 4.6 7.6, 9.6 11.2, 13.4 7.9, 9.3
30,000–<60,000 1.1, 2.3 2.5, 3.3 5.5, 7.0 8.4, 10.7 4.8, 5.7
60,000–<90,000 1.1, 2.6 2.5, 3.2 4.9, 6.3 6.7, 10.2 3.9, 4.7
90,000–<140,000 0.7, 2.0 3.0, 3.7 4.4, 5.5 4.3, 7.6 3.6, 4.2
140,000+ 1.3, 2.5 2.7, 3.4 3.6, 4.4 2.4, 7.4 3.0, 3.5
All people aged 15 and over 1.6, 2.1 3.0, 3.4 5.5, 6.1 10.2, 11.5 4.9, 5.3
Source: National Dental Telephone Interview Survey 2013.

Oral health and dental care in Australia: key facts and figures 2015 93
Table C2.20: Number of missing teeth by annual household income, insurance status and region, dentate people aged 15 and over, 2013 (average) (95% confidence intervals)
Annual household income ($)
Insurance status/ Remoteness location <30,000
30,000–<60,000
60,000–<90,000
90,000–<140,000 140,000+ All people
Insured
Major cities 6.4, 8.9 5.0, 6.8 4.1, 5.4 3.5, 4.3 2.9, 3.5 4.2, 4.8
Inner regional 6.1, 10.1 5.8, 8.9 3.6, 5.0 3.7, 5.6 3.1, 4.4 5.0, 6.2
Outer regional 4.9, 9.0 3.4, 5.9 2.8, 4.8 3.6, 5.1 2.6, 4.2 3.9, 4.9
Remote/Very remote 5.5, 14.1 2.9, 8.3 0.7, 8.1 3.2, 7.6 2.4, 4.1 3.5, 5.8
All insured 6.8, 8.7 5.4, 6.8 4.1, 5.1 3.7, 4.5 3.0, 3.5 4.4, 4.9
Uninsured
Major cities 7.3, 9.6 3.4, 4.7 3.1, 4.7 2.9, 4.3 2.4, 3.8 4.7, 5.6
Inner regional 8.7, 11.8 4.3, 7.4 3.5, 6.0 2.2, 4.0 3.3, 6.5 5.8, 7.4
Outer regional 8.2, 13.0 3.9, 8.1 2.7, 5.6 3.5, 5.7 0.1, 3.2 5.6, 8.0
Remote/Very remote 2.3, 13.8 3.2, 11.6 1.1, 6.2 3.2, 5.6 1.7, 4.1 4.2, 9.1
All uninsured 8.2, 9.9 4.1, 5.3 3.5, 4.7 3.1, 4.1 2.5, 3.8 5.3, 6.0
All people
Major cities 7.4, 9.1 4.3, 5.3 3.9, 4.9 3.5, 4.2 2.9, 3.5 4.6, 5.0
Inner regional 8.5, 11.0 5.3, 7.6 3.8, 5.3 3.4, 4.8 3.4, 4.7 5.6, 6.6
Outer regional 7.9, 11.9 4.1, 6.8 3.1, 4.8 3.8, 5.1 1.8, 3.7 5.0, 6.5
Remote/Very remote 3.5, 13.3 3.7, 10.0 1.7, 6.5 3.4, 7.0 2.5, 4.0 4.3, 6.8
All people aged 15 and over 7.9, 9.3 4.8, 5.7 3.9, 4.7 3.6, 4.2 3.0, 3.5 4.9, 5.3
Source: National Dental Telephone Interview Survey 2013.
Table C2.21: Prevalence of complete tooth loss among adults in Australia, New Zealand and Canada (%) (95% confidence intervals)
Australia New Zealand Australia Canada
All persons aged 18 and over
All persons aged 20–79 3.8, 5.1 4.9, 8.3
18–24 years . . —, 0.8 20–39 years 0.0, 0.5 . . 25–34 years . . —, 0.1
35–44 years 0.0, 0.7 0.4, 4.3 40–59 years 2.3, 4.0 3.0, 6.3 45–54 years 1.8, 4.3 1.8, 5.2 55–64 years 6.5, 10.5 10.6, 18.7 60–79 years 13.0, 17.7 15.7, 29.1 65–74 years 11.9, 18.4 23.2, 36.1 75 years and over 22.2, 33.5 32.8, 46.5
Sources: Health Canada (2010); National Dental Telephone Interview Survey 2013; New Zealand Ministry of Health (2010).

94 Oral health and dental care in Australia: key facts and figures 2015
Table C2.22: Prevalence of toothache experience in the previous 12 months by selected characteristics, dentate people aged 15 and over, 2013 (%) (95% confidence intervals)
Age (years)
15–24 25–44 45–64 65+ All people
Sex
Male 9.8, 19.1 14.4, 22.4 11.5, 17.3 4.8, 11.7 13.0, 17.0
Female 10.2, 18.8 18.9, 26.8 13.6, 19.3 6.0, 13.1 15.4, 19.3
Remoteness area
Major cities 10.5, 18.1 17.4, 24.3 12.1, 17.0 6.3, 12.5 14.5, 17.9
Inner regional 10.7, 25.4 13.1, 23.8 11.8, 20.6 1.7, 7.7 12.4, 17.7
Outer regional 0.0, 16.1 13.6, 28.9 12.3, 26.3 3.3, 23.2 13.0, 21.4
Remote/Very remote 0.0, 21.6 6.9, 45.9 1.2, 29.9 0.0, 63.9 9.7, 33.7
Insurance status
Insured 7.5, 16.0 11.7, 18.4 9.5, 14.0 4.6, 10.8 10.7, 13.9
Uninsured 11.7, 20.8 21.4, 30.3 16.9, 24.4 5.9, 13.5 17.9, 22.5
Eligibility for public dental care
Eligible 13.1, 26.9 25.5, 41.7 22.0, 34.2 6.3, 12.4 17.5, 23.3
Ineligible 9.2, 16.4 15.2, 21.0 10.7, 14.9 3.8, 12.3 13.2, 16.3
Annual household income ($)
<30,000 19.0, 47.0 25.5, 48.8 23.6, 37.7 6.3, 14.6 19.8, 27.8
30,000–<60,000 9.5, 26.4 18.6, 32.9 12.9, 23.5 2.4, 9.6 15.1, 21.8
60,000–<90,000 2.5, 19.6 18.4, 32.1 9.5, 18.2 2.3, 16.2 14.4, 21.7
90,000–<140,000 3.2, 11.9 9.6, 19.5 8.2, 15.4 0.0, 5.0 9.4, 14.8
140,000+ 5.1, 17.1 5.9, 12.7 4.5, 10.7 0.0, 15.8 6.8, 11.4
All people aged 15 and over 11.3, 17.7 17.8, 23.4 13.4, 17.5 6.4, 11.4 14.8, 17.6
Source: National Dental Telephone Interview Survey 2013.

Oral health and dental care in Australia: key facts and figures 2015 95
Table C2.23: Prevalence of feeling uncomfortable about dental appearance in the previous 12 months by selected characteristics, people aged 15 and over, 2013 (%) (95% confidence intervals)
Age (years)
15–24 25–44 45–64 65+ All people
Sex
Male 12.2, 25.9 19.2, 28.7 22.1, 29.7 12.2, 20.7 20.2, 25.1
Female 18.3, 33.0 27.3, 35.9 31.5, 38.4 22.0, 29.8 28.7, 33.2
Dentate status
Dentate 17.3, 27.3 24.8, 31.2 28.0, 33.2 19.2, 25.7 25.5, 29.0
Edentulous — 0.0, 89.6 18.5, 48.7 12.1, 25.0 16.0, 28.3
Remoteness area
Major cities 13.8, 25.2 25.7, 33.6 26.5, 33.0 17.3, 24.6 24.8, 29.0
Inner regional 20.6, 45.2 16.0, 27.5 27.0, 37.6 17.3, 28.4 24.1, 30.5
Outer regional 7.2, 54.1 16.5, 32.9 26.7, 42.0 13.8, 29.9 23.2, 32.8
Remote/Very remote 0.0, 33.9 6.7, 36.1 17.5, 49.5 8.0, 66.3 16.6, 37.3
Insurance status
Insured 14.3, 30.0 19.3, 27.7 20.9, 26.9 18.0, 26.4 21.2, 25.4
Uninsured 16.1, 30.6 27.1, 36.7 35.3, 44.1 17.3, 25.2 28.3, 33.5
Eligibility for public dental care
Eligible 17.6, 39.9 36.3, 53.6 40.5, 53.5 18.9, 25.8 29.7, 36.0
Ineligible 14.7, 25.9 21.4, 28.2 24.2, 29.7 14.8, 25.4 22.8, 26.7
Annual household income ($)
<30,000 10.0, 45.8 34.3, 58.4 37.4, 51.7 18.8, 27.4 29.2, 37.0
30,000–<60,000 5.1, 24.4 22.9, 38.0 29.9, 42.3 16.4, 27.8 25.2, 32.8
60,000–<90,000 12.7, 47.6 21.8, 36.5 26.8, 39.5 13.3, 36.0 25.8, 34.7
90,000–<140,000 8.3, 30.8 18.5, 31.6 20.0, 30.4 7.3, 35.1 20.5, 28.5
140,000+ 11.0, 35.1 12.1, 23.7 10.8, 20.5 0.4, 48.9 14.2, 21.7
All people aged 15 and over 17.3, 27.3 24.8, 31.2 28.1, 33.3 18.8, 24.6 25.4, 28.7
Source: National Dental Telephone Interview Survey 2013.

96 Oral health and dental care in Australia: key facts and figures 2015
Table C2.24: Prevalence of avoiding certain foods in the previous 12 months by selected characteristics, people aged 15 and over, 2013 (%) (95% confidence intervals)
Age (years)
15–24 25–44 45–64 65+ All people
Sex
Male 7.8, 16.2 14.1, 22.4 16.6, 23.1 15.1, 24.3 15.8, 20.0
Female 12.4, 22.0 19.2, 26.3 24.0, 30.5 21.8, 29.7 21.9, 25.7
Dentate status
Dentate 11.3, 17.7 17.7, 23.2 20.5, 25.1 17.9, 24.5 18.8, 21.7
Edentulous — 0.0, 94.2 33.6, 61.9 23.1, 37.6 27.8, 40.8
Remoteness area
Major cities 10.3, 18.1 17.4, 24.1 19.2, 24.9 19.9, 27.8 18.8, 22.3
Inner regional 8.6, 21.9 11.7, 20.8 21.5, 31.0 13.9, 23.8 17.5, 22.8
Outer regional 6.6, 28.8 16.3, 33.0 21.0, 35.5 19.4, 38.5 21.4, 30.2
Remote/Very remote 0.0, 24.0 5.9, 43.3 7.4, 37.6 0.1, 17.1 10.0, 30.9
Insurance status
Insured 8.3, 17.3 14.2, 21.1 14.8, 19.7 14.8, 22.7 15.3, 18.7
Uninsured 12.2, 21.8 18.4, 26.7 28.0, 36.2 22.1, 30.9 22.6, 27.1
Eligibility for public dental care
Eligible 10.0, 24.0 23.9, 38.9 35.2, 47.9 21.6, 29.0 25.7, 31.3
Ineligible 10.2, 17.4 15.5, 21.3 17.3, 21.9 11.9, 20.6 16.3, 19.5
Annual household income ($)
<30,000 12.8, 37.4 23.9, 44.6 38.3, 52.3 21.7, 31.1 28.5, 35.8
30,000–<60,000 10.1, 26.6 17.0, 31.0 23.3, 35.0 13.9, 24.6 20.4, 27.2
60,000–<90,000 4.1, 20.1 15.6, 29.0 15.3, 24.5 10.0, 28.8 16.2, 23.4
90,000–<140,000 5.8, 20.7 14.1, 24.4 11.1, 19.4 2.2, 21.7 13.6, 19.7
140,000+ 4.5, 17.5 6.9, 16.3 7.1, 13.7 0.0, 33.6 8.4, 13.9
All people aged 15 and over 11.3, 17.7 17.8, 23.2 21.3, 25.9 20.0, 26.0 19.5, 22.3
Source: National Dental Telephone Interview Survey 2013.

Oral health and dental care in Australia: key facts and figures 2015 97
Table C3.1: Time since last dental visit by age and sex, dentate people aged 5 and over, 2013 (%) (95% confidence intervals)
Time since last visit
<12 months 1–<2 years 2–<5 years 5+ years or never
Sex
Male 58.8, 63.6 15.5, 19.2 10.0, 13.2 8.6, 11.7
Female 65.3, 69.5 15.8, 19.2 8.3, 11.1 4.5, 6.7
Age (years)
5–14 75.1, 82.1 9.3, 14.8 1.7, 4.2 4.9, 9.4
15–24 62.3, 70.7 16.4, 23.3 7.1, 12.5 2.6, 6.9
25–44 51.9, 58.5 17.5, 22.9 12.9, 17.6 7.9, 11.8
45–64 61.1, 66.4 16.0, 20.2 8.3, 11.8 6.7, 10.2
65+ 66.3, 73.7 10.1, 15.0 8.2, 13.3 5.0, 9.9
All people aged 5 and over 62.8, 65.9 16.1, 18.6 9.6, 11.6 6.9, 8.8
Source: National Dental Telephone Interview Survey 2013.

98 Oral health and dental care in Australia: key facts and figures 2015
Table C3.2: Time since last dental visit by selected characteristics, dentate people aged 15 and over, 2013 (%) (95% confidence intervals)
Time since last visit
<12 months 1–<2 years 2–<5 years 5+ years or never
Sex
Male 55.7, 60.9 16.0, 20.1 11.4, 14.9 9.0, 12.5
Female 63.5, 68.0 16.6, 20.3 9.1, 12.3 4.2, 6.4
Remoteness area
Major cities 61.9, 66.2 15.6, 19.0 9.7, 12.5 6.5, 9.1
Inner regional 54.1, 61.2 17.1, 23.0 11.4, 16.8 6.6, 10.9
Outer regional 51.1, 61.3 16.9, 24.8 11.9, 19.8 5.4, 11.0
Remote/Very remote 43.1, 65.6 19.7, 39.0 4.3, 11.3 5.8, 16.6
Insurance status
Insured 71.7, 75.7 13.4, 16.8 6.4, 8.9 3.0, 4.6
Uninsured 48.2, 53.7 19.1, 23.5 13.6, 17.6 10.5, 14.3
Eligibility for public dental care
Eligible 58.1, 64.7 15.7, 21.1 10.1, 14.4 6.4, 10.4
Ineligible 60.3, 64.4 16.6, 19.8 10.3, 13.1 6.7, 9.2
Annual household income ($)
<30,000 52.8, 61.3 15.1, 21.3 11.4, 17.6 8.1, 14.0
30,000–<60,000 52.7, 60.9 16.9, 23.8 11.0, 17.0 7.0, 12.4
60,000–<90,000 55.4, 63.9 15.8, 22.6 9.1, 14.6 7.4, 12.9
90,000–<140,000 63.1, 70.5 14.2, 20.3 8.4, 13.1 4.0, 7.8
140,000+ 63.6, 71.9 14.1, 20.6 6.7, 12.4 4.0, 8.4
All people aged 15 and over 60.3, 63.8 16.9, 19.6 10.7, 13.0 6.9, 9.0
Source: National Dental Telephone Interview Survey 2013.
Table C3.3: Proportions of adults who made a dental visit in the previous 12 months, Australia, New Zealand and Canada (%) (95% confidence intervals)
Australia New Zealand Australia Canada
All persons aged 18 and over 50.5, 60.8 27.7, 46.1
All persons aged 20–79
18–24 years 53.5, 63.7 37.0, 52.3 20–39 years 51.6, 58.2 64.1, 71.5 25–34 years 52.7, 60.4 38.0, 48.6 35–44 years 56.5, 63.3 50.2, 61.3 40–59 years 58.7, 63.5 75.0, 81.6 45–54 years 59.3, 65.8 49.7, 91.7 55–64 years 54.5, 63.5 41.9, 53.6 60–79 years 57.0, 63.2 72.9, 81.3 65–74 years 48.4, 60.8 34.1, 46.5 75 years and over 50.5, 60.8 27.7, 46.1
Sources: Health Canada 2010; National Dental Telephone Interview Survey 2013; New Zealand Ministry of Health 2010.

Oral health and dental care in Australia: key facts and figures 2015 99
Table C3.4: Reason for last dental visit by selected characteristics, proportion of dentate people aged 5 and over, 2013 (%) (95% confidence intervals)
Reason for last visit
Check-up Problem
Sex
Male 59.8, 65.0 35.0, 40.2
Female 62.3, 66.8 33.2, 37.7
Age (years)
5–14 76.4, 83.6 16.4, 23.6
15–24 71.4, 79.6 20.4, 28.6
25–44 57.5, 65.0 35.0, 42.5
45–64 51.5, 57.3 42.7, 48.5
65+ 49.1, 57.2 42.8, 50.9
Remoteness area
Major cities 63.0, 67.2 32.8, 37.0
Inner regional 55.0, 62.1 37.9, 45.0
Outer regional 56.9, 66.9 33.1, 43.1
Remote/Very remote 45.0, 69.0 31.0, 55.0
Insurance status
Insured 67.4, 71.5 28.5, 32.6
Uninsured 53.1, 58.8 41.2, 46.9
Eligibility for public dental care
Eligible 51.0, 58.0 42.0, 49.0
Ineligible 64.7, 68.5 31.5, 35.3
Annual household income ($)
<30,000 43.7, 53.0 47.0, 56.3
30,000–<60,000 57.1, 65.2 34.8, 42.9
60,000–<90,000 57.4, 66.0 34.0, 42.6
90,000–<140,000 65.1, 72.1 27.9, 34.9
140,000+ 70.7, 77.9 22.1, 29.3
All people aged 5 and over 61.8, 65.2 34.8, 38.2
Source: National Dental Telephone Interview Survey 2013.
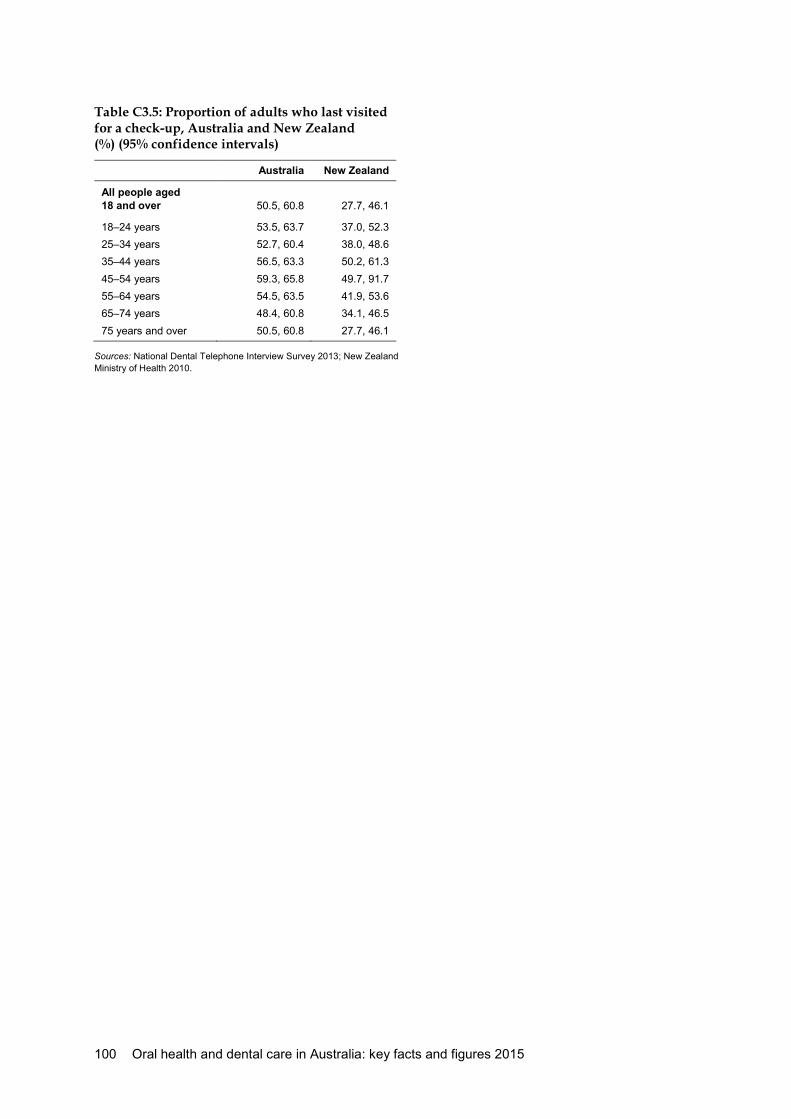
100 Oral health and dental care in Australia: key facts and figures 2015
Table C3.5: Proportion of adults who last visited for a check-up, Australia and New Zealand (%) (95% confidence intervals)
Australia New Zealand
All people aged 18 and over 50.5, 60.8 27.7, 46.1
18–24 years 53.5, 63.7 37.0, 52.3 25–34 years 52.7, 60.4 38.0, 48.6 35–44 years 56.5, 63.3 50.2, 61.3 45–54 years 59.3, 65.8 49.7, 91.7 55–64 years 54.5, 63.5 41.9, 53.6 65–74 years 48.4, 60.8 34.1, 46.5 75 years and over 50.5, 60.8 27.7, 46.1
Sources: National Dental Telephone Interview Survey 2013; New Zealand Ministry of Health 2010.

Oral health and dental care in Australia: key facts and figures 2015 101
Table C3.6: Type of practice visited at last dental visit by selected characteristics, proportion of dentate people aged 5 and over who visited in last 12 months, 2013 (%) (95% confidence intervals)
Type of practice visited at last dental visit
Private Public SDS Other
Sex
Male 81.2, 85.6 8.2, 11.9 3.1, 5.0 1.8, 4.0
Female 83.0, 87.1 7.7, 11.0 3.4, 5.9 0.7, 2.0
Age (years)
5–14 58.8, 68.1 10.5, 17.9 17.8, 25.6 0.5, 2.6
15–24 78.3, 86.4 8.2, 15.0 2.4, 6.1 1.0, 5.1
25–44 86.0, 91.7 5.4, 10.4 0.0, 0.1 2.0, 5.3
45–64 90.9, 94.6 4.2, 7.4 0.0, 0.7 0.7, 2.6
65+ 81.5, 88.5 10.9, 17.8 0.0, 0.3 0.2, 1.6
Remoteness area
Major cities 84.7, 88.2 7.0, 9.8 2.4, 4.3 1.3, 2.8
Inner regional 76.6, 83.5 9.6, 15.4 4.6, 8.7 0.5, 2.7
Outer regional 71.7, 81.5 8.3, 16.0 6.0, 10.9 1.4, 7.7
Remote/Very remote 49.4, 79.5 11.8, 43.1 4.0, 13.9 0.6, 7.3
Insurance status
Insured 92.0, 94.3 2.4, 4.1 2.0, 3.3 0.7, 1.8
Uninsured 68.2, 74.4 16.3, 21.6 5.2, 8.6 2.0, 4.6
Eligibility for public dental care
Eligible 66.5, 73.9 21.0, 28.0 3.2, 6.3 0.4, 2.2
Ineligible 87.4, 90.5 3.7, 5.8 3.3, 5.2 1.6, 3.1
Annual household income ($)
<30,000 59.6, 70.4 24.9, 35.6 2.1, 5.6 0.4, 4.4
30,000–<60,000 78.3, 85.7 8.7, 14.6 3.4, 8.2 0.4, 2.9
60,000–<90,000 81.9, 89.0 4.6, 9.7 3.8, 8.8 0.7, 3.9
90,000–<140,000 87.6, 92.5 1.6, 4.5 3.6, 7.0 1.1, 3.6
140,000+ 89.5, 94.0 1.4, 3.7 2.3, 5.4 1.1, 3.9
All people aged 5 and over 82.8, 85.8 8.4, 10.8 3.5, 5.1 1.4, 2.6
Source: National Dental Telephone Interview Survey 2013.

102 Oral health and dental care in Australia: key facts and figures 2015
Table C3.7: Dental visiting pattern by selected characteristics, proportion of dentate people aged 18 and over, 2013 (%) (95% confidence intervals)
Dental visiting pattern
Favourable Intermediate Unfavourable
Sex
Male 35.8, 41.0 31.8, 37.0 24.9, 29.8
Female 47.2, 52.0 28.4, 33.0 17.8, 21.9
Age (years)
18–24 43.9, 54.8 30.9, 41.3 11.1, 19.3
25–44 34.3, 40.7 32.4, 38.9 24.1, 30.1
45–64 45.0, 50.4 26.0, 30.9 21.6, 26.4
65+ 44.6, 52.3 26.9, 34.1 17.9, 24.9
Remoteness area
Major cities 44.5, 49.0 29.4, 33.8 19.8, 23.7
Inner regional 35.2, 42.0 30.6, 37.4 24.2, 31.0
Outer regional 31.8, 42.2 28.5, 38.6 25.1, 35.1
Remote/Very remote 20.4, 45.1 28.4, 51.8 20.0, 40.3
Insurance status
Insured 58.6, 63.2 24.7, 28.9 10.9, 14.0
Uninsured 24.1, 29.0 35.2, 40.8 32.9, 38.4
Eligibility for public dental care
Eligible 31.6, 37.9 31.3, 38.1 27.4, 34.1
Ineligible 45.2, 49.4 29.7, 33.8 19.3, 22.9
Annual household income ($)
<30,000 23.9, 31.1 33.2, 42.0 30.8, 39.6
30,000–<60,000 34.8, 42.6 28.7, 37.0 24.8, 32.9
60,000–<90,000 38.1, 46.8 28.9, 37.6 20.9, 28.6
90,000–<140,000 48.0, 56.2 25.1, 32.6 16.1, 22.7
140,000+ 52.6, 61.5 26.5, 34.8 9.7, 15.7
All people aged 18 and over 42.3, 45.9 30.7, 34.2 21.9, 25.1
Source: National Dental Telephone Interview Survey 2013.
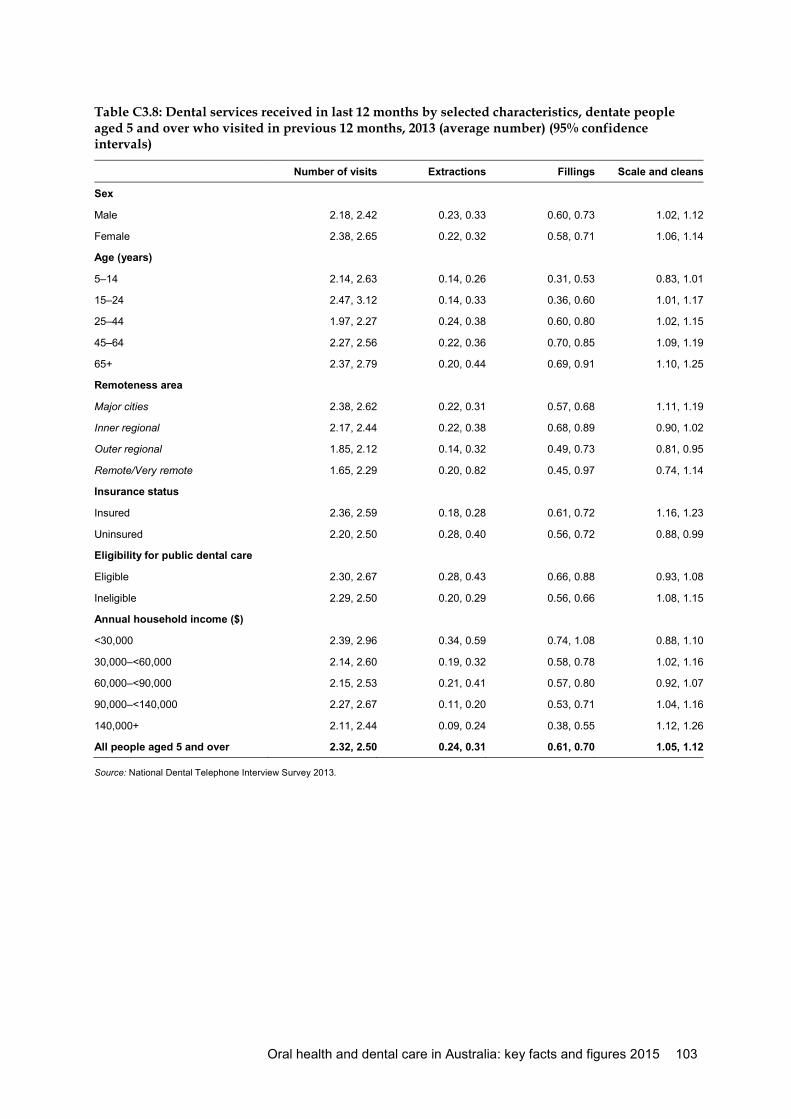
Oral health and dental care in Australia: key facts and figures 2015 103
Table C3.8: Dental services received in last 12 months by selected characteristics, dentate people aged 5 and over who visited in previous 12 months, 2013 (average number) (95% confidence intervals)
Number of visits Extractions Fillings Scale and cleans
Sex
Male 2.18, 2.42 0.23, 0.33 0.60, 0.73 1.02, 1.12
Female 2.38, 2.65 0.22, 0.32 0.58, 0.71 1.06, 1.14
Age (years)
5–14 2.14, 2.63 0.14, 0.26 0.31, 0.53 0.83, 1.01
15–24 2.47, 3.12 0.14, 0.33 0.36, 0.60 1.01, 1.17
25–44 1.97, 2.27 0.24, 0.38 0.60, 0.80 1.02, 1.15
45–64 2.27, 2.56 0.22, 0.36 0.70, 0.85 1.09, 1.19
65+ 2.37, 2.79 0.20, 0.44 0.69, 0.91 1.10, 1.25
Remoteness area
Major cities 2.38, 2.62 0.22, 0.31 0.57, 0.68 1.11, 1.19
Inner regional 2.17, 2.44 0.22, 0.38 0.68, 0.89 0.90, 1.02
Outer regional 1.85, 2.12 0.14, 0.32 0.49, 0.73 0.81, 0.95
Remote/Very remote 1.65, 2.29 0.20, 0.82 0.45, 0.97 0.74, 1.14
Insurance status
Insured 2.36, 2.59 0.18, 0.28 0.61, 0.72 1.16, 1.23
Uninsured 2.20, 2.50 0.28, 0.40 0.56, 0.72 0.88, 0.99
Eligibility for public dental care
Eligible 2.30, 2.67 0.28, 0.43 0.66, 0.88 0.93, 1.08
Ineligible 2.29, 2.50 0.20, 0.29 0.56, 0.66 1.08, 1.15
Annual household income ($)
<30,000 2.39, 2.96 0.34, 0.59 0.74, 1.08 0.88, 1.10
30,000–<60,000 2.14, 2.60 0.19, 0.32 0.58, 0.78 1.02, 1.16
60,000–<90,000 2.15, 2.53 0.21, 0.41 0.57, 0.80 0.92, 1.07
90,000–<140,000 2.27, 2.67 0.11, 0.20 0.53, 0.71 1.04, 1.16
140,000+ 2.11, 2.44 0.09, 0.24 0.38, 0.55 1.12, 1.26
All people aged 5 and over 2.32, 2.50 0.24, 0.31 0.61, 0.70 1.05, 1.12
Source: National Dental Telephone Interview Survey 2013.

104 Oral health and dental care in Australia: key facts and figures 2015
Table C3.9: Children with fissure-sealed teeth by DMFT status and age, children attending a school dental service, 2010 (%) (95% confidence intervals)
Age (years)
6 7 8 9 10 11 12 13 14 15
DMFT = 0 2.7, 2.9 8.0, 8.4 18.1, 18.6 23.0, 23.5 24.7, 25.3 23.2, 23.8 26.2, 26.9 28.4, 29.1 25.6, 26.3 2.7, 2.9
DMFT >0 6.4, 7.7 16.3, 17.5 26.2, 27.4 27.7, 28.7 30.6, 31.5 33.6, 34.5 39.8, 40.7 39.3, 40.0 40.5, 41.2 6.4, 7.7
Notes
1. New South Wales was excluded from the data collection due to a lack of representativeness of the sample.
2. Data from Victoria were not available.
Source: Child Dental Health Survey 2010.
Table C3.10: Fissure-sealed teeth by age, children attending a school dental service, 2010 (average number) (95% confidence intervals)
Age (years)
6 7 8 9 10 11 12 13 14
Average 0.07, 0.09 0.25, 0.29 0.56, 0.61 0.67, 0.72 0.74, 0.80 0.69, 0.75 0.87, 0.94 1.02, 1.12 1.01, 1.11
Notes
1. New South Wales was excluded from the data collection due to a lack of representativeness of the sample.
2. Data from Victoria were not available.
Source: Child Dental Health Survey 2010.

Oral health and dental care in Australia: key facts and figures 2015 105
Table C5.1: Proportion of people who avoided or delayed visiting a dentist due to cost, by selected characteristics, dentate people aged 5 and over, 2013 (%) (95% confidence intervals)
Age (years)
5–14 15–24 25–44 45–64 65+ All people
Sex
Male 7.8, 14.7 14.9, 25.1 37.8, 47.6 28.9, 36.8 14.9, 25.4 27.1, 31.7
Female 6.2, 14.1 20.7, 31.9 42.7, 51.5 35.2, 42.3 22.0, 31.2 32.0, 36.2
Remoteness area
Major cities 6.9, 13.4 17.5, 26.6 40.5, 48.5 31.5, 38.2 19.0, 28.0 29.5, 33.4
Inner regional 8.4, 20.6 18.2, 35.4 40.2, 54.8 31.4, 41.7 12.9, 24.5 28.6, 34.9
Outer regional 1.7, 10.0 11.9, 40.0 33.6, 52.2 33.2, 49.2 23.1, 47.0 29.0, 38.1
Remote/Very remote 0.0, 10.9 2.1, 41.7 24.4, 63.0 19.8, 53.3 5.4, 52.3 22.3, 42.1
Dental insurance status
Insured 3.5, 9.0 8.6, 18.3 26.0, 34.4 19.4, 25.1 11.0, 19.0 18.4, 22.0
Uninsured 10.9, 20.0 26.7, 38.5 52.6, 62.5 50.2, 59.1 26.3, 37.6 41.2, 46.2 Eligibility for public dental care
Eligible 7.3, 17.7 20.5, 37.9 54.7, 70.8 53.1, 65.9 21.4, 29.6 34.8, 41.0
Ineligible 7.0, 13.0 17.0, 25.3 37.4, 44.6 28.1, 33.7 12.1, 25.6 27.6, 31.2 Annual household income ($)
<30,000 5.4, 22.9 16.8, 43.3 44.4, 68.2 56.7, 70.2 23.2, 34.5 36.8, 45.0
30,000–<60,000 7.9, 22.2 24.3, 44.9 54.5, 70.4 40.7, 53.4 16.5, 30.0 38.2, 45.9
60,000–<90,000 6.2, 17.7 13.0, 33.6 41.8, 56.6 27.9, 39.8 4.3, 22.7 29.5, 37.1
90,000–<140,000 3.0, 9.4 11.7, 29.0 30.8, 43.4 22.8, 34.0 1.0, 22.5 23.0, 29.6
140,000+ 1.5, 9.0 6.1, 18.6 19.4, 32.3 10.7, 20.1 0.0, 19.0 13.8, 19.8
All people aged 5 and over 8.1, 13.3 19.3, 26.9 41.6, 48.2 33.2, 38.5 20.0, 27.0 30.2, 33.3
Source: National Dental Telephone Interview Survey 2013.

106 Oral health and dental care in Australia: key facts and figures 2015
Table C5.2: Proportion of people reporting that cost prevented recommended dental treatment, by selected characteristics, dentate people aged 5 and over, 2013 (%) (95% confidence intervals)
Age (years)
5–14 15–24 25–44 45–64 65+ All people
Sex
Male 2.7, 8.3 9.2, 21.7 22.2, 35.2 19.5, 28.2 6.8, 16.7 16.3, 21.3
Female 3.3, 9.7 6.2, 15.9 22.3, 32.0 24.2, 32.3 11.6, 19.7 18.1, 22.3
Remoteness area
Major cities 2.9, 7.9 6.6, 15.3 22.3, 31.7 22.5, 29.8 10.3, 18.1 17.1, 21.1
Inner regional 3.7, 15.7 11.9, 32.3 19.9, 36.5 21.1, 33.5 6.0, 16.8 17.2, 23.9
Outer regional 1.1, 6.9 0.0, 33.8 19.1, 44.4 13.7, 30.3 5.0, 18.3 13.6, 23.2
Remote/Very remote 0.0, 0.3 0.0, 33.3 11.4, 60.8 18.8, 65.2 17.4, 100.0 15.7, 43.0
Dental insurance status
Insured 2.1, 7.3 4.4, 13.6 16.1, 24.8 17.3, 23.6 10.3, 18.8 13.8, 17.4
Uninsured 4.2, 11.2 10.6, 22.9 30.6, 44.9 32.2, 44.2 8.8, 18.2 22.2, 28.1
Eligibility for public dental care
Eligible 3.4, 15.0 9.9, 28.7 29.1, 50.7 33.2, 51.2 11.5, 19.4 20.0, 26.6
Ineligible 3.0, 7.4 7.3, 15.9 21.0, 29.5 20.5, 26.5 5.3, 15.1 16.3, 20.0
Annual household income ($)
<30,000 4.4, 29.1 3.0, 44.6 25.0, 59.3 28.5, 48.6 13.5, 25.4 22.5, 32.7
30,000–<60,000 0.9, 15.0 1.4, 19.0 30.6, 53.7 27.5, 43.1 7.5, 17.8 20.4, 28.7
60,000–<90,000 1.3, 9.3 4.2, 27.3 22.4, 42.5 18.0, 31.6 0.6, 21.2 16.5, 25.0
90,000–<140,000 1.2, 5.7 2.9, 15.7 16.4, 30.6 18.6, 30.6 0.0, 5.6 13.8, 20.2
140,000+ 0.0, 5.8 2.9, 16.3 8.8, 21.7 8.9, 18.6 3.1, 56.6 8.5, 14.2
All people aged 5 and over 3.9, 8.1 9.3, 17.2 23.9, 31.8 23.2, 29.2 10.8, 17.0 17.9, 21.1
Source: National Dental Telephone Interview Survey 2013.
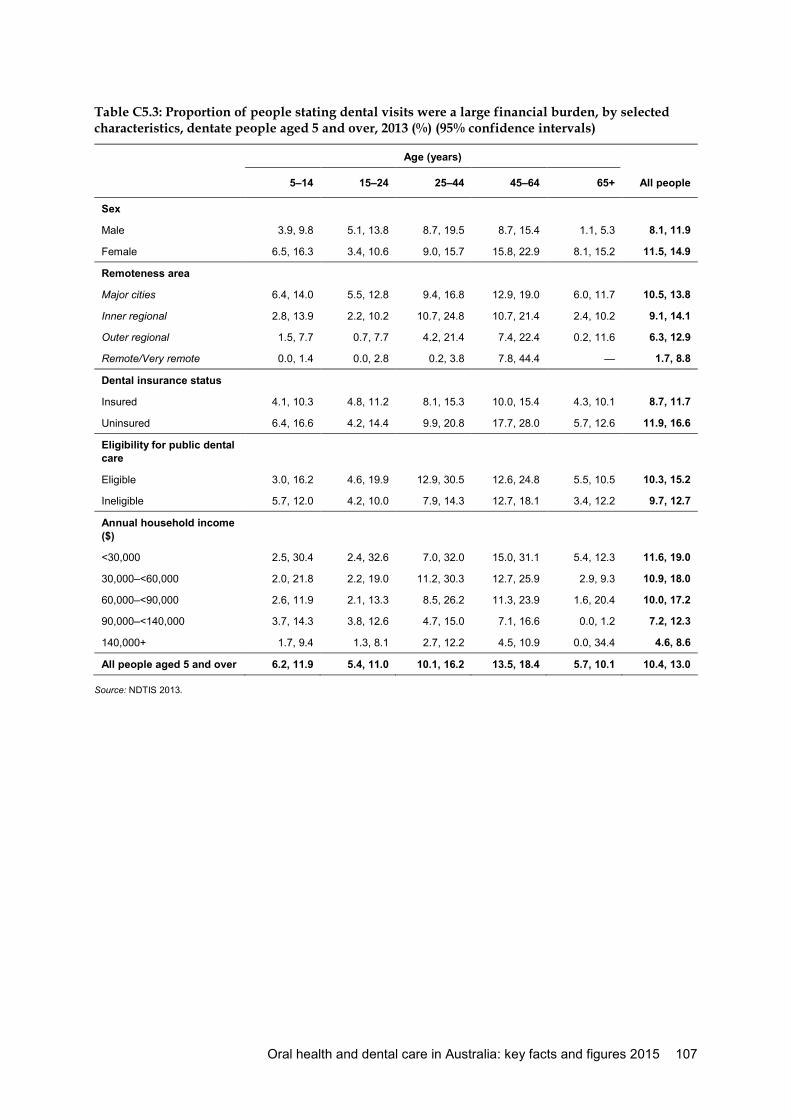
Oral health and dental care in Australia: key facts and figures 2015 107
Table C5.3: Proportion of people stating dental visits were a large financial burden, by selected characteristics, dentate people aged 5 and over, 2013 (%) (95% confidence intervals)
Age (years)
5–14 15–24 25–44 45–64 65+ All people
Sex
Male 3.9, 9.8 5.1, 13.8 8.7, 19.5 8.7, 15.4 1.1, 5.3 8.1, 11.9
Female 6.5, 16.3 3.4, 10.6 9.0, 15.7 15.8, 22.9 8.1, 15.2 11.5, 14.9
Remoteness area
Major cities 6.4, 14.0 5.5, 12.8 9.4, 16.8 12.9, 19.0 6.0, 11.7 10.5, 13.8
Inner regional 2.8, 13.9 2.2, 10.2 10.7, 24.8 10.7, 21.4 2.4, 10.2 9.1, 14.1
Outer regional 1.5, 7.7 0.7, 7.7 4.2, 21.4 7.4, 22.4 0.2, 11.6 6.3, 12.9
Remote/Very remote 0.0, 1.4 0.0, 2.8 0.2, 3.8 7.8, 44.4 — 1.7, 8.8
Dental insurance status
Insured 4.1, 10.3 4.8, 11.2 8.1, 15.3 10.0, 15.4 4.3, 10.1 8.7, 11.7
Uninsured 6.4, 16.6 4.2, 14.4 9.9, 20.8 17.7, 28.0 5.7, 12.6 11.9, 16.6
Eligibility for public dental care
Eligible 3.0, 16.2 4.6, 19.9 12.9, 30.5 12.6, 24.8 5.5, 10.5 10.3, 15.2
Ineligible 5.7, 12.0 4.2, 10.0 7.9, 14.3 12.7, 18.1 3.4, 12.2 9.7, 12.7
Annual household income ($)
<30,000 2.5, 30.4 2.4, 32.6 7.0, 32.0 15.0, 31.1 5.4, 12.3 11.6, 19.0
30,000–<60,000 2.0, 21.8 2.2, 19.0 11.2, 30.3 12.7, 25.9 2.9, 9.3 10.9, 18.0
60,000–<90,000 2.6, 11.9 2.1, 13.3 8.5, 26.2 11.3, 23.9 1.6, 20.4 10.0, 17.2
90,000–<140,000 3.7, 14.3 3.8, 12.6 4.7, 15.0 7.1, 16.6 0.0, 1.2 7.2, 12.3
140,000+ 1.7, 9.4 1.3, 8.1 2.7, 12.2 4.5, 10.9 0.0, 34.4 4.6, 8.6
All people aged 5 and over 6.2, 11.9 5.4, 11.0 10.1, 16.2 13.5, 18.4 5.7, 10.1 10.4, 13.0
Source: NDTIS 2013.

108 Oral health and dental care in Australia: key facts and figures 2015
Table C5.4: Proportion of people who would have a lot of difficulty paying for a basic preventive visit, by selected characteristics, dentate people aged 18 and over, 2013 (%) (95% confidence intervals)
Age (years)
15–24 25–44 45–64 65+ All people
Sex
Male 23.4, 37.6 18.4, 27.1 16.3, 23.2 17.0, 28.7 20.4, 25.3
Female 38.1, 53.2 29.6, 38.0 29.4, 36.4 21.0, 30.2 31.3, 36.0
Remoteness area
Major cities 32.8, 45.6 23.7, 30.9 22.6, 28.9 19.0, 28.4 25.8, 30.0
Inner regional 24.3, 46.4 27.6, 42.3 22.5, 32.6 15.9, 27.5 26.1, 33.1
Outer regional 19.3, 60.2 20.6, 37.7 20.7, 35.5 18.3, 43.5 25.0, 35.5
Remote/Very remote 0.0, 23.1 4.0, 23.3 8.2, 45.0 0.5, 69.7 10.4, 29.5
Dental insurance status
Insured 24.7, 40.5 12.3, 18.5 13.4, 18.6 8.1, 15.5 15.0, 18.7
Uninsured 35.4, 50.7 34.1, 43.7 35.9, 44.8 30.6, 42.6 36.8, 42.3
Eligibility for public dental care
Eligible 39.4, 61.9 49.2, 65.4 58.4, 70.8 23.9, 32.7 42.2, 49.1
Ineligible 28.1, 40.0 19.2, 25.3 16.1, 21.1 8.4, 21.8 20.2, 23.9
Annual household income ($)
<30,000 48.9, 85.7 52.5, 74.9 58.7, 72.0 33.2, 45.5 49.6, 58.2
30,000–<60,000 26.2, 51.6 35.0, 51.2 33.8, 46.6 6.7, 17.6 31.3, 39.5
60,000–<90,000 14.0, 39.2 22.4, 35.8 18.9, 30.5 0.0, 6.2 20.9, 28.8
90,000–<140,000 24.0, 50.5 10.3, 19.4 4.2, 10.5 0.0, 9.9 10.8, 16.7
140,000+ 16.7, 37.8 3.5, 9.5 2.8, 9.0 0.0, 19.1 7.2, 12.6
All people aged 18 and over 32.6,43.2 25.3,31.3 23.9,28.9 20.6,28.0 26.6,30.0
Notes
1. The cost of a basic preventive visit in 2012 was approximately $200.
2. The item ‘Difficulty paying a $ dental bill’ was collected only for adults aged 18 and over.
Source: National Dental Telephone Interview Survey 2013.

Oral health and dental care in Australia: key facts and figures 2015 109
Table C6.1: Proportion of people with dental insurance by age and dentate status, people aged 5 and over, 2013 (%) (95% confidence intervals)
Dentate status
Age (years) Dentate Edentulous All persons
5–14 47.8, 56.2 . . 47.8, 56.2
15–24 39.3, 48.1 . . 39.3, 48.1
25–44 43.5, 50.1 . . 43.4, 50.0
45–64 55.3, 60.8 11.6, 35.7 54.3, 59.6
65+ 47.3, 55.0 18.4, 32.2 42.8, 49.7
All people aged 5 and over 49.0, 52.3 18.7, 30.6 48.1, 51.3
Source: National Dental Telephone Interview Survey 2013.
Table C6.2: Proportion of people with dental insurance by selected characteristics, dentate people aged 15 and over, 2013 (%) (95% confidence intervals)
Age (years)
5–14 15–24 25–44 45–64 65+ All people
Sex
Male 47.7, 59.4 36.8, 49.5 39.3, 49.0 52.6, 60.8 44.4, 56.5 47.1, 51.9
Female 44.3, 56.6 38.2, 50.4 44.9, 53.8 55.8, 63.0 46.8, 56.8 49.6, 54.1
Remoteness area
Major cities 50.2, 61.2 41.0, 51.9 43.2, 51.2 59.2, 66.1 49.3, 59.2 51.1, 55.2
Inner regional 33.7, 50.5 28.2, 45.7 37.3, 51.4 43.2, 53.8 39.2, 53.9 41.4, 47.7
Outer regional 33.9, 55.5 21.6, 49.1 35.0, 53.7 39.7, 55.3 30.4, 53.2 39.2, 48.4
Remote/Very remote 43.1, 78.7 23.1, 81.4 40.3, 80.1 34.3, 69.4 22.3, 83.8 46.5, 67.6
Eligibility for public dental care
Eligible 18.6, 33.9 14.5, 28.7 14.9, 27.7 17.4, 27.5 40.5, 49.6 27.9, 33.4
Ineligible 55.5, 65.1 46.0, 56.3 48.5, 55.8 62.5, 68.3 58.5, 73.0 56.0, 59.8
Annual household income ($)
<30,000 4.1, 19.0 4.4, 23.8 10.0, 25.0 17.3, 28.3 26.7, 37.0 20.4, 26.5
30,000–<60,000 23.5, 42.1 17.3, 36.8 18.7, 31.4 38.4, 50.8 59.9, 73.9 35.2, 42.3
60,000–<90,000 35.7, 55.5 33.4, 56.5 33.6, 47.8 53.3, 66.0 68.0, 88.1 46.2, 54.2
90,000–<140,000 58.7, 73.6 47.1, 68.2 62.4, 74.1 63.6, 75.2 60.7, 89.6 63.7, 70.5
140,000+ 77.2, 89.8 62.5, 81.0 65.3, 79.7 81.4, 89.9 47.3, 100.0 74.3, 81.4
All people aged 15 and over 47.8, 56.2 39.3, 48.1 43.5, 50.1 55.3, 60.8 47.3, 55.0 49.0, 52.3
Source: National Dental Telephone Interview Survey 2013.

110 Oral health and dental care in Australia: key facts and figures 2015
Table C7.1: Proportion of people with dental insurance who reported that health insurance paid all or some of the cost of their care by source of payment, people aged 18 and over, 2013 (%) (95% confidence intervals)
Paid all own expenses
Insurance paid some/patient
paid some
Insurance paid all/patient paid
none
Govt paid some/ patient or insurance paid some
Govt paid all/ patient paid none
Other payment option
9.0, 12.1 75.2, 79.3 7.3, 10.0 1.0, 2.2 1.0, 2.2 0.4, 1.3
Source: National Dental Telephone Interview Survey 2013.
Table C7.2: Proportion of people who reported that dental care caused a large financial burden by source of payment, insured people aged 18 and over, 2013 (%) (95% confidence intervals)
Paid all own expenses
Insurance paid some/patient
paid some
Insurance paid all/patient paid
none
Govt paid some/ patient or insurance paid some
Govt paid all/ patient paid
none Other payment
option All insured
people
11.1, 26.1 8.3, 12.2 0.7, 7.4 1.2, 27.5 0.0, 19.5 0.0, 24.3 8.7, 12.1
Source: National Dental Telephone Interview Survey 2013.

Oral health and dental care in Australia: key facts and figures 2015 111
Glossary Care type: the overall nature of a clinical service provided to an admitted patient during an episode of care (admitted care), or the type of service provided by the hospital for boarders or posthumous organ procurement (other care).
Caries: bacterial disease that causes the demineralisation and decay of teeth and can involve inflammation of the central dental pulp.
Constant prices: expenditures reported for a particular year, adjusted for inflation. Constant price estimates indicate what expenditure would have been had 2012–13 prices applied in all years. Hence, expenditures in different years can be compared on a dollar-for-dollar basis.
Decay: decay of the teeth caused by caries (see caries), and progressing to cavities in the enamel or cementum and the dentine.
Deciduous dentition: primary (baby teeth).
Dental appearance: self-reported perception of dental appearance related to frequency of feeling uncomfortable with one’s dental appearance (‘never’ or ‘hardly ever’ compared with ‘very often’, ‘often’ or ‘sometimes’).
Dentate: having at least one natural tooth.
Dentition: the set of teeth. A complete dentition comprises 32 adult teeth.
dmft: deciduous decayed, missing (due to decay and filled teeth).
DMFT: permanent decayed, missing (due to decay and filled teeth).
Edentulism/edentulous: complete tooth loss; loss of all natural teeth.
Eligible for public dental care: describes people who hold Australian Government concession cards (generally by virtue of their household income) who may be eligible for free or subsidised dental care provided by state and territory governments. Eligibility criteria vary across states and territories.
Fissure sealant: a special varnish that seals pits and fissures in teeth to prevent cavities from developing.
Gingivitis: inflammation of the gums.
Gum treatment: treatment for disease of the gums and other tissues that attach teeth to the jaws, also referred to as periodontal treatment.
Oral health: health of the mouth, tongue and oral cavity; the absence of active disease in the mouth.
Permanent dentition: adult teeth.
Potentially preventable hospitalisations: those conditions where hospitalisation is thought to be avoidable if timely and adequate non-hospital care is provided.
Prevalence: the proportion of people with a defined disease or characteristic within a defined population.
Preventive services: measures taken to prevent dental diseases; may include fluoride treatment, scale and clean services, dental sealants and so on.

112 Oral health and dental care in Australia: key facts and figures 2015
Principal diagnosis: the diagnosis established after study to be chiefly responsible for occasioning an episode of admitted patient care.
Private dental services: dental care provided by private practitioners to adults and children, usually self-funded by the recipient.
Public dental services: state- or territory-funded dental care available to adults with low income or other forms of social disadvantage.
Recurrent expenditure: expenditure incurred by organisations on a recurring basis for the provision of health goods and services. This excludes capital expenditure. For all years, recurrent expenditure includes capital consumption.
Remoteness area: an area categorised according to the Accessibility/Remoteness Index of Australia (where the remoteness index value of a point is based on the physical road distance to the nearest town or service). These area categories are Major cities, Inner regional, Outer regional, Remote and Very remote.
Separation: a completed episode of care for an admitted patient, which can be a total hospital stay (from admission to discharge, transfer or death) or a portion of a hospital stay beginning or ending in a change of type of care (for example, from acute to rehabilitation).
Separation rate: the total number of completed episodes of care for admitted patients divided by the total number of people in the population under study. It is often presented as a rate per 1,000 or 10,000 members of a population.

Oral health and dental care in Australia: key facts and figures 2015 113
References AHMAC (Australian Health Ministers’ Advisory Council) 2001. Oral health of Australians: national planning for oral health improvement. Adelaide: South Australian Department of Human Services, on behalf of the Australian Health Ministers’ Conference.
AIHW (Australian Institute of Health and Welfare) 2012. Australian hospital statistics 2010–11. Health services series no. 43. Cat. no. HSE 117. Canberra: AIHW.
AIHW 2013. Australian hospital statistics 2011–12. Health services series no. 50. Cat. no. HSE 134. Canberra: AIHW.
AIHW 2014. Oral health and dental care in Australia: key facts and figures trends 2014. Cat. no. DEN 228. Canberra: AIHW.
Ellershaw AC & Spencer AJ 2011. Dental attendance patterns and oral health status. Dental statistics and research series no. 57. Cat. no. DEN 208. Canberra: AIHW.
Harford JE, Ellershaw AC & Spencer AJ 2011. Trends in access to dental care among Australian adults 1994–2008. Dental statistics and research series no. 55. Cat. no. DEN 204. Canberra: AIHW.
Health Canada 2010. Report on the findings of the oral health component of the Canadian Health Measures Survey 2007–09. Ontario: Ministry of Health.
Izrael D, Battaglia MP & Frankel MR 2009 Extreme survey weight adjustment as a component of sample balancing (a.k.a. Raking). Paper 247. Cambridge, MA: ABT Associates. Viewed 31 July 2014, <http://www.abtassociates.com/Expertise/Surveys-and-Data-Collection/Raking-Survey-Data-(a-k-a--Sample-Balancing).aspx>.
Jamieson LM & Roberts-Thomson KF 2006 Dental general anaesthetic trends among Australian children. BMC Oral Health 6:16 doi:10.1186/1472-6831-6-16.
NCCH (National Centre for Classification in Health) 2008. International Statistical Classification of Diseases and Related Health Problems, tenth revision, Australian modification (ICD-10-AM), Australian Classification of Health Interventions (ACHI) and Australian Coding Standards, sixth edition. Sydney: University of Sydney.
New Zealand Ministry of Health 2010. Our oral health: key findings of the 2009 New Zealand Oral Health Survey. Wellington: New Zealand Ministry of Health. Page RC & Eke PI 2007. Case definitions for use in population-based surveillance of periodontitis. Journal of Periodontology 78:1387–99.
WHO (World Health Organization) 1997. Oral health surveys—basic methods, 4th edition.
Geneva: WHO. Palmer JD, Anderson RJ & Downer MC 1984. Guidelines for prevalence estimates of dental caries. Community Dental Health 1:55–66.
AIHW: Slade GD, Roberts-Thomson KF & Ellershaw AE 2007. Survey aims and methods. In: Slade GD, Spencer AJ & Roberts-Thomson KF (eds). Australia’s dental generations: the National Survey of Adult Oral Health 2004–06. Dental statistics and research series no. 34. Cat. no. DEN 165. Canberra: AIHW, 11–28.
AIHW: Slade GD, Spencer AJ & Roberts-Thomson KF (eds) 2007. Australia’s dental generations: the National Survey of Adult Oral Health 2004–06. Dental statistics and research series no. 34. Cat. no. DEN 165. Canberra: AIHW.

114 Oral health and dental care in Australia: key facts and figures 2015
List of tables Table 2.1: Prevalence of deciduous and permanent caries experience (dmft + DMFT >0) by
age, children attending a school dental service, 2010 (per cent) .............................................. 4
Table 2.2: Number of deciduous teeth with caries experience by age, children attending a school dental service, 2010 (average) ........................................................................................... 4
Table 2.3: Prevalence of deciduous caries experience (dmft >0) by age, children attending a school dental service, 2010 (per cent) ........................................................................................... 5
Table 2.4: Number of permanent teeth with caries experience by age, children attending a school dental service, 2010 (average) ........................................................................................... 5
Table 2.5: Prevalence of permanent caries experience (DMFT >0) by age, children attending a school dental service, 2010 (%)...................................................................................................... 6
Table 2.6: Number of permanent teeth with caries experience by age, dentate people aged 15 and over, 2004–2006 (average) ...................................................................................................... 8
Table 2.7: Number of permanent teeth with caries experience by selected characteristics, dentate people aged 15 and over, 2004–2006 (average) ............................................................. 9
Table 2.8: Prevalence of untreated decay, dentate people aged 15 and over, 2004–2006 (%) ................ 9
Table 2.9: Prevalence of untreated decay by sex and remoteness area, dentate people aged 15 and over, 2004–2006 (%)............................................................................................................... 10
Table 2.10: Prevalence of untreated decay by insurance status and eligibility for public dental care, dentate people aged 15 and over, 2004–2006 (%) ............................................................ 10
Table 2.11: Prevalence of untreated decay by annual household income, dentate people aged 15 and over, 2004–2006 (%).......................................................................................................... 10
Table 2.12: Number of permanent teeth with caries experience, dentate people aged 15 and over, 1987–88 and 2004–2006 (average) ..................................................................................... 11
Table 2.13: Prevalence of moderate or severe periodontal disease by age, dentate people aged 15 and over, 2004–2006 (%).......................................................................................................... 11
Table 2.14: Prevalence of periodontal disease by sex and remoteness, dentate people aged 15 and over, 2004–2006 (%)............................................................................................................... 11
Table 2.15: Prevalence of periodontal disease by insurance status and eligibility for public dental care, dentate people aged 15 and over, 2004–2006 (%) ................................................ 12
Table 2.16: Prevalence of periodontal disease by annual household income, dentate people aged 15 and over, 2004–2006 (%) ................................................................................................ 12
Table 2.17: Prevalence of edentulism by age and sex, people aged 15 and over, 2013 (%) .................... 12
Table 2.18: Prevalence of denture wearing by sex and age, dentate people aged 15 and over, 2013 (%) .......................................................................................................................................... 13
Table 2.19: Number of missing teeth by age group and selected other characteristics, dentate people aged 15 and over, 2013 (average) ................................................................................... 14
Table 2.20: Number of missing teeth by annual household income and selected other characteristics, dentate people aged 15 and over, 2013 (average) .......................................... 15
Table 2.21: Prevalence of complete tooth loss among adults in Australia, New Zealand and Canada (%) .................................................................................................................................... 17

Oral health and dental care in Australia: key facts and figures 2015 115
Table 2.22: Prevalence of toothache experience in the previous 12 months by selected characteristics, dentate people aged 15 and over, 2013 (%) .................................................... 18
Table 2.23: Prevalence of feeling uncomfortable about dental appearance in the previous 12 months by selected characteristics, people aged 15 and over, 2013 (%) ................................ 20
Table 2.24: Prevalence of avoiding certain foods in the previous 12 months by selected characteristics, people aged 15 and over, 2013 (%) .................................................................. 22
Table 3.1: Time since last dental visit by age and sex, dentate people aged 5 and over, 2013 (%) ................................................................................................................................................... 24
Table 3.2: Time since last dental visit by selected characteristics, dentate people aged 15 and over, 2013 (%) ................................................................................................................................ 25
Table 3.3: Proportions of adults who made a dental visit in the previous 12 months, Australia, New Zealand and Canada (%).................................................................................. 27
Table 3.4: Reason for last dental visit by selected characteristics, proportion of dentate people aged 5 and over, 2013 (%) ............................................................................................................ 28
Table 3.5: Proportion of adults who last visited for a check-up, Australia and New Zealand (%) ................................................................................................................................................... 30
Table 3.6: Type of practice visited at last dental visit by selected characteristics, proportion of dentate people aged 5 and over who visited in last 12 months, 2013 (%) ............................. 31
Table 3.7: Dental visiting pattern by selected characteristics, proportion of dentate people aged 18 and over, 2013 (%) .......................................................................................................... 35
Table 3.8: Dental services received in the previous 12 months by selected characteristics, dentate people aged 5 and over who visited in the previous 12 months, 2013 (average number) .......................................................................................................................... 38
Table 3.9: Children with fissure-sealed teeth by DMFT status and age, children attending a school dental service, 2010 (%).................................................................................................... 41
Table 3.10: Fissure-sealed teeth by age, children attending a school dental service, 2010 (average number) .......................................................................................................................... 41
Table 4.1: Hospital separations for potentially preventable hospitalisations due to dental conditions, state or territory of usual residence, 2007–08 to 2013–14 .................................... 44
Table 4.2: Hospital separations for potentially preventable hospitalisations due to dental conditions, remoteness area of usual residence, 2007–08 to 2013–14 .................................... 45
Table 4.3: Number and rate of hospital separations for potentially preventable hospitalisations due to dental conditions, by sex and age group, 2013–14 .......................... 46
Table 4.4: Number and rate of hospital separations for potentially preventable hospitalisations due to dental conditions, by age group, all people, 2007–08 to 2013–14 ........................................................................................................................................... 47
Table 4.5: Number and rate of hospital separations for potentially preventable hospitalisations due to dental conditions, by age group, Aboriginal and Torres Strait Islander people, 2010–11 to 2013–14 ................................................................................ 48
Table 4.6: Number and rate of hospital separations for hospitalisations requiring general anaesthesia for procedures related to dental conditions, by age group, Australia, 2007–08 to 2013–14 ........................................................................................................................ 49
Table 4.7: Number and rate of hospital separations for hospitalisations requiring general anaesthesia for procedures related to dental conditions, by sex and age group, Aboriginal and Torres Strait Islander people, 2010–10 to 2013–14 ........................................ 50

116 Oral health and dental care in Australia: key facts and figures 2015
Table 5.1: Proportion of people who avoided or delayed visiting a dentist due to cost, by selected characteristics, dentate people aged 5 and over, 2013 (%) ....................................... 52
Table 5.2: Proportion of people reporting that cost prevented recommended dental treatment, by selected characteristics, dentate people aged 5 and over, 2013 (%) .................................. 54
Table 5.3: Proportion of people stating dental visits were a large financial burden, by selected characteristics, dentate people aged 5 and over, 2013 (%) ...................................................... 56
Table 5.4: Proportion of people who stated they would have a lot of difficulty paying for a basic preventive visit, by selected characteristics, dentate people aged 18 and over, 2013 (%) .......................................................................................................................................... 58
Table 6.1: Proportion of people with insurance by age and dentate status, people aged 5 and over, 2013 (%) ................................................................................................................................ 59
Table 6.2: Proportion of people with private health insurance cover for dental care by selected characteristics, dentate people aged 5 and over, 2013 (%) ....................................... 60
Table 7.1: Proportion of people with insurance who reported that health insurance paid all or some of the cost of their care by source of payment, people aged 18 and over, 2013 (%) ................................................................................................................................................... 61
Table 7.2: Proportion of people who reported that dental care caused a large financial burden by source of payment, insured people aged 18 and over, 2013 (%) ....................................... 61
Table 8.1: Total dental expenditure, by sources of funds, constant prices, 2002–03 to 2012–13 ($ million) ....................................................................................................................................... 63
Table 8.2: Contribution of government and non-government funding sources to total dental expenditure, 2008–09 to 2012–13 (%) ......................................................................................... 64
Table 9.1: Dental practitioners registered and employed, 2013 ............................................................... 66
Table 9.2: Full-time equivalent dental practitioners per 100,000 population, 2013 ............................... 66
Table 9.3: Full-time equivalent dental practitioners employed per 100,000 population, by remoteness area, 2013 ................................................................................................................... 67
Table 9.4: Full time equivalent dentists employed per 100,000 population in the public and private sectors, states and territories, 2013 ................................................................................ 67
Table 9.5: Selected characteristics of employed dentists by sector, 2011 to 2013 ................................... 68
Table 9.6: Number of dentists by main employment setting, states and territories, 2013 .................... 69
Table 9.7: Dental specialists: number employed by area of specialty, 2013 ........................................... 70
Table A1: National Health Workforce Data Set survey response rates, states and territories, 2013 ................................................................................................................................................. 76
Table B2.1: Average dmft (at age 6) and DMFT (at age 12) and associated 95% confidence intervals, Australia, 1977 to 2010 ................................................................................................ 78
Table B2.2: Number of teeth and number of missing teeth, dentate people aged 15 and over, 1994 to 2013 .................................................................................................................................... 79
Table B2.3: Prevalence of any oral health impact, people age 15 and over, 1994 to 2013 ....................... 79
Table B2.4: Prevalence of any oral health impact, children aged 5 to 14, 1994 to 2013 ........................... 80
Table B3.1: Last dental visit was in the previous 12 months, children aged 5–14 and adults aged 15 and over, 1994 to 2013.................................................................................................... 80
Table B3.2: Reason for last dental visit, children aged 5–14 and adults aged 15 and over, 1994 to 2013............................................................................................................................................. 81

Oral health and dental care in Australia: key facts and figures 2015 117
Table B3.3: Type of practice visited at last dental visit, dentate adults aged 15 and over who visited in last 12 months, 1994 to 2013 ....................................................................................... 81
Table B3.4: Type of practice visited at last dental visit, children aged 5 to 14 who visited in last 12 months, 1994 to 2013 ............................................................................................................... 82
Table B3.5: Dental visiting pattern, dentate adults aged 18 and over, 1999 to 2013 ................................ 82
Table B3.6: Types of services received by dentate adults aged 15 and over, 1994 to 2013 ..................... 83
Table B3.7: Types of services received by children aged 5 to 14, 1994 to 2013 ......................................... 83
Table B3.8: Average number of teeth with fissure sealants, Australian children aged 12, 1989 to 2010 ................................................................................................................................................. 84
Table B5.1: Proportion of people who avoided or delayed visiting a dentist due to cost, dentate people, 1994 to 2013 (%) ............................................................................................................... 84
Table B5.2: Proportion of people stating cost prevented recommended dental treatment, dentate people, 1994 to 2013 (%) ................................................................................................. 85
Table B5.3: Proportion of people stating dental visits were a financial burden, dentate people aged 5 and over, 1994 to 2013 (%)............................................................................................... 85
Table B8.1: Expenditure on dental services per person, by source of funds constant prices, 2002–03 to 2012–13 ........................................................................................................................ 86
Table C2.1: Prevalence of deciduous and permanent caries experience (dmft + DMFT >0) by age, children attending a school dental service, 2010 (95% confidence intervals) ............... 87
Table C2.2: Number of deciduous teeth with caries experience by age, children attending a school dental service, 2010 (95% confidence intervals) ........................................................... 87
Table C2.3: Prevalence of deciduous caries experience (dmft >0) by age, children attending a school dental service, 2010 (95% confidence intervals) ........................................................... 87
Table C2.4: Number of permanent teeth with caries experience by age, children attending a school dental service, 2010 (95% confidence intervals) ........................................................... 88
Table C2.5: Prevalence of permanent caries experience (DMFT >0) by age, children attending a school dental service, 2010 (%) (95% confidence intervals) .................................................... 88
Table C2.6: Number of permanent teeth with caries experience by age, dentate people aged 15 and over, 2004–2006 (95% confidence intervals) ...................................................................... 89
Table C2.7: Number of permanent teeth with caries experience by selected characteristics, dentate people aged 15 and over, 2004–2006 (95% confidence intervals) ............................. 89
Table C2.8: Prevalence of untreated decay, dentate people aged 15 and over, 2004–2006 (%) (95% confidence intervals) ........................................................................................................... 90
Table C2.9: Prevalence of untreated decay, dentate people aged 15 and over, 2004–2006 (%) (95% confidence intervals) ........................................................................................................... 90
Table C2.10: Prevalence of people with untreated decay by insurance status and eligibility for public dental care, dentate people aged 15 and over, 2004–2006 (%) (95% confidence intervals) .................................................................................................................... 90
Table C2.11: Prevalence of untreated decay by annual household income, dentate people aged 15 and over, 2004–2006 (%) (95% confidence intervals) .......................................................... 90
Table C2.12: Number of permanent teeth with caries experience, dentate people aged 15 and over, 1987–88 and 2004–2006 (average) (95% confidence intervals) ...................................... 90

118 Oral health and dental care in Australia: key facts and figures 2015
Table C2.13: Prevalence of moderate or severe periodontal disease by age, dentate people aged 15 and over, 2004–2006 (%) (95% confidence intervals) .......................................................... 91
Table C2.14: Prevalence of periodontal disease by sex and remoteness, dentate people aged 15 and over, 2004–2006 (%) (95% confidence intervals) ............................................................... 91
Table C2.15: Prevalence of periodontal disease by insurance status and eligibility for public dental care, dentate people aged 15 and over, 2004–2006 (%) (95% confidence intervals) ........................................................................................................................................ 91
Table C2.16: Prevalence of periodontal disease by annual household income, dentate people aged 15 and over, 2004–2006 (%) (95% confidence intervals) ................................................. 91
Table C2.17: Prevalence of edentulism by age and sex, people aged 15 and over, 2013 (%) (95% confidence intervals) ........................................................................................................... 91
Table C2.18: Prevalence of denture wearing by age, dentate people aged 15 and over, 2013 (%) (95% confidence intervals) ........................................................................................................... 92
Table C2.19: Number of missing teeth by selected characteristics, dentate people aged 15 and over, 2013 (average) (95% confidence intervals) ...................................................................... 92
Table C2.20: Number of missing teeth by annual household income, insurance status and region, dentate people aged 15 and over, 2013 (average) (95% confidence intervals) ........ 93
Table C2.21: Prevalence of complete tooth loss among adults in Australia, New Zealand and Canada (%) (95% confidence intervals) ..................................................................................... 93
Table C2.22: Prevalence of toothache experience in the previous 12 months by selected characteristics, dentate people aged 15 and over, 2013 (%) (95% confidence intervals) ........................................................................................................................................ 94
Table C2.23: Prevalence of feeling uncomfortable about dental appearance in the previous 12 months by selected characteristics, people aged 15 and over, 2013 (%) (95% confidence intervals) ........................................................................................................... 95
Table C2.24: Prevalence of avoiding certain foods in the previous 12 months by selected characteristics, people aged 15 and over, 2013 (%) (95% confidence intervals) ................... 96
Table C3.1: Time since last dental visit by age and sex, dentate people aged 5 and over, 2013 (%) (95% confidence intervals) .................................................................................................... 97
Table C3.2: Time since last dental visit by selected characteristics, dentate people aged 15 and over, 2013 (%) (95% confidence intervals) ................................................................................. 98
Table C3.4: Reason for last dental visit by selected characteristics, proportion of dentate people aged 5 and over, 2013 (%) (95% confidence intervals) ............................................................. 99
Table C3.5: Proportion of adults who last visited for a check-up, Australia and New Zealand (%) (95% confidence intervals) .................................................................................................. 100
Table C3.6: Type of practice visited at last dental visit by selected characteristics, proportion of dentate people aged 5 and over who visited in last 12 months, 2013 (%) (95% confidence intervals) ......................................................................................................... 101
Table C3.7: Dental visiting pattern by selected characteristics, proportion of dentate people aged 18 and over, 2013 (%) (95% confidence intervals) ......................................................... 102
Table C3.8: Dental services received in last 12 months by selected characteristics, dentate people aged 5 and over who visited in previous 12 months, 2013 (average number) (95% confidence intervals) ......................................................................................................... 103
Table C3.9: Children with fissure-sealed teeth by DMFT status and age, children attending a school dental service, 2010 (%) (95% confidence intervals) .................................................. 104

Oral health and dental care in Australia: key facts and figures 2015 119
Table C3.10: Fissure-sealed teeth by age, children attending a school dental service, 2010 (average number) (95% confidence intervals) ........................................................................ 104
Table C5.1: Proportion of people who avoided or delayed visiting a dentist due to cost, by selected characteristics, dentate people aged 5 and over, 2013 (%) (95% confidence intervals) ...................................................................................................................................... 105
Table C5.2: Proportion of people reporting that cost prevented recommended dental treatment, by selected characteristics, dentate people aged 5 and over, 2013 (%) (95% confidence intervals) ......................................................................................................... 106
Table C5.3: Proportion of people stating dental visits were a large financial burden, by selected characteristics, dentate people aged 5 and over, 2013 (%) (95% confidence intervals) ..... 107
Table C5.4: Proportion of people who would have a lot of difficulty paying for a basic preventive visit, by selected characteristics, dentate people aged 18 and over, 2013 (%) (95% confidence intervals) ......................................................................................... 108
Table C6.1: Proportion of people with dental insurance by age and dentate status, people aged 5 and over, 2013 (%) (95% confidence intervals) .................................................................... 109
Table C6.2: Proportion of people with dental insurance by selected characteristics, dentate people aged 15 and over, 2013 (%) (95% confidence intervals) ............................................ 109
Table C7.1: Proportion of people with dental insurance who reported that health insurance paid all or some of the cost of their care by source of payment, people aged 18 and over, 2013 (%) (95% confidence intervals) ............................................................................... 110
Table C7.2: Proportion of people who reported that dental care caused a large financial burden by source of payment, insured people aged 18 and over, 2013 (%) (95% confidence intervals) ...................................................................................................................................... 110

120 Oral health and dental care in Australia: key facts and figures 2015
List of figures Figure 2.1: Average dmft (at age 6) and DMFT (at age 12), Australia, 1977 to 2010 ................................. 7
Figure 2.2: Number of teeth and number of missing teeth, dentate people aged 15 and over, 1994–2013 (average) ...................................................................................................................... 16
Figure 2.3: Prevalence of any oral health impact, adults aged 15 and over 1994 to 2013 (%) ................ 23
Figure 2.4: Prevalence of any oral health impact, children aged 5 to 14, 1994 to 2013 (%) .................... 23
Figure 3.1: Last dental visit was in the previous 12 months, children aged 5–14 and adults aged 15 and over, 1994 to 2013 (%) ............................................................................................. 26
Figure 3.2: Last dental visit was for a check-up, children aged 5–14 and adults aged 15 and over, 1994 to 2013 (%) ................................................................................................................... 29
Figure 3.3: Type of practice visited at last dental visit, dentate adults aged 15 and over, 1994 to 2013 (%) ............................................................................................................................. 32
Figure 3.4: Type of practice visited at last dental visit, children aged 5–14, 1994 to 2013 (%) ............... 33
Figure 3.5: Dental visiting pattern, dentate adults aged 18 and over, 1999 to 2013 (%) ......................... 36
Figure 3.6: Types of services received by adults aged 15 and over, 1994 to 2013 (average number) .......................................................................................................................................... 39
Figure 3.7: Types of services received by children aged 5–14, 1994 to 2013 (average number) ............ 40
Figure 3.8: Teeth with fissure sealants, Australian children aged 12, 1989 to 2010 (average number) .......................................................................................................................................... 42
Figure 5.1: Proportion of dentate people aged over 5 who avoided or delayed visiting a dentist due to cost, 1994 to 2013 (%) ........................................................................................................ 53
Figure 5.2: Proportion of people stating cost prevented recommended dental treatment, dentate people, 1994 to 2013 (%) ................................................................................................. 55
Figure 5.3: Proportion of people stating dental visits were a financial burden, dentate people aged 5 and over, 1994 to 2013 (%)............................................................................................... 57
Figure 8.1: Expenditure on dental services per capita by source of funds, constant prices, 2002–03 to 2012–13 ........................................................................................................................ 65

Oral health and dental care in Australia Key facts and figures 2015
This report is the latest in the Oral health and dental care in Australia: key facts and figures suite of printed publications and web products. It presents the most recent key information on the oral health and dental care of the Australian population. Between 1994 and 2013, there was an overall increase in the proportion of people who were uncomfortable about their dental appearance, from 20% to nearly 27%. The proportion who reported experiencing a toothache over the previous 12 months increased from around 11% to 16% over the same period.
Oral health and dental care in Australia: key facts and figures 2015
AIH
W