oracle utilities business intelligence
TRANSCRIPT

Oracle Utilities Business IntelligenceAdministration and Business Process GuideRelease 2.3.2E18759-04
April 2011

Oracle Utilities Business Intelligence Administration and Business Process Guide E18759-04
Copyright © 2000, 2011, Oracle and/or its affiliates. All rights reserved.
This software and related documentation are provided under a license agreement containing restrictions on use and disclosure and are protected by intellectual property laws. Except as expressly permitted in your license agreement or allowed by law, you may not use, copy, reproduce, translate, broadcast, modify, license, transmit, distribute, exhibit, perform, publish, or display any part, in any form, or by any means. Reverse engineering, disassembly, or decompilation of this software, unless required by law for interoperability, is prohibited.
The information contained herein is subject to change without notice and is not warranted to be error-free. If you find any errors, please report them to us in writing.
If this software or related documentation is delivered to the U.S. Government or anyone licensing it on behalf of the U.S. Government, the following notice is applicable:
U.S. GOVERNMENT RIGHTS Programs, software, databases, and related documentation and technical data delivered to U.S. Government customers are "commercial computer software" or "commercial technical data" pursuant to the applicable Federal Acquisition Regulation and agency-specific supplemental regulations. As such, the use, duplication, disclosure, modification, and adaptation shall be subject to the restrictions and license terms set forth in the applicable Government contract, and, to the extent applicable by the terms of the Government contract, the additional rights set forth in FAR 52.227-19, Commercial Computer Software License (December 2007). Oracle America, Inc., 500 Oracle Parkway, Redwood City, CA 94065.
This software or hardware is developed for general use in a variety of information management applications. It is not developed or intended for use in any inherently dangerous applications, including applications which may create a risk of personal injury. If you use this software or hardware in dangerous applications, then you shall be responsible to take all appropriate fail-safe, backup, redundancy and other measures to ensure its safe use. Oracle Corporation and its affiliates disclaim any liability for any damages caused by use of this software or hardware in dangerous applications.
Oracle and Java are registered trademarks of Oracle and/or its affiliates. Other names may be trademarks of their respective owners.
This software or hardware and documentation may provide access to or information on content, products and services from third parties. Oracle Corporation and its affiliates are not responsible for and expressly disclaim all warranties of any kind with respect to third party content, products and services. Oracle Corporation and its affiliates will not be responsible for any loss, costs, or damages incurred due to your access to or use of third party content, products or services.

2 • User Guide
Table of Contents
Oracle Utilities Business Intelligence.................................................................................. 3Oracle Utilities Business Intelligence Portals and Zones.........................................................................3
Portals Are Made Up Of Analytic Zones..................................................................................... 3Characteristics Common To All Oracle Utilities Business Intelligence Zones........................... 4Zone Types.................................................................................................................................12
Preparing To Implement Oracle Utilities Business Intelligence............................................................22 Oracle Utilities Business Intelligence Fundamentals............................................................................23
General Data-Warehousing Concepts........................................................................................ 23Installation Options.................................................................................................................... 33Capturing Changes In Source-Data............................................................................................33Extract Processes........................................................................................................................35
Configuring Analytic Zones...................................................................................................................37Configuration Mode................................................................................................................... 38Concepts and Techniques...........................................................................................................38Parameters Used to Configure Zones.........................................................................................58Changing The Default Colors.................................................................................................... 99
ETL Process......................................................................................................................................... 100Oracle Warehouse Builder....................................................................................................... 100ETL Methodology.................................................................................................................... 100
Configuration Tasks............................................................................................................................. 106Setting Up the System.............................................................................................................. 106Working With Materialized Views.......................................................................................... 114
Goals and User Defined Facts..............................................................................................................128The Big Picture of Goal Types.................................................................................................129User-Defined Facts...................................................................................................................129When A Fact Has Multiple Goal Types................................................................................... 130The Big Picture of Goal Events................................................................................................130Using and Displaying Goals On Zones.................................................................................... 130Sample Zones Using Goals...................................................................................................... 130Defining Goal Types................................................................................................................ 130Defining Goal Events............................................................................................................... 132
Maps (Portals and Zones).....................................................................................................................134Technical Components.............................................................................................................134Structure of a Map....................................................................................................................135Building a Map.........................................................................................................................136Configuring a Map................................................................................................................... 136Creating a Map Zone................................................................................................................136
Maps (Oracle Business Intelligence Enterprise Edition)..................................................................... 140Technical Components.............................................................................................................141Configuring Maps.................................................................................................................... 142
Oracle Utilities Business Intelligence User Guide • 3
Oracle Utilities Business IntelligenceThis section documents the business processes and administrative functions for the Oracle Utilities BusinessIntelligence application.
Note: References to Portals and Zones in this document apply only to the user interface used in Oracle UtilitiesBusiness Intelligence versions 2.0.5 and 2.2.x. If you are using Oracle Utilities Business Intelligence v2.3.0 orlater, please refer to the Oracle Utilities Business Intelligence Metric Reference Guides for information aboutthe dashboards and answers provided with the application, and the Oracle Business Intelligence EnterpriseEdition documentation for information on creating and configuring Oracle Business Intelligence EnterpriseEdition dashboards and answers.
Oracle Utilities Business Intelligence Portals and ZonesOracle Utilities Business Intelligence data is displayed in a variety of portals and zones. The contents of this chapterdescribe features and functions unique to Oracle Utilities Business Intelligence portals and zones.
FMI: Refer to Introduction to System Wide Standards for a description of functionality shared by manyproducts.
Note: The concepts described in this chapter apply only to the user interface used in Oracle Utilities BusinessIntelligence versions 2.0.5 and 2.2.x. If you are using Oracle Utilities Business Intelligence v2.3.0 or later,please refer to the Oracle Utilities Business Intelligence Metric Reference Guides for information about thedashboards and answers provided with the application, and the Oracle Business Intelligence Enterprise Editiondocumentation for information on creating and configuring Oracle Business Intelligence Enterprise Editiondashboards and answers.
Portals Are Made Up Of Analytic Zones
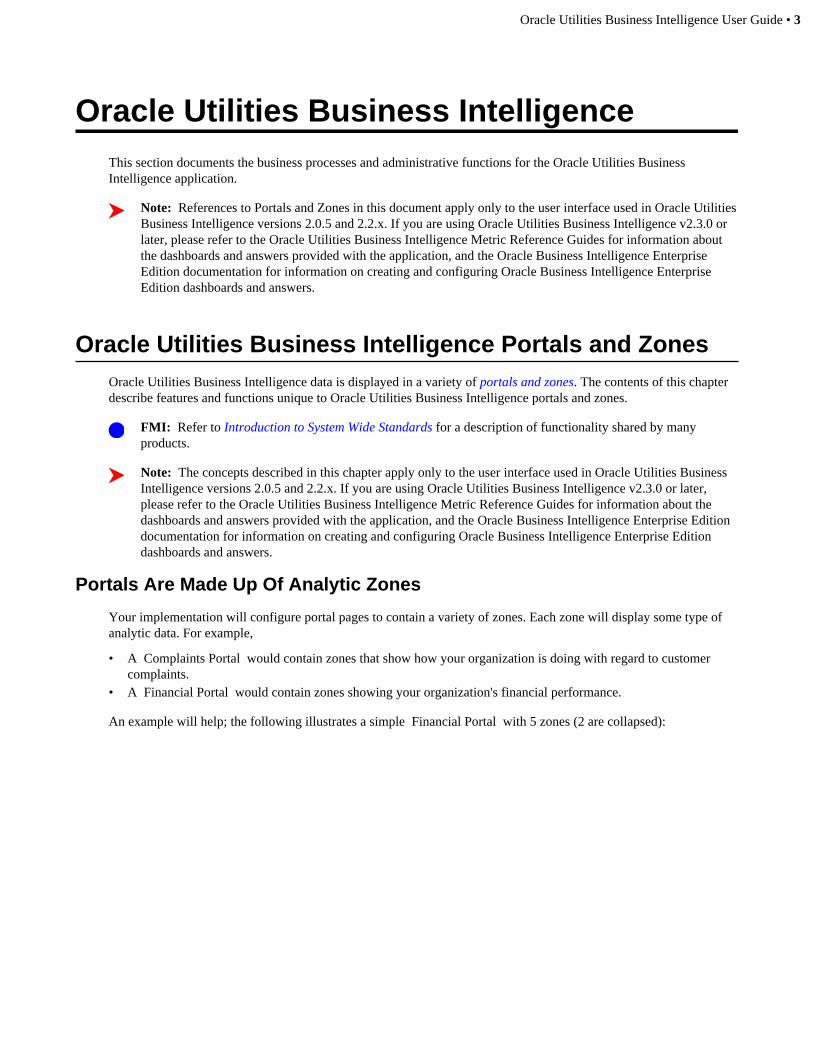
Your implementation will configure portal pages to contain a variety of zones. Each zone will display some type ofanalytic data. For example,
• A Complaints Portal would contain zones that show how your organization is doing with regard to customercomplaints.
• A Financial Portal would contain zones showing your organization's financial performance.
An example will help; the following illustrates a simple Financial Portal with 5 zones (2 are collapsed):
4 • Oracle Utilities Business Intelligence User Guide
The following topics describe how portals are configured and organized.
Portal Configuration
You will not find any portals in the base-package. Why? Because every customer has different analytic requirementsand therefore each implementation must design portals and zones to match their requirements. In other words, untilyou configure the system, you will not be able to see your analytic data as no portals or zones are supplied with thebase-package.
But don't think you have to develop your portals and zones from scratch. We deliver Oracle Utilities BusinessIntelligence with a wide-variety of zone templates (which we call " Zone Types") ready for configuration. Thisapproach allows your zones to contain the data that you need. Refer to Configuration Tasks for more information.
Organizing Portals and Zones
While you can configure Oracle Utilities Business Intelligence to have any number of independent portals (e.g., afinancial portal, a complaints portal), we strongly recommend that you organize your portals into hierarchies. Referto Portals Can Be Structured into Hierarchies for more information.
Characteristics Common To All Oracle Utilities Business IntelligenceZones
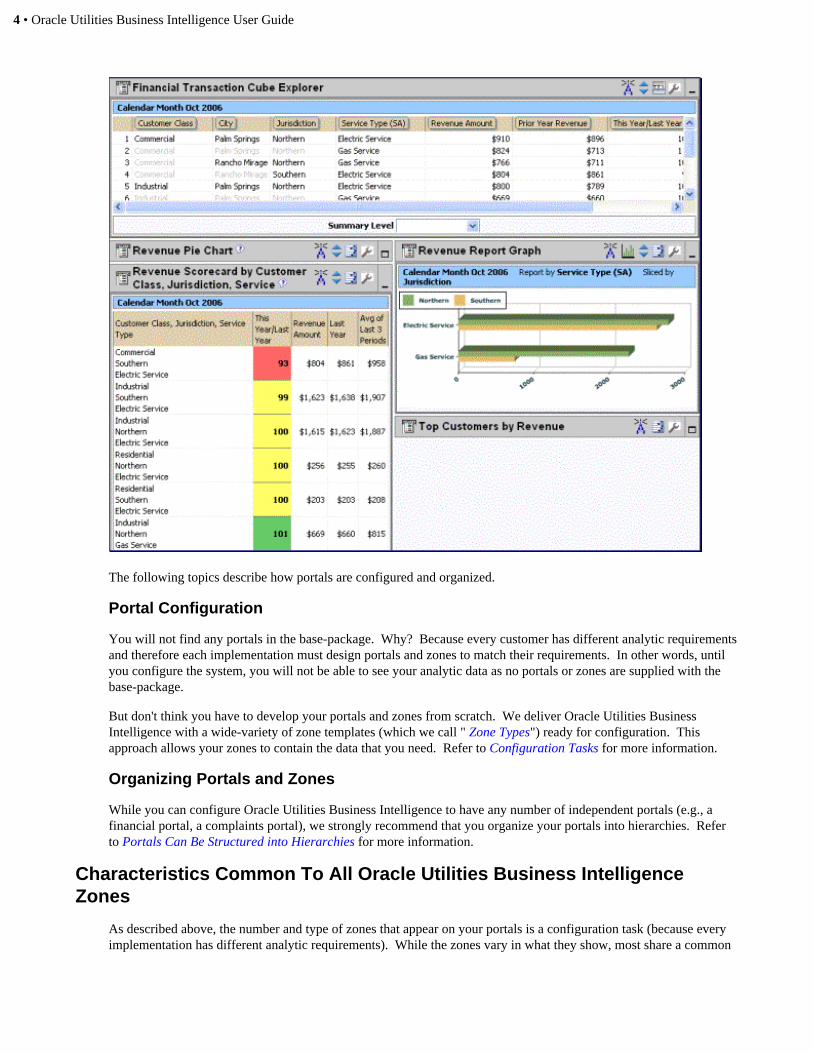
As described above, the number and type of zones that appear on your portals is a configuration task (because everyimplementation has different analytic requirements). While the zones vary in what they show, most share a common

Oracle Utilities Business Intelligence User Guide • 5
layout. The following pie chart zone highlights the common elements of most Oracle Utilities Business Intelligencezones.
The topics in this section describe each area.
Title Bar
The Title Bar contains the zone's description as well as icons and menu items that perform a variety of tasks.
In the corner of the Title Bar, you'll see an indication if the zone is collapsed (i.e., minimized) or expanded. Eachtime you click the indicator, the zone toggles between being expanded and collapsed. The following is an example ofhow a zone looks when it's not collapsed:
Note: Recommendation. We recommend that Portal Preferences be set up to collapse zones that aren't neededevery time a portal is displayed. Why? Because the system doesn't build collapsed zones when a portal isdisplayed. Rather, collapsed zones are only built when a user expands them. In other words, indicating a zoneis collapsed improves response times.
The topics in this section describe each icon and menu item.
Business Intelligence Zone Menu
This section describes the menu items that appear when you click the zone menu icon.
6 • Oracle Utilities Business Intelligence User Guide
Copy Filters
Select the Copy Filters menu item to transfer the time-period and filter values to the clipboard (for eventual pastinginto another zone). After copying the values, select the Paste Filters menu item in the target zone to apply the copiedvalues.
Paste Filters
Select the Paste Filters menu item to transfer the time-period and filter values from the clipboard to a zone (thesevalues are put into the clipboard when you select the Copy Filters menu item in another zone).
Reset Zone
Select the Reset Zone menu item to refresh the zone using its default values.
Export To Excel
Select the Export to Excel menu item to download the zone's data to Excel. This menu item is suppressed if the zonehas been configured to not download rows to Excel.
The default setting in Internet Explorer causes Excel to open in the same browser window. If you'd prefer to openExcel in a separate window, follow the instruction that applies to your operating system:
• Windows 98. Click on My Computer. Go to View on the top menu bar and then go to Options. Now go to theFile Types tab. Among the file types listed, find Microsoft Excel Worksheet and double-click it. A window willopen displaying options. Unclick the option Browse in same window . Excel files will now open in a separatewindow.
• Windows NT, 2000. Click on My Computer. Go to Tools on the top menu bar and click on Folder Options thenclick on the File Types tab. Among the file types listed, find Microsoft Excel Worksheet and double-click it. Awindow will open displaying options. Unclick the option Browse in same window . Excel files will now open ina separate window.
• Windows XP. Click on My Computer. Go to Tools on the top menu bar and click on Folder Options then clickon the File Types tab. Among the file types listed, find Microsoft Excel Worksheet and click the Advancedbutton. A window will open displaying options. Unclick the option Browse in same window for the Open action. Excel files will now open in a separate window.
Print Zone
Select the Print Zone menu item to print the zone.
Show Service Data
Select the Show Service Data menu item to open a pop-up window containing the "raw" data retrieved from theserver.
Note: Debug mode only. This menu item only appears when the system operates in Debug mode.
Show SQL
Select the Show SQL menu item to open a pop-up window containing the SQL statement(s) that the system uses toretrieve the zone's data. Note, this pop-up only contains information if you've turned on the Global debug checkboxin the upper corner of the browser (and make sure to refresh the zone after turning on this checkbox).
Note: Debug mode only. This icon only appears when the system operates in Debug mode.
Oracle Utilities Business Intelligence User Guide • 7
Zone Help Text
If the zone has help text, a help icon suffixes the zone's description. Clicking this icon causes the zone's help text toappear in a pop-up.
Note: A zone's help text is defined on the zone's configuration.
Hyperlinks To Initiate Business Processes and Other Applications
A zone can be configured to show up to 5 actions in its title bar. The actions can appear as a hyperlink, icon orbutton. The action can also be provided as an HTML string. These actions can initiate a business process assistantscript or navigate to an external URL.
Broadcast
Click the broadcast icon to send the zone's filter values to the other zones in the portal.
Note, there are alternate ways to broadcast values from a zone:
• Click on a dimensional scorecard row to broadcast the combination of dimensions (as filters)• Click on a bubble, line or bar on a chronological graph to broadcast the segment's time period.• Click on a bar in a report graph to broadcast the report by value (as a filter).• Click on a slice in a pie chart to broadcast the dimensional value (as a filter).• Click on a row in a cube explorer to broadcast the combination of dimensions (as filters).
In addition, clicking on a hyperlink (in the hyperlink bar) broadcasts the zone's filter values to all of the zones in theassociated portal.
Design for broadcasting. The broadcast feature is very powerful when your zones are designed with broadcastingin mind. For example, you might broadcast from a pie chart to limit the data shown in other zones to the selecteddimensional value.
Move Period Up / Down
These icons move the zone's base time-period up or down one period. For example, if the zone currently showsMarch 2006, clicking the "up" icon will cause the zone to show April 2006.
Note: These icons do not appear if the zone has been configured to not use time periods.
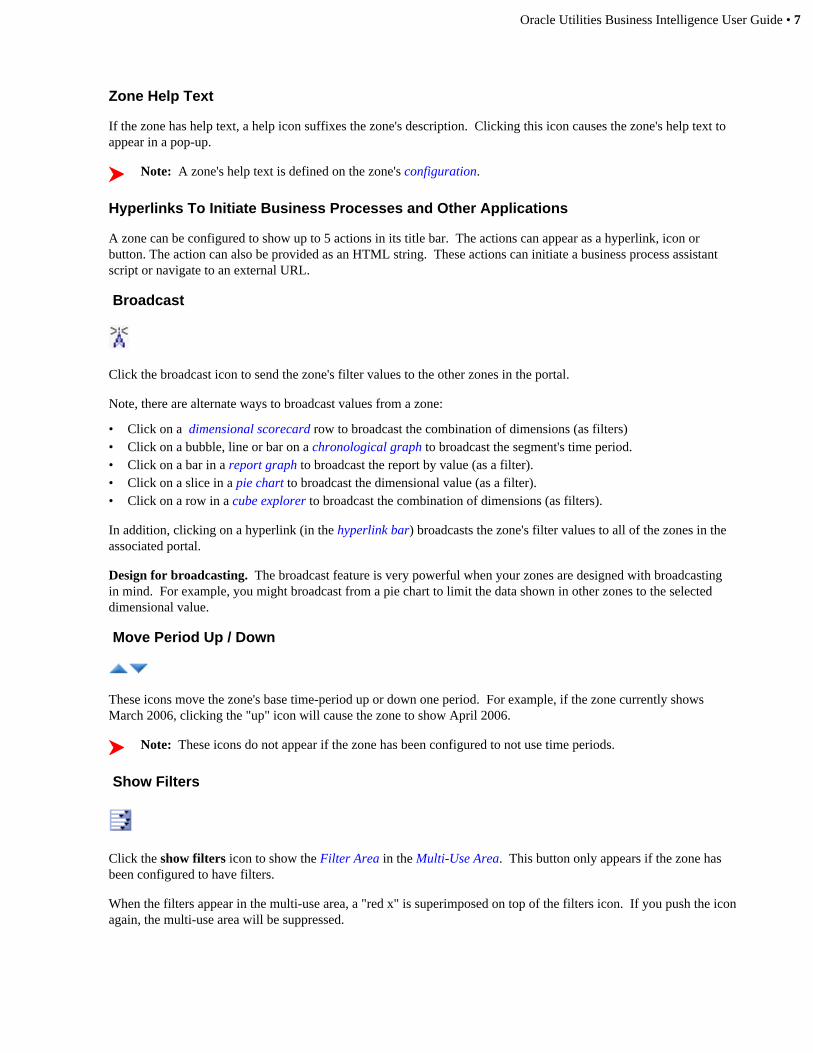
Show Filters
Click the show filters icon to show the Filter Area in the Multi-Use Area. This button only appears if the zone hasbeen configured to have filters.
When the filters appear in the multi-use area, a "red x" is superimposed on top of the filters icon. If you push the iconagain, the multi-use area will be suppressed.
8 • Oracle Utilities Business Intelligence User Guide
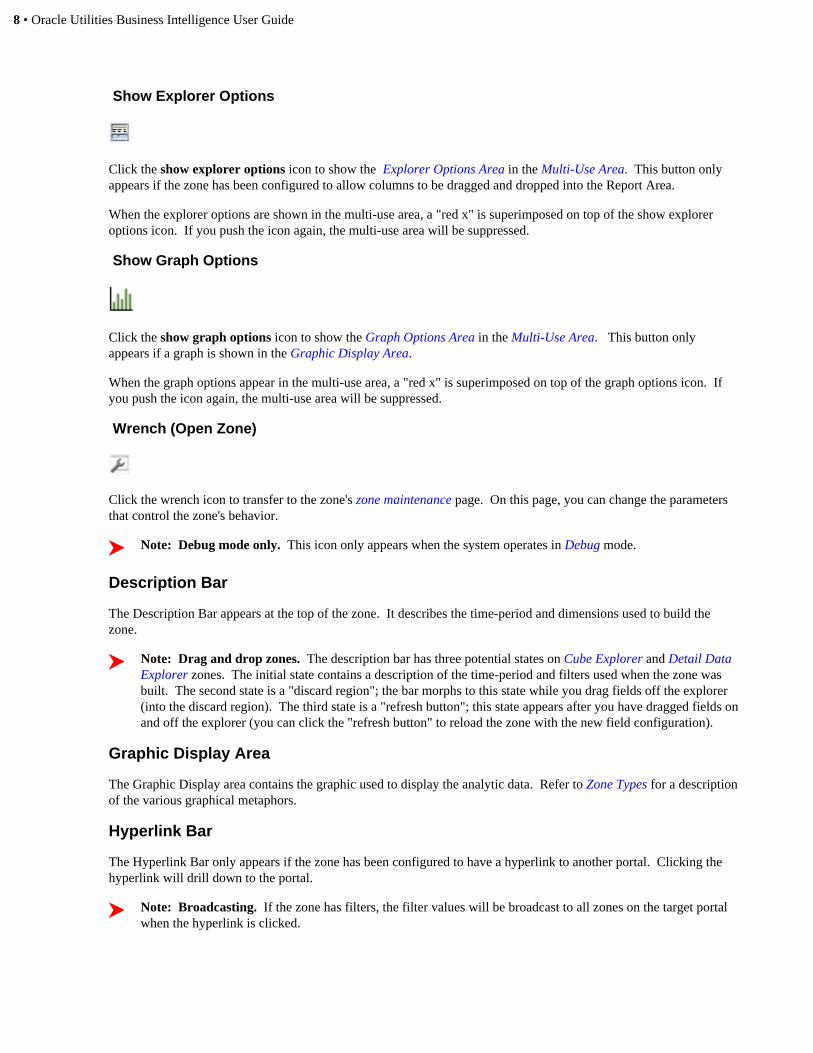
Show Explorer Options
Click the show explorer options icon to show the Explorer Options Area in the Multi-Use Area. This button onlyappears if the zone has been configured to allow columns to be dragged and dropped into the Report Area.
When the explorer options are shown in the multi-use area, a "red x" is superimposed on top of the show exploreroptions icon. If you push the icon again, the multi-use area will be suppressed.
Show Graph Options
Click the show graph options icon to show the Graph Options Area in the Multi-Use Area. This button onlyappears if a graph is shown in the Graphic Display Area.
When the graph options appear in the multi-use area, a "red x" is superimposed on top of the graph options icon. Ifyou push the icon again, the multi-use area will be suppressed.
Wrench (Open Zone)
Click the wrench icon to transfer to the zone's zone maintenance page. On this page, you can change the parametersthat control the zone's behavior.
Note: Debug mode only. This icon only appears when the system operates in Debug mode.
Description Bar
The Description Bar appears at the top of the zone. It describes the time-period and dimensions used to build thezone.
Note: Drag and drop zones. The description bar has three potential states on Cube Explorer and Detail DataExplorer zones. The initial state contains a description of the time-period and filters used when the zone wasbuilt. The second state is a "discard region"; the bar morphs to this state while you drag fields off the explorer(into the discard region). The third state is a "refresh button"; this state appears after you have dragged fields onand off the explorer (you can click the "refresh button" to reload the zone with the new field configuration).
Graphic Display Area
The Graphic Display area contains the graphic used to display the analytic data. Refer to Zone Types for a descriptionof the various graphical metaphors.
Hyperlink Bar
The Hyperlink Bar only appears if the zone has been configured to have a hyperlink to another portal. Clicking thehyperlink will drill down to the portal.
Note: Broadcasting. If the zone has filters, the filter values will be broadcast to all zones on the target portalwhen the hyperlink is clicked.

Oracle Utilities Business Intelligence User Guide • 9
Summary Level
The Summary Level dropdown only appears when a cube explorer is shown in the graphic display area.
The dropdown contains an entry for each dimension in the explorer. When you click an entry in the dropdown thezone reloads showing information summarized at the selected level. This allows you to change the granularity of thesummary information without having to drag / drop dimensions on / off the explorer.
Multi-Use Area
The multi-use area is located beneath the Graphic Display Area. Clicking the various "show" and "close" buttons inthe zone's title bar causes this area's content to change to match the desired usage. The topics in this section describethis area's possible content.
Initially Suppressed
When a portal page is initially displayed, the multi-use area is suppressed on most zones. You must press one of the"show" buttons described above to display one of the following areas.
Filter Area
Click Show Filters to expose the Filter Area. You can use this area to filter the information that appears in the zoneby different values. For example, you can use the Filter Area to:
• change the zone's time-period• change the zone's filters• change the object being "sliced" in a Graph or Pie Chart• change the object being "reported on" in a Report Graph• toggle between the worst or best objects in a Dimensional Scorecard
As can be deduced from the above points, the contents of the Filter Area differ depending on the zone's graphicalmetaphor. The following is an example of how the Filter Area looks for a Dimensional Scorecard zone (keep inmind that the zone's configuration controls the fields that appear in this area):
Whereas the following shows how the filter area looks for a Report Graph that supports slicing:
10 • Oracle Utilities Business Intelligence User Guide
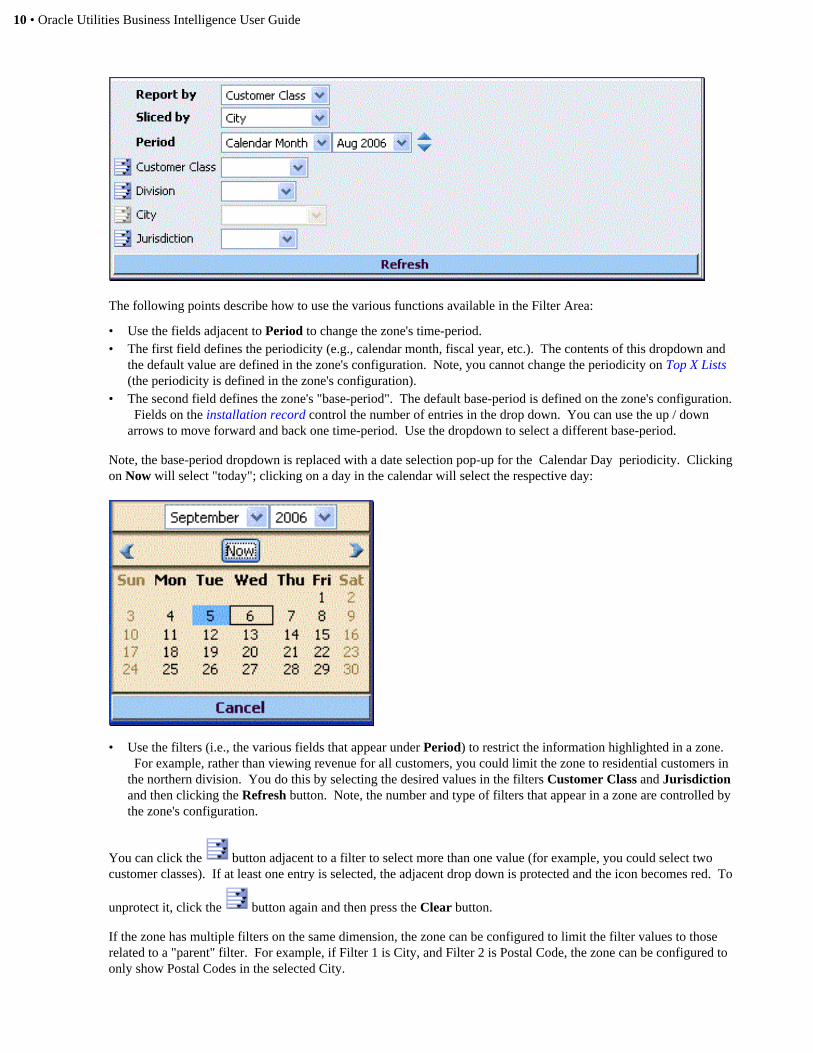
The following points describe how to use the various functions available in the Filter Area:
• Use the fields adjacent to Period to change the zone's time-period.• The first field defines the periodicity (e.g., calendar month, fiscal year, etc.). The contents of this dropdown and
the default value are defined in the zone's configuration. Note, you cannot change the periodicity on Top X Lists(the periodicity is defined in the zone's configuration).
• The second field defines the zone's "base-period". The default base-period is defined on the zone's configuration. Fields on the installation record control the number of entries in the drop down. You can use the up / downarrows to move forward and back one time-period. Use the dropdown to select a different base-period.
Note, the base-period dropdown is replaced with a date selection pop-up for the Calendar Day periodicity. Clickingon Now will select "today"; clicking on a day in the calendar will select the respective day:
• Use the filters (i.e., the various fields that appear under Period) to restrict the information highlighted in a zone. For example, rather than viewing revenue for all customers, you could limit the zone to residential customers inthe northern division. You do this by selecting the desired values in the filters Customer Class and Jurisdictionand then clicking the Refresh button. Note, the number and type of filters that appear in a zone are controlled bythe zone's configuration.
You can click the button adjacent to a filter to select more than one value (for example, you could select twocustomer classes). If at least one entry is selected, the adjacent drop down is protected and the icon becomes red. To
unprotect it, click the button again and then press the Clear button.
If the zone has multiple filters on the same dimension, the zone can be configured to limit the filter values to thoserelated to a "parent" filter. For example, if Filter 1 is City, and Filter 2 is Postal Code, the zone can be configured toonly show Postal Codes in the selected City.
Oracle Utilities Business Intelligence User Guide • 11
• Some zones have been configured to have a Slice by option; this option allows you to change the object beingsliced. For example, a pie chart can be configured to initially slice revenue by Customer Class ; you could usethis option to re-slice it by another filter on the zone. Please note:
• The Slice by values are the same as the zone's filters• When you slice by a given dimensional filter's values, the respective dimensional filter is disabled.• Report graphs have a Report by option that allows you to change the object being reported on. For example, a
report graph zone can be configured to initially display slices by Customer Class ; you could then use this optionto report on another filter on the zone.
• Dimensional Scorecards have a Sort Order that controls if the best or worst combinations are shown first. Thedefault value is defined in the zone's configuration.
Note: Bold versus normal fonts. Labels that appear in the Filter Area are either shown in bold or normalfont. Bold labels are used to highlight that the zone will be automatically refreshed when the correspondingdropdown value is selected. Normal font labels are used to highlight that any change to the correspondingdropdown will NOT cause the zone to be automatically refreshed. Rather, the zone will only be refreshed whenthe user presses the Refresh button.
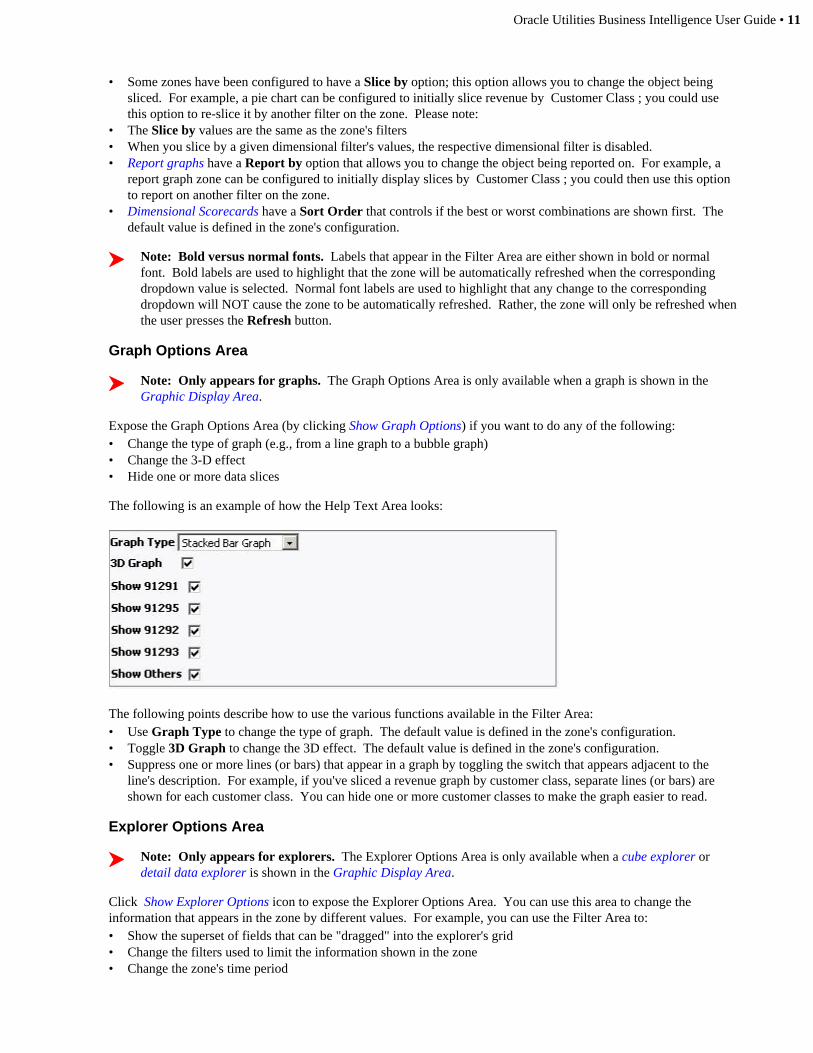
Graph Options Area
Note: Only appears for graphs. The Graph Options Area is only available when a graph is shown in theGraphic Display Area.
Expose the Graph Options Area (by clicking Show Graph Options) if you want to do any of the following:• Change the type of graph (e.g., from a line graph to a bubble graph)• Change the 3-D effect• Hide one or more data slices
The following is an example of how the Help Text Area looks:
The following points describe how to use the various functions available in the Filter Area:• Use Graph Type to change the type of graph. The default value is defined in the zone's configuration.• Toggle 3D Graph to change the 3D effect. The default value is defined in the zone's configuration.• Suppress one or more lines (or bars) that appear in a graph by toggling the switch that appears adjacent to the
line's description. For example, if you've sliced a revenue graph by customer class, separate lines (or bars) areshown for each customer class. You can hide one or more customer classes to make the graph easier to read.
Explorer Options Area
Note: Only appears for explorers. The Explorer Options Area is only available when a cube explorer ordetail data explorer is shown in the Graphic Display Area.
Click Show Explorer Options icon to expose the Explorer Options Area. You can use this area to change theinformation that appears in the zone by different values. For example, you can use the Filter Area to:• Show the superset of fields that can be "dragged" into the explorer's grid• Change the filters used to limit the information shown in the zone• Change the zone's time period
12 • Oracle Utilities Business Intelligence User Guide
Note: Static reports. One of the zone's configuration options allows you to define if the Explorer OptionsArea should always be suppressed when the zone is displayed. You might want to do this to implement a"static" report that cannot be changed.
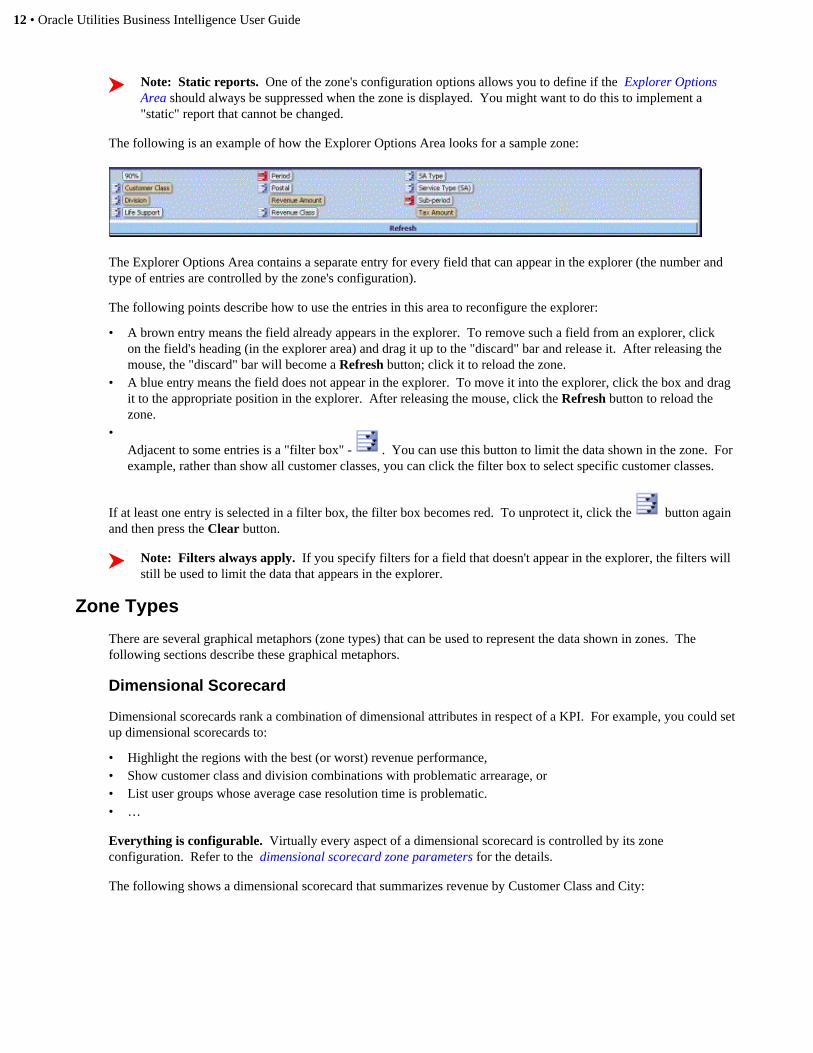
The following is an example of how the Explorer Options Area looks for a sample zone:
The Explorer Options Area contains a separate entry for every field that can appear in the explorer (the number andtype of entries are controlled by the zone's configuration).
The following points describe how to use the entries in this area to reconfigure the explorer:
• A brown entry means the field already appears in the explorer. To remove such a field from an explorer, clickon the field's heading (in the explorer area) and drag it up to the "discard" bar and release it. After releasing themouse, the "discard" bar will become a Refresh button; click it to reload the zone.
• A blue entry means the field does not appear in the explorer. To move it into the explorer, click the box and dragit to the appropriate position in the explorer. After releasing the mouse, click the Refresh button to reload thezone.
•Adjacent to some entries is a "filter box" - . You can use this button to limit the data shown in the zone. Forexample, rather than show all customer classes, you can click the filter box to select specific customer classes.
If at least one entry is selected in a filter box, the filter box becomes red. To unprotect it, click the button againand then press the Clear button.
Note: Filters always apply. If you specify filters for a field that doesn't appear in the explorer, the filters willstill be used to limit the data that appears in the explorer.
Zone Types
There are several graphical metaphors (zone types) that can be used to represent the data shown in zones. Thefollowing sections describe these graphical metaphors.
Dimensional Scorecard
Dimensional scorecards rank a combination of dimensional attributes in respect of a KPI. For example, you could setup dimensional scorecards to:
• Highlight the regions with the best (or worst) revenue performance,• Show customer class and division combinations with problematic arrearage, or• List user groups whose average case resolution time is problematic.• …
Everything is configurable. Virtually every aspect of a dimensional scorecard is controlled by its zoneconfiguration. Refer to the dimensional scorecard zone parameters for the details.
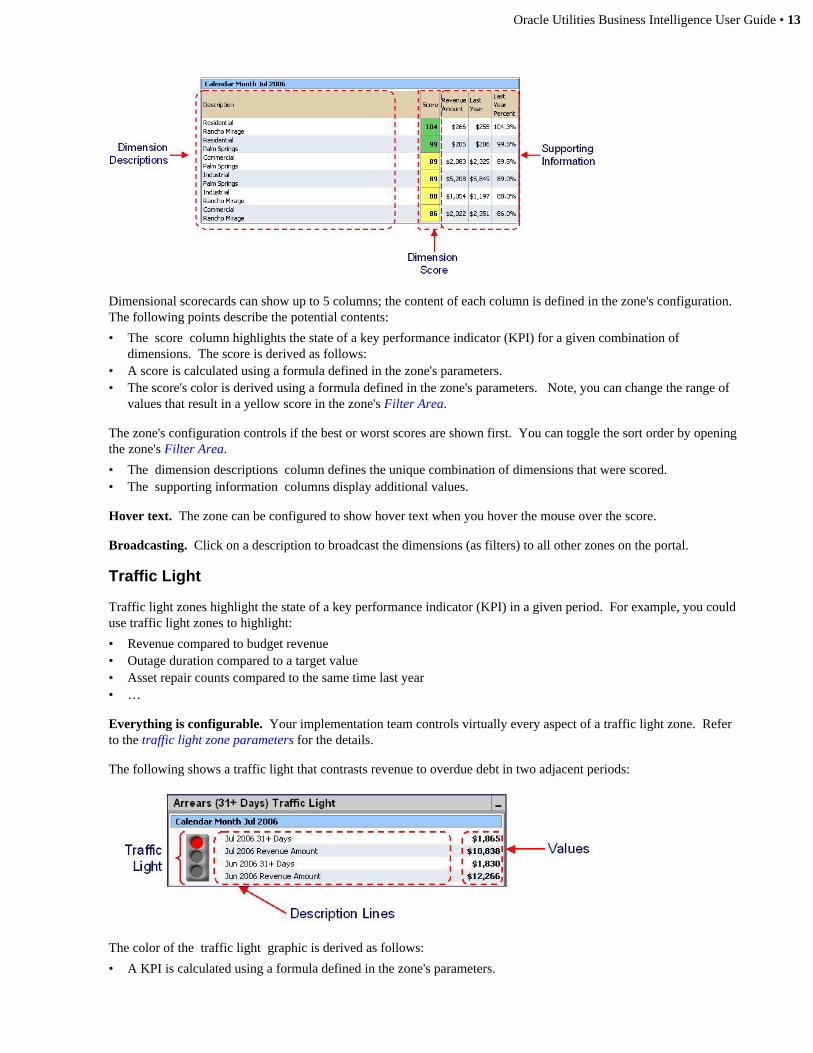
The following shows a dimensional scorecard that summarizes revenue by Customer Class and City:
Oracle Utilities Business Intelligence User Guide • 13
Dimensional scorecards can show up to 5 columns; the content of each column is defined in the zone's configuration. The following points describe the potential contents:
• The score column highlights the state of a key performance indicator (KPI) for a given combination ofdimensions. The score is derived as follows:
• A score is calculated using a formula defined in the zone's parameters.• The score's color is derived using a formula defined in the zone's parameters. Note, you can change the range of
values that result in a yellow score in the zone's Filter Area.
The zone's configuration controls if the best or worst scores are shown first. You can toggle the sort order by openingthe zone's Filter Area.
• The dimension descriptions column defines the unique combination of dimensions that were scored.• The supporting information columns display additional values.
Hover text. The zone can be configured to show hover text when you hover the mouse over the score.
Broadcasting. Click on a description to broadcast the dimensions (as filters) to all other zones on the portal.
Traffic Light
Traffic light zones highlight the state of a key performance indicator (KPI) in a given period. For example, you coulduse traffic light zones to highlight:
• Revenue compared to budget revenue• Outage duration compared to a target value• Asset repair counts compared to the same time last year• …
Everything is configurable. Your implementation team controls virtually every aspect of a traffic light zone. Referto the traffic light zone parameters for the details.
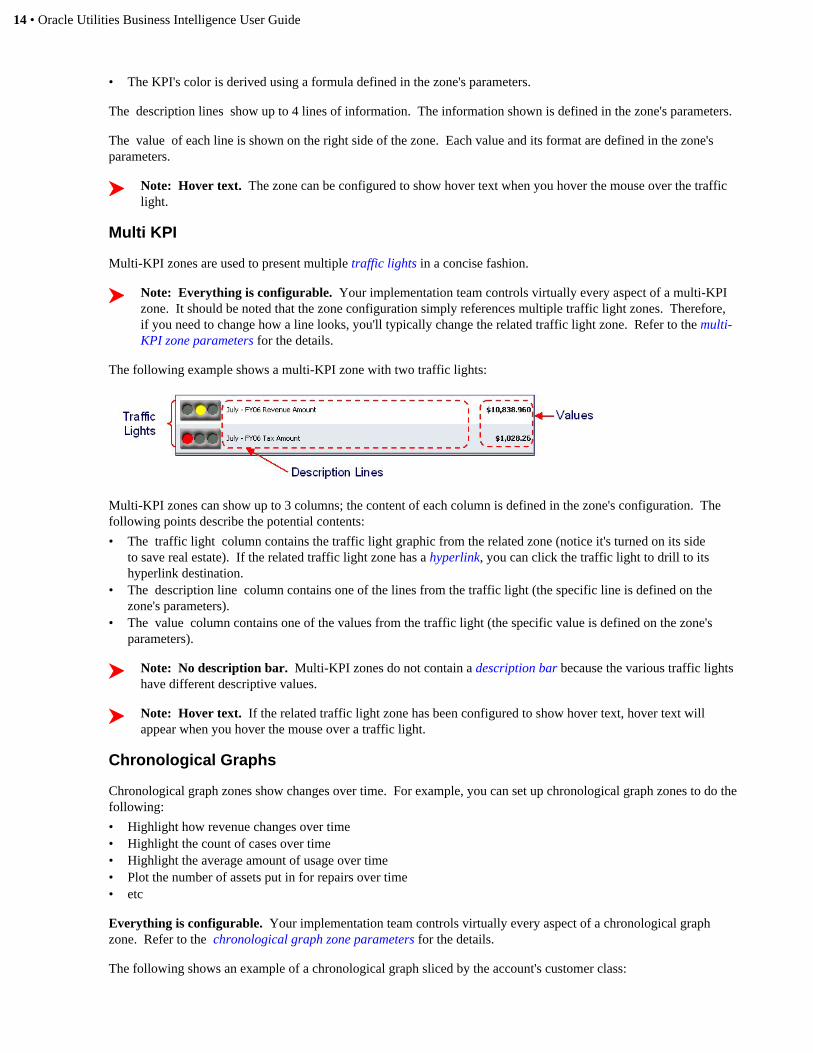
The following shows a traffic light that contrasts revenue to overdue debt in two adjacent periods:
The color of the traffic light graphic is derived as follows:
• A KPI is calculated using a formula defined in the zone's parameters.
14 • Oracle Utilities Business Intelligence User Guide
• The KPI's color is derived using a formula defined in the zone's parameters.
The description lines show up to 4 lines of information. The information shown is defined in the zone's parameters.
The value of each line is shown on the right side of the zone. Each value and its format are defined in the zone'sparameters.
Note: Hover text. The zone can be configured to show hover text when you hover the mouse over the trafficlight.
Multi KPI
Multi-KPI zones are used to present multiple traffic lights in a concise fashion.
Note: Everything is configurable. Your implementation team controls virtually every aspect of a multi-KPIzone. It should be noted that the zone configuration simply references multiple traffic light zones. Therefore,if you need to change how a line looks, you'll typically change the related traffic light zone. Refer to the multi-KPI zone parameters for the details.
The following example shows a multi-KPI zone with two traffic lights:
Multi-KPI zones can show up to 3 columns; the content of each column is defined in the zone's configuration. Thefollowing points describe the potential contents:
• The traffic light column contains the traffic light graphic from the related zone (notice it's turned on its sideto save real estate). If the related traffic light zone has a hyperlink, you can click the traffic light to drill to itshyperlink destination.
• The description line column contains one of the lines from the traffic light (the specific line is defined on thezone's parameters).
• The value column contains one of the values from the traffic light (the specific value is defined on the zone'sparameters).
Note: No description bar. Multi-KPI zones do not contain a description bar because the various traffic lightshave different descriptive values.
Note: Hover text. If the related traffic light zone has been configured to show hover text, hover text willappear when you hover the mouse over a traffic light.
Chronological Graphs
Chronological graph zones show changes over time. For example, you can set up chronological graph zones to do thefollowing:
• Highlight how revenue changes over time• Highlight the count of cases over time• Highlight the average amount of usage over time• Plot the number of assets put in for repairs over time• etc
Everything is configurable. Your implementation team controls virtually every aspect of a chronological graphzone. Refer to the chronological graph zone parameters for the details.
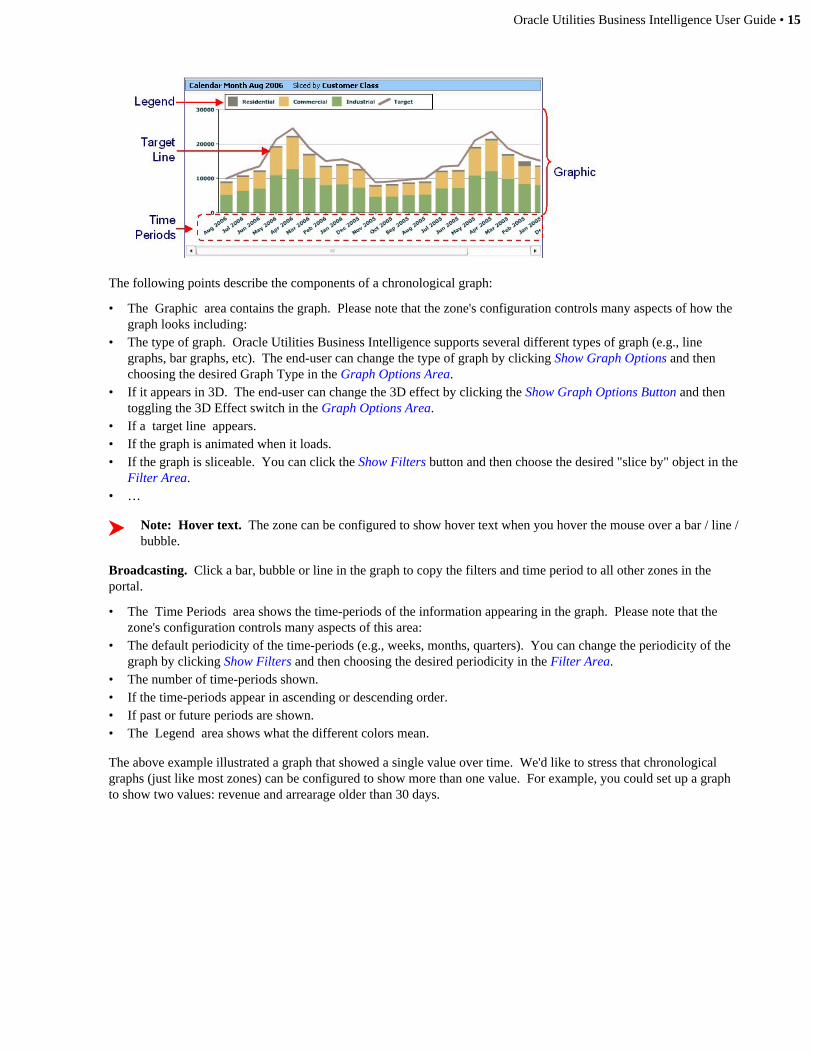
The following shows an example of a chronological graph sliced by the account's customer class:
Oracle Utilities Business Intelligence User Guide • 15
The following points describe the components of a chronological graph:
• The Graphic area contains the graph. Please note that the zone's configuration controls many aspects of how thegraph looks including:
• The type of graph. Oracle Utilities Business Intelligence supports several different types of graph (e.g., linegraphs, bar graphs, etc). The end-user can change the type of graph by clicking Show Graph Options and thenchoosing the desired Graph Type in the Graph Options Area.
• If it appears in 3D. The end-user can change the 3D effect by clicking the Show Graph Options Button and thentoggling the 3D Effect switch in the Graph Options Area.
• If a target line appears.• If the graph is animated when it loads.• If the graph is sliceable. You can click the Show Filters button and then choose the desired "slice by" object in the
Filter Area.• …
Note: Hover text. The zone can be configured to show hover text when you hover the mouse over a bar / line /bubble.
Broadcasting. Click a bar, bubble or line in the graph to copy the filters and time period to all other zones in theportal.
• The Time Periods area shows the time-periods of the information appearing in the graph. Please note that thezone's configuration controls many aspects of this area:
• The default periodicity of the time-periods (e.g., weeks, months, quarters). You can change the periodicity of thegraph by clicking Show Filters and then choosing the desired periodicity in the Filter Area.
• The number of time-periods shown.• If the time-periods appear in ascending or descending order.• If past or future periods are shown.• The Legend area shows what the different colors mean.
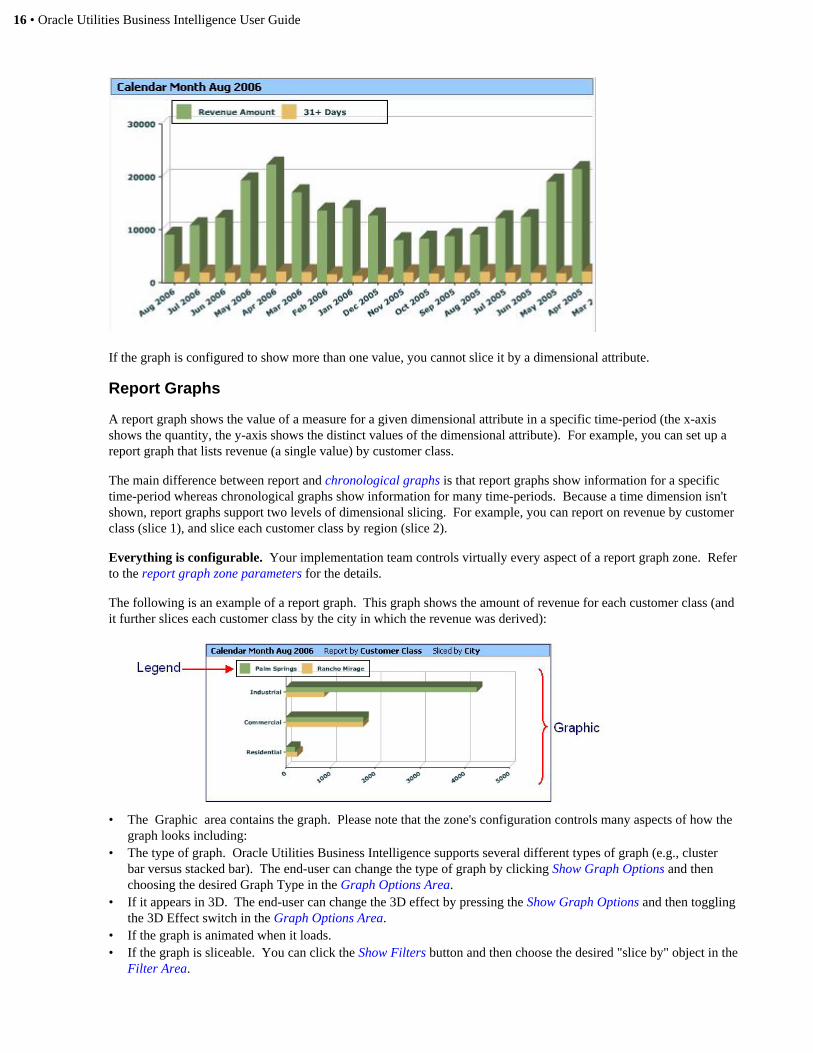
The above example illustrated a graph that showed a single value over time. We'd like to stress that chronologicalgraphs (just like most zones) can be configured to show more than one value. For example, you could set up a graphto show two values: revenue and arrearage older than 30 days.
16 • Oracle Utilities Business Intelligence User Guide
If the graph is configured to show more than one value, you cannot slice it by a dimensional attribute.
Report Graphs
A report graph shows the value of a measure for a given dimensional attribute in a specific time-period (the x-axisshows the quantity, the y-axis shows the distinct values of the dimensional attribute). For example, you can set up areport graph that lists revenue (a single value) by customer class.
The main difference between report and chronological graphs is that report graphs show information for a specifictime-period whereas chronological graphs show information for many time-periods. Because a time dimension isn'tshown, report graphs support two levels of dimensional slicing. For example, you can report on revenue by customerclass (slice 1), and slice each customer class by region (slice 2).
Everything is configurable. Your implementation team controls virtually every aspect of a report graph zone. Referto the report graph zone parameters for the details.
The following is an example of a report graph. This graph shows the amount of revenue for each customer class (andit further slices each customer class by the city in which the revenue was derived):
• The Graphic area contains the graph. Please note that the zone's configuration controls many aspects of how thegraph looks including:
• The type of graph. Oracle Utilities Business Intelligence supports several different types of graph (e.g., clusterbar versus stacked bar). The end-user can change the type of graph by clicking Show Graph Options and thenchoosing the desired Graph Type in the Graph Options Area.
• If it appears in 3D. The end-user can change the 3D effect by pressing the Show Graph Options and then togglingthe 3D Effect switch in the Graph Options Area.
• If the graph is animated when it loads.• If the graph is sliceable. You can click the Show Filters button and then choose the desired "slice by" object in the
Filter Area.
Oracle Utilities Business Intelligence User Guide • 17
• …
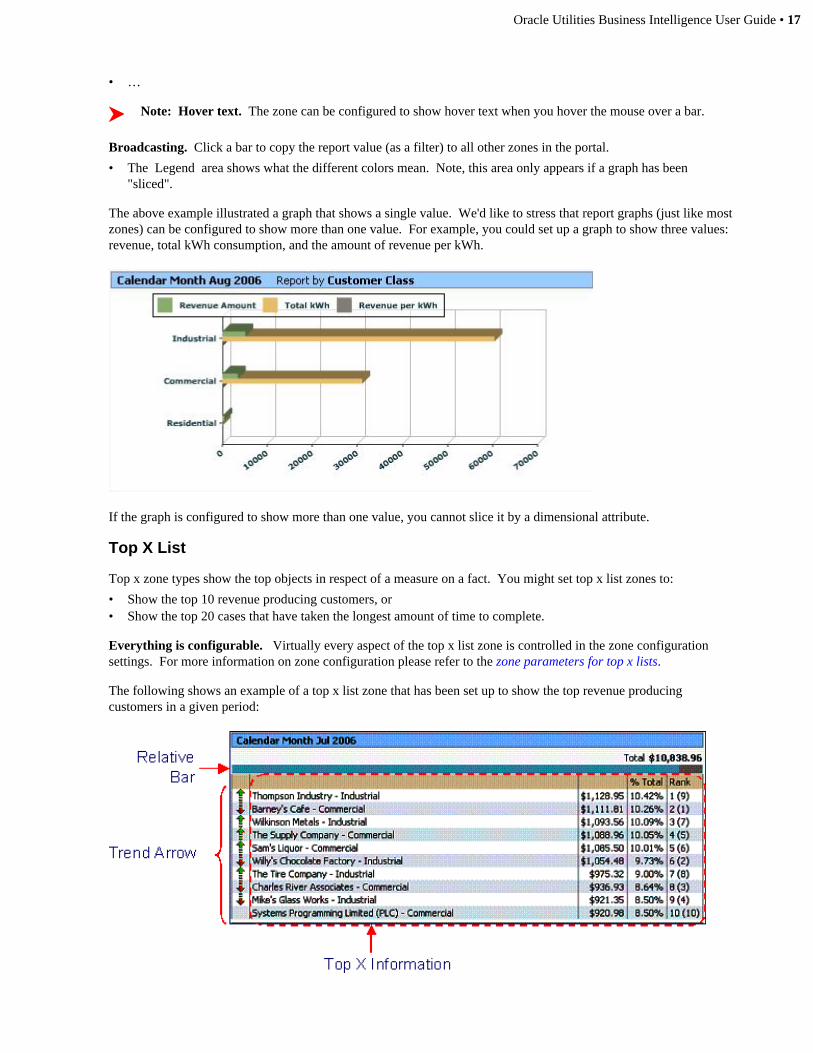
Note: Hover text. The zone can be configured to show hover text when you hover the mouse over a bar.
Broadcasting. Click a bar to copy the report value (as a filter) to all other zones in the portal.
• The Legend area shows what the different colors mean. Note, this area only appears if a graph has been"sliced".
The above example illustrated a graph that shows a single value. We'd like to stress that report graphs (just like mostzones) can be configured to show more than one value. For example, you could set up a graph to show three values:revenue, total kWh consumption, and the amount of revenue per kWh.
If the graph is configured to show more than one value, you cannot slice it by a dimensional attribute.
Top X List
Top x zone types show the top objects in respect of a measure on a fact. You might set top x list zones to:
• Show the top 10 revenue producing customers, or• Show the top 20 cases that have taken the longest amount of time to complete.
Everything is configurable. Virtually every aspect of the top x list zone is controlled in the zone configurationsettings. For more information on zone configuration please refer to the zone parameters for top x lists.
The following shows an example of a top x list zone that has been set up to show the top revenue producingcustomers in a given period:
18 • Oracle Utilities Business Intelligence User Guide
The Relative Bar represents the value of the objects in the top x list relative to all objects. To display text describingthe total value and relative percentage represented by the bar, hover the mouse over the appropriate section. In theabove example:
• The colored portion of the bar represents the values listed in the top x list.• The gray portion of the bar represents other values that are not represented in the list.
The Top X Information section shows the following:
• A description of the object such as the customer name or property address. If this information is blue, you canclick on it to open the source application and review more details. Whether or not a hyperlink is displayed isdetermined by the zone's configuration.
• The amount of the object and the percentage are displayed. These values are calculated using all objects for thetime period, not just the objects in the list.
• The rank of each object in the period shown. The value in parenthesis shows the rank of the object in the previousperiod.
The Trend Arrow indicates whether the rank of the object has trended up, down or stayed the same. This isin comparison to the ranking from the previous period. The color of this arrow is determined when the zone isconfigured.
Pie Chart
A pie chart zone shows one or more slices where each slice's size highlights its portion of the total amount. Forexample, a pie chart could show:
• Total revenue sliced by customer class (or region or …)• Churn by region• Customer contacts by contact type • Complaints by region• Tenders by type• …
Everything is configurable. Virtually every aspect of a pie chart is controlled by its zone configuration. Refer to thepie chart zone parameters for the details.
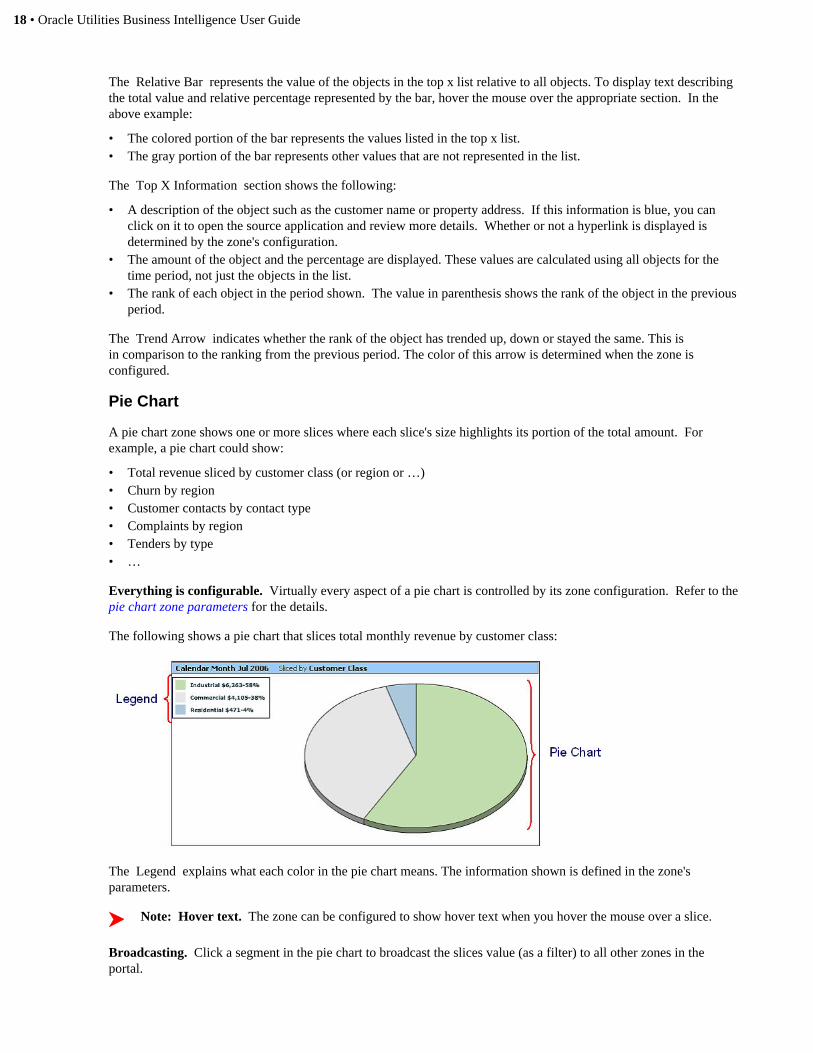
The following shows a pie chart that slices total monthly revenue by customer class:
The Legend explains what each color in the pie chart means. The information shown is defined in the zone'sparameters.
Note: Hover text. The zone can be configured to show hover text when you hover the mouse over a slice.
Broadcasting. Click a segment in the pie chart to broadcast the slices value (as a filter) to all other zones in theportal.
Oracle Utilities Business Intelligence User Guide • 19
Cube Explorer
Cube explorer zones are reports showing summarized values from one or more facts and/or goals. For example, youcould set up a zone to produce a summary of aged debt by customer class, premise type and rate schedule. After thezone is initially displayed, end users can change how the report looks by dragging and dropping fields onto (and offof) the report.
Note: Everything is configurable. Virtually every aspect of a cube explorer is controlled by its zoneconfiguration. Refer to the cube explorer zone parameters for the details.
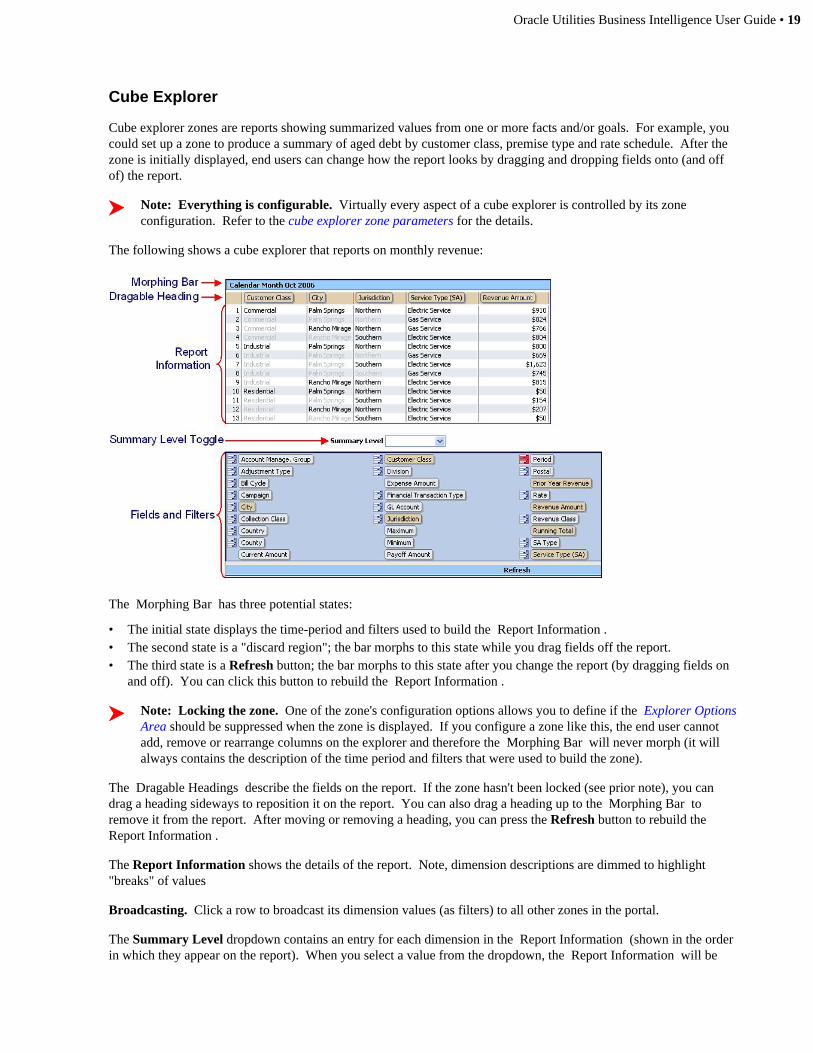
The following shows a cube explorer that reports on monthly revenue:
The Morphing Bar has three potential states:
• The initial state displays the time-period and filters used to build the Report Information . • The second state is a "discard region"; the bar morphs to this state while you drag fields off the report.• The third state is a Refresh button; the bar morphs to this state after you change the report (by dragging fields on
and off). You can click this button to rebuild the Report Information .
Note: Locking the zone. One of the zone's configuration options allows you to define if the Explorer OptionsArea should be suppressed when the zone is displayed. If you configure a zone like this, the end user cannotadd, remove or rearrange columns on the explorer and therefore the Morphing Bar will never morph (it willalways contains the description of the time period and filters that were used to build the zone).
The Dragable Headings describe the fields on the report. If the zone hasn't been locked (see prior note), you candrag a heading sideways to reposition it on the report. You can also drag a heading up to the Morphing Bar toremove it from the report. After moving or removing a heading, you can press the Refresh button to rebuild the Report Information .
The Report Information shows the details of the report. Note, dimension descriptions are dimmed to highlight"breaks" of values
Broadcasting. Click a row to broadcast its dimension values (as filters) to all other zones in the portal.
The Summary Level dropdown contains an entry for each dimension in the Report Information (shown in the orderin which they appear on the report). When you select a value from the dropdown, the Report Information will be

20 • Oracle Utilities Business Intelligence User Guide
rebuilt leaving all dimensions beneath the selected dimension blank. This allows you to change the granularity of thesummary information without having to drag / drop dimension on / off the explorer.
Refer to Explorer Options Area for a description of the Fields and Filters area.
Detail Data Explorer
Detail explorer zones are reports showing individual rows on a fact or goal. For example, you could set up a zone toproduce a report showing information about individual bill segments. After the zone is initially displayed, end userscan change how the report looks by dragging and dropping field onto (and off of) the report.
Note: Everything is configurable. Virtually every aspect of a detail data explorer is controlled by its zoneconfiguration. Refer to the detail data explorer zone parameters for the details.
The following shows a detail data explorer that reports on revenue on individual bill segments:
The Morphing Bar has three potential states:
• The initial state displays the time-period and filters used to build the Report Information . • The second state is a "discard region"; the bar morphs to this state while you drag fields off the report.• The third state is a Refresh button; the bar morphs to this state after you change the fields on the report. You can
click this button to rebuild the Report Information .
Note: Locking the zone. One of the zone's configuration options allows you to define if the Explorer OptionsArea should be suppressed when the zone is displayed. If you configure a zone like this, the end user cannotadd, remove or rearrange columns on the explorer and therefore the Morphing Bar will never morph (it willalways contains the description of the time period and filters that were used to build the zone).
The Dragable Headings describe the fields on the report. If the zone hasn't been locked (see prior note), you candrag a heading sideways to reposition it on the report. You can also drag a heading up to the Morphing Bar toremove it from the report. After moving or removing a heading, you can press the Refresh button to rebuild the Report Information .
The Report Information shows the details of the report.
Broadcasting. Click a row to broadcast its dimension values (as filters) to all other zones in the portal.
Refer to Explorer Options Area for a description of the Fields and Filters area.
Oracle Utilities Business Intelligence User Guide • 21
Gauge
Gauge zones highlight the state of a key performance indicator (KPI) in a given period. For example, you could usegauge zones to highlight:
• Revenue compared to budget revenue• Outage duration compared to a target value• Asset repair counts compared to the same time last year• …
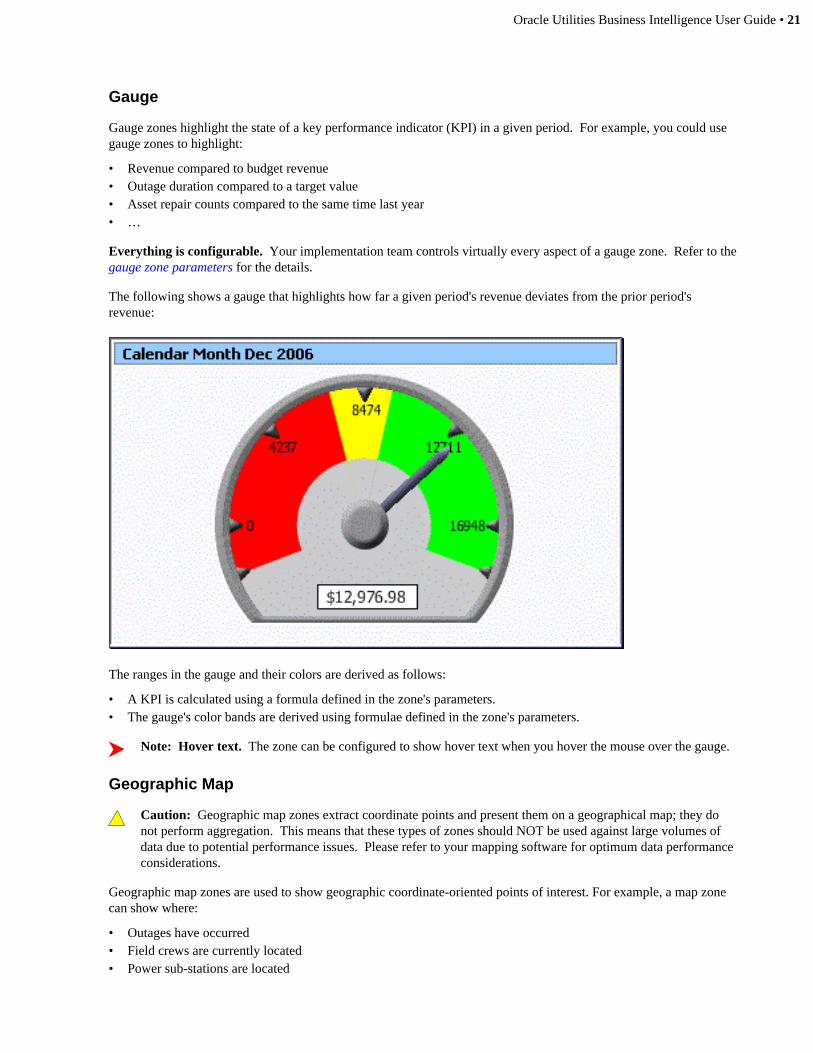
Everything is configurable. Your implementation team controls virtually every aspect of a gauge zone. Refer to thegauge zone parameters for the details.
The following shows a gauge that highlights how far a given period's revenue deviates from the prior period'srevenue:
The ranges in the gauge and their colors are derived as follows:
• A KPI is calculated using a formula defined in the zone's parameters.• The gauge's color bands are derived using formulae defined in the zone's parameters.
Note: Hover text. The zone can be configured to show hover text when you hover the mouse over the gauge.
Geographic Map
Caution: Geographic map zones extract coordinate points and present them on a geographical map; they donot perform aggregation. This means that these types of zones should NOT be used against large volumes ofdata due to potential performance issues. Please refer to your mapping software for optimum data performanceconsiderations.
Geographic map zones are used to show geographic coordinate-oriented points of interest. For example, a map zonecan show where:
• Outages have occurred• Field crews are currently located• Power sub-stations are located
22 • Oracle Utilities Business Intelligence User Guide
• ….
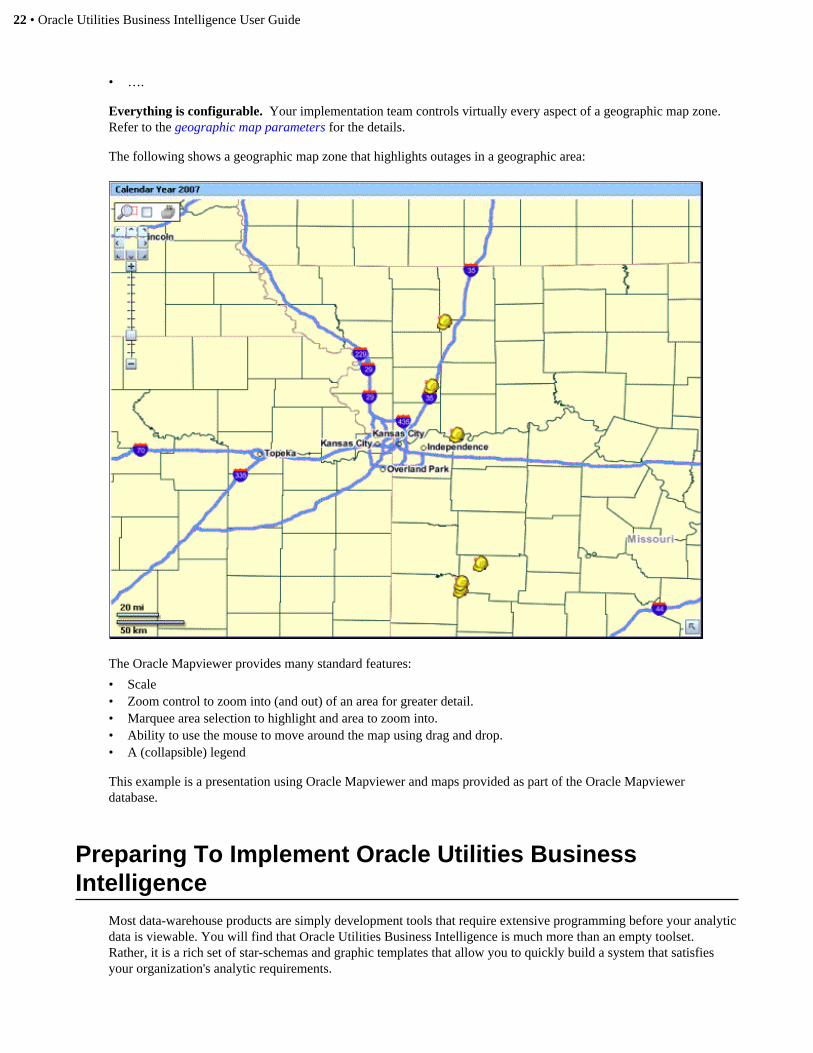
Everything is configurable. Your implementation team controls virtually every aspect of a geographic map zone. Refer to the geographic map parameters for the details.
The following shows a geographic map zone that highlights outages in a geographic area:
The Oracle Mapviewer provides many standard features:
• Scale• Zoom control to zoom into (and out) of an area for greater detail.• Marquee area selection to highlight and area to zoom into.• Ability to use the mouse to move around the map using drag and drop.• A (collapsible) legend
This example is a presentation using Oracle Mapviewer and maps provided as part of the Oracle Mapviewerdatabase.
Preparing To Implement Oracle Utilities BusinessIntelligence
Most data-warehouse products are simply development tools that require extensive programming before your analyticdata is viewable. You will find that Oracle Utilities Business Intelligence is much more than an empty toolset. Rather, it is a rich set of star-schemas and graphic templates that allow you to quickly build a system that satisfiesyour organization's analytic requirements.
Oracle Utilities Business Intelligence User Guide • 23
Before you can configure the application, you must form an intuitive understanding of the system's design principles. To do this, we recommend reading the following chapters:
• Oracle Utilities Business Intelligence Fundamentals. This chapter describes how data-warehousing theory hasbeen implemented in Oracle Utilities Business Intelligence.
• Business Intelligence Portals and Zones. This chapter describes the user interface metaphors used to display youranalytic data.
• Configuring Analytic Zones. This chapter describes how to configure the user interface.• Oracle Warehouse Builder. This chapter describes the extract-transform-load (ETL) methodology used to
populate the data warehouse.• Business Intelligence Configuration Tasks. This chapter takes you through a case study that illustrates how to
configure the system.
When have finished reviewing the above chapters, you will have compiled the meta-data necessary to configure thesystem. After you've added this meta-data, you'll be ready to extract the data from your system and load your data-warehouse with historical data and then view it using your portals and zones.
FMI: For an overview of the application security set up tasks, please refer to The Big Picture of ApplicationSecurity.
Oracle Utilities Business Intelligence FundamentalsThis chapter describes fundamental Oracle Utilities Business Intelligence concepts. After understanding the conceptsin this chapter, refer to Configuration Tasks for a recommended approach to designing and setting up Oracle UtilitiesBusiness Intelligence.
General Data-Warehousing Concepts
There is a great deal of theory and jargon that is unique to the data-warehousing world. Sometimes, just coming togrips with this theory can be overwhelming. The topics in this section summarize this theory and explain how it hasbeen implemented in Oracle Utilities Business Intelligence.
Note: The standard dashboards in the Oracle Utilities Business Intelligence v2.3.1 and later were createdassuming that specific data is stored in various user-defined field (UDF) and user-defined measure (UDM)fields. These assumptions were based on the Demo Database delivered with Oracle Utilities BusinessIntelligence 2.2.x, meaning that if the UDF and UDM populations are based on how the Demo Database isconfigured, then there should be no issues during an upgrade. However, if your implementation is differentfrom this, then changes may have to be made when upgrading.
For example, all of the Answers created for Oracle Utilities Business Intelligence 2.3.1 assume that the AccountClass from CC&B is stored in the UDF1 field in the CD_ACCT dimension. If some other data is stored in thisfield, then the following choices are available:
1. Make no changes to either the data or the answers, in which case all of the answers will show the data andlabel from the UDF1 field on all answers in place of the Customer Class.
2. Modify the extract and migrate the old data to store the Customer Class in the UDF1 field. Then theCustomer Class will be shown on all answers as designed.
3. Assuming that the customer class is stored in some other UDF field, modify all of the answers to use thecurrent UDF field that stores the Customer Class data. If this choice is made, then further changes to theMaterialized Views will also have to be made to use the new UDF field instead of UDF1.
This same analysis will need to be made for all fields that differ from the standard.
24 • Oracle Utilities Business Intelligence User Guide
Data Warehouse
The Oracle Utilities Business Intelligence data-warehouse is a separate database from your operational database(s).This database is organized into a variety of star-schemas that contain data extracted from applications.
The following points describe the main uses of the Oracle Utilities Business Intelligence data-warehouse:• Its data structures are designed to be easily accessible by end-users for their reporting needs.• Large volumes of data can be retrieved quickly. This allows for the fast rendering of the graphics that show key
performance indicators (KPIs).
You can add additional star schemas. Oracle Utilities Business Intelligence has been delivered with star-schemasand graphics suited to data from various Oracle applications. You can use the development tools to add additionalstar-schemas and graphics.
Star Schema
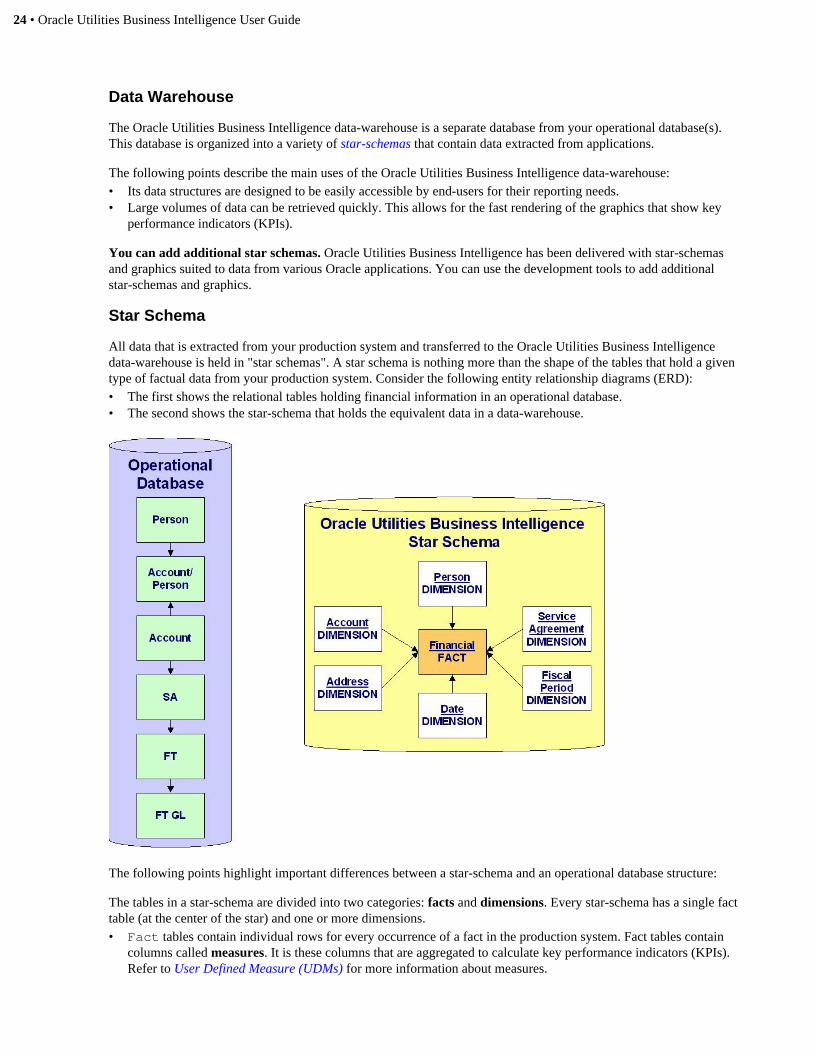
All data that is extracted from your production system and transferred to the Oracle Utilities Business Intelligencedata-warehouse is held in "star schemas". A star schema is nothing more than the shape of the tables that hold a giventype of factual data from your production system. Consider the following entity relationship diagrams (ERD):• The first shows the relational tables holding financial information in an operational database.• The second shows the star-schema that holds the equivalent data in a data-warehouse.
The following points highlight important differences between a star-schema and an operational database structure:
The tables in a star-schema are divided into two categories: facts and dimensions. Every star-schema has a single facttable (at the center of the star) and one or more dimensions.• Fact tables contain individual rows for every occurrence of a fact in the production system. Fact tables contain
columns called measures. It is these columns that are aggregated to calculate key performance indicators (KPIs).Refer to User Defined Measure (UDMs) for more information about measures.
Oracle Utilities Business Intelligence User Guide • 25
• Dimension tables are used to "slice" the facts in different ways. For example, the star schema above wouldallow users to "slice" the financial fact by the attributes on the 6 dimensions linked to it. Refer to User DefinedFields (UDFs) for more information about "slicing" facts using dimensional attributes.
Cube = Star Schema. Some people refer to star-schemas as "data cubes" due to their multi-dimensional nature (butcubes imply there are only 3 dimensions and most star-schemas support many more than 3 dimensions). The pictureabove implies that the Financial fact has 6 dimensions; in reality it has more.
Contrast the operational database's ERD with that of the star-schema. Notice that the operational data structure hasvery "deep" relations (i.e., it has many levels of one-to-many's). Contrast this to the depth of a star-schema. Noticethat a star schema is only one-level deep. This is no accident. Star-schemas are meant to be simple in structure toallow simple access paths.
A separate star-schema is maintained for every "fact" held in a data-warehouse. A fact is a record of an event thatoccurs in your operational system. For example, one fact might exist to record every bill and payment; whereas adifferent fact might exist to record every purchase order.
Use the data dictionary. The data dictionary in the application viewer can be used to view the facts and dimensions.If you toggle the data dictionary to physical name order, you can take advantage of the fact that all fact tables areprefixed with CF , and all dimension tables are prefixed with CD .
Note: Use the table mapping portal. The Table Mapping Portal provides an alternate way to explore thefacts and dimensions. In addition, this portal also documents how each column in the facts and dimensions ispopulated by the ETL processing.
Change Data Capture
When data-warehouse is first set up, all of the relevant data in the production system(s) is loaded into the data-warehouse.
FMI: Refer to Two Modes of Execution for a description of how the extract programs are used to initially loadthe data-warehouse.
After the initial load, only changes in the production system(s) are sent to the data-warehouse. It is the job of thechange-data-capture mechanism to identify the data that has changed. The change data capture architecture used byOracle Utilities Business Intelligence consists of database triggers that populate a Change Log table.

26 • Oracle Utilities Business Intelligence User Guide
Triggers are procedures stored in the production database that are executed when records are added, updated, ordeleted. The Oracle Utilities Business Intelligence triggers insert a row into the Change Log table.
Alternatives to triggers. Other change data capture methods, such as Oracle Streams, can be used with OracleUtilities Business Intelligence. The primary requirement is that the Change Log be populated appropriately when achange occurs.
The Change Log table is an Oracle Utilities Business Intelligence -specific table in the production database that isused to track which objects have been changed. The programs that extract production data to the data-warehouse readthis table to identify the incremental changes that need to be made to the data-warehouse.
FMI: Refer to Capturing Changes In Source Data for all of the details.
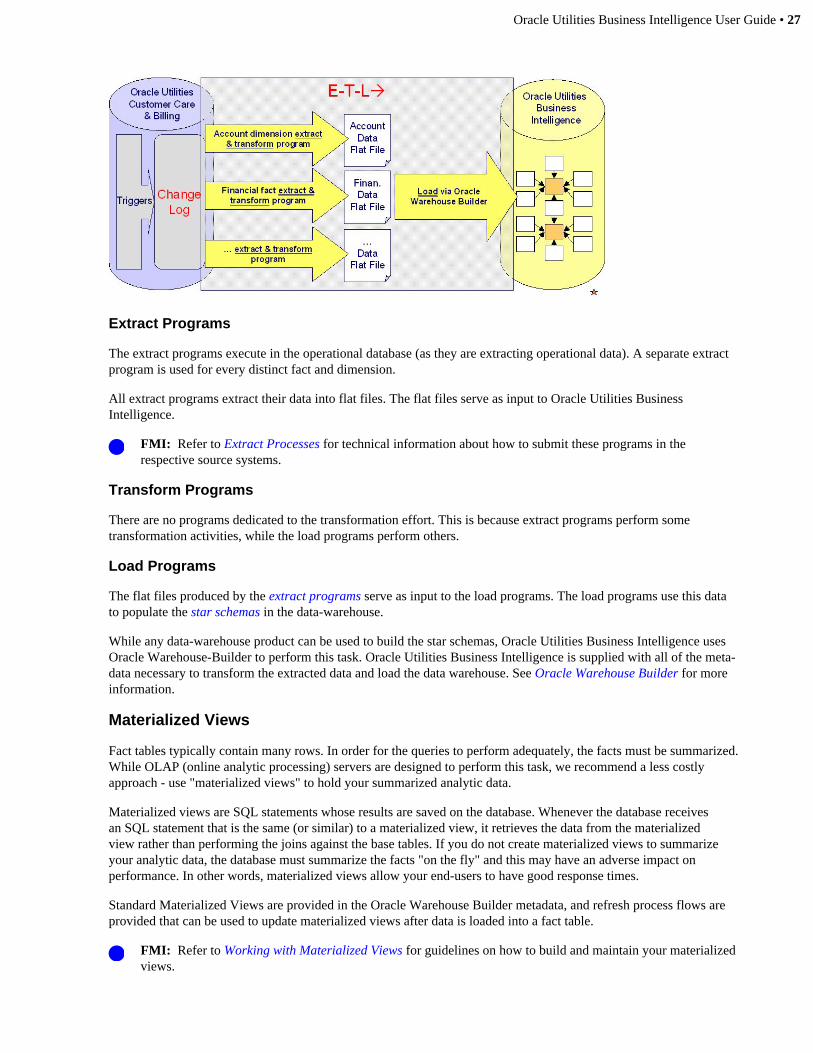
Extract-Transform-Load (ETL)
The star schemas in a data-warehouse are populated via a series of programs that do the following:
• extract data from an operational system source system(s)• transform the data to suit the data warehouse• load the data into the warehouse's star-schemas
Collectively, these programs are referred to by the acronym ETL.
ETL programs are supplied for every fact and dimension in Oracle Utilities Business Intelligence. The followingdiagram provides an overview of these programs and how they are executed:
Oracle Utilities Business Intelligence User Guide • 27
Extract Programs
The extract programs execute in the operational database (as they are extracting operational data). A separate extractprogram is used for every distinct fact and dimension.
All extract programs extract their data into flat files. The flat files serve as input to Oracle Utilities BusinessIntelligence.
FMI: Refer to Extract Processes for technical information about how to submit these programs in therespective source systems.
Transform Programs
There are no programs dedicated to the transformation effort. This is because extract programs perform sometransformation activities, while the load programs perform others.
Load Programs
The flat files produced by the extract programs serve as input to the load programs. The load programs use this datato populate the star schemas in the data-warehouse.
While any data-warehouse product can be used to build the star schemas, Oracle Utilities Business Intelligence usesOracle Warehouse-Builder to perform this task. Oracle Utilities Business Intelligence is supplied with all of the meta-data necessary to transform the extracted data and load the data warehouse. See Oracle Warehouse Builder for moreinformation.
Materialized Views
Fact tables typically contain many rows. In order for the queries to perform adequately, the facts must be summarized.While OLAP (online analytic processing) servers are designed to perform this task, we recommend a less costlyapproach - use "materialized views" to hold your summarized analytic data.
Materialized views are SQL statements whose results are saved on the database. Whenever the database receivesan SQL statement that is the same (or similar) to a materialized view, it retrieves the data from the materializedview rather than performing the joins against the base tables. If you do not create materialized views to summarizeyour analytic data, the database must summarize the facts "on the fly" and this may have an adverse impact onperformance. In other words, materialized views allow your end-users to have good response times.
Standard Materialized Views are provided in the Oracle Warehouse Builder metadata, and refresh process flows areprovided that can be used to update materialized views after data is loaded into a fact table.
FMI: Refer to Working with Materialized Views for guidelines on how to build and maintain your materializedviews.
28 • Oracle Utilities Business Intelligence User Guide
The amount of time it takes to create materialized views is dependent on the number of rows in your facts and thevariety of options in your zones. However, the payback can be large as whenever users need to access this data, thesummarization of large volumes of data is obviated (i.e., response times will be fast). Note, materialized views onlyhave to be generated after the data in the warehouse has changed (i.e., after having ETL'ed new operational data).
Note: If you don't rebuild your materialized views. If you do not rebuild the associated materialized viewsafter loading the data-warehouse with new facts and dimensions, the associated materialized views will become"stale". The database will not use "stale" views and will have no choice but to summarize the facts "on the fly"if a query is received that requires this data (i.e., response times will be slower).
Note: Abort if no materialized view. You can configure all Oracle Utilities Business Intelligence zones toproduce an error (rather than access the individual fact rows) if a materialized view does not exist to satisfythe zone's query. You would turn this option on for zones that can potentially access a large amount of data.This configuration is not possible for the 2.3.x Dashboards, but it is possible to configure Oracle BusinessIntelligence Enterprise Edition to abort long-running queries. Refer to the Oracle Business IntelligenceEnterprise Edition documentation for more information on how to set this up.
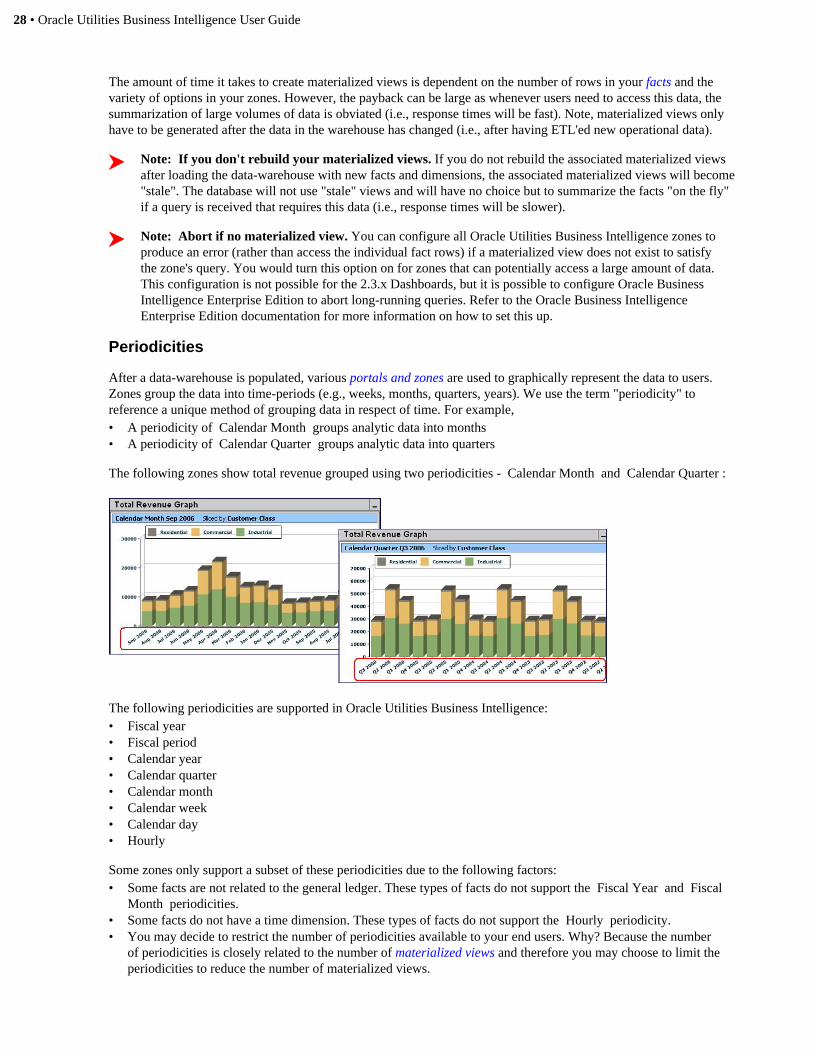
Periodicities
After a data-warehouse is populated, various portals and zones are used to graphically represent the data to users.Zones group the data into time-periods (e.g., weeks, months, quarters, years). We use the term "periodicity" toreference a unique method of grouping data in respect of time. For example,• A periodicity of Calendar Month groups analytic data into months• A periodicity of Calendar Quarter groups analytic data into quarters
The following zones show total revenue grouped using two periodicities - Calendar Month and Calendar Quarter :
The following periodicities are supported in Oracle Utilities Business Intelligence:• Fiscal year• Fiscal period• Calendar year• Calendar quarter• Calendar month• Calendar week• Calendar day• Hourly
Some zones only support a subset of these periodicities due to the following factors:• Some facts are not related to the general ledger. These types of facts do not support the Fiscal Year and Fiscal
Month periodicities.• Some facts do not have a time dimension. These types of facts do not support the Hourly periodicity.• You may decide to restrict the number of periodicities available to your end users. Why? Because the number
of periodicities is closely related to the number of materialized views and therefore you may choose to limit theperiodicities to reduce the number of materialized views.

Oracle Utilities Business Intelligence User Guide • 29
A zone's configuration defines the periodicity used when it's initially displayed. For example, you can configure onezone to initially group information into Fiscal Years , and another zone to group information into Calendar Weeks .
After a zone is presented to a user, the user can change its periodicity (e.g., from quarter to month) by clicking theShow Filters Button and selecting the desired value in the filter area. Remember that the zone's configuration controlsthe periodicities that a user can select.
User Defined Fields (UDFs)
Users look at the facts in the data-warehouse by slicing and filtering the analytic data by different dimensions. Forexample, the following zone shows revenue sliced by customer class (i.e., the financial fact is sliced by the customerclass field on the account dimension):
Whereas the following zone slices the same fact by a different field on a different dimension (i.e., the city on theaddress dimension). In addition, it limits the analysis to a specific customer class - Commercial.
The above examples show how a single zone can be sliced and filtered by different dimensional attributes.
Your users can "slice and filter" a fact using any field on any dimension linked to the analytic's fact. For example,users can slice zones related to the Financial fact by any field on its dimensions.
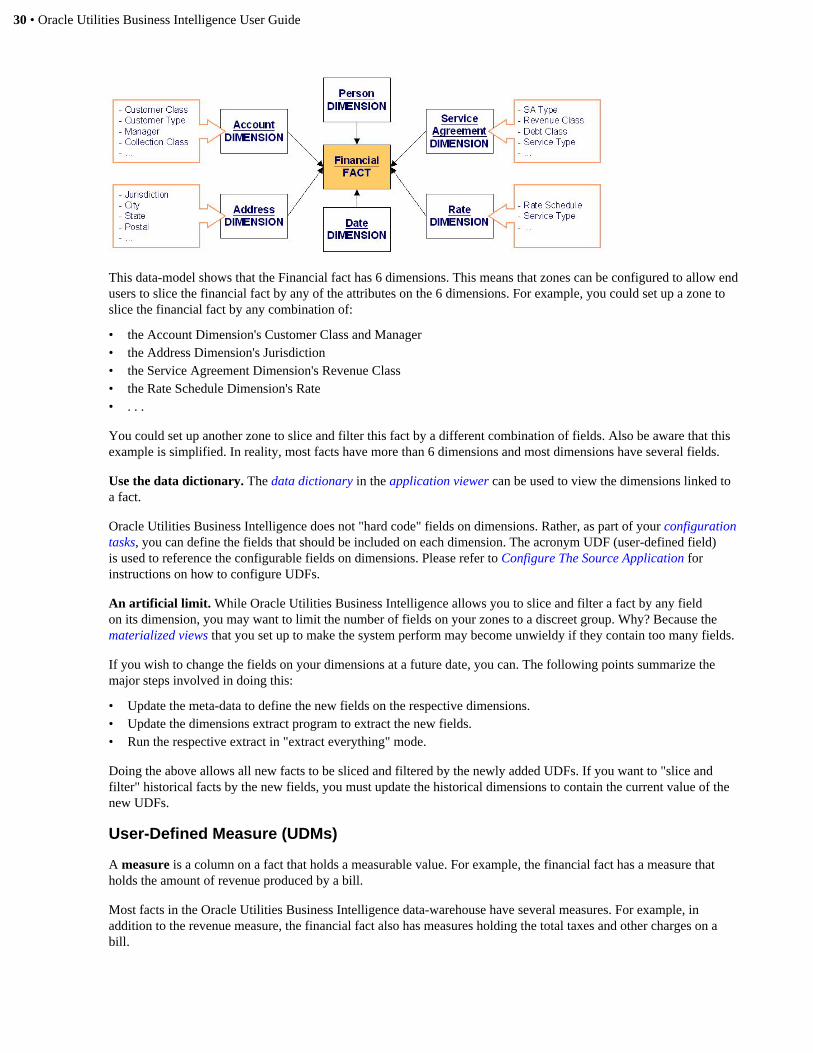
The following simplified data-model of the Financial fact's star schema will help clarify this concept:
30 • Oracle Utilities Business Intelligence User Guide
This data-model shows that the Financial fact has 6 dimensions. This means that zones can be configured to allow endusers to slice the financial fact by any of the attributes on the 6 dimensions. For example, you could set up a zone toslice the financial fact by any combination of:
• the Account Dimension's Customer Class and Manager• the Address Dimension's Jurisdiction• the Service Agreement Dimension's Revenue Class• the Rate Schedule Dimension's Rate• . . .
You could set up another zone to slice and filter this fact by a different combination of fields. Also be aware that thisexample is simplified. In reality, most facts have more than 6 dimensions and most dimensions have several fields.
Use the data dictionary. The data dictionary in the application viewer can be used to view the dimensions linked toa fact.
Oracle Utilities Business Intelligence does not "hard code" fields on dimensions. Rather, as part of your configurationtasks, you can define the fields that should be included on each dimension. The acronym UDF (user-defined field)is used to reference the configurable fields on dimensions. Please refer to Configure The Source Application forinstructions on how to configure UDFs.
An artificial limit. While Oracle Utilities Business Intelligence allows you to slice and filter a fact by any fieldon its dimension, you may want to limit the number of fields on your zones to a discreet group. Why? Because thematerialized views that you set up to make the system perform may become unwieldy if they contain too many fields.
If you wish to change the fields on your dimensions at a future date, you can. The following points summarize themajor steps involved in doing this:
• Update the meta-data to define the new fields on the respective dimensions.• Update the dimensions extract program to extract the new fields.• Run the respective extract in "extract everything" mode.
Doing the above allows all new facts to be sliced and filtered by the newly added UDFs. If you want to "slice andfilter" historical facts by the new fields, you must update the historical dimensions to contain the current value of thenew UDFs.
User-Defined Measure (UDMs)
A measure is a column on a fact that holds a measurable value. For example, the financial fact has a measure thatholds the amount of revenue produced by a bill.
Most facts in the Oracle Utilities Business Intelligence data-warehouse have several measures. For example, inaddition to the revenue measure, the financial fact also has measures holding the total taxes and other charges on abill.
Oracle Utilities Business Intelligence User Guide • 31
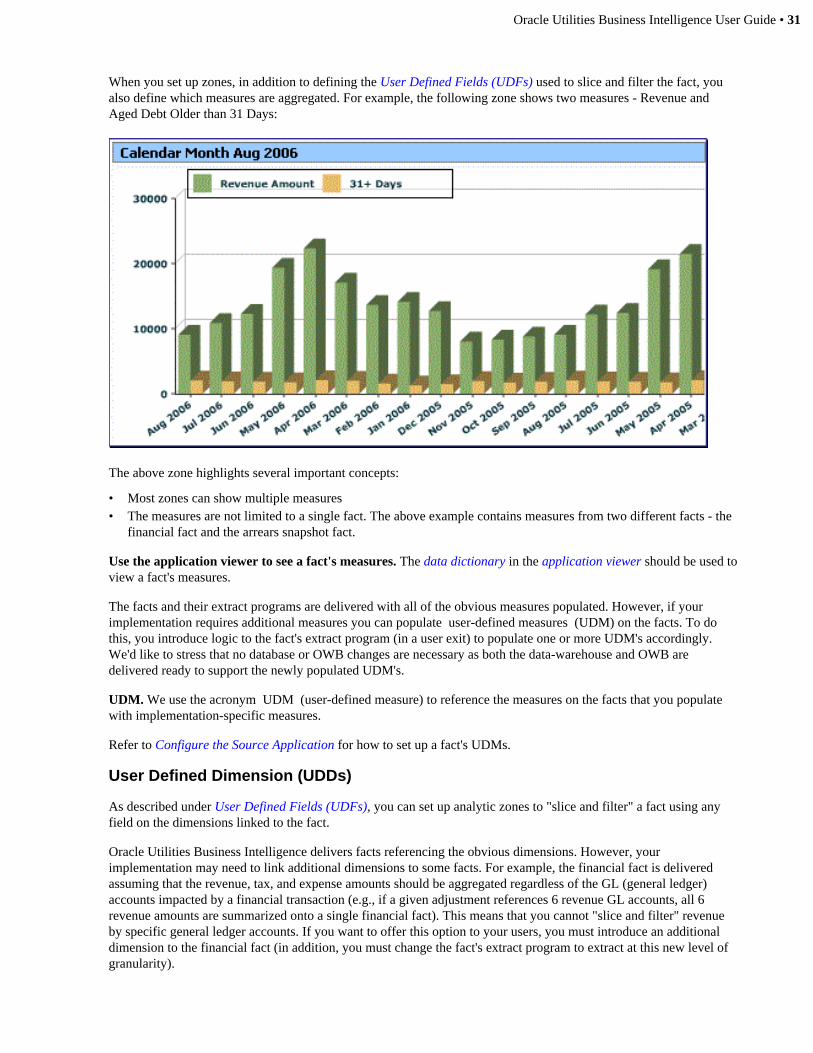
When you set up zones, in addition to defining the User Defined Fields (UDFs) used to slice and filter the fact, youalso define which measures are aggregated. For example, the following zone shows two measures - Revenue andAged Debt Older than 31 Days:
The above zone highlights several important concepts:
• Most zones can show multiple measures• The measures are not limited to a single fact. The above example contains measures from two different facts - the
financial fact and the arrears snapshot fact.
Use the application viewer to see a fact's measures. The data dictionary in the application viewer should be used toview a fact's measures.
The facts and their extract programs are delivered with all of the obvious measures populated. However, if yourimplementation requires additional measures you can populate user-defined measures (UDM) on the facts. To dothis, you introduce logic to the fact's extract program (in a user exit) to populate one or more UDM's accordingly.We'd like to stress that no database or OWB changes are necessary as both the data-warehouse and OWB aredelivered ready to support the newly populated UDM's.
UDM. We use the acronym UDM (user-defined measure) to reference the measures on the facts that you populatewith implementation-specific measures.
Refer to Configure the Source Application for how to set up a fact's UDMs.
User Defined Dimension (UDDs)
As described under User Defined Fields (UDFs), you can set up analytic zones to "slice and filter" a fact using anyfield on the dimensions linked to the fact.
Oracle Utilities Business Intelligence delivers facts referencing the obvious dimensions. However, yourimplementation may need to link additional dimensions to some facts. For example, the financial fact is deliveredassuming that the revenue, tax, and expense amounts should be aggregated regardless of the GL (general ledger)accounts impacted by a financial transaction (e.g., if a given adjustment references 6 revenue GL accounts, all 6revenue amounts are summarized onto a single financial fact). This means that you cannot "slice and filter" revenueby specific general ledger accounts. If you want to offer this option to your users, you must introduce an additionaldimension to the financial fact (in addition, you must change the fact's extract program to extract at this new level ofgranularity).

32 • Oracle Utilities Business Intelligence User Guide
UDD. We use the acronym UDD (user-defined dimension) to reference implementation-specific dimensions on thefact tables. All fact tables are delivered referencing several empty UDD's for you to use.
The following points summarize how to set up a new UDD:
• You must create database trigger(s) to cause new and changed dimensions to be interfaced to the data-warehouse.There are many examples of dimensional triggers in the operational system that can be used as samples for yournew triggers.
• You must create a new program to extract the new dimension's values. This extract will be executed in theoperational system and will produce a flat-file containing the dimension's values. There are many examples ofdimensional extract programs in the operational system that can be used as a basis of your new program.
• The flat-file produced by your extract is the input to Oracle Warehouse Builder. Oracle Warehouse Builder isdelivered preconfigured to load the data-warehouse from the flat-file.
• Run the new extract program in "extract everything" mode and let Oracle Warehouse Builder populate thedimension's rows.
• Return to Oracle Utilities Business Intelligence and display the UDD table. Enter the appropriate Override Labelof each User Defined Fields (UDFs) on the table (these are the dimensional attributes that users use to slice andfilter the dimension's facts). For example, if the dimension is meant to hold GL accounts, it would make sense todefine at least two UDFs:
• The GL account number• The GL account type (e.g., revenue, expense, tax)
• The information on the override label is used in many ways in Oracle Utilities Business Intelligence.• Transfer to the operational system (e.g., Oracle Utilities Customer Care & Billing) and introduce user-exit code
to the extract program to the appropriate UDD values for the fact. Refer to the fact and dimension chapter formore information about the extract programs and their parameters.
• When you extract the facts after this point, the flat-file supplied to Oracle Warehouse Builder will be populatedwith the appropriate references to your UDD(s).
Increasing Granularity
UDDs may or may not increase the granularity of the fact. By increasing granularity, we mean that the number ofrows or records extracted for the fact (i.e., the grains of detail) increases. Adding a UDD that does not change thenumber of rows in a fact does not impact the granularity of the fact.
Granularity Increased
An example showing an increase in granularity would be adding a UDD for distribution code. Prior to adding aUDD for distribution code one bill results in one financial fact record. After adding the UDD one bill results in manyfinancial fact records (one per distribution code referenced on the bill segment). Increasing the number of recordsextracted means increasing the granularity.
When a UDD results in an increase in granularity, the implementation needs to include a change to the base code forthe extract (i.e., develop a new extract by copying the base-package version).
Granularity NOT Increased
An example showing no increase in granularity would be adding a UDD for adjustment type. Since each financialtransaction can only reference one adjustment type, adding this as a UDD would not increase the number of factrecords produced by a financial transaction, and would therefore not increase granularity.
In this case, you only need to develop a new extract to extract the adjustment types, and make a simple change to thefinancial extract to populate a UDD with the adjustment type for the financial transaction.
After you have set up User Defined Dimension (UDDs), User Defined Measure (UDMs), and User Defined Fields(UDFs), you can then set up zones to view this information.
Oracle Utilities Business Intelligence User Guide • 33
User-Defined Degenerate Dimensions (UDDGENs)
Degenerate dimension (UDDGEN) columns reside directly on fact tables and can be used to filter fact data in thesame way that User Defined Fields (UDFs) are. For example, currency code columns are commonly used UDDGENsin Oracle Utilities Business Intelligence. These columns exist on most of the fact tables and can be used to limit factdata shown in zones to a given currency code.
Most fact tables in Oracle Utilities Business Intelligence are delivered with multiple UDDGENs. These columns arepopulated by introducing user-exit code in the respective fact extract programs.
The main benefit of using UDDGENs as opposed to using User Defined Dimension (UDDs) is that UDDGENs can bepopulated in the fact extract program and therefore reduce implementation time.
User-Defined Foreign Key Dimensions (UDDFKs)
Earlier, two techniques to add additional dimensions to a base-package fact were described:
• User Defined Dimension (UDDs) described how you can set up new dimensions.• User Defined Degenerate Dimensions (UDDGENs) described how you can populate a degenerate dimension on a
fact.
However, there may be requirements that can be easily satisfied by adding an existing dimension to a fact. Forexample, the case fact is not delivered referencing the service agreement dimension. If your users require analyticsthat "slice and filter" cases by service agreement dimensional attributes, you can configure the system to reference theexisting service agreement dimension on the case fact.
Facts that support this type of extension contain columns called user defined foreign keys (UDDFKs). If you do notsee these columns on a fact, then this functionality is not available. If you do see these types of fields, refer to AddReferences To Existing Dimensions for detailed instructions.
Installation Options
The topics in this section describe the various installation options that control various aspects of the system that arespecific to the Oracle Utilities Business Intelligence product.
FMI: Refer to Installation Options - Base for a description of common options.
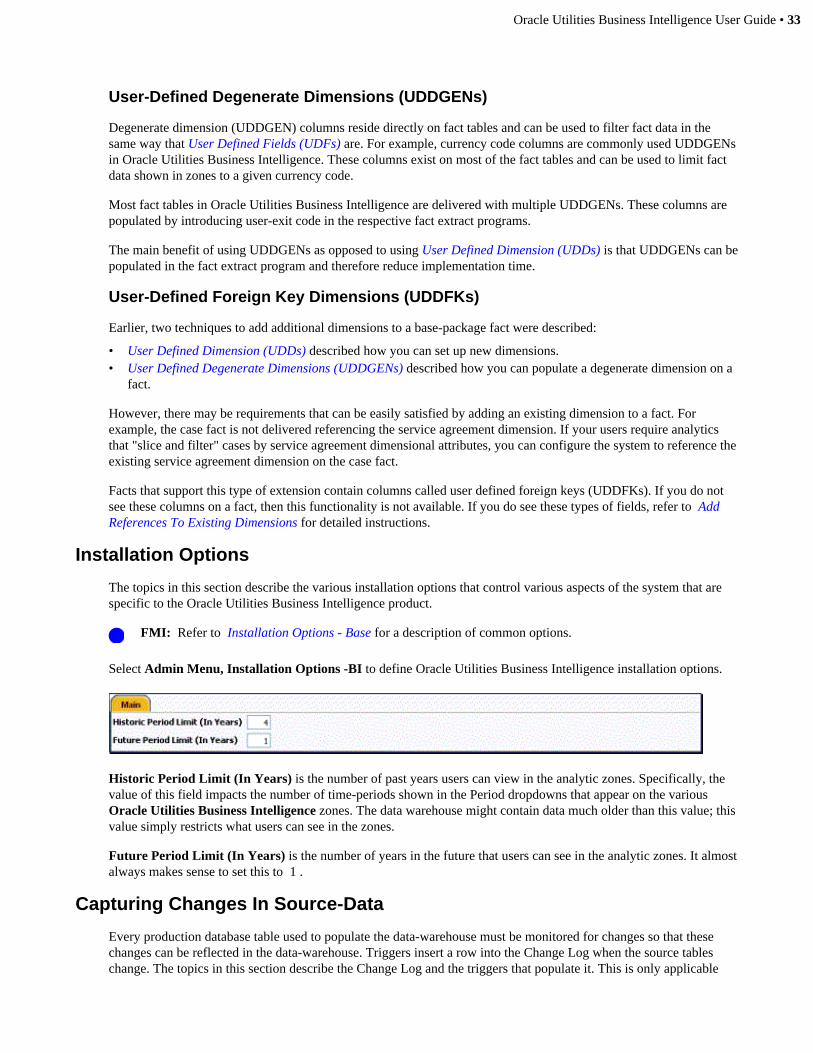
Select Admin Menu, Installation Options -BI to define Oracle Utilities Business Intelligence installation options.
Historic Period Limit (In Years) is the number of past years users can view in the analytic zones. Specifically, thevalue of this field impacts the number of time-periods shown in the Period dropdowns that appear on the variousOracle Utilities Business Intelligence zones. The data warehouse might contain data much older than this value; thisvalue simply restricts what users can see in the zones.
Future Period Limit (In Years) is the number of years in the future that users can see in the analytic zones. It almostalways makes sense to set this to 1 .
Capturing Changes In Source-Data
Every production database table used to populate the data-warehouse must be monitored for changes so that thesechanges can be reflected in the data-warehouse. Triggers insert a row into the Change Log when the source tableschange. The topics in this section describe the Change Log and the triggers that populate it. This is only applicable
34 • Oracle Utilities Business Intelligence User Guide
to Oracle Utilities Customer Care and Billing. Oracle Utilities Network Management System and Oracle UtilitiesWork and Asset Management have built in functionality that identifies changed data, which may not make use of theChange Log table.
You don't have to use triggers.Oracle Utilities Business Intelligence recommends using "triggers" to highlightnew and changed data in your operational system. We recommend this approach because it is easily maintainableby your implementation team. However, there are several other approaches that can be used to identify new andchanged objects (e.g., Oracle streams). If you prefer to use one of these approaches, make sure that you populate theprime-key of the new and changed objects in the change log (or, alternatively, just produce the flat file in the sameformat as is done by Oracle Utilities Business Intelligence's extract programs). As of release version 2.3.2, defaulttriggers are available for Oracle Utilities Customer Care and Billing that support the standard extract procedures andconfiguration.
Fields On The Change Log
Because the sole job of triggers is to populate the Change Log, understanding the fields of the Change Log table isessential to understanding the triggers. The following are the primary fields on the Change Log:
• Change Log ID. This is a random prime key of the Change Log and is generated by the trigger.• Batch Code. This is the code for the extract process that will process this change. For more information on batch
codes, refer to Basic Parameters Supplied To Extract Processes.• Batch Number. This is the current run number for the extract process.• Change Date and Time. The date and time of the change. The system date and time is used.• Change Type. This indicates if a row in the table was inserted, updated, or deleted. This is for information and
auditing purposes only.• Table Name. This is the name of the table that was changed. This is used for information and auditing purposes
only.• Prime Key 1-5. This is the prime key of the object that was affected. The Change Log accommodates prime keys
with up to five parts.
The prime key stored on the Change Log is not the prime key of the record that was changed but the prime key of theobject. For example, if the phone number of a person was changed, these prime key fields would contain the primekey of the person object, not the prime key of the phone number record. When any field on an object is changed, theentire object must be re-extracted.
Typical Structure of Triggers
Since all triggers populate the Change Log, they are similar in that:
• They determine if a row needs to be inserted into the Change Log. Not all table changes need to be reflected in thedata-warehouse, and so, not all changes need to be noted in the Change Log. For example, if an unfrozen financialtransaction is created, a Change Log record does not need to be inserted if the data-warehouse only tracks frozenfinancial transactions.
• They generate a prime key for the Change Log;• They know the code(s) for the appropriate extract process(es) that will handle the table change.• They retrieve the current run number(s) for the extract process(es).• They determine the prime key of the main object.
Rows In the Change Log
A record in the Change Log is processed by only one extract process. If multiple extract processes are neededto handle a single change in a source table (for example, a new object requires the addition of multiple facts ordimensions), then multiple rows must be inserted into Change Log. This can be accomplished with one triggerinserting multiple rows into the Change Log or with multiple triggers on the same table, each trigger inserting onerow.
Oracle Utilities Business Intelligence User Guide • 35
Extract Processes
Every fact and dimension has an extract process. These batch processes extract data from the source system andtransfer it to flat files. Along with each flat file containing the extract data (data file), a single-record control filecontaining the batch information about the extractor program is also generated. The data and the control flat files,in turn, are loaded into the Oracle Utilities Business Intelligence data-warehouse. The topics in this section describeaspects common to these batch processes.
Use the table mapping portal. The Table Mapping Portal documents how each product's facts and dimensions arepopulated are by the ETL processing.
FMI: Refer to Configure The Source Application for a recommended approach describing how to configure theextract programs.
FMI: Refer to ETL Process for a description of how Oracle Warehouse Builder is used to upload the dataproduced by the extract programs.
FMI: Refer to the product-specific Data Mapping Guides for detailed descriptions of the mapping from eachproduct to the Oracle Utilities Business Intelligence data-warehouse tables.
Extracts and Triggers in the Source Application
The installation of Oracle Utilities Business Intelligence also affects the source application (e.g., Oracle UtilitiesCustomer Care & Billing). The source application is impacted in two ways:
• New background processes (i.e., the extract programs) are installed to extract the data from the source application• Triggers are installed on the source application's database
The extract programs identify the recent changes by querying the Change Log table. The Change Log is a very simpletable that contains the prime-key of every object that is added or changed. Database triggers populate the change logwhenever an object is added or a field is changed. The triggers will only create a log record when objects and fieldsthat are transferred to the data-warehouse are modified.
FMI: Refer to Capturing Changes In Source Data for more information on triggers and the Change Log.
FMI: Refer to Configure The Source Application for how to configure the extract programs and the triggers.
Two Modes of Execution
Most extract programs support two modes of execution (you control the mode by a parameter supplied to the extractprocess):
• Extract everything mode. This mode extracts every row on the operational table. You would usethis mode to instantiate the data-warehouse. For example, if you run the extract accounts program in "extracteverything mode", every account will be extracted.
• Extract recent changes mode. This mode only extracts data that was added or changed since the lasttime the extract was executed. For example, if you run the extract accounts program in "extract recent changesmode", every account that was added or changed since the last execution will be extracted.
Basic Parameters Supplied To Extract Processes
All extract processes are submitted in their source system (e.g., programs that extract data from Oracle UtilitiesCustomer Care & Billing are submitted in Oracle Utilities Customer Care & Billing). The following points describethe hard parameters that are supplied to these processes for Oracle Utilities Customer Care and Billing.
• Batch code. Batch code is the unique identifier of the extract process. The batch code for each extract processis identified in the description of the various facts and dimensions. Refer to the appropriate fact and dimensionchapter for the details.
36 • Oracle Utilities Business Intelligence User Guide
• Batch thread number. Thread number is only used for extract processes that can be run in multiple parallelthreads. It contains the relative thread number of the process. For example, if the arrears process has been set upto run in 20 parallel threads, each of the 20 instances receives its relative thread number (1 through 20). Referto Optimal Thread Count for Parallel Background Processes in the background processchapter of the source system for more information.
• Batch thread count. Thread count is only used for extract processes that can be run in multiple parallelthreads. It contains the total number of parallel threads that have been scheduled. For example, if the billingprocess has been set up to run in 20 parallel threads, each of the 20 instances receives a thread count of 20. Referto Optimal Thread Count for Parallel Background Processes in the background processchapter of the source system for more information.
• Batch rerun number. Rerun number should only be supplied if you need to download an historical run(rather than the latest run).
• Batch business date. Business date is only used for extract processes that use the current date in theirprocessing. For example, the Oracle Utilities Customer Care & Billing arrears extracts use the business date toextract arrears as of a given date. If this parameter is left blank, the system date is used. If supplied, this date mustbe in the format YYYY-MM-DD. This parameter is only used to test how processes behave over time.
• Override maximum minutes between cursor re-initiation. This parameter is optional andoverrides each extract process's Standard Cursor Re-Initiation Minutes (each extract process reinitiates cursorsevery 15 minutes You would reduce these values, for example, if you were submitting a job during the day andyou wanted more frequent commits to release held resources (or more frequent cursor initiations). You might wantto increase these values when an extract process is executed at night (or weekends) and you have a lot of memoryavailable on the servers.
The maximum minute between cursor re-initiation parameter is relevant for Oracle implementations only. Mostof the system extract processes contain an outermost loop / cursor. The cursor is opened at the beginning of theprocess and closed at the end. If Oracle detects that the cursor is open for too long, it may incorrectly interpretthis as a problem and will display an error that the snapshot is too old. The processing for the extract processes isdesigned to refresh the cursor based on the minutes between cursor re-initiation in order to prevent this error.
• User ID. Please be aware of the following in respect of user ID:• The user ID is a user who should have access to all application services in the system. This is because some batch
processes call application services to perform maintenance functions (e.g., when an account is updated, the batchprocess may call the account maintenance application service).
• This user ID's display profile controls how dates and currency values are formatted in messages.• Password. Password is not currently used.• Language Code. All language-sensitive data is extracted in this language. In addition, all error messages are
presented in this language.• Trace program at start (Y/N), trace program exit (Y/N), trace SQL (Y/N) and output
trace (Y/N). These switches are only used during QA and benchmarking. If trace program start is set to Y, amessage is displayed whenever a program is started. If trace program at exist is set to Y, a message is displayedwhenever a program is exited. If trace SQL is set to Y, a message is displayed whenever an SQL statement isexecuted. If output trace is set to Y, special messages formatted by the extract process are written.
• The information displayed when the output trace switch is turned on depends on each extract process. It ispossible that an extract process displays no special information for this switch.
• Initial Load Switch. This switch controls whether the extract program is run in extract everything modeor extract recent changes mode.
• File Path and File Name. These parameters define the file path and/or file name for the output file.When supplying a FILE-PATH variable, the directory specified in the FILE-PATH must already exist and mustgrant write access to the Oracle Utilities Business Intelligence administrator account. You may need to verify aproper location with your system administrator. The syntax of the FILE-PATH depends on the platform used foryour Oracle Utilities Business Intelligence application server. Contact your system administrator for verification.For example, if the platform is UNIX, use forward slashes and be sure to put a trailing slash, for example /spltemp/filepath/ .
• Note: The control file is created with the same name as the data file but with a fixed extension of CTL. Forthis reason, do not use CTL as the extension when defining value for FILE-NAME parameter.
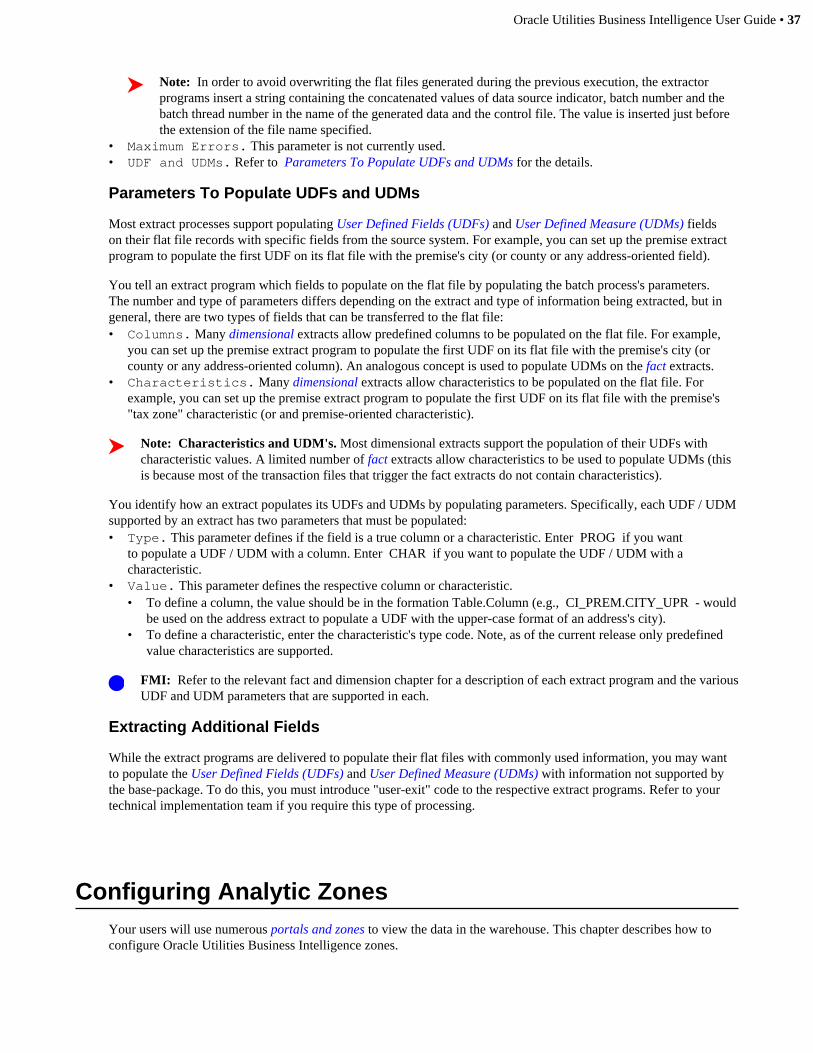
Oracle Utilities Business Intelligence User Guide • 37
Note: In order to avoid overwriting the flat files generated during the previous execution, the extractorprograms insert a string containing the concatenated values of data source indicator, batch number and thebatch thread number in the name of the generated data and the control file. The value is inserted just beforethe extension of the file name specified.
• Maximum Errors. This parameter is not currently used.• UDF and UDMs. Refer to Parameters To Populate UDFs and UDMs for the details.
Parameters To Populate UDFs and UDMs
Most extract processes support populating User Defined Fields (UDFs) and User Defined Measure (UDMs) fieldson their flat file records with specific fields from the source system. For example, you can set up the premise extractprogram to populate the first UDF on its flat file with the premise's city (or county or any address-oriented field).
You tell an extract program which fields to populate on the flat file by populating the batch process's parameters.The number and type of parameters differs depending on the extract and type of information being extracted, but ingeneral, there are two types of fields that can be transferred to the flat file:• Columns. Many dimensional extracts allow predefined columns to be populated on the flat file. For example,
you can set up the premise extract program to populate the first UDF on its flat file with the premise's city (orcounty or any address-oriented column). An analogous concept is used to populate UDMs on the fact extracts.
• Characteristics. Many dimensional extracts allow characteristics to be populated on the flat file. Forexample, you can set up the premise extract program to populate the first UDF on its flat file with the premise's"tax zone" characteristic (or and premise-oriented characteristic).
Note: Characteristics and UDM's. Most dimensional extracts support the population of their UDFs withcharacteristic values. A limited number of fact extracts allow characteristics to be used to populate UDMs (thisis because most of the transaction files that trigger the fact extracts do not contain characteristics).
You identify how an extract populates its UDFs and UDMs by populating parameters. Specifically, each UDF / UDMsupported by an extract has two parameters that must be populated:• Type. This parameter defines if the field is a true column or a characteristic. Enter PROG if you want
to populate a UDF / UDM with a column. Enter CHAR if you want to populate the UDF / UDM with acharacteristic.
• Value. This parameter defines the respective column or characteristic.• To define a column, the value should be in the formation Table.Column (e.g., CI_PREM.CITY_UPR - would
be used on the address extract to populate a UDF with the upper-case format of an address's city).• To define a characteristic, enter the characteristic's type code. Note, as of the current release only predefined
value characteristics are supported.
FMI: Refer to the relevant fact and dimension chapter for a description of each extract program and the variousUDF and UDM parameters that are supported in each.
Extracting Additional Fields
While the extract programs are delivered to populate their flat files with commonly used information, you may wantto populate the User Defined Fields (UDFs) and User Defined Measure (UDMs) with information not supported bythe base-package. To do this, you must introduce "user-exit" code to the respective extract programs. Refer to yourtechnical implementation team if you require this type of processing.
Configuring Analytic ZonesYour users will use numerous portals and zones to view the data in the warehouse. This chapter describes how toconfigure Oracle Utilities Business Intelligence zones.

38 • Oracle Utilities Business Intelligence User Guide
Note: Assumption. This chapter assumes that you are familiar with the zone types that are supplied with thebase package (a unique zone type exists for each graphical metaphor). These zone types are highly configurableand therefore your implementation should not need to develop additional zone types. Rather, you'll configure amultitude of zones that reference the base-package zone types.
Note: Design methodology. Refer to Configuration Tasks for a suggested methodology to design your zones.
Note: The concepts described in this chapter apply only to the user interface used in Oracle Utilities BusinessIntelligence versions 2.0.5 and 2.2.x. If you are using Oracle Utilities Business Intelligence v2.3.0 or later,please refer to the Oracle Utilities Business Intelligence Metric Reference Guides for information about thedashboards and answers provided with the application, and the Oracle Business Intelligence Enterprise Editiondocumentation for information on creating and configuring Oracle Business Intelligence Enterprise Editiondashboards and answers.
Configuration Mode
Oracle Utilities Business Intelligence can be run in a special mode that will facilitate configuring the system. Toenable this mode, enter ?debug=true at the end of the URL that you use to access the system. For example, if thestandard URL was http://sf-pdnt-009:7031/cis.jsp , you'd enter http://sf-pdnt-009:7031/cis.jsp?debug=true to enableconfiguration mode.
The following points describe the features that are enabled in configuration mode:
• Refer to Title Bar for a description of several menu items and icons that only appear in the zone's title bar ifconfiguration mode is enabled.
• In "normal" mode, the system displays the descriptions of dimensional attributes in the Filter Area of yourzones. In configuration mode, the system suffixes the descriptions with the dimensional attribute codes. This hasbeen done to facilitate setting up fixed filters in the zone parameters (fixed filters are defined using dimensionalattribute codes).
Concepts and Techniques
Your users will use numerous portals and zones to view the data in the warehouse. The system's zones are feature-rich. These features are enabled by configuring each zone's parameters accordingly. The topics in this sectiondescribe a variety of concepts and techniques to help you understand these features so you can configure your zonesaccordingly.
Note: Just concepts. This section describes concepts that will help you configure your portals and zones.For a detailed description of the various parameters associated with each zone type, refer to Parameters Usedto Configure Zones. For a detailed description of the various graphical metaphors, refer to Oracle UtilitiesBusiness Intelligence Zone Types.
Time Periods
The topics in this section describe how information from different time-periods can be displayed in zones.
Periodicities
When a zone is built, it aggregates data using a specific unit of time (e.g., days, weeks, months, quarters, years). Forexample, the following chronological graph zones show total revenue grouped using two different units of time - Calendar Month and Calendar Quarter :
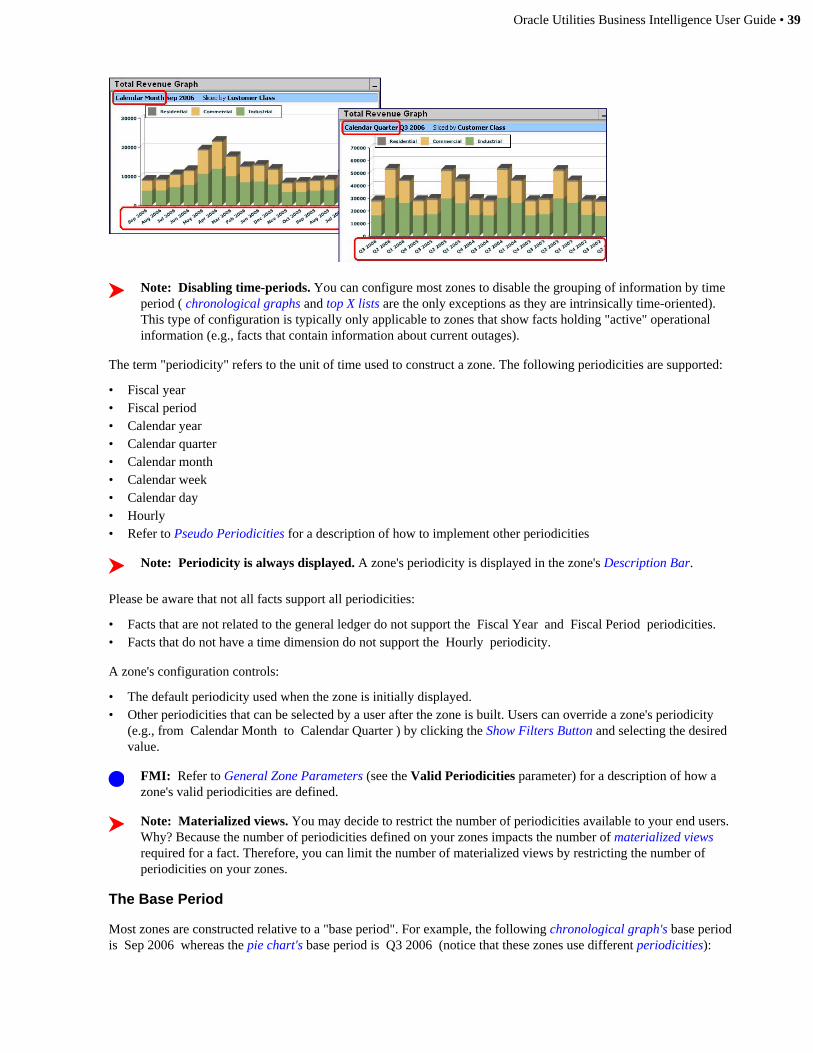
Oracle Utilities Business Intelligence User Guide • 39
Note: Disabling time-periods. You can configure most zones to disable the grouping of information by timeperiod ( chronological graphs and top X lists are the only exceptions as they are intrinsically time-oriented).This type of configuration is typically only applicable to zones that show facts holding "active" operationalinformation (e.g., facts that contain information about current outages).
The term "periodicity" refers to the unit of time used to construct a zone. The following periodicities are supported:
• Fiscal year• Fiscal period• Calendar year• Calendar quarter• Calendar month• Calendar week• Calendar day• Hourly• Refer to Pseudo Periodicities for a description of how to implement other periodicities
Note: Periodicity is always displayed. A zone's periodicity is displayed in the zone's Description Bar.
Please be aware that not all facts support all periodicities:
• Facts that are not related to the general ledger do not support the Fiscal Year and Fiscal Period periodicities.• Facts that do not have a time dimension do not support the Hourly periodicity.
A zone's configuration controls:
• The default periodicity used when the zone is initially displayed.• Other periodicities that can be selected by a user after the zone is built. Users can override a zone's periodicity
(e.g., from Calendar Month to Calendar Quarter ) by clicking the Show Filters Button and selecting the desiredvalue.
FMI: Refer to General Zone Parameters (see the Valid Periodicities parameter) for a description of how azone's valid periodicities are defined.
Note: Materialized views. You may decide to restrict the number of periodicities available to your end users.Why? Because the number of periodicities defined on your zones impacts the number of materialized viewsrequired for a fact. Therefore, you can limit the number of materialized views by restricting the number ofperiodicities on your zones.
The Base Period
Most zones are constructed relative to a "base period". For example, the following chronological graph's base periodis Sep 2006 whereas the pie chart's base period is Q3 2006 (notice that these zones use different periodicities):
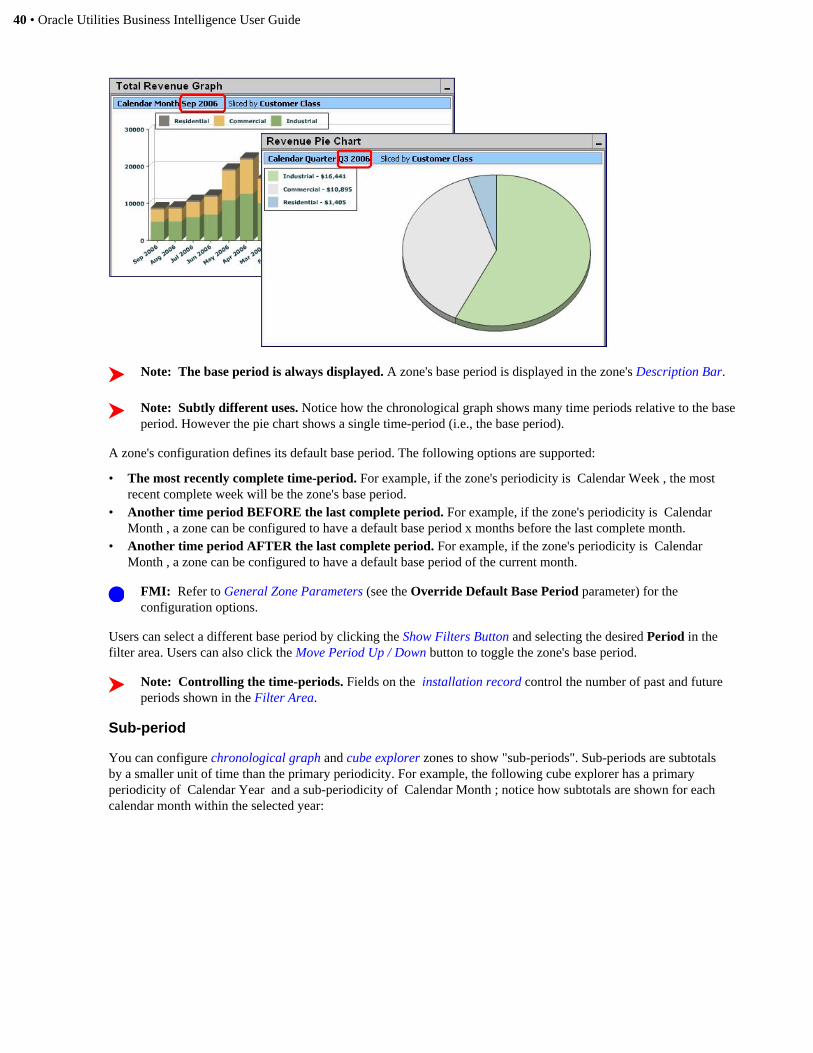
40 • Oracle Utilities Business Intelligence User Guide
Note: The base period is always displayed. A zone's base period is displayed in the zone's Description Bar.
Note: Subtly different uses. Notice how the chronological graph shows many time periods relative to the baseperiod. However the pie chart shows a single time-period (i.e., the base period).
A zone's configuration defines its default base period. The following options are supported:
• The most recently complete time-period. For example, if the zone's periodicity is Calendar Week , the mostrecent complete week will be the zone's base period.
• Another time period BEFORE the last complete period. For example, if the zone's periodicity is CalendarMonth , a zone can be configured to have a default base period x months before the last complete month.
• Another time period AFTER the last complete period. For example, if the zone's periodicity is CalendarMonth , a zone can be configured to have a default base period of the current month.
FMI: Refer to General Zone Parameters (see the Override Default Base Period parameter) for theconfiguration options.
Users can select a different base period by clicking the Show Filters Button and selecting the desired Period in thefilter area. Users can also click the Move Period Up / Down button to toggle the zone's base period.
Note: Controlling the time-periods. Fields on the installation record control the number of past and futureperiods shown in the Filter Area.
Sub-period
You can configure chronological graph and cube explorer zones to show "sub-periods". Sub-periods are subtotalsby a smaller unit of time than the primary periodicity. For example, the following cube explorer has a primaryperiodicity of Calendar Year and a sub-periodicity of Calendar Month ; notice how subtotals are shown for eachcalendar month within the selected year:
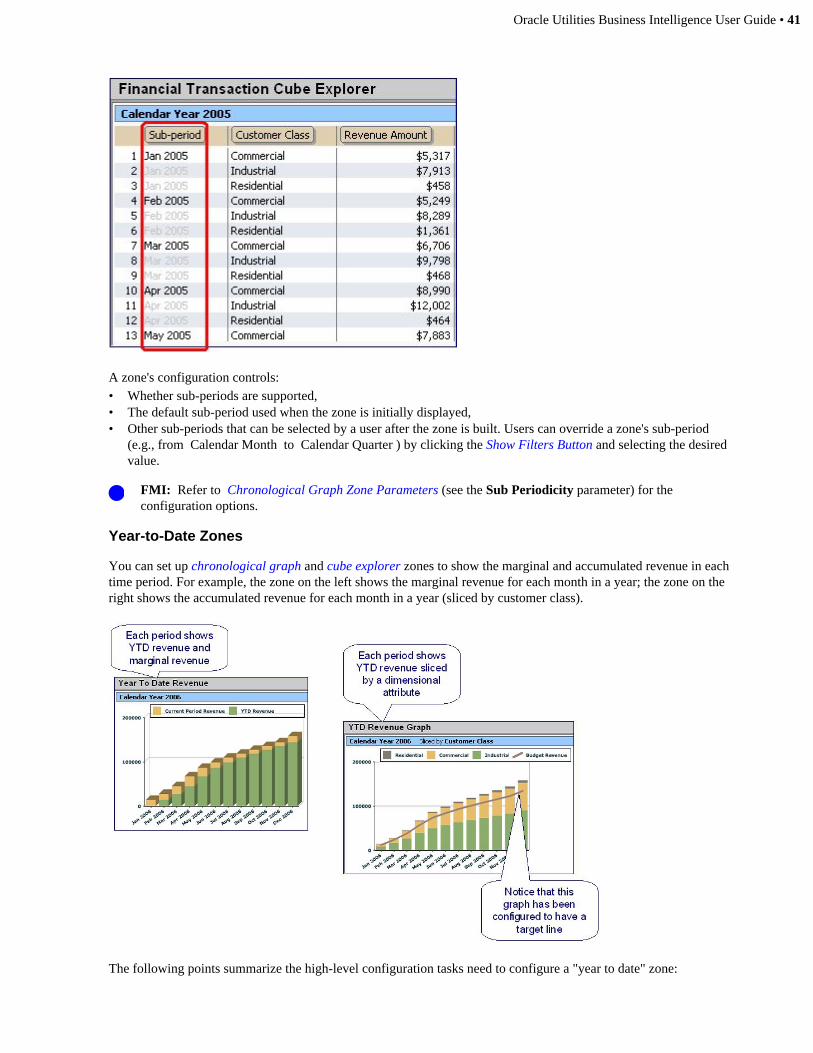
Oracle Utilities Business Intelligence User Guide • 41
A zone's configuration controls:• Whether sub-periods are supported,• The default sub-period used when the zone is initially displayed,• Other sub-periods that can be selected by a user after the zone is built. Users can override a zone's sub-period
(e.g., from Calendar Month to Calendar Quarter ) by clicking the Show Filters Button and selecting the desiredvalue.
FMI: Refer to Chronological Graph Zone Parameters (see the Sub Periodicity parameter) for theconfiguration options.
Year-to-Date Zones
You can set up chronological graph and cube explorer zones to show the marginal and accumulated revenue in eachtime period. For example, the zone on the left shows the marginal revenue for each month in a year; the zone on theright shows the accumulated revenue for each month in a year (sliced by customer class).
The following points summarize the high-level configuration tasks need to configure a "year to date" zone:
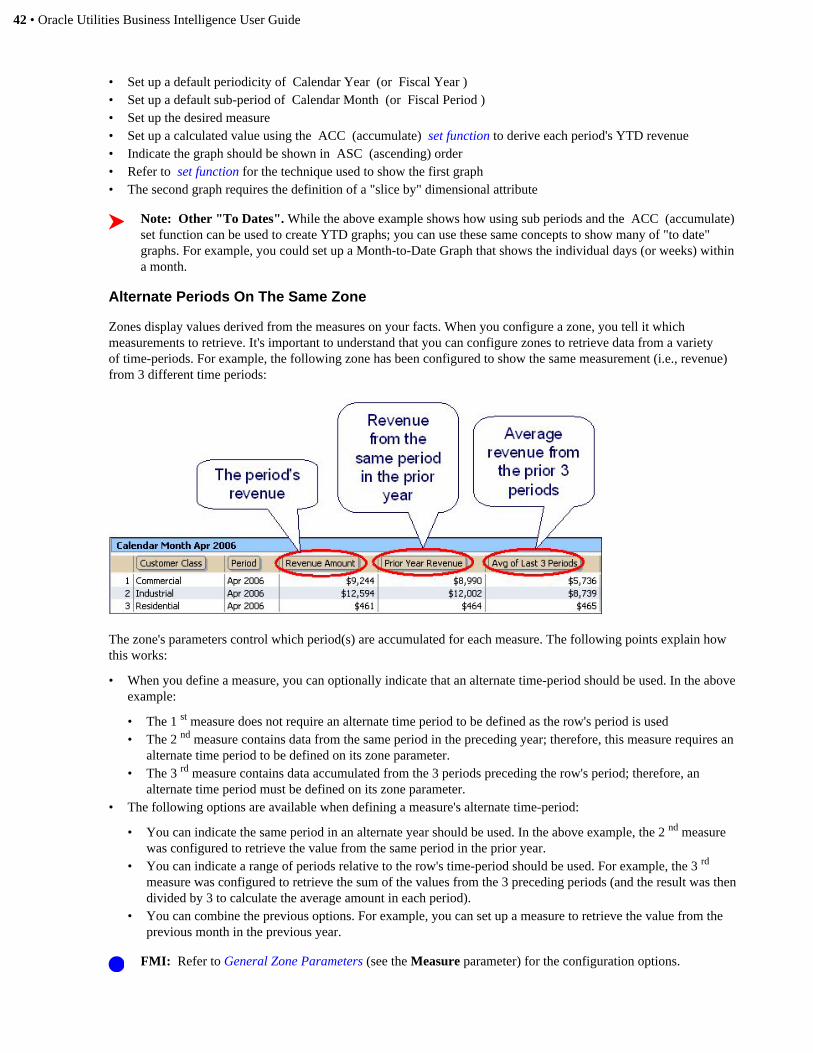
42 • Oracle Utilities Business Intelligence User Guide
• Set up a default periodicity of Calendar Year (or Fiscal Year )• Set up a default sub-period of Calendar Month (or Fiscal Period )• Set up the desired measure• Set up a calculated value using the ACC (accumulate) set function to derive each period's YTD revenue• Indicate the graph should be shown in ASC (ascending) order• Refer to set function for the technique used to show the first graph• The second graph requires the definition of a "slice by" dimensional attribute
Note: Other "To Dates". While the above example shows how using sub periods and the ACC (accumulate)set function can be used to create YTD graphs; you can use these same concepts to show many of "to date"graphs. For example, you could set up a Month-to-Date Graph that shows the individual days (or weeks) withina month.
Alternate Periods On The Same Zone
Zones display values derived from the measures on your facts. When you configure a zone, you tell it whichmeasurements to retrieve. It's important to understand that you can configure zones to retrieve data from a varietyof time-periods. For example, the following zone has been configured to show the same measurement (i.e., revenue)from 3 different time periods:
The zone's parameters control which period(s) are accumulated for each measure. The following points explain howthis works:
• When you define a measure, you can optionally indicate that an alternate time-period should be used. In the aboveexample:
• The 1 st measure does not require an alternate time period to be defined as the row's period is used• The 2 nd measure contains data from the same period in the preceding year; therefore, this measure requires an
alternate time period to be defined on its zone parameter.• The 3 rd measure contains data accumulated from the 3 periods preceding the row's period; therefore, an
alternate time period must be defined on its zone parameter.• The following options are available when defining a measure's alternate time-period:
• You can indicate the same period in an alternate year should be used. In the above example, the 2 nd measurewas configured to retrieve the value from the same period in the prior year.
• You can indicate a range of periods relative to the row's time-period should be used. For example, the 3 rd
measure was configured to retrieve the sum of the values from the 3 preceding periods (and the result was thendivided by 3 to calculate the average amount in each period).
• You can combine the previous options. For example, you can set up a measure to retrieve the value from theprevious month in the previous year.
FMI: Refer to General Zone Parameters (see the Measure parameter) for the configuration options.
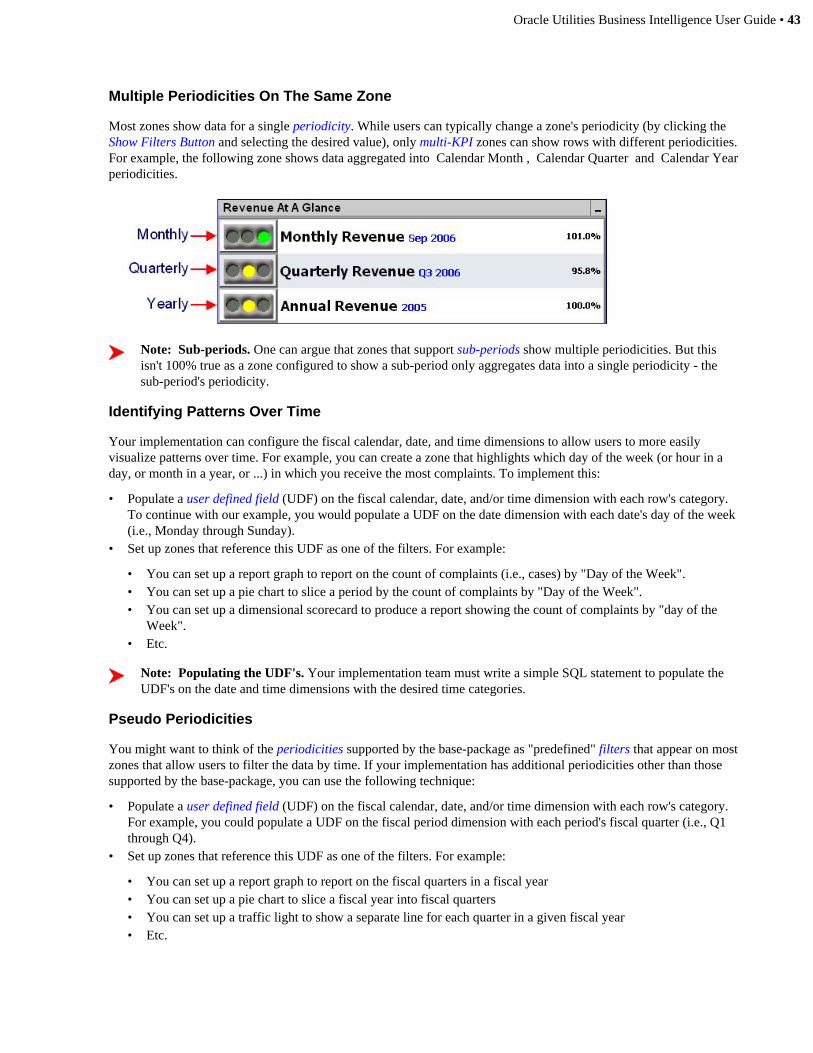
Oracle Utilities Business Intelligence User Guide • 43
Multiple Periodicities On The Same Zone
Most zones show data for a single periodicity. While users can typically change a zone's periodicity (by clicking theShow Filters Button and selecting the desired value), only multi-KPI zones can show rows with different periodicities.For example, the following zone shows data aggregated into Calendar Month , Calendar Quarter and Calendar Yearperiodicities.
Note: Sub-periods. One can argue that zones that support sub-periods show multiple periodicities. But thisisn't 100% true as a zone configured to show a sub-period only aggregates data into a single periodicity - thesub-period's periodicity.
Identifying Patterns Over Time
Your implementation can configure the fiscal calendar, date, and time dimensions to allow users to more easilyvisualize patterns over time. For example, you can create a zone that highlights which day of the week (or hour in aday, or month in a year, or ...) in which you receive the most complaints. To implement this:
• Populate a user defined field (UDF) on the fiscal calendar, date, and/or time dimension with each row's category.To continue with our example, you would populate a UDF on the date dimension with each date's day of the week(i.e., Monday through Sunday).
• Set up zones that reference this UDF as one of the filters. For example:
• You can set up a report graph to report on the count of complaints (i.e., cases) by "Day of the Week".• You can set up a pie chart to slice a period by the count of complaints by "Day of the Week".• You can set up a dimensional scorecard to produce a report showing the count of complaints by "day of the
Week".• Etc.
Note: Populating the UDF's. Your implementation team must write a simple SQL statement to populate theUDF's on the date and time dimensions with the desired time categories.
Pseudo Periodicities
You might want to think of the periodicities supported by the base-package as "predefined" filters that appear on mostzones that allow users to filter the data by time. If your implementation has additional periodicities other than thosesupported by the base-package, you can use the following technique:
• Populate a user defined field (UDF) on the fiscal calendar, date, and/or time dimension with each row's category.For example, you could populate a UDF on the fiscal period dimension with each period's fiscal quarter (i.e., Q1through Q4).
• Set up zones that reference this UDF as one of the filters. For example:
• You can set up a report graph to report on the fiscal quarters in a fiscal year• You can set up a pie chart to slice a fiscal year into fiscal quarters• You can set up a traffic light to show a separate line for each quarter in a given fiscal year• Etc.
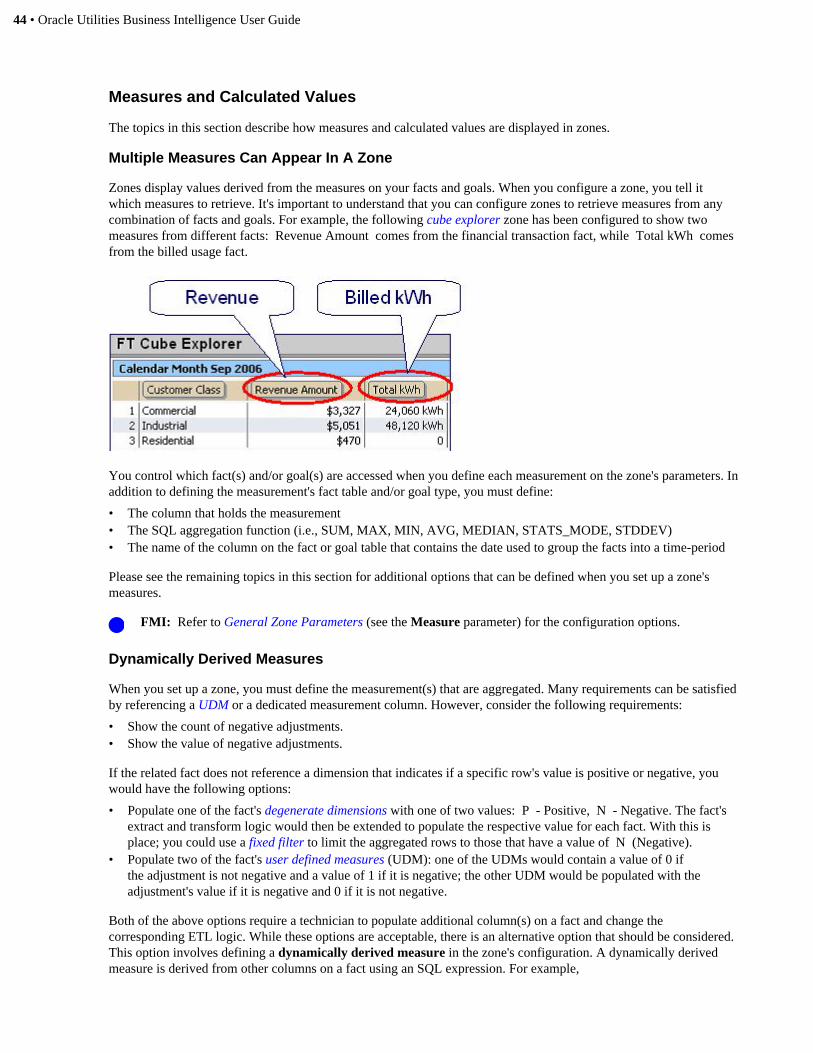
44 • Oracle Utilities Business Intelligence User Guide
Measures and Calculated Values
The topics in this section describe how measures and calculated values are displayed in zones.
Multiple Measures Can Appear In A Zone
Zones display values derived from the measures on your facts and goals. When you configure a zone, you tell itwhich measures to retrieve. It's important to understand that you can configure zones to retrieve measures from anycombination of facts and goals. For example, the following cube explorer zone has been configured to show twomeasures from different facts: Revenue Amount comes from the financial transaction fact, while Total kWh comesfrom the billed usage fact.
You control which fact(s) and/or goal(s) are accessed when you define each measurement on the zone's parameters. Inaddition to defining the measurement's fact table and/or goal type, you must define:
• The column that holds the measurement• The SQL aggregation function (i.e., SUM, MAX, MIN, AVG, MEDIAN, STATS_MODE, STDDEV)• The name of the column on the fact or goal table that contains the date used to group the facts into a time-period
Please see the remaining topics in this section for additional options that can be defined when you set up a zone'smeasures.
FMI: Refer to General Zone Parameters (see the Measure parameter) for the configuration options.
Dynamically Derived Measures
When you set up a zone, you must define the measurement(s) that are aggregated. Many requirements can be satisfiedby referencing a UDM or a dedicated measurement column. However, consider the following requirements:
• Show the count of negative adjustments.• Show the value of negative adjustments.
If the related fact does not reference a dimension that indicates if a specific row's value is positive or negative, youwould have the following options:
• Populate one of the fact's degenerate dimensions with one of two values: P - Positive, N - Negative. The fact'sextract and transform logic would then be extended to populate the respective value for each fact. With this isplace; you could use a fixed filter to limit the aggregated rows to those that have a value of N (Negative).
• Populate two of the fact's user defined measures (UDM): one of the UDMs would contain a value of 0 ifthe adjustment is not negative and a value of 1 if it is negative; the other UDM would be populated with theadjustment's value if it is negative and 0 if it is not negative.
Both of the above options require a technician to populate additional column(s) on a fact and change thecorresponding ETL logic. While these options are acceptable, there is an alternative option that should be considered.This option involves defining a dynamically derived measure in the zone's configuration. A dynamically derivedmeasure is derived from other columns on a fact using an SQL expression. For example,
Oracle Utilities Business Intelligence User Guide • 45
• To dynamically derive the count of negative adjustments, the following SQL expression would be defined in themeasurement's parameter value:
decode(abs(z),z,0,1) where z would reference the measure holding the value of the adjustment
The above expression dynamically computes a value of 1 if the value of z does not equal its absolute value and thisonly happens if z is a negative number.
• To dynamically derive the value of negative adjustments, the following SQL expression would be defined in themeasurement's parameter value:
decode(abs(z),z,0,z) where z would reference the measure holding the value of the adjustment
The above expression returns a value of z if the value of z does not equal its absolute value and this only happens if zis a negative number.
The above examples are straightforward. Let's consider a more complicated requirement. Assume a zone should showthe count of To Do entries classified into the following age buckets: < 10 days old, 10 - 30 days old, > 30 days old. Toimplement this, set up 3 dynamically derived measures on such a zone as follows:
• decode (floor ( (SYSDATE - z) /10) 0,1,0) where z would reference the date/time column on the fact that holdsits create date
The above expression returns a value of 1 when z is less than 10 days old.
• decode (floor ( (SYSDATE - z - 10) /21),0,1,0)
The above expression returns a value of 1 when z is between 10 and 30 days old.
• decode (floor ( (SYSDATE - z ) /31),0,0,1)
The above expression returns a value of 1 when z is more than 30 days old.
The major benefit of using a dynamically derived measure is that a technician does not have to change the starschemas or the corresponding transform and load logic. In other words, the implementation team simply configuresthe zone rather than changes the data warehouse and corresponding ETL logic.
While powerful, this technique must be used wisely. This is because not all SQL expressions can have theirresults held in a materialized view. If you use a decode function that contains a SQL expression that cannot bematerialized and the underlying fact table has many rows, the system will retrieve every row from the fact each timethe zone is displayed and this will result in poor response times. The following is a list of keywords that cannot bematerialized and therefore these should only be used on low volume facts: UID, USER, ROWNUM, SYSDATE,CURRENT_TIMESTAMP, MAXVALUE, CURRVAL, NEXTVAL.
The previous paragraph means that the negative adjustment requirements can be satisfied using a decode SQLexpression as the absolute value expression can be materialized. But the date range requirement can only be satisfiedusing the decode function if the fact contains a limited number of rows.
FMI: Refer to General Zone Parameters (see the Measure parameter) for the configuration options.
Formatting Values For Display
In addition to telling the zone how to retrieve measures from the data warehouse, you can optionally define how theresultant values appear in the zone. We'll use the following simple zone to explain:

46 • Oracle Utilities Business Intelligence User Guide
By default, numeric values are formatted using the user's display profile with no decimal places. When you set up ameasure in the zone's configuration, you can override the default format as follows:
• You can indicate the formatting defined on a specific currency code should be applied. The Revenue Amount shown above uses this option.
• You can override the number of decimal places and define if rounding or truncation should be performed. The Total kWh shown above uses this option. Note, overriding the decimal places for display purposes will not impactsubsequent calculations using the value (i.e., all decimal places on the database will be used).
• You can prefix and / or suffix the measure with a special character. The Total kWh shown above uses this option.• You can override the measure's label. The Total kWh column heading was defined using an override label (as
this is not the label defined on Table - Field for the measure).
FMI: Refer to General Zone Parameters (see the Measure parameter) for the configuration options.
Calculated Values
Many values in your zones are simply accumulations of measures held on your facts and goals. For example, the Revenue Amount and Total kWh columns below are measure accumulations. However, you may need to showother values that are derived because there is no related measure. For example, the Revenue per kWh column mustbe calculated as there is no measure that holds this value:
When you set up a calculated value for a zone, you define its formula and how it should be formatted for display. Thesystem's formula syntax allows you to reference any of the zone's measures and it supports a wide variety of algebraicand trigonometric operators. The formula syntax also allows you to reference other calculated values.
Note: Display format. You define how each calculated value is displayed on the zone using the sametechniques described above under Formatting Values For Display.
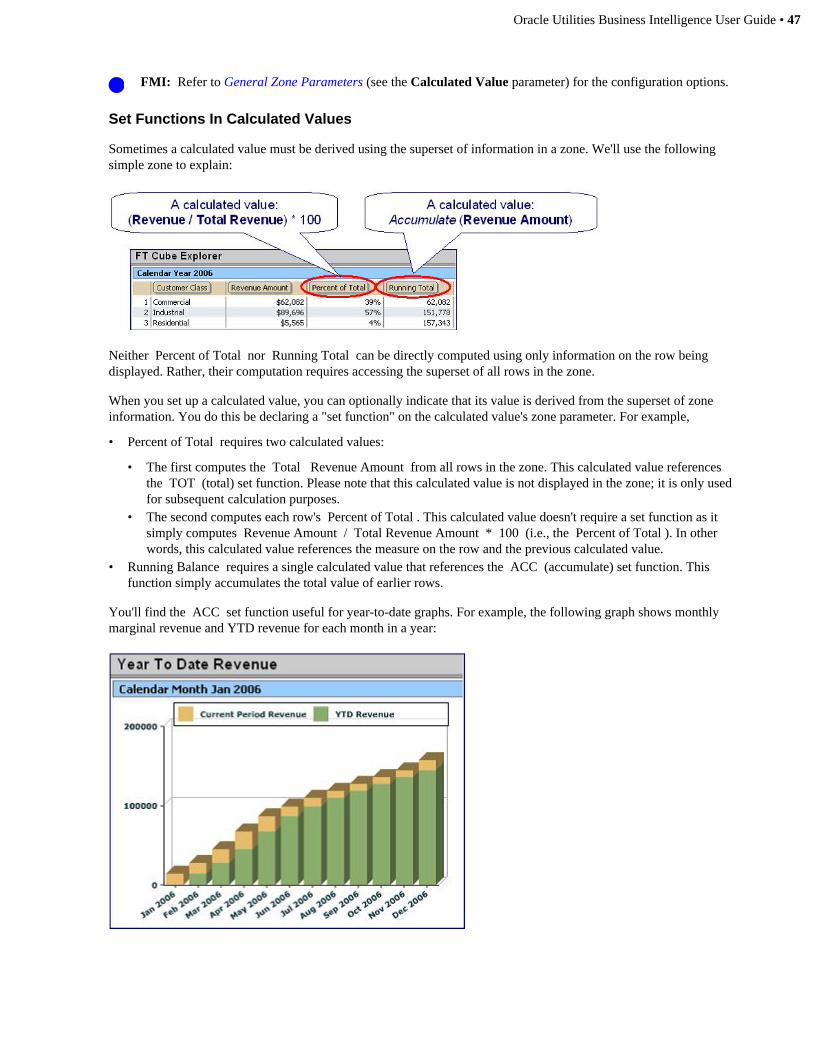
Oracle Utilities Business Intelligence User Guide • 47
FMI: Refer to General Zone Parameters (see the Calculated Value parameter) for the configuration options.
Set Functions In Calculated Values
Sometimes a calculated value must be derived using the superset of information in a zone. We'll use the followingsimple zone to explain:
Neither Percent of Total nor Running Total can be directly computed using only information on the row beingdisplayed. Rather, their computation requires accessing the superset of all rows in the zone.
When you set up a calculated value, you can optionally indicate that its value is derived from the superset of zoneinformation. You do this be declaring a "set function" on the calculated value's zone parameter. For example,
• Percent of Total requires two calculated values:
• The first computes the Total Revenue Amount from all rows in the zone. This calculated value referencesthe TOT (total) set function. Please note that this calculated value is not displayed in the zone; it is only usedfor subsequent calculation purposes.
• The second computes each row's Percent of Total . This calculated value doesn't require a set function as itsimply computes Revenue Amount / Total Revenue Amount * 100 (i.e., the Percent of Total ). In otherwords, this calculated value references the measure on the row and the previous calculated value.
• Running Balance requires a single calculated value that references the ACC (accumulate) set function. Thisfunction simply accumulates the total value of earlier rows.
You'll find the ACC set function useful for year-to-date graphs. For example, the following graph shows monthlymarginal revenue and YTD revenue for each month in a year:
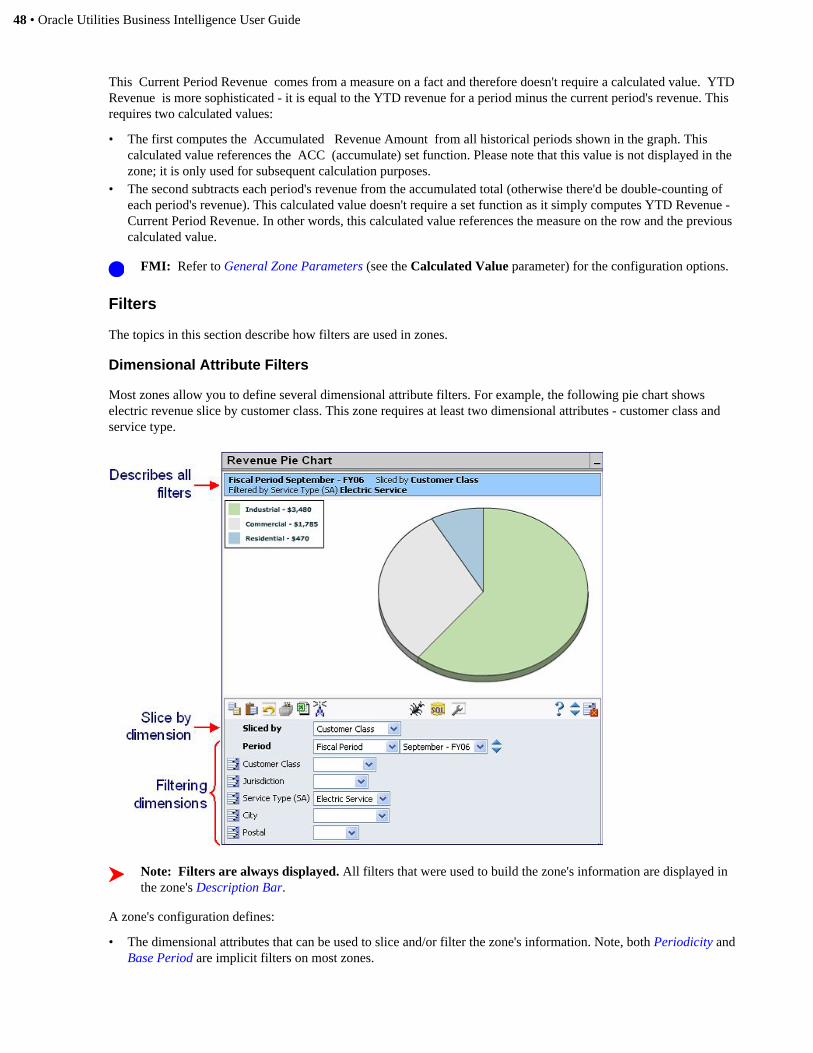
48 • Oracle Utilities Business Intelligence User Guide
This Current Period Revenue comes from a measure on a fact and therefore doesn't require a calculated value. YTDRevenue is more sophisticated - it is equal to the YTD revenue for a period minus the current period's revenue. Thisrequires two calculated values:
• The first computes the Accumulated Revenue Amount from all historical periods shown in the graph. Thiscalculated value references the ACC (accumulate) set function. Please note that this value is not displayed in thezone; it is only used for subsequent calculation purposes.
• The second subtracts each period's revenue from the accumulated total (otherwise there'd be double-counting ofeach period's revenue). This calculated value doesn't require a set function as it simply computes YTD Revenue -Current Period Revenue. In other words, this calculated value references the measure on the row and the previouscalculated value.
FMI: Refer to General Zone Parameters (see the Calculated Value parameter) for the configuration options.
Filters
The topics in this section describe how filters are used in zones.
Dimensional Attribute Filters
Most zones allow you to define several dimensional attribute filters. For example, the following pie chart showselectric revenue slice by customer class. This zone requires at least two dimensional attributes - customer class andservice type.
Note: Filters are always displayed. All filters that were used to build the zone's information are displayed inthe zone's Description Bar.
A zone's configuration defines:
• The dimensional attributes that can be used to slice and/or filter the zone's information. Note, both Periodicity andBase Period are implicit filters on most zones.
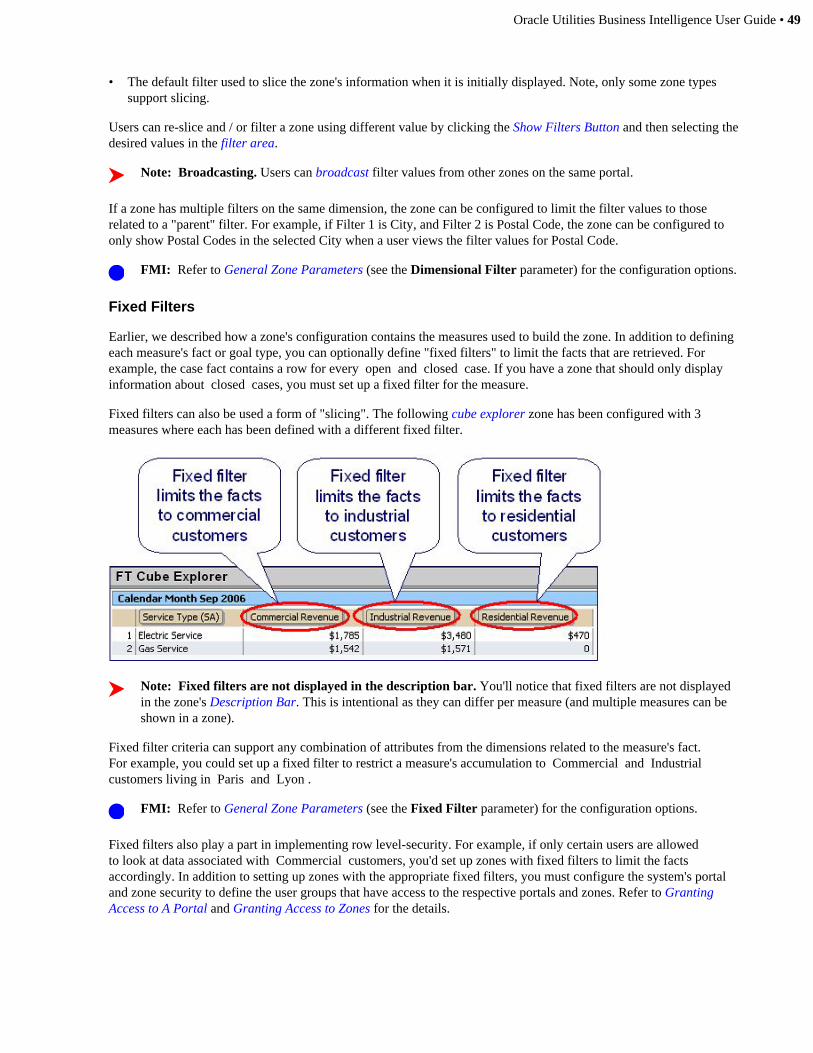
Oracle Utilities Business Intelligence User Guide • 49
• The default filter used to slice the zone's information when it is initially displayed. Note, only some zone typessupport slicing.
Users can re-slice and / or filter a zone using different value by clicking the Show Filters Button and then selecting thedesired values in the filter area.
Note: Broadcasting. Users can broadcast filter values from other zones on the same portal.
If a zone has multiple filters on the same dimension, the zone can be configured to limit the filter values to thoserelated to a "parent" filter. For example, if Filter 1 is City, and Filter 2 is Postal Code, the zone can be configured toonly show Postal Codes in the selected City when a user views the filter values for Postal Code.
FMI: Refer to General Zone Parameters (see the Dimensional Filter parameter) for the configuration options.
Fixed Filters
Earlier, we described how a zone's configuration contains the measures used to build the zone. In addition to definingeach measure's fact or goal type, you can optionally define "fixed filters" to limit the facts that are retrieved. Forexample, the case fact contains a row for every open and closed case. If you have a zone that should only displayinformation about closed cases, you must set up a fixed filter for the measure.
Fixed filters can also be used a form of "slicing". The following cube explorer zone has been configured with 3measures where each has been defined with a different fixed filter.
Note: Fixed filters are not displayed in the description bar. You'll notice that fixed filters are not displayedin the zone's Description Bar. This is intentional as they can differ per measure (and multiple measures can beshown in a zone).
Fixed filter criteria can support any combination of attributes from the dimensions related to the measure's fact.For example, you could set up a fixed filter to restrict a measure's accumulation to Commercial and Industrial customers living in Paris and Lyon .
FMI: Refer to General Zone Parameters (see the Fixed Filter parameter) for the configuration options.
Fixed filters also play a part in implementing row level-security. For example, if only certain users are allowedto look at data associated with Commercial customers, you'd set up zones with fixed filters to limit the factsaccordingly. In addition to setting up zones with the appropriate fixed filters, you must configure the system's portaland zone security to define the user groups that have access to the respective portals and zones. Refer to GrantingAccess to A Portal and Granting Access to Zones for the details.
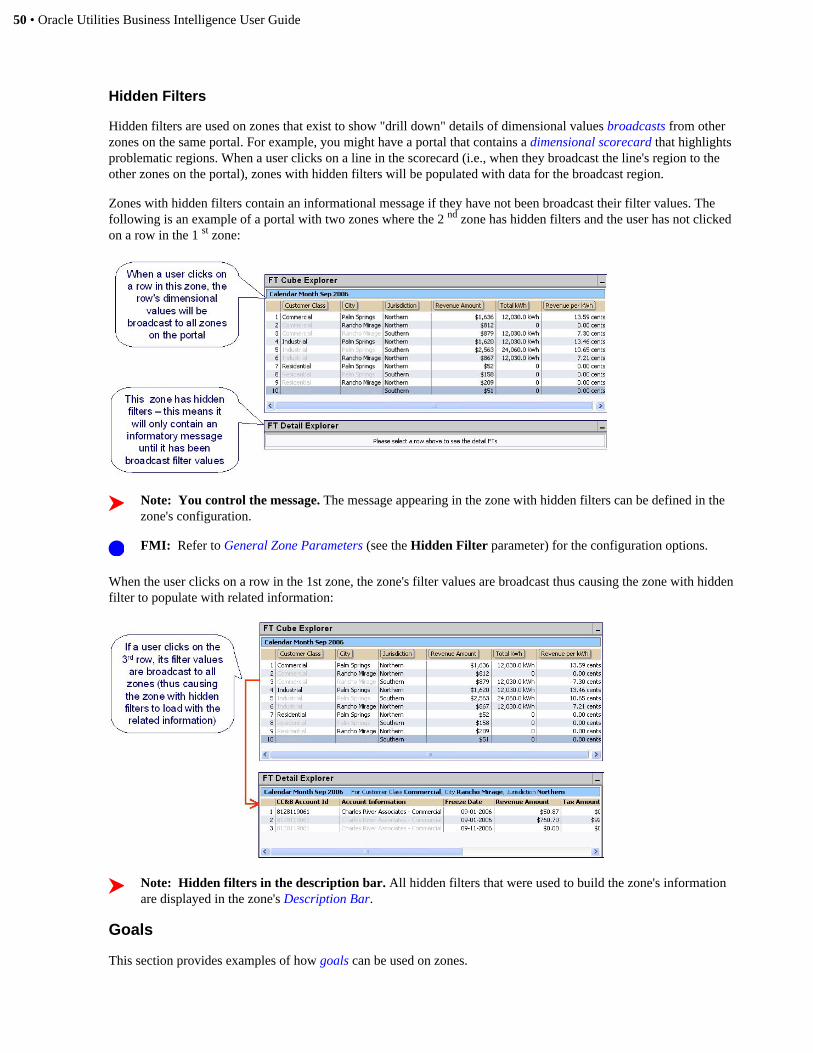
50 • Oracle Utilities Business Intelligence User Guide
Hidden Filters
Hidden filters are used on zones that exist to show "drill down" details of dimensional values broadcasts from otherzones on the same portal. For example, you might have a portal that contains a dimensional scorecard that highlightsproblematic regions. When a user clicks on a line in the scorecard (i.e., when they broadcast the line's region to theother zones on the portal), zones with hidden filters will be populated with data for the broadcast region.
Zones with hidden filters contain an informational message if they have not been broadcast their filter values. Thefollowing is an example of a portal with two zones where the 2 nd zone has hidden filters and the user has not clickedon a row in the 1 st zone:
Note: You control the message. The message appearing in the zone with hidden filters can be defined in thezone's configuration.
FMI: Refer to General Zone Parameters (see the Hidden Filter parameter) for the configuration options.
When the user clicks on a row in the 1st zone, the zone's filter values are broadcast thus causing the zone with hiddenfilter to populate with related information:
Note: Hidden filters in the description bar. All hidden filters that were used to build the zone's informationare displayed in the zone's Description Bar.
Goals
This section provides examples of how goals can be used on zones.

Oracle Utilities Business Intelligence User Guide • 51
Using Goals To Highlight Anomalies
You can define target values using goals and then use these values to highlight deviations from targets. We'll use anexample to explain, let's assume:• Your organization has a target number of web self service logins during a month. A goal exists that holds the
low and high ranges of the "cautionary" range of web self service contacts for each customer class for eachcalendar month during a year. If the number of contacts is lower than the low end of the cautionary range, there's aproblem.
• A customer contact is stored each time a customer logs in via the web.
You can now set up a variety of zones to highlight when the number of web self service contacts falls beneath thecautionary range. For example, you can set up a traffic light whose color highlights anomalous situations:
The following points summarize the high-level configuration tasks for such a zone:• Set up a measure that calculates the total count of web self service customer contacts (held on the customer
contact fact)• Set up a measure that calculates the low end of the cautionary range of web self service contacts (held in a goal)• Set up a measure that calculates the high end of the cautionary range of web self service contacts (held in a goal)• Set up the traffic light's color control to red if the number of contacts is less than the cautionary range (this assume
that too few web self service contacts is bad).
You could also set up a report graph that shows how actual contacts compare with the target number for a specificperiod (where bad deviations show a negative bar on the graph):
The following points summarize the high-level configuration tasks for such a zone:• Set up a measure that calculates the total count of web self service customer contacts (held on the customer
contact fact)• Set up a measure that calculates the low end of the cautionary range of web self service contacts (held in a goal)• Set up a measure that calculates the high end of the cautionary range of web self service contacts (held in a goal)• Set up a measure that retrieves whether deviations that are less than the target are considered bad - this measure
is either -1 or +1 (where -1 is used when you want actual contacts to be below the target value, e.g., credit andcollections contacts, and +1 is used when you want actual contact to be above the target value, e.g., web selfservice contacts). This value is held in the same goal that holds the yellow range.
• Set up a calculated value that contains the mid-point of the low and high cautionary range; we'll call this the targetvalue
• Set up a calculated value that subtracts the target value from actual contacts and multiplies the result by the good /bad indicator (a negative number means a bad situation). We'll call this the deviation amount.
• Indicate that you want to graph the actual contacts (the first measure) and the deviation amount (the last calculatedvalue).
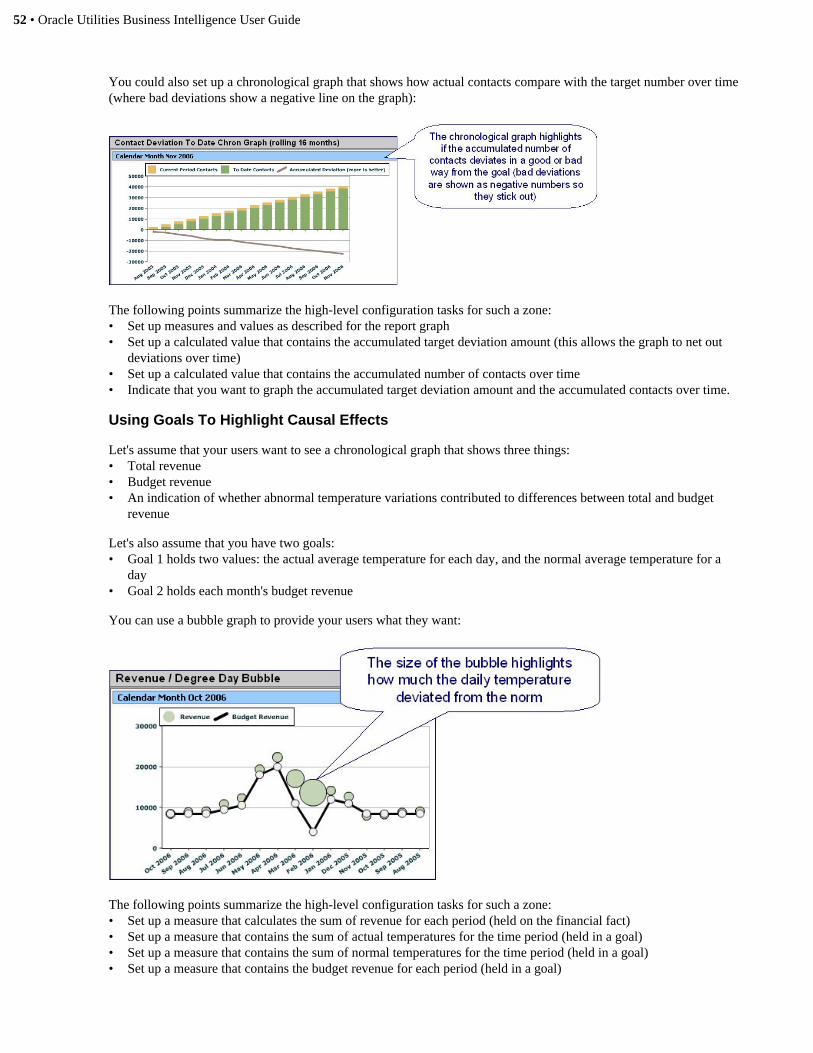
52 • Oracle Utilities Business Intelligence User Guide
You could also set up a chronological graph that shows how actual contacts compare with the target number over time(where bad deviations show a negative line on the graph):
The following points summarize the high-level configuration tasks for such a zone:• Set up measures and values as described for the report graph• Set up a calculated value that contains the accumulated target deviation amount (this allows the graph to net out
deviations over time)• Set up a calculated value that contains the accumulated number of contacts over time• Indicate that you want to graph the accumulated target deviation amount and the accumulated contacts over time.
Using Goals To Highlight Causal Effects
Let's assume that your users want to see a chronological graph that shows three things:• Total revenue• Budget revenue• An indication of whether abnormal temperature variations contributed to differences between total and budget
revenue
Let's also assume that you have two goals:• Goal 1 holds two values: the actual average temperature for each day, and the normal average temperature for a
day• Goal 2 holds each month's budget revenue
You can use a bubble graph to provide your users what they want:
The following points summarize the high-level configuration tasks for such a zone:• Set up a measure that calculates the sum of revenue for each period (held on the financial fact)• Set up a measure that contains the sum of actual temperatures for the time period (held in a goal)• Set up a measure that contains the sum of normal temperatures for the time period (held in a goal)• Set up a measure that contains the budget revenue for each period (held in a goal)
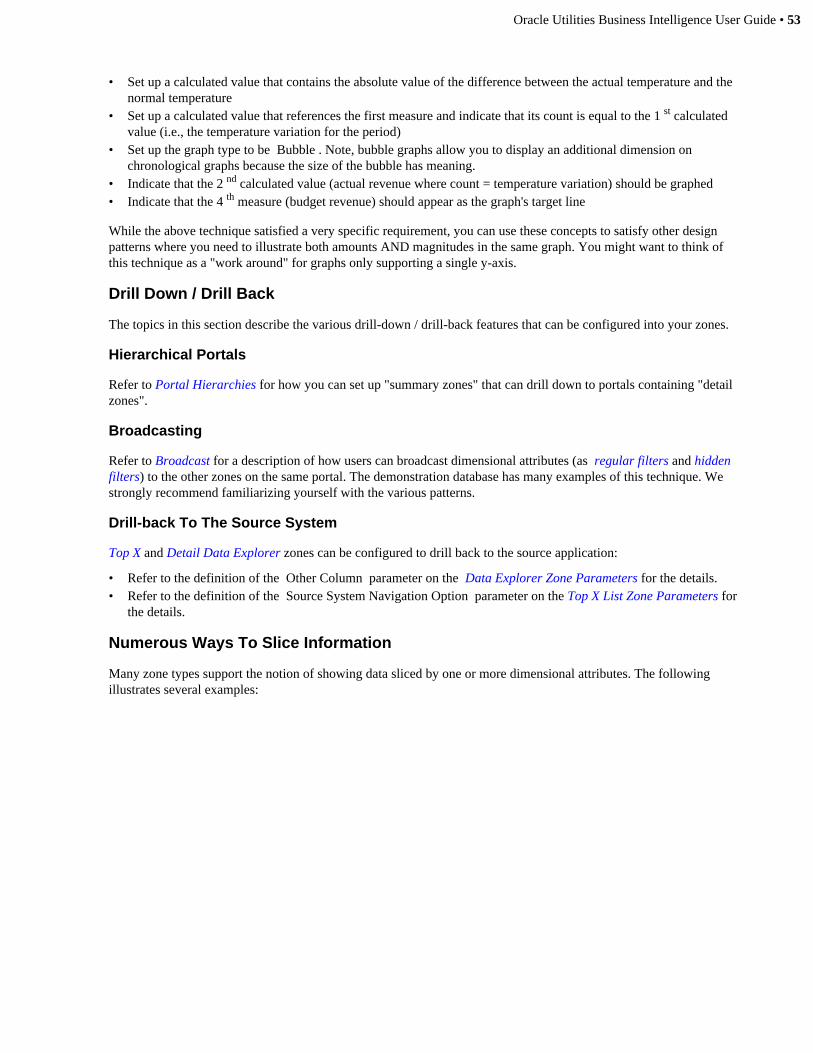
Oracle Utilities Business Intelligence User Guide • 53
• Set up a calculated value that contains the absolute value of the difference between the actual temperature and thenormal temperature
• Set up a calculated value that references the first measure and indicate that its count is equal to the 1 st calculatedvalue (i.e., the temperature variation for the period)
• Set up the graph type to be Bubble . Note, bubble graphs allow you to display an additional dimension onchronological graphs because the size of the bubble has meaning.
• Indicate that the 2 nd calculated value (actual revenue where count = temperature variation) should be graphed• Indicate that the 4 th measure (budget revenue) should appear as the graph's target line
While the above technique satisfied a very specific requirement, you can use these concepts to satisfy other designpatterns where you need to illustrate both amounts AND magnitudes in the same graph. You might want to think ofthis technique as a "work around" for graphs only supporting a single y-axis.
Drill Down / Drill Back
The topics in this section describe the various drill-down / drill-back features that can be configured into your zones.
Hierarchical Portals
Refer to Portal Hierarchies for how you can set up "summary zones" that can drill down to portals containing "detailzones".
Broadcasting
Refer to Broadcast for a description of how users can broadcast dimensional attributes (as regular filters and hiddenfilters) to the other zones on the same portal. The demonstration database has many examples of this technique. Westrongly recommend familiarizing yourself with the various patterns.
Drill-back To The Source System
Top X and Detail Data Explorer zones can be configured to drill back to the source application:
• Refer to the definition of the Other Column parameter on the Data Explorer Zone Parameters for the details.• Refer to the definition of the Source System Navigation Option parameter on the Top X List Zone Parameters for
the details.
Numerous Ways To Slice Information
Many zone types support the notion of showing data sliced by one or more dimensional attributes. The followingillustrates several examples:
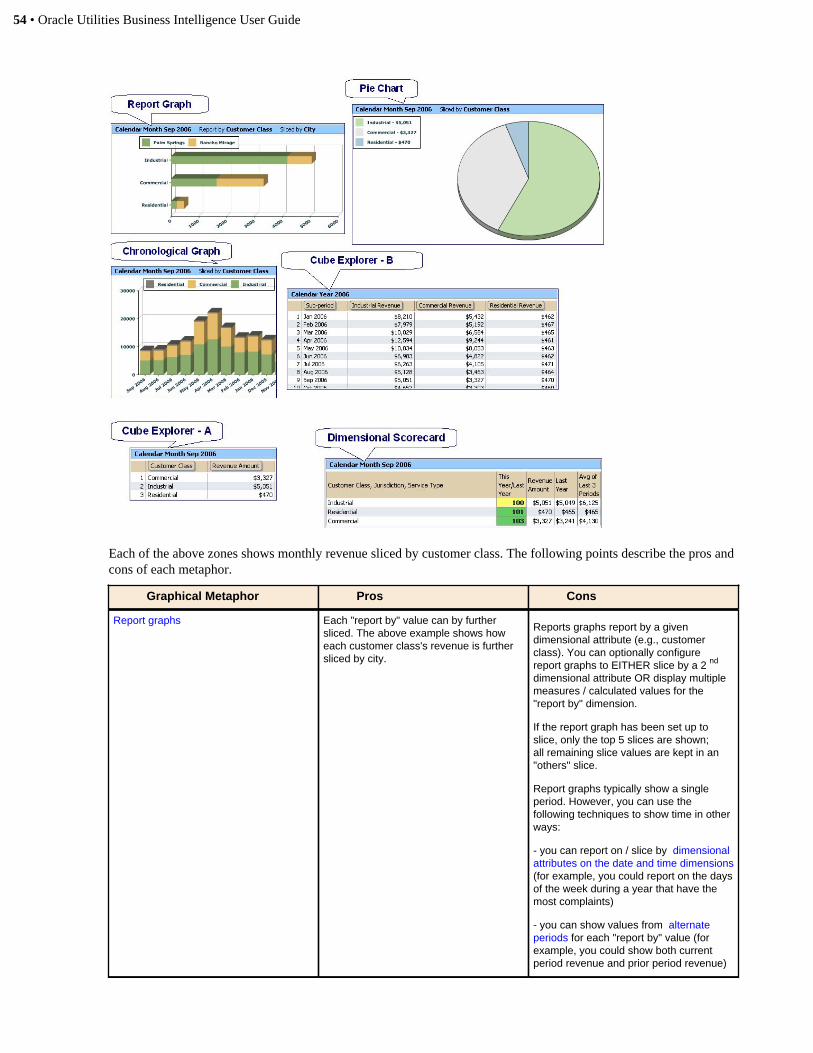
54 • Oracle Utilities Business Intelligence User Guide
Each of the above zones shows monthly revenue sliced by customer class. The following points describe the pros andcons of each metaphor.
Graphical Metaphor Pros Cons
Report graphs Each "report by" value can by furthersliced. The above example shows howeach customer class's revenue is furthersliced by city.
Reports graphs report by a givendimensional attribute (e.g., customerclass). You can optionally configurereport graphs to EITHER slice by a 2 nd
dimensional attribute OR display multiplemeasures / calculated values for the"report by" dimension.
If the report graph has been set up toslice, only the top 5 slices are shown;all remaining slice values are kept in an"others" slice.
Report graphs typically show a singleperiod. However, you can use thefollowing techniques to show time in otherways:
- you can report on / slice by dimensionalattributes on the date and time dimensions(for example, you could report on the daysof the week during a year that have themost complaints)
- you can show values from alternateperiods for each "report by" value (forexample, you could show both currentperiod revenue and prior period revenue)

Oracle Utilities Business Intelligence User Guide • 55
Graphical Metaphor Pros Cons
Chronological graphsSliced values for multiple periods areshown.
Bubble graphs allow you to use the size ofthe bubble to present a 3 rd dimension (thesize of the bubble is related to the relativenumber of rows associated with the valuebeing displayed).
Chronological graphs allow you toEITHER slice by a dimensional attributeor display multiple measures / calculatedvalues for each period.
If the graph has been set up to slice,the slice values are limited to a singledimensional attribute. In addition, only thetop 5 slices are shown; all remaining slicevalues are kept in an "others" slice.
While each period can be sliced by adimensional attribute, you cannot slicethe slices. For example, while the abovechronological graph shows revenue overtime by customer class; you cannot furtherslice each customer class by city.
Pie charts While graphs are limited to 5 slice values,pie charts can show many slice values(but there is a finite limit to the number ofslices in a pie chart).
The slice values are limited to a singledimensional attribute.
Pie charts slice data for a single period.
Cube ExplorersMany periods can be shown in a cubeexplorer (if the explorer contains a sub-period column).
The slice values are not limited to a singledimensional attribute (each row on acube explorer is sliced by the dimensionalattributes shown in the explorer).
Many measure / calculated values canbe shown for each slice value and periodcombination.
End-users can change the dimensionsand measures / calculated values beingsliced.
The information is not shown graphically(however, you can set up a graphicalzone on the same portal to display similarinformation graphically; this is especiallyuseful if you design with broadcasting inmind).
Dimensional scorecardsDimensional scorecards can slicecombinations of up to 5 dimensionalattributes.
The dimensional attribute combinationsare scored and displayed in score order(so that problematic dimensions appearfirst / last).
Up to 3 measure / calculated values canbe shown for each slice value.
Dimensional scorecards typically show asingle period. However, you can use thefollowing techniques to show time in otherways:
- you can slice by dimensional attributeson the date and time dimensions (forexample, you could slice by the days ofthe week during a year that have the mostcomplaints)
- you can show values from alternateperiods for each slice value (for example,you could show both current periodrevenue and prior period revenue forevery combination of dimensionalattributes)
Dynamic Reports
The topics in this section describe the various techniques that can be used to implement dynamic reports.
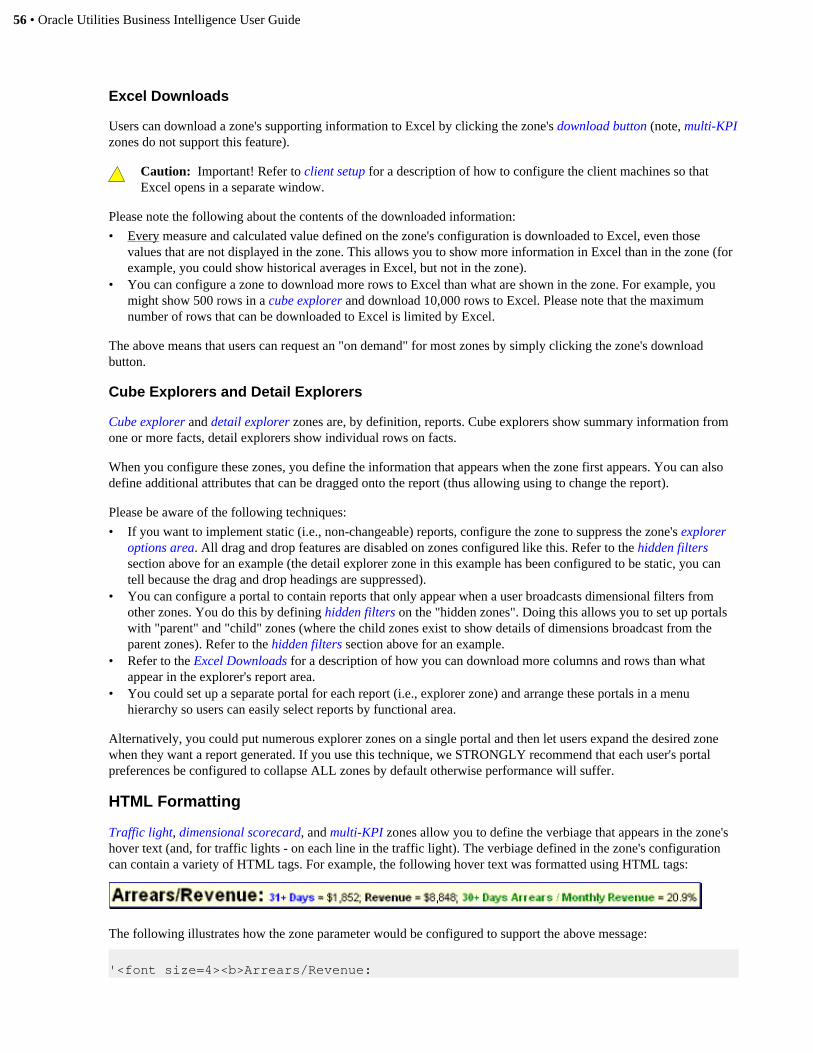
56 • Oracle Utilities Business Intelligence User Guide
Excel Downloads
Users can download a zone's supporting information to Excel by clicking the zone's download button (note, multi-KPIzones do not support this feature).
Caution: Important! Refer to client setup for a description of how to configure the client machines so thatExcel opens in a separate window.
Please note the following about the contents of the downloaded information:
• Every measure and calculated value defined on the zone's configuration is downloaded to Excel, even thosevalues that are not displayed in the zone. This allows you to show more information in Excel than in the zone (forexample, you could show historical averages in Excel, but not in the zone).
• You can configure a zone to download more rows to Excel than what are shown in the zone. For example, youmight show 500 rows in a cube explorer and download 10,000 rows to Excel. Please note that the maximumnumber of rows that can be downloaded to Excel is limited by Excel.
The above means that users can request an "on demand" for most zones by simply clicking the zone's downloadbutton.
Cube Explorers and Detail Explorers
Cube explorer and detail explorer zones are, by definition, reports. Cube explorers show summary information fromone or more facts, detail explorers show individual rows on facts.
When you configure these zones, you define the information that appears when the zone first appears. You can alsodefine additional attributes that can be dragged onto the report (thus allowing using to change the report).
Please be aware of the following techniques:
• If you want to implement static (i.e., non-changeable) reports, configure the zone to suppress the zone's exploreroptions area. All drag and drop features are disabled on zones configured like this. Refer to the hidden filterssection above for an example (the detail explorer zone in this example has been configured to be static, you cantell because the drag and drop headings are suppressed).
• You can configure a portal to contain reports that only appear when a user broadcasts dimensional filters fromother zones. You do this by defining hidden filters on the "hidden zones". Doing this allows you to set up portalswith "parent" and "child" zones (where the child zones exist to show details of dimensions broadcast from theparent zones). Refer to the hidden filters section above for an example.
• Refer to the Excel Downloads for a description of how you can download more columns and rows than whatappear in the explorer's report area.
• You could set up a separate portal for each report (i.e., explorer zone) and arrange these portals in a menuhierarchy so users can easily select reports by functional area.
Alternatively, you could put numerous explorer zones on a single portal and then let users expand the desired zonewhen they want a report generated. If you use this technique, we STRONGLY recommend that each user's portalpreferences be configured to collapse ALL zones by default otherwise performance will suffer.
HTML Formatting
Traffic light, dimensional scorecard, and multi-KPI zones allow you to define the verbiage that appears in the zone'shover text (and, for traffic lights - on each line in the traffic light). The verbiage defined in the zone's configurationcan contain a variety of HTML tags. For example, the following hover text was formatted using HTML tags:
The following illustrates how the zone parameter would be configured to support the above message:
'<font size=4><b>Arrears/Revenue:

Oracle Utilities Business Intelligence User Guide • 57
</b></font><font color=blue><b>31+Days</b></font> = '
M1
'; <b>Revenue</b> = '
M2
'; <font color=green><b>30+ DaysArrears / Monthly Revenue</b></font> = '
V1
Note:
<font size=4 color=blue> and </font> are the HTML tags used to indicate that the surrounded textshould be blue with a larger font size than the normal font.
The references to M1, M2, and V1 mean that the values of measure 1, measure 2, and calculated value 1 should beincluded in the respective positions. The following points contain the complete list of fields that can be included in atext string:
Mx These fields hold a measurement. For example,M1 holds the first measurement.
Nx These fields hold the count of fact / goal rowsthat were used to derive the measurement. Forexample, N1 holds the number of fact rows used toderive the first measurement.
Mx-label These fields hold the label of a measurement. Forexample, M1-label holds the name of the firstmeasurement.
Px These fields hold the label of a measurement'stime-period. For example, P1 holds the time periodof the first measurement.
Vx These fields hold a calculated value. For example,V1 would be used to reference the first calculatedvalue.
Vx-label These fields contain the label of a calculated value.For example, V1-label holds the name of the firstmeasurement.
Other common HTML tags that can be applied:
• <b> and </b> are the HTML tags used to indicate that the surrounded text should be bold• <br> causes a line break in a text string. If you use <br><br>, a blank line will appear• <i> and </i> cause the surrounded text to be italicized
The following is another example of hover text that has been formatted using HTML:
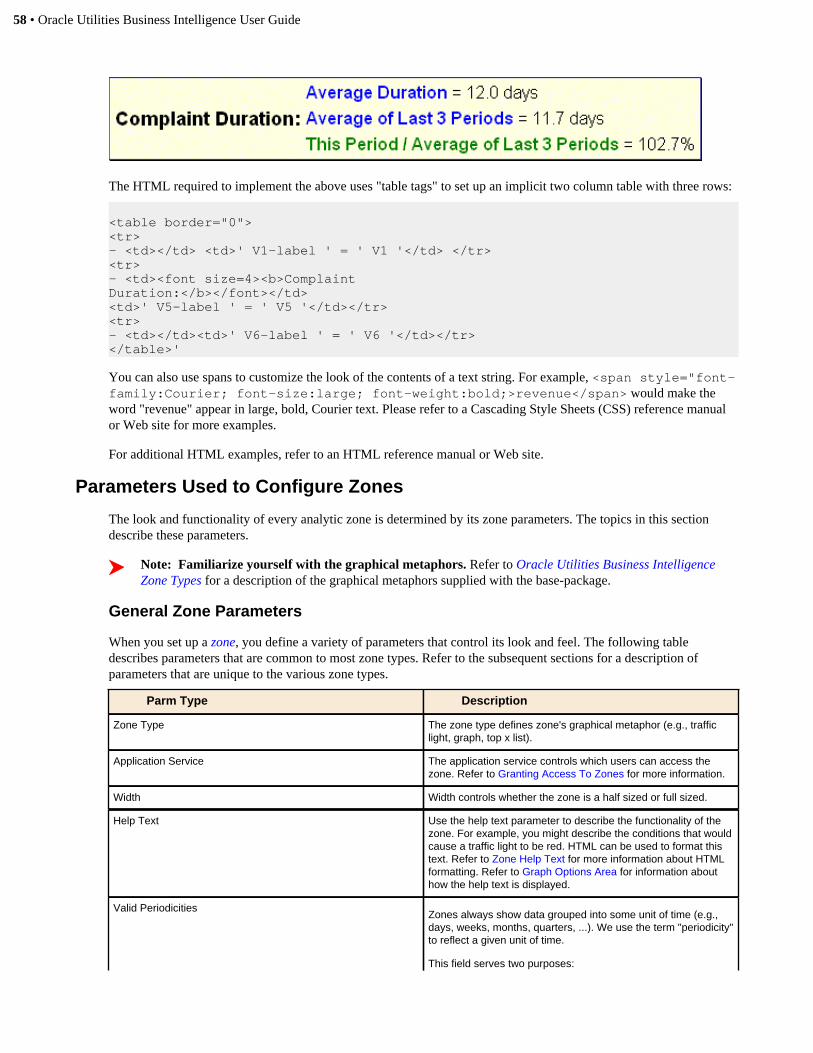
58 • Oracle Utilities Business Intelligence User Guide
The HTML required to implement the above uses "table tags" to set up an implicit two column table with three rows:
<table border="0"><tr>- <td></td> <td>' V1-label ' = ' V1 '</td> </tr><tr>- <td><font size=4><b>ComplaintDuration:</b></font></td><td>' V5-label ' = ' V5 '</td></tr><tr>- <td></td><td>' V6-label ' = ' V6 '</td></tr></table>'
You can also use spans to customize the look of the contents of a text string. For example, <span style="font-family:Courier; font-size:large; font-weight:bold;>revenue</span> would make theword "revenue" appear in large, bold, Courier text. Please refer to a Cascading Style Sheets (CSS) reference manualor Web site for more examples.
For additional HTML examples, refer to an HTML reference manual or Web site.
Parameters Used to Configure Zones
The look and functionality of every analytic zone is determined by its zone parameters. The topics in this sectiondescribe these parameters.
Note: Familiarize yourself with the graphical metaphors. Refer to Oracle Utilities Business IntelligenceZone Types for a description of the graphical metaphors supplied with the base-package.
General Zone Parameters
When you set up a zone, you define a variety of parameters that control its look and feel. The following tabledescribes parameters that are common to most zone types. Refer to the subsequent sections for a description ofparameters that are unique to the various zone types.
Parm Type Description
Zone Type The zone type defines zone's graphical metaphor (e.g., trafficlight, graph, top x list).
Application Service The application service controls which users can access thezone. Refer to Granting Access To Zones for more information.
Width Width controls whether the zone is a half sized or full sized.
Help Text Use the help text parameter to describe the functionality of thezone. For example, you might describe the conditions that wouldcause a traffic light to be red. HTML can be used to format thistext. Refer to Zone Help Text for more information about HTMLformatting. Refer to Graph Options Area for information abouthow the help text is displayed.
Valid PeriodicitiesZones always show data grouped into some unit of time (e.g.,days, weeks, months, quarters, ...). We use the term "periodicity"to reflect a given unit of time.
This field serves two purposes:

Oracle Utilities Business Intelligence User Guide • 59
Parm Type Description
1. It defines the valid periodicities in which a zone's datacan be grouped
2. It defines the default periodicity used when the zone isinitially shown
The valid values are:
FY . Fiscal Year
FP . Fiscal Period
CY . Calendar Year
CQ . Calendar Quarter
CM . Calendar Month
CW . Calendar Week
CD . Calendar Day
HR . Hourly
NONE . No periodicity (this value is not supported onchronological graphs and top X lists). Also note, if NONE isspecified, no other periodicities may be specified (i.e., a zoneeither supports periodicities or it doesn't).
If multiple periodicities are supported, separate each with aspace. For example if the zone supports Calendar Month andCalendar Week, enter CM CW .
The first value in the list is the zone's default periodicity.
This parameter is very important because your implementationdefines which periodicities are "pre aggregated" when you defineyour materialized views. If you allow a user to select a periodicitythat has not been aggregated on a materialized view, the rawfact data will be accessed when this zone is built and this willhave an adverse impact on response times.
Override Default Base PeriodWe use the term "base period" to reference the time periodused to build the zone's information. For example, a traffic lightwith a base period of Jan 2006 will show measures and goalscomputed relative to Jan 2006 .
This parameter controls the base period used when either of thefollowing events occur:
- when a zone is first built, and
- when a user changes a zone's periodicity
Note - users can subsequently define a specific base period byentering the desired value in the zone's Filter Area.
If this parameter is left blank, the default base period is the lastcomplete period for the respective periodicity. For example,if a zone's periodicity is Calendar Quarter , the last completequarter is used.
If you want the default base period to be something other thanthe last complete period, enter a value in this parameter. Thisparameter is entered in the format:
default=DEFAULT_RELATIVE_NBRPERIODICITY=RELATIVE_NBR
where:
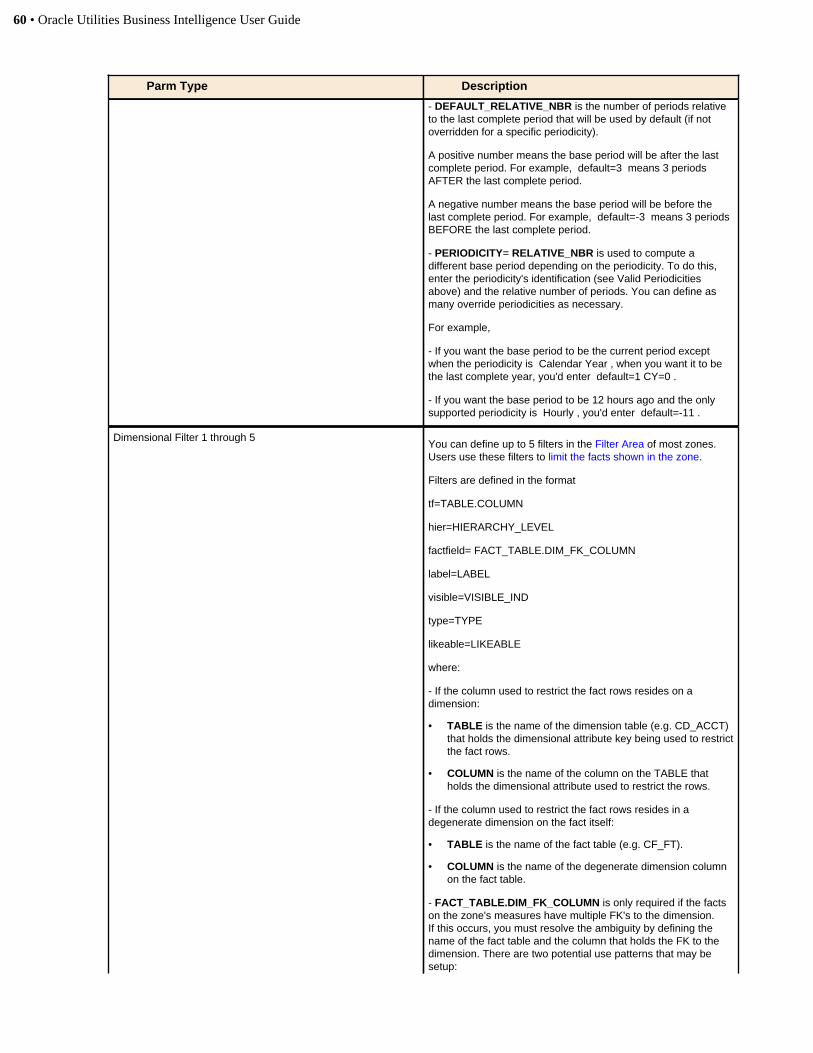
60 • Oracle Utilities Business Intelligence User Guide
Parm Type Description
- DEFAULT_RELATIVE_NBR is the number of periods relativeto the last complete period that will be used by default (if notoverridden for a specific periodicity).
A positive number means the base period will be after the lastcomplete period. For example, default=3 means 3 periodsAFTER the last complete period.
A negative number means the base period will be before thelast complete period. For example, default=-3 means 3 periodsBEFORE the last complete period.
- PERIODICITY= RELATIVE_NBR is used to compute adifferent base period depending on the periodicity. To do this,enter the periodicity's identification (see Valid Periodicitiesabove) and the relative number of periods. You can define asmany override periodicities as necessary.
For example,
- If you want the base period to be the current period exceptwhen the periodicity is Calendar Year , when you want it to bethe last complete year, you'd enter default=1 CY=0 .
- If you want the base period to be 12 hours ago and the onlysupported periodicity is Hourly , you'd enter default=-11 .
Dimensional Filter 1 through 5You can define up to 5 filters in the Filter Area of most zones.Users use these filters to limit the facts shown in the zone.
Filters are defined in the format
tf=TABLE.COLUMN
hier=HIERARCHY_LEVEL
factfield= FACT_TABLE.DIM_FK_COLUMN
label=LABEL
visible=VISIBLE_IND
type=TYPE
likeable=LIKEABLE
where:
- If the column used to restrict the fact rows resides on adimension:
• TABLE is the name of the dimension table (e.g. CD_ACCT)that holds the dimensional attribute key being used to restrictthe fact rows.
• COLUMN is the name of the column on the TABLE thatholds the dimensional attribute used to restrict the rows.
- If the column used to restrict the fact rows resides in adegenerate dimension on the fact itself:
• TABLE is the name of the fact table (e.g. CF_FT).
• COLUMN is the name of the degenerate dimension columnon the fact table.
- FACT_TABLE.DIM_FK_COLUMN is only required if the factson the zone's measures have multiple FK's to the dimension.If this occurs, you must resolve the ambiguity by defining thename of the fact table and the column that holds the FK to thedimension. There are two potential use patterns that may besetup:
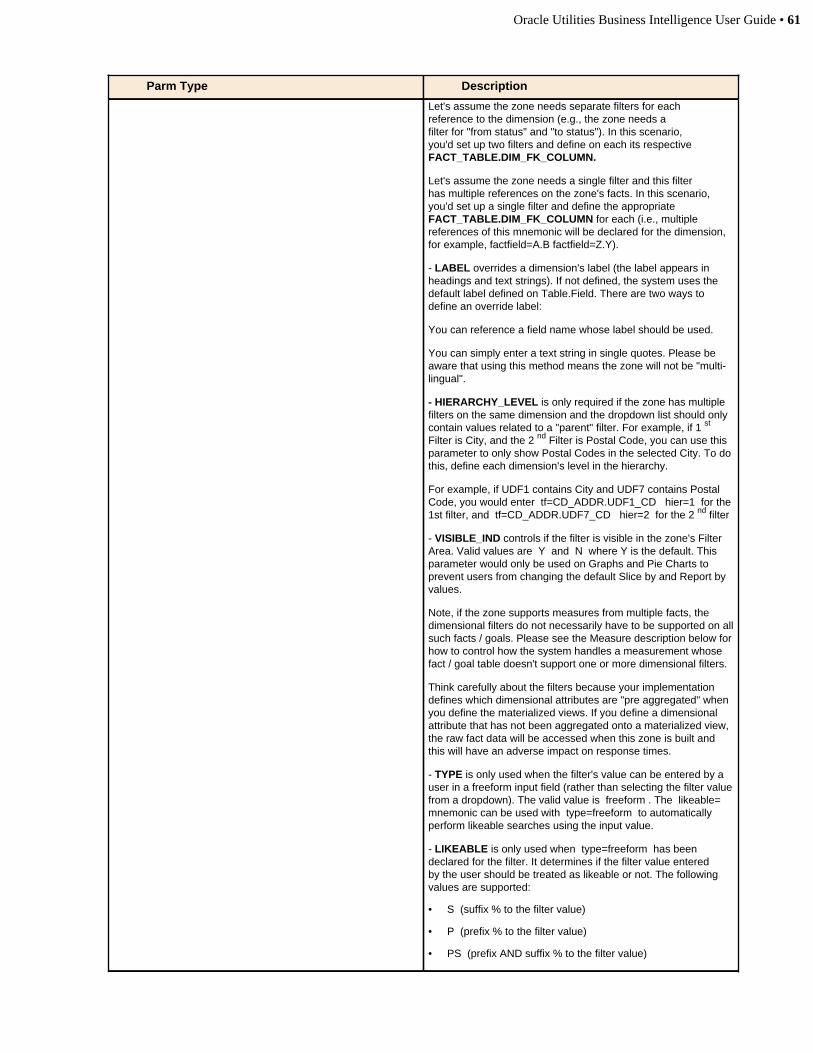
Oracle Utilities Business Intelligence User Guide • 61
Parm Type Description
Let's assume the zone needs separate filters for eachreference to the dimension (e.g., the zone needs afilter for "from status" and "to status"). In this scenario,you'd set up two filters and define on each its respectiveFACT_TABLE.DIM_FK_COLUMN.
Let's assume the zone needs a single filter and this filterhas multiple references on the zone's facts. In this scenario,you'd set up a single filter and define the appropriateFACT_TABLE.DIM_FK_COLUMN for each (i.e., multiplereferences of this mnemonic will be declared for the dimension,for example, factfield=A.B factfield=Z.Y).
- LABEL overrides a dimension's label (the label appears inheadings and text strings). If not defined, the system uses thedefault label defined on Table.Field. There are two ways todefine an override label:
You can reference a field name whose label should be used.
You can simply enter a text string in single quotes. Please beaware that using this method means the zone will not be "multi-lingual".
- HIERARCHY_LEVEL is only required if the zone has multiplefilters on the same dimension and the dropdown list should onlycontain values related to a "parent" filter. For example, if 1 st
Filter is City, and the 2 nd Filter is Postal Code, you can use thisparameter to only show Postal Codes in the selected City. To dothis, define each dimension's level in the hierarchy.
For example, if UDF1 contains City and UDF7 contains PostalCode, you would enter tf=CD_ADDR.UDF1_CD hier=1 for the1st filter, and tf=CD_ADDR.UDF7_CD hier=2 for the 2 nd filter
- VISIBLE_IND controls if the filter is visible in the zone's FilterArea. Valid values are Y and N where Y is the default. Thisparameter would only be used on Graphs and Pie Charts toprevent users from changing the default Slice by and Report byvalues.
Note, if the zone supports measures from multiple facts, thedimensional filters do not necessarily have to be supported on allsuch facts / goals. Please see the Measure description below forhow to control how the system handles a measurement whosefact / goal table doesn't support one or more dimensional filters.
Think carefully about the filters because your implementationdefines which dimensional attributes are "pre aggregated" whenyou define the materialized views. If you define a dimensionalattribute that has not been aggregated onto a materialized view,the raw fact data will be accessed when this zone is built andthis will have an adverse impact on response times.
- TYPE is only used when the filter's value can be entered by auser in a freeform input field (rather than selecting the filter valuefrom a dropdown). The valid value is freeform . The likeable= mnemonic can be used with type=freeform to automaticallyperform likeable searches using the input value.
- LIKEABLE is only used when type=freeform has beendeclared for the filter. It determines if the filter value enteredby the user should be treated as likeable or not. The followingvalues are supported:
• S (suffix % to the filter value)
• P (prefix % to the filter value)
• PS (prefix AND suffix % to the filter value)
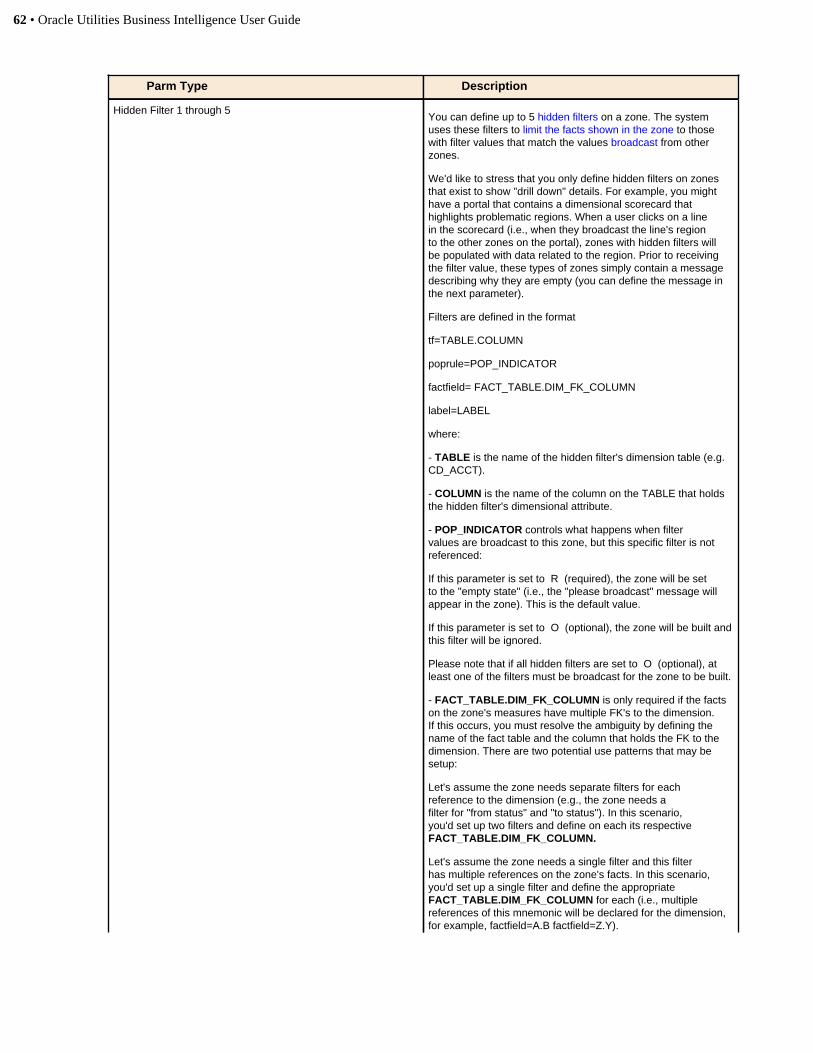
62 • Oracle Utilities Business Intelligence User Guide
Parm Type Description
Hidden Filter 1 through 5You can define up to 5 hidden filters on a zone. The systemuses these filters to limit the facts shown in the zone to thosewith filter values that match the values broadcast from otherzones.
We'd like to stress that you only define hidden filters on zonesthat exist to show "drill down" details. For example, you mighthave a portal that contains a dimensional scorecard thathighlights problematic regions. When a user clicks on a linein the scorecard (i.e., when they broadcast the line's regionto the other zones on the portal), zones with hidden filters willbe populated with data related to the region. Prior to receivingthe filter value, these types of zones simply contain a messagedescribing why they are empty (you can define the message inthe next parameter).
Filters are defined in the format
tf=TABLE.COLUMN
poprule=POP_INDICATOR
factfield= FACT_TABLE.DIM_FK_COLUMN
label=LABEL
where:
- TABLE is the name of the hidden filter's dimension table (e.g.CD_ACCT).
- COLUMN is the name of the column on the TABLE that holdsthe hidden filter's dimensional attribute.
- POP_INDICATOR controls what happens when filtervalues are broadcast to this zone, but this specific filter is notreferenced:
If this parameter is set to R (required), the zone will be setto the "empty state" (i.e., the "please broadcast" message willappear in the zone). This is the default value.
If this parameter is set to O (optional), the zone will be built andthis filter will be ignored.
Please note that if all hidden filters are set to O (optional), atleast one of the filters must be broadcast for the zone to be built.
- FACT_TABLE.DIM_FK_COLUMN is only required if the factson the zone's measures have multiple FK's to the dimension.If this occurs, you must resolve the ambiguity by defining thename of the fact table and the column that holds the FK to thedimension. There are two potential use patterns that may besetup:
Let's assume the zone needs separate filters for eachreference to the dimension (e.g., the zone needs afilter for "from status" and "to status"). In this scenario,you'd set up two filters and define on each its respectiveFACT_TABLE.DIM_FK_COLUMN.
Let's assume the zone needs a single filter and this filterhas multiple references on the zone's facts. In this scenario,you'd set up a single filter and define the appropriateFACT_TABLE.DIM_FK_COLUMN for each (i.e., multiplereferences of this mnemonic will be declared for the dimension,for example, factfield=A.B factfield=Z.Y).
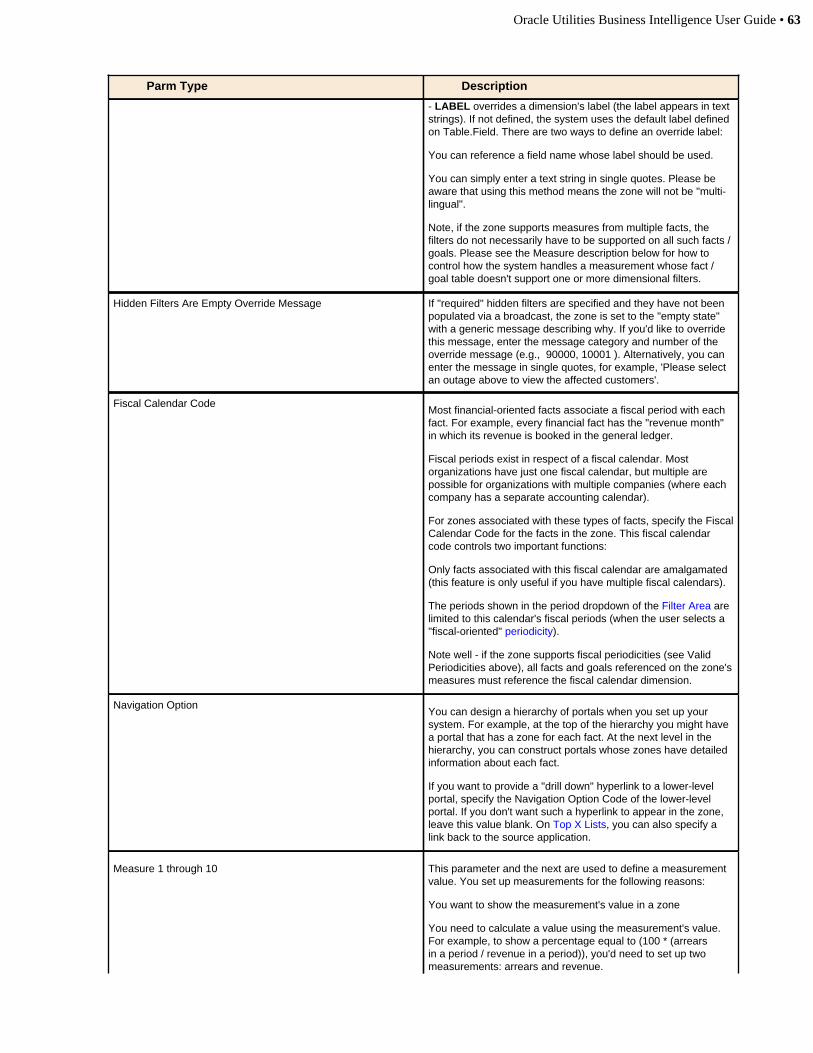
Oracle Utilities Business Intelligence User Guide • 63
Parm Type Description
- LABEL overrides a dimension's label (the label appears in textstrings). If not defined, the system uses the default label definedon Table.Field. There are two ways to define an override label:
You can reference a field name whose label should be used.
You can simply enter a text string in single quotes. Please beaware that using this method means the zone will not be "multi-lingual".
Note, if the zone supports measures from multiple facts, thefilters do not necessarily have to be supported on all such facts /goals. Please see the Measure description below for how tocontrol how the system handles a measurement whose fact /goal table doesn't support one or more dimensional filters.
Hidden Filters Are Empty Override Message If "required" hidden filters are specified and they have not beenpopulated via a broadcast, the zone is set to the "empty state"with a generic message describing why. If you'd like to overridethis message, enter the message category and number of theoverride message (e.g., 90000, 10001 ). Alternatively, you canenter the message in single quotes, for example, 'Please selectan outage above to view the affected customers'.
Fiscal Calendar CodeMost financial-oriented facts associate a fiscal period with eachfact. For example, every financial fact has the "revenue month"in which its revenue is booked in the general ledger.
Fiscal periods exist in respect of a fiscal calendar. Mostorganizations have just one fiscal calendar, but multiple arepossible for organizations with multiple companies (where eachcompany has a separate accounting calendar).
For zones associated with these types of facts, specify the FiscalCalendar Code for the facts in the zone. This fiscal calendarcode controls two important functions:
Only facts associated with this fiscal calendar are amalgamated(this feature is only useful if you have multiple fiscal calendars).
The periods shown in the period dropdown of the Filter Area arelimited to this calendar's fiscal periods (when the user selects a"fiscal-oriented" periodicity).
Note well - if the zone supports fiscal periodicities (see ValidPeriodicities above), all facts and goals referenced on the zone'smeasures must reference the fiscal calendar dimension.
Navigation OptionYou can design a hierarchy of portals when you set up yoursystem. For example, at the top of the hierarchy you might havea portal that has a zone for each fact. At the next level in thehierarchy, you can construct portals whose zones have detailedinformation about each fact.
If you want to provide a "drill down" hyperlink to a lower-levelportal, specify the Navigation Option Code of the lower-levelportal. If you don't want such a hyperlink to appear in the zone,leave this value blank. On Top X Lists, you can also specify alink back to the source application.
Measure 1 through 10
This parameter and the next are used to define a measurementvalue. You set up measurements for the following reasons:
You want to show the measurement's value in a zone
You need to calculate a value using the measurement's value.For example, to show a percentage equal to (100 * (arrearsin a period / revenue in a period)), you'd need to set up twomeasurements: arrears and revenue.

64 • Oracle Utilities Business Intelligence User Guide
Parm Type Description
You want to download the measurement's value when thezone's information is downloaded to Excel. NB, when a userdownloads a zone's data to Excel, EVERY measure defined inthe zone parameters will appear in the spreadsheet, even thosethat do not appear in the zone's visual image.
In this parameter (the measurement), you define where themeasurement resides in the star schema and how it looks inthe zone. In the following parameter (the fixed filter), you canoptionally define criteria to restrict the rows to those with specificdimensional attribute values.
The parameter's value is entered in the format
tf=FACT_TABLE.MEASURE_COLUMN or SQL_EXPRESSION
gf=GOALTYPE.MEASURE_COLUMN or SQL_EXPRESSION
func=SQL_FUNCTION
dt=DATEKEY_COLUMN
tm=TIMEKEY_COLUMN
per=PERIOD
year=YEAR
cur=CURRENCY_CODE
dec=DECIMAL
char=SPECIAL_CHAR
label=LABEL
dimrule=DIMRULE
suppress=SUPPRESS
where:
- FACT_TABLE is the name of the fact table that holds the rowsbeing aggregated.
- GOALTYPE is the Goal Type Code for which the goal data willbe aggregated.
- MEASURE_COLUMN is the name of the column on theTABLE or GOALTYPE that holds the measure. Note, in additionto referencing a fact's measures, a limited number of calculatedmeasures are supported via SQL functions. To do this, makesure to enclose the measure in parenthesis. For example, youcould enter (SYSDATE - OUT-DTTM) to calculate the sum ofthe difference between the current date/time and a measurecontaining the outage date/time. Please note that using adynamic value like SYSDATE means that the SQL cannot berewritten to a materialized view and this could have an adverseimpact on response times.
- SQL_EXPRESSION is an expression that can includereferences to FACT_TABLE.MEASURE_COLUMN andGOALTYPE.MEASURE_COLUMN values). For example,
-tf= DECODE(FLOOR((SYSDATE"CF_RECENT_TODO.CREATE_DTTM )/10),0,1,0) would returna value of 1 is the CREATE_DTTM is less than 10 days old.
- tf= DECODE(ABS(CF_FT.CURR_AMT),CF_FT.CURR_AMT,0,1) would return a value of 1 if CURR_AMT is negative.
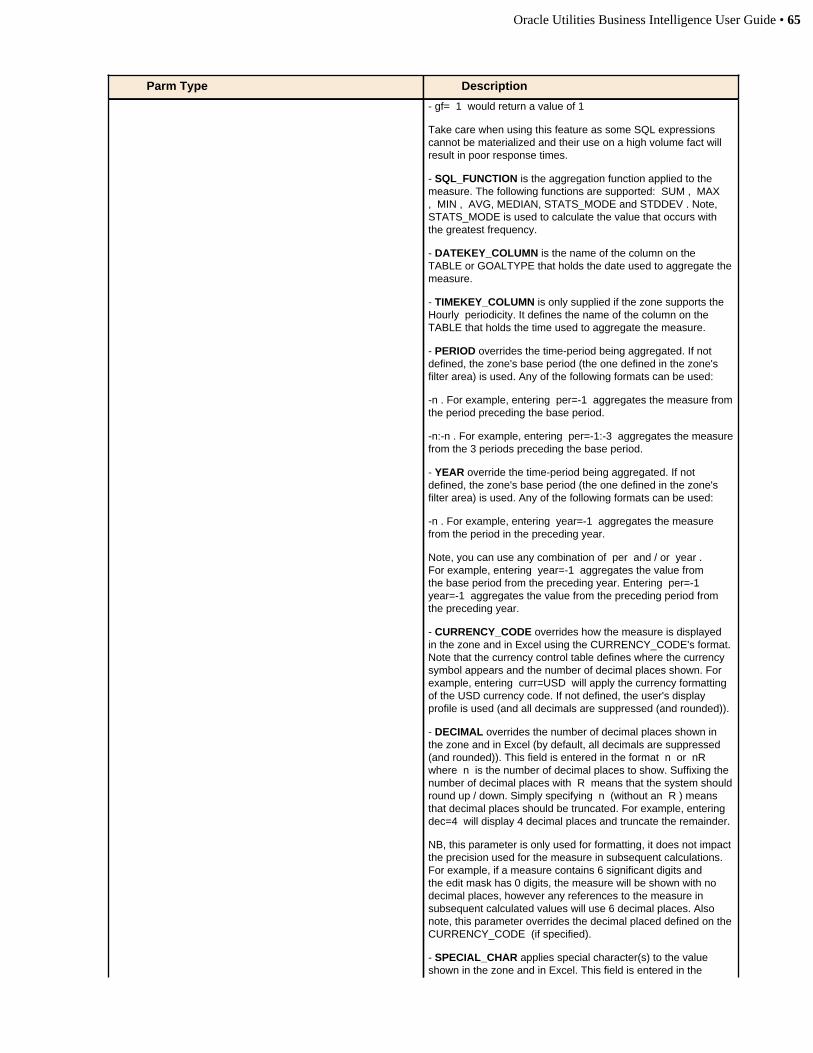
Oracle Utilities Business Intelligence User Guide • 65
Parm Type Description
- gf= 1 would return a value of 1
Take care when using this feature as some SQL expressionscannot be materialized and their use on a high volume fact willresult in poor response times.
- SQL_FUNCTION is the aggregation function applied to themeasure. The following functions are supported: SUM , MAX, MIN , AVG, MEDIAN, STATS_MODE and STDDEV . Note,STATS_MODE is used to calculate the value that occurs withthe greatest frequency.
- DATEKEY_COLUMN is the name of the column on theTABLE or GOALTYPE that holds the date used to aggregate themeasure.
- TIMEKEY_COLUMN is only supplied if the zone supports the Hourly periodicity. It defines the name of the column on theTABLE that holds the time used to aggregate the measure.
- PERIOD overrides the time-period being aggregated. If notdefined, the zone's base period (the one defined in the zone'sfilter area) is used. Any of the following formats can be used:
-n . For example, entering per=-1 aggregates the measure fromthe period preceding the base period.
-n:-n . For example, entering per=-1:-3 aggregates the measurefrom the 3 periods preceding the base period.
- YEAR override the time-period being aggregated. If notdefined, the zone's base period (the one defined in the zone'sfilter area) is used. Any of the following formats can be used:
-n . For example, entering year=-1 aggregates the measurefrom the period in the preceding year.
Note, you can use any combination of per and / or year .For example, entering year=-1 aggregates the value fromthe base period from the preceding year. Entering per=-1year=-1 aggregates the value from the preceding period fromthe preceding year.
- CURRENCY_CODE overrides how the measure is displayedin the zone and in Excel using the CURRENCY_CODE's format.Note that the currency control table defines where the currencysymbol appears and the number of decimal places shown. Forexample, entering curr=USD will apply the currency formattingof the USD currency code. If not defined, the user's displayprofile is used (and all decimals are suppressed (and rounded)).
- DECIMAL overrides the number of decimal places shown inthe zone and in Excel (by default, all decimals are suppressed(and rounded)). This field is entered in the format n or nR where n is the number of decimal places to show. Suffixing thenumber of decimal places with R means that the system shouldround up / down. Simply specifying n (without an R ) meansthat decimal places should be truncated. For example, entering dec=4 will display 4 decimal places and truncate the remainder.
NB, this parameter is only used for formatting, it does not impactthe precision used for the measure in subsequent calculations.For example, if a measure contains 6 significant digits andthe edit mask has 0 digits, the measure will be shown with nodecimal places, however any references to the measure insubsequent calculated values will use 6 decimal places. Alsonote, this parameter overrides the decimal placed defined on theCURRENCY_CODE (if specified).
- SPECIAL_CHAR applies special character(s) to the valueshown in the zone and in Excel. This field is entered in the
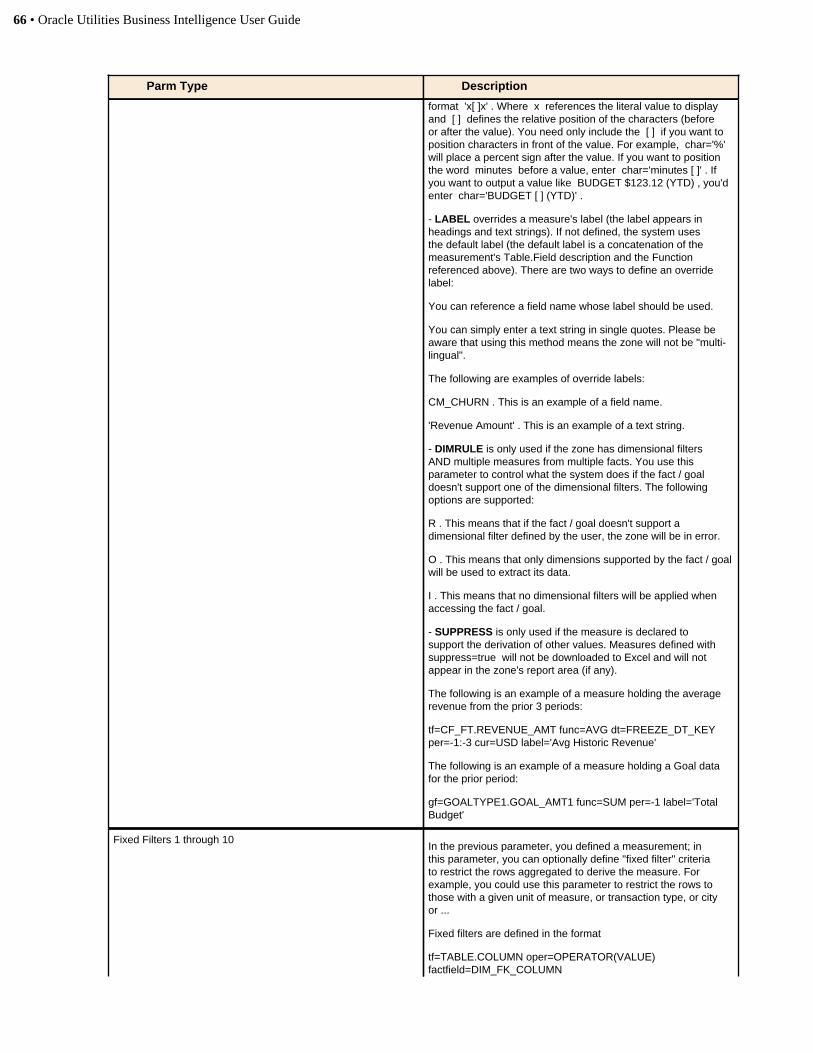
66 • Oracle Utilities Business Intelligence User Guide
Parm Type Description
format 'x[ ]x' . Where x references the literal value to displayand [ ] defines the relative position of the characters (beforeor after the value). You need only include the [ ] if you want toposition characters in front of the value. For example, char='%' will place a percent sign after the value. If you want to positionthe word minutes before a value, enter char='minutes [ ]' . Ifyou want to output a value like BUDGET $123.12 (YTD) , you'denter char='BUDGET [ ] (YTD)' .
- LABEL overrides a measure's label (the label appears inheadings and text strings). If not defined, the system usesthe default label (the default label is a concatenation of themeasurement's Table.Field description and the Functionreferenced above). There are two ways to define an overridelabel:
You can reference a field name whose label should be used.
You can simply enter a text string in single quotes. Please beaware that using this method means the zone will not be "multi-lingual".
The following are examples of override labels:
CM_CHURN . This is an example of a field name.
'Revenue Amount' . This is an example of a text string.
- DIMRULE is only used if the zone has dimensional filtersAND multiple measures from multiple facts. You use thisparameter to control what the system does if the fact / goaldoesn't support one of the dimensional filters. The followingoptions are supported:
R . This means that if the fact / goal doesn't support adimensional filter defined by the user, the zone will be in error.
O . This means that only dimensions supported by the fact / goalwill be used to extract its data.
I . This means that no dimensional filters will be applied whenaccessing the fact / goal.
- SUPPRESS is only used if the measure is declared tosupport the derivation of other values. Measures defined with suppress=true will not be downloaded to Excel and will notappear in the zone's report area (if any).
The following is an example of a measure holding the averagerevenue from the prior 3 periods:
tf=CF_FT.REVENUE_AMT func=AVG dt=FREEZE_DT_KEYper=-1:-3 cur=USD label='Avg Historic Revenue'
The following is an example of a measure holding a Goal datafor the prior period:
gf=GOALTYPE1.GOAL_AMT1 func=SUM per=-1 label='TotalBudget'
Fixed Filters 1 through 10In the previous parameter, you defined a measurement; inthis parameter, you can optionally define "fixed filter" criteriato restrict the rows aggregated to derive the measure. Forexample, you could use this parameter to restrict the rows tothose with a given unit of measure, or transaction type, or cityor ...
Fixed filters are defined in the format
tf=TABLE.COLUMN oper=OPERATOR(VALUE)factfield=DIM_FK_COLUMN
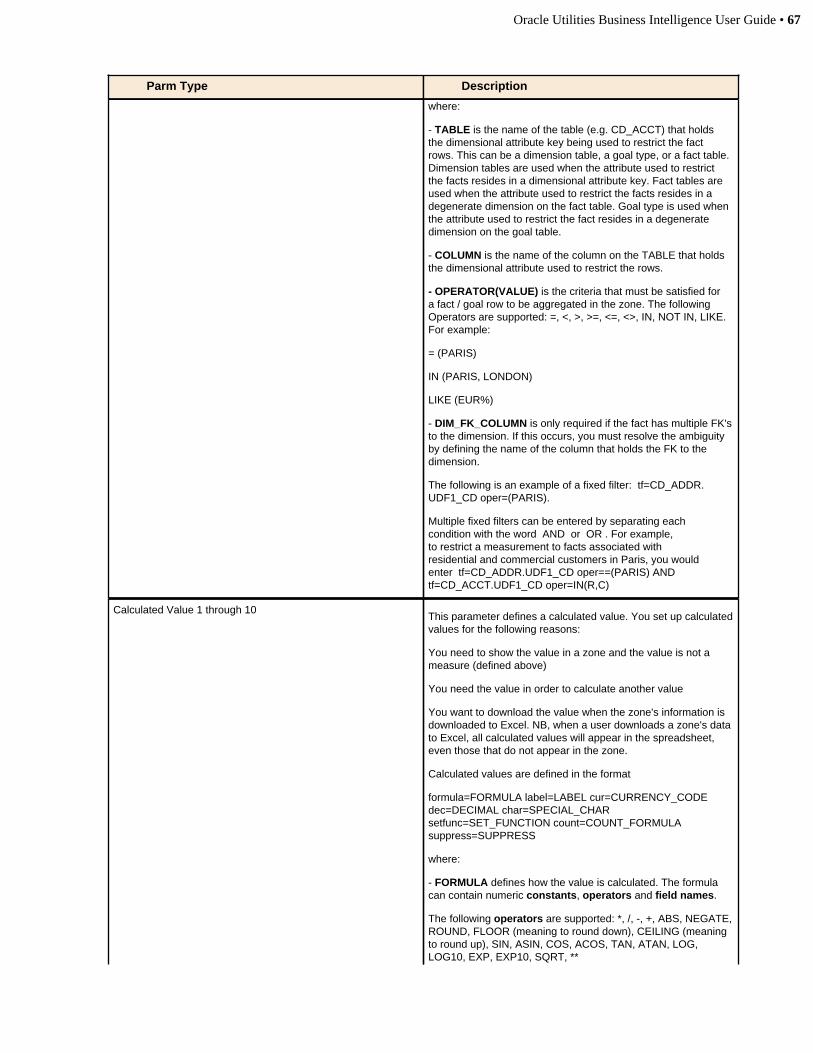
Oracle Utilities Business Intelligence User Guide • 67
Parm Type Description
where:
- TABLE is the name of the table (e.g. CD_ACCT) that holdsthe dimensional attribute key being used to restrict the factrows. This can be a dimension table, a goal type, or a fact table.Dimension tables are used when the attribute used to restrictthe facts resides in a dimensional attribute key. Fact tables areused when the attribute used to restrict the facts resides in adegenerate dimension on the fact table. Goal type is used whenthe attribute used to restrict the fact resides in a degeneratedimension on the goal table.
- COLUMN is the name of the column on the TABLE that holdsthe dimensional attribute used to restrict the rows.
- OPERATOR(VALUE) is the criteria that must be satisfied fora fact / goal row to be aggregated in the zone. The followingOperators are supported: =, <, >, >=, <=, <>, IN, NOT IN, LIKE.For example:
= (PARIS)
IN (PARIS, LONDON)
LIKE (EUR%)
- DIM_FK_COLUMN is only required if the fact has multiple FK'sto the dimension. If this occurs, you must resolve the ambiguityby defining the name of the column that holds the FK to thedimension.
The following is an example of a fixed filter: tf=CD_ADDR.UDF1_CD oper=(PARIS).
Multiple fixed filters can be entered by separating eachcondition with the word AND or OR . For example,to restrict a measurement to facts associated withresidential and commercial customers in Paris, you wouldenter tf=CD_ADDR.UDF1_CD oper==(PARIS) ANDtf=CD_ACCT.UDF1_CD oper=IN(R,C)
Calculated Value 1 through 10This parameter defines a calculated value. You set up calculatedvalues for the following reasons:
You need to show the value in a zone and the value is not ameasure (defined above)
You need the value in order to calculate another value
You want to download the value when the zone's information isdownloaded to Excel. NB, when a user downloads a zone's datato Excel, all calculated values will appear in the spreadsheet,even those that do not appear in the zone.
Calculated values are defined in the format
formula=FORMULA label=LABEL cur=CURRENCY_CODEdec=DECIMAL char=SPECIAL_CHARsetfunc=SET_FUNCTION count=COUNT_FORMULAsuppress=SUPPRESS
where:
- FORMULA defines how the value is calculated. The formulacan contain numeric constants, operators and field names.
The following operators are supported: *, /, -, +, ABS, NEGATE,ROUND, FLOOR (meaning to round down), CEILING (meaningto round up), SIN, ASIN, COS, ACOS, TAN, ATAN, LOG,LOG10, EXP, EXP10, SQRT, **
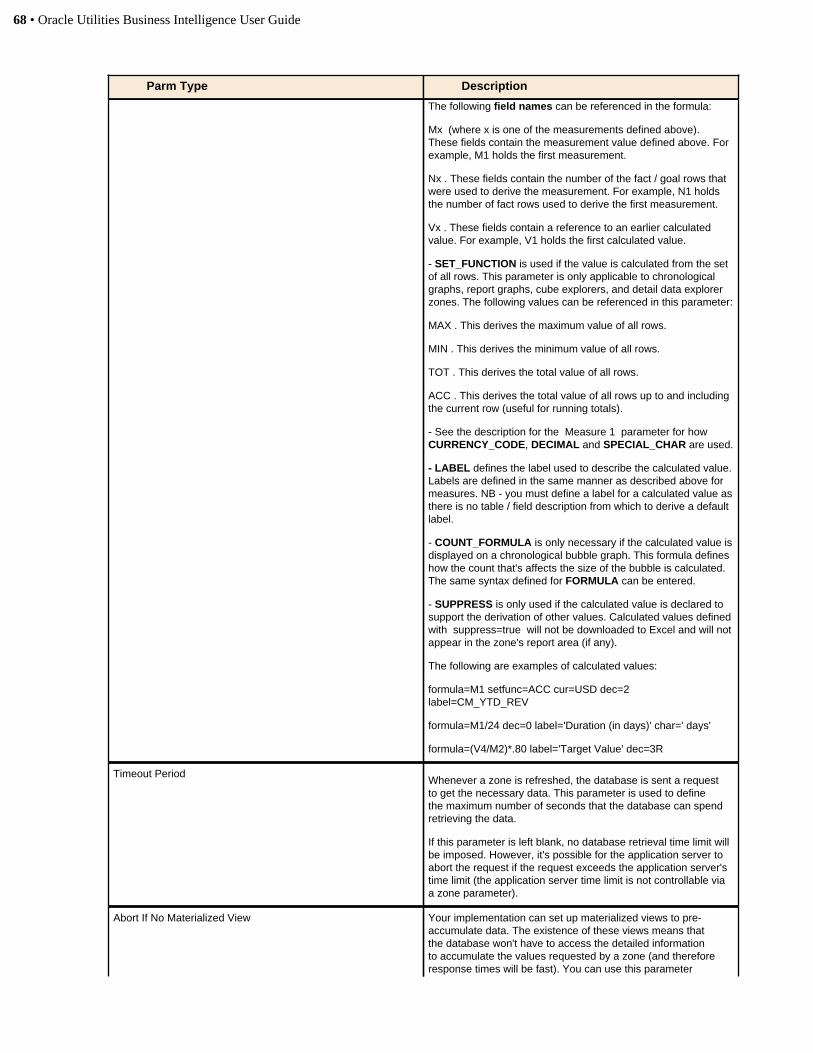
68 • Oracle Utilities Business Intelligence User Guide
Parm Type Description
The following field names can be referenced in the formula:
Mx (where x is one of the measurements defined above).These fields contain the measurement value defined above. Forexample, M1 holds the first measurement.
Nx . These fields contain the number of the fact / goal rows thatwere used to derive the measurement. For example, N1 holdsthe number of fact rows used to derive the first measurement.
Vx . These fields contain a reference to an earlier calculatedvalue. For example, V1 holds the first calculated value.
- SET_FUNCTION is used if the value is calculated from the setof all rows. This parameter is only applicable to chronologicalgraphs, report graphs, cube explorers, and detail data explorerzones. The following values can be referenced in this parameter:
MAX . This derives the maximum value of all rows.
MIN . This derives the minimum value of all rows.
TOT . This derives the total value of all rows.
ACC . This derives the total value of all rows up to and includingthe current row (useful for running totals).
- See the description for the Measure 1 parameter for howCURRENCY_CODE, DECIMAL and SPECIAL_CHAR are used.
- LABEL defines the label used to describe the calculated value.Labels are defined in the same manner as described above formeasures. NB - you must define a label for a calculated value asthere is no table / field description from which to derive a defaultlabel.
- COUNT_FORMULA is only necessary if the calculated value isdisplayed on a chronological bubble graph. This formula defineshow the count that's affects the size of the bubble is calculated.The same syntax defined for FORMULA can be entered.
- SUPPRESS is only used if the calculated value is declared tosupport the derivation of other values. Calculated values definedwith suppress=true will not be downloaded to Excel and will notappear in the zone's report area (if any).
The following are examples of calculated values:
formula=M1 setfunc=ACC cur=USD dec=2label=CM_YTD_REV
formula=M1/24 dec=0 label='Duration (in days)' char=' days'
formula=(V4/M2)*.80 label='Target Value' dec=3R
Timeout PeriodWhenever a zone is refreshed, the database is sent a requestto get the necessary data. This parameter is used to definethe maximum number of seconds that the database can spendretrieving the data.
If this parameter is left blank, no database retrieval time limit willbe imposed. However, it's possible for the application server toabort the request if the request exceeds the application server'stime limit (the application server time limit is not controllable viaa zone parameter).
Abort If No Materialized View Your implementation can set up materialized views to pre-accumulate data. The existence of these views means thatthe database won't have to access the detailed informationto accumulate the values requested by a zone (and thereforeresponse times will be fast). You can use this parameter
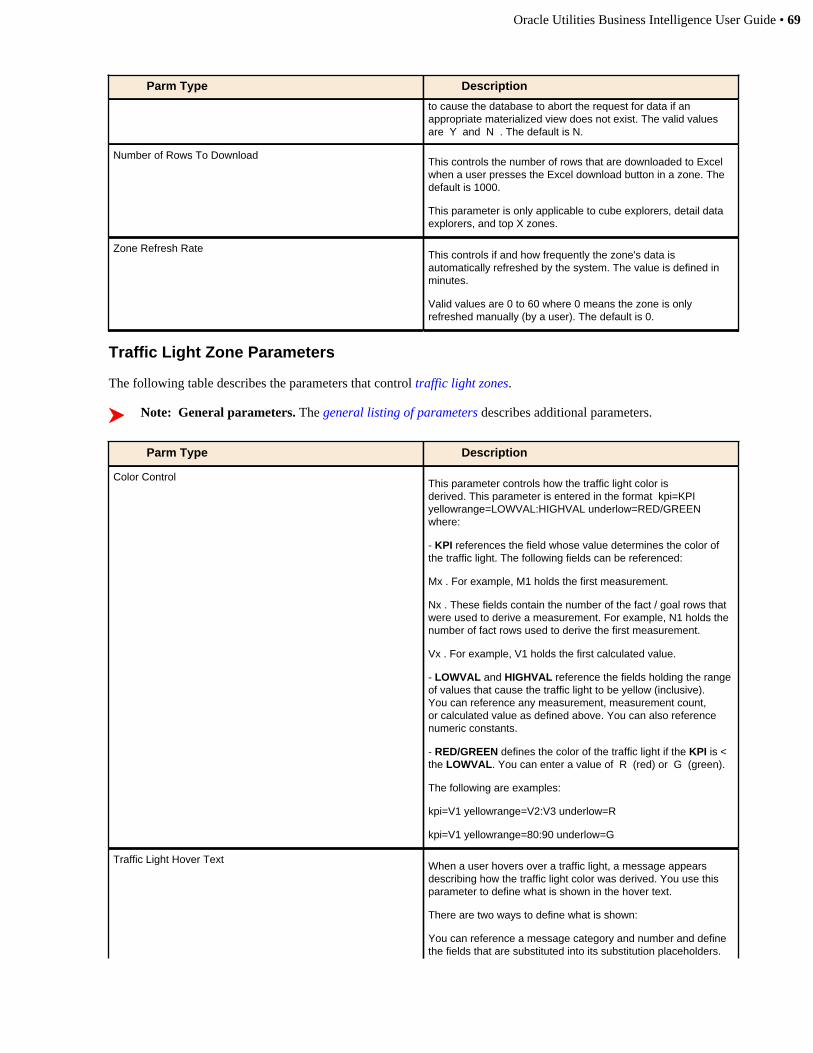
Oracle Utilities Business Intelligence User Guide • 69
Parm Type Description
to cause the database to abort the request for data if anappropriate materialized view does not exist. The valid valuesare Y and N . The default is N.
Number of Rows To DownloadThis controls the number of rows that are downloaded to Excelwhen a user presses the Excel download button in a zone. Thedefault is 1000.
This parameter is only applicable to cube explorers, detail dataexplorers, and top X zones.
Zone Refresh RateThis controls if and how frequently the zone's data isautomatically refreshed by the system. The value is defined inminutes.
Valid values are 0 to 60 where 0 means the zone is onlyrefreshed manually (by a user). The default is 0.
Traffic Light Zone Parameters
The following table describes the parameters that control traffic light zones.
Note: General parameters. The general listing of parameters describes additional parameters.
Parm Type Description
Color ControlThis parameter controls how the traffic light color isderived. This parameter is entered in the format kpi=KPIyellowrange=LOWVAL:HIGHVAL underlow=RED/GREEN where:
- KPI references the field whose value determines the color ofthe traffic light. The following fields can be referenced:
Mx . For example, M1 holds the first measurement.
Nx . These fields contain the number of the fact / goal rows thatwere used to derive a measurement. For example, N1 holds thenumber of fact rows used to derive the first measurement.
Vx . For example, V1 holds the first calculated value.
- LOWVAL and HIGHVAL reference the fields holding the rangeof values that cause the traffic light to be yellow (inclusive).You can reference any measurement, measurement count,or calculated value as defined above. You can also referencenumeric constants.
- RED/GREEN defines the color of the traffic light if the KPI is <the LOWVAL. You can enter a value of R (red) or G (green).
The following are examples:
kpi=V1 yellowrange=V2:V3 underlow=R
kpi=V1 yellowrange=80:90 underlow=G
Traffic Light Hover TextWhen a user hovers over a traffic light, a message appearsdescribing how the traffic light color was derived. You use thisparameter to define what is shown in the hover text.
There are two ways to define what is shown:
You can reference a message category and number and definethe fields that are substituted into its substitution placeholders.
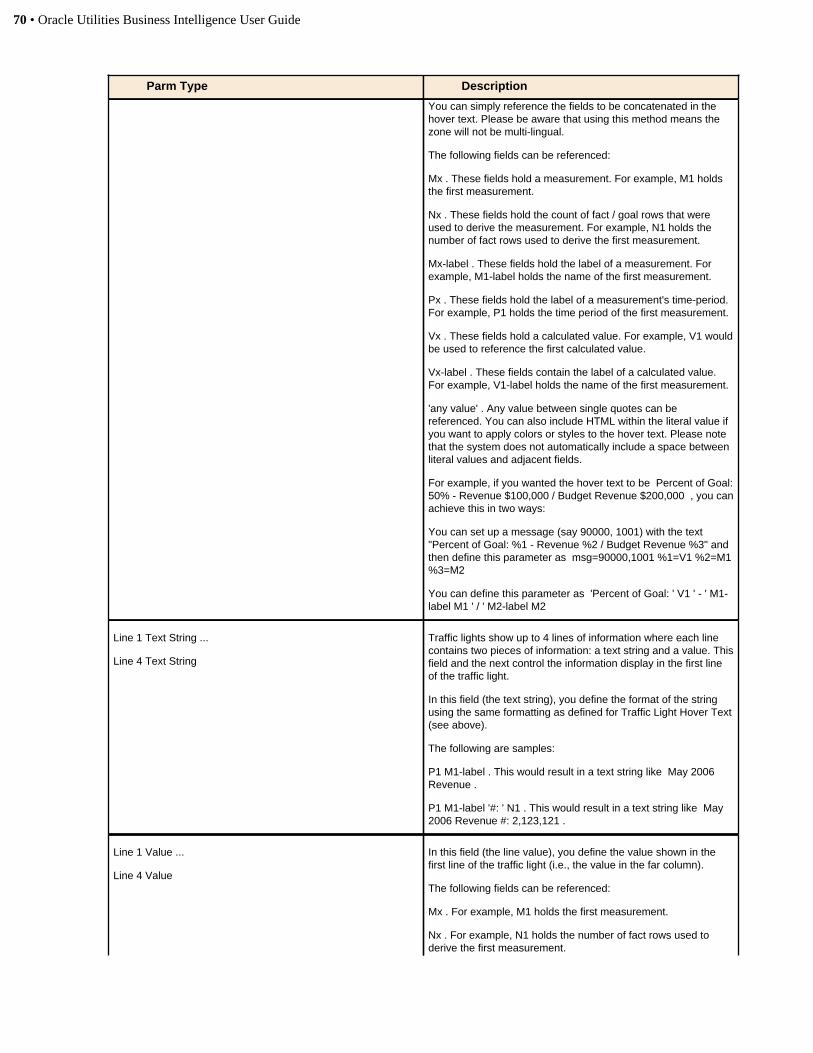
70 • Oracle Utilities Business Intelligence User Guide
Parm Type Description
You can simply reference the fields to be concatenated in thehover text. Please be aware that using this method means thezone will not be multi-lingual.
The following fields can be referenced:
Mx . These fields hold a measurement. For example, M1 holdsthe first measurement.
Nx . These fields hold the count of fact / goal rows that wereused to derive the measurement. For example, N1 holds thenumber of fact rows used to derive the first measurement.
Mx-label . These fields hold the label of a measurement. Forexample, M1-label holds the name of the first measurement.
Px . These fields hold the label of a measurement's time-period.For example, P1 holds the time period of the first measurement.
Vx . These fields hold a calculated value. For example, V1 wouldbe used to reference the first calculated value.
Vx-label . These fields contain the label of a calculated value.For example, V1-label holds the name of the first measurement.
'any value' . Any value between single quotes can bereferenced. You can also include HTML within the literal value ifyou want to apply colors or styles to the hover text. Please notethat the system does not automatically include a space betweenliteral values and adjacent fields.
For example, if you wanted the hover text to be Percent of Goal:50% - Revenue $100,000 / Budget Revenue $200,000 , you canachieve this in two ways:
You can set up a message (say 90000, 1001) with the text"Percent of Goal: %1 - Revenue %2 / Budget Revenue %3" andthen define this parameter as msg=90000,1001 %1=V1 %2=M1%3=M2
You can define this parameter as 'Percent of Goal: ' V1 ' - ' M1-label M1 ' / ' M2-label M2
Line 1 Text String ...
Line 4 Text String
Traffic lights show up to 4 lines of information where each linecontains two pieces of information: a text string and a value. Thisfield and the next control the information display in the first lineof the traffic light.
In this field (the text string), you define the format of the stringusing the same formatting as defined for Traffic Light Hover Text(see above).
The following are samples:
P1 M1-label . This would result in a text string like May 2006Revenue .
P1 M1-label '#: ' N1 . This would result in a text string like May2006 Revenue #: 2,123,121 .
Line 1 Value ...
Line 4 Value
In this field (the line value), you define the value shown in thefirst line of the traffic light (i.e., the value in the far column).
The following fields can be referenced:
Mx . For example, M1 holds the first measurement.
Nx . For example, N1 holds the number of fact rows used toderive the first measurement.
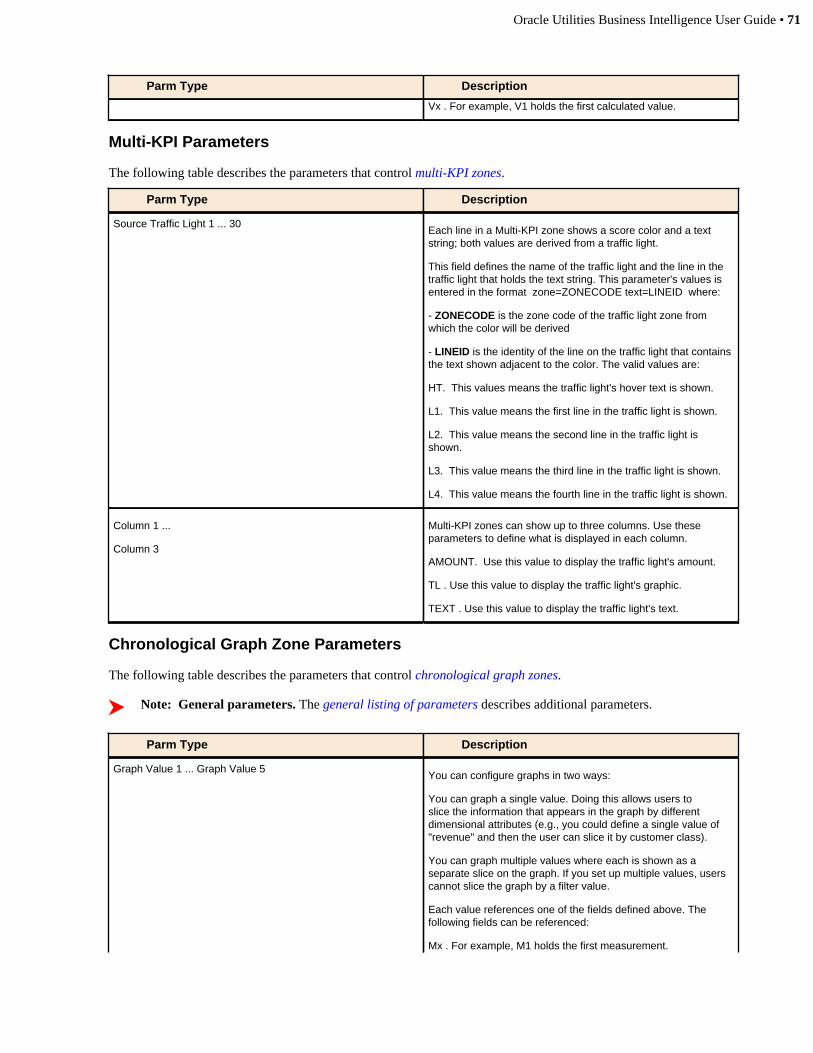
Oracle Utilities Business Intelligence User Guide • 71
Parm Type Description
Vx . For example, V1 holds the first calculated value.
Multi-KPI Parameters
The following table describes the parameters that control multi-KPI zones.
Parm Type Description
Source Traffic Light 1 ... 30Each line in a Multi-KPI zone shows a score color and a textstring; both values are derived from a traffic light.
This field defines the name of the traffic light and the line in thetraffic light that holds the text string. This parameter's values isentered in the format zone=ZONECODE text=LINEID where:
- ZONECODE is the zone code of the traffic light zone fromwhich the color will be derived
- LINEID is the identity of the line on the traffic light that containsthe text shown adjacent to the color. The valid values are:
HT. This values means the traffic light's hover text is shown.
L1. This value means the first line in the traffic light is shown.
L2. This value means the second line in the traffic light isshown.
L3. This value means the third line in the traffic light is shown.
L4. This value means the fourth line in the traffic light is shown.
Column 1 ...
Column 3
Multi-KPI zones can show up to three columns. Use theseparameters to define what is displayed in each column.
AMOUNT. Use this value to display the traffic light's amount.
TL . Use this value to display the traffic light's graphic.
TEXT . Use this value to display the traffic light's text.
Chronological Graph Zone Parameters
The following table describes the parameters that control chronological graph zones.
Note: General parameters. The general listing of parameters describes additional parameters.
Parm Type Description
Graph Value 1 ... Graph Value 5You can configure graphs in two ways:
You can graph a single value. Doing this allows users toslice the information that appears in the graph by differentdimensional attributes (e.g., you could define a single value of"revenue" and then the user can slice it by customer class).
You can graph multiple values where each is shown as aseparate slice on the graph. If you set up multiple values, userscannot slice the graph by a filter value.
Each value references one of the fields defined above. Thefollowing fields can be referenced:
Mx . For example, M1 holds the first measurement.

72 • Oracle Utilities Business Intelligence User Guide
Parm Type Description
Nx . For example, N1 holds the number of fact rows used toderive the first measurement.
Vx . For example, V1 holds the first calculated value.
Value 1 Override Legend Text ...
Value 5 Override Legend Text
Graphs contain a legend that describes what the slices mean.You can use this parameter to override the contents of thelegend.
If you leave this field blank, the legend is constructed as follows:
If a single measure is graphed and it is not sliced, no legendappears.
If a single measure is graphed and it is sliced, the legendcontains the description of the sliced values.
If multiple measures are graphed, the legend contains the labelof each graphed value.
If you specify an override legend text value, it is entered in thesame fashion described for Traffic Light Hover Text. The onlydifference is that you can also reference S-label to define if /where the sliced value appears in the legend. For example, youcould enter M1-label to show the label of the first measure.
Value 1 Override Hover Text ...
Value 5 Override Hover Text
When a user hovers over a segment of a graph, hover textappears to provide details of the section of the graph. You usethis parameter to override the contents of the hover text.
If you leave this field blank, the hover text is constructed asfollows:
If a single measure is graphed and it is not sliced, the hovertext contains the period, the label of the graphed value and thevalue.
If a single measure is graphed and it is sliced, the hover textcontains the period, the sliced value's description, and the valuefor each slice.
If multiple measures are graphed, the hover text contains theperiod, the label of each graphed value, and its value.
If you specify an override hover text value, it is entered in thesame fashion described for Traffic Light Hover Text. The onlydifferences are:
You can also reference S-label to define if / where the slicedvalue appears in the legend.
The hover text is always prefixed with the description of theperiod.
For example, you could enter M1-label M1 to show the labeland amount of the first measure.
Target ValueIf you want a target line to appear on the graph, enter themeasurement or value. If you don't want a target line, leave thisparameter blank.
The following fields can be referenced:
Mx . For example, M1 holds the first measurement.
Nx . These fields contain the number of the fact / goal rows thatwere used to derive a measurement. For example, N1 holds thenumber of fact rows used to derive the first measurement.
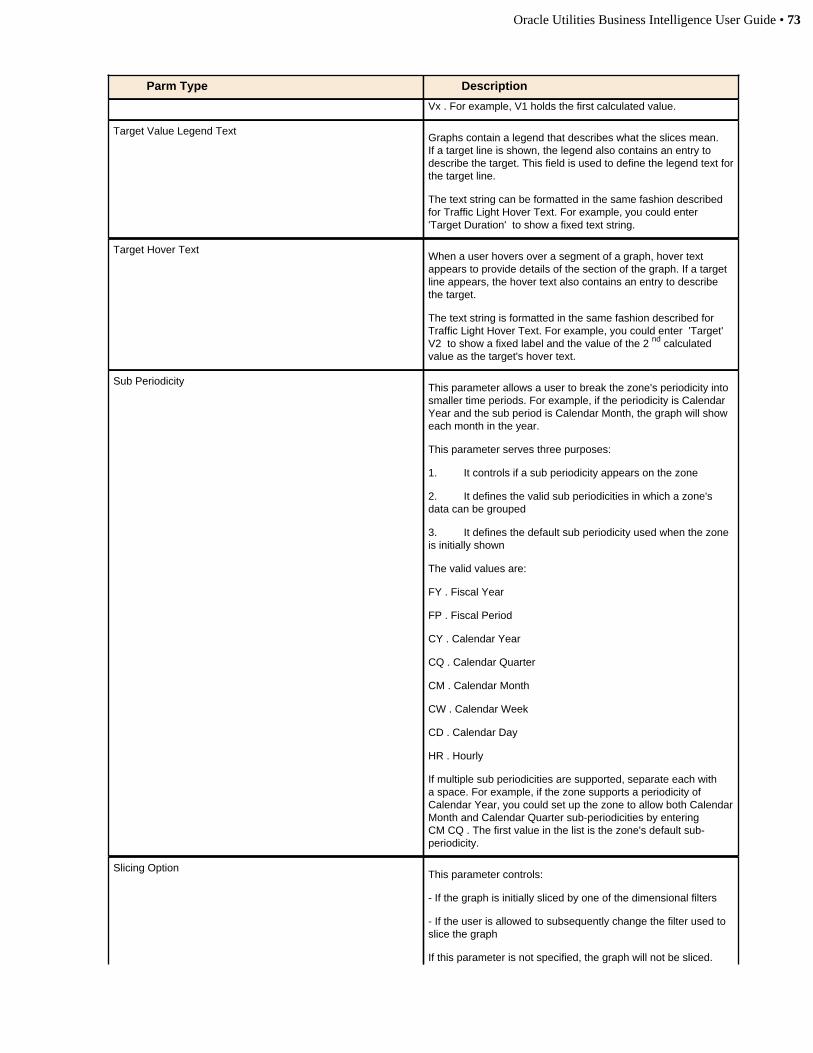
Oracle Utilities Business Intelligence User Guide • 73
Parm Type Description
Vx . For example, V1 holds the first calculated value.
Target Value Legend TextGraphs contain a legend that describes what the slices mean.If a target line is shown, the legend also contains an entry todescribe the target. This field is used to define the legend text forthe target line.
The text string can be formatted in the same fashion describedfor Traffic Light Hover Text. For example, you could enter 'Target Duration' to show a fixed text string.
Target Hover TextWhen a user hovers over a segment of a graph, hover textappears to provide details of the section of the graph. If a targetline appears, the hover text also contains an entry to describethe target.
The text string is formatted in the same fashion described forTraffic Light Hover Text. For example, you could enter 'Target'V2 to show a fixed label and the value of the 2 nd calculatedvalue as the target's hover text.
Sub PeriodicityThis parameter allows a user to break the zone's periodicity intosmaller time periods. For example, if the periodicity is CalendarYear and the sub period is Calendar Month, the graph will showeach month in the year.
This parameter serves three purposes:
1. It controls if a sub periodicity appears on the zone
2. It defines the valid sub periodicities in which a zone'sdata can be grouped
3. It defines the default sub periodicity used when the zoneis initially shown
The valid values are:
FY . Fiscal Year
FP . Fiscal Period
CY . Calendar Year
CQ . Calendar Quarter
CM . Calendar Month
CW . Calendar Week
CD . Calendar Day
HR . Hourly
If multiple sub periodicities are supported, separate each witha space. For example, if the zone supports a periodicity ofCalendar Year, you could set up the zone to allow both CalendarMonth and Calendar Quarter sub-periodicities by entering CM CQ . The first value in the list is the zone's default sub-periodicity.
Slicing OptionThis parameter controls:
- If the graph is initially sliced by one of the dimensional filters
- If the user is allowed to subsequently change the filter used toslice the graph
If this parameter is not specified, the graph will not be sliced.
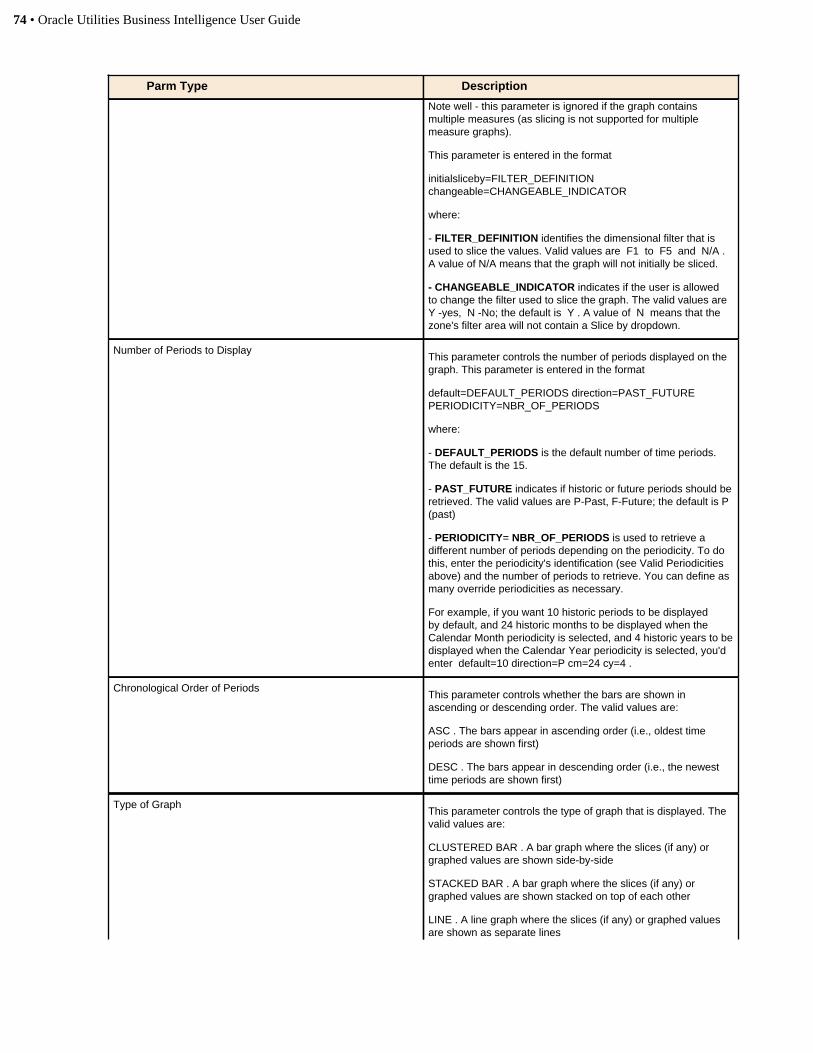
74 • Oracle Utilities Business Intelligence User Guide
Parm Type Description
Note well - this parameter is ignored if the graph containsmultiple measures (as slicing is not supported for multiplemeasure graphs).
This parameter is entered in the format
initialsliceby=FILTER_DEFINITIONchangeable=CHANGEABLE_INDICATOR
where:
- FILTER_DEFINITION identifies the dimensional filter that isused to slice the values. Valid values are F1 to F5 and N/A .A value of N/A means that the graph will not initially be sliced.
- CHANGEABLE_INDICATOR indicates if the user is allowedto change the filter used to slice the graph. The valid values are Y -yes, N -No; the default is Y . A value of N means that thezone's filter area will not contain a Slice by dropdown.
Number of Periods to DisplayThis parameter controls the number of periods displayed on thegraph. This parameter is entered in the format
default=DEFAULT_PERIODS direction=PAST_FUTUREPERIODICITY=NBR_OF_PERIODS
where:
- DEFAULT_PERIODS is the default number of time periods.The default is the 15.
- PAST_FUTURE indicates if historic or future periods should beretrieved. The valid values are P-Past, F-Future; the default is P(past)
- PERIODICITY= NBR_OF_PERIODS is used to retrieve adifferent number of periods depending on the periodicity. To dothis, enter the periodicity's identification (see Valid Periodicitiesabove) and the number of periods to retrieve. You can define asmany override periodicities as necessary.
For example, if you want 10 historic periods to be displayedby default, and 24 historic months to be displayed when theCalendar Month periodicity is selected, and 4 historic years to bedisplayed when the Calendar Year periodicity is selected, you'denter default=10 direction=P cm=24 cy=4 .
Chronological Order of PeriodsThis parameter controls whether the bars are shown inascending or descending order. The valid values are:
ASC . The bars appear in ascending order (i.e., oldest timeperiods are shown first)
DESC . The bars appear in descending order (i.e., the newesttime periods are shown first)
Type of GraphThis parameter controls the type of graph that is displayed. Thevalid values are:
CLUSTERED BAR . A bar graph where the slices (if any) orgraphed values are shown side-by-side
STACKED BAR . A bar graph where the slices (if any) orgraphed values are shown stacked on top of each other
LINE . A line graph where the slices (if any) or graphed valuesare shown as separate lines

Oracle Utilities Business Intelligence User Guide • 75
Parm Type Description
BUBBLE . A bubble graph where the slices (if any) or graphedvalues are shown as separate bubbles where the size of thebubble is related to the relative number of facts retrieved.
Display a 3D Graph?This parameter controls whether or not the graph is displayed in3D. Valid entries are Y (yes) and N (no).
It is recommended that you do not use 3D if you use a targetline. The target line will also be shown in 3D and this can bedifficult to read.
Animate the Graph? This parameter controls if the graph is "animated." The validvalues are Y and N .
Override LabelsThese parameters can be used to override the default labelsused on a graph. For each, enter a field name or a text string insingle quotes to display the description for that field as the labeltext.
Use Override Others Label to override the labelthat appears in the legend and hover text if a graph with a singlevalue is sliced by a dimension that has more than 5 values.
Use Override Total Label to override the label thatappears by the total amount (totals only appear in the hover textif the graph has a single value and it is not sliced by a user).
Report Graph Zone Parameters
The following table describes the parameters that control report graph zones.
Note: General parameters. The general listing of parameters describes additional parameters.
Parm Type Description
Graph Value 1 ... Graph Value 5You can configure graphs in two ways:
You can define a single value. Doing this allows users toslice the information that appears in the graph by differentdimensional attributes (e.g., you could define a single value of"revenue" and then the user can slice it by customer class).
You can define multiple values where each is shown as aseparate slice on the graph. If you set up multiple values, userscannot slice the graph by a filter value.
Each value references one of the fields defined above. Thefollowing fields can be referenced:
Mx . For example, M1 holds the first measurement.
Nx . For example, N1 holds the number of fact rows used toderive the first measurement.
Vx . For example, V1 holds the first calculated value.
Value 1 Override Legend Text ...
Value 5 Override Legend Text
Graphs contain a legend that describes what the slices mean.You can use this parameter to override the contents of thelegend.
If you leave this field blank, the legend is constructed as follows:
If a single measure is graphed and it is not sliced, no legendappears.
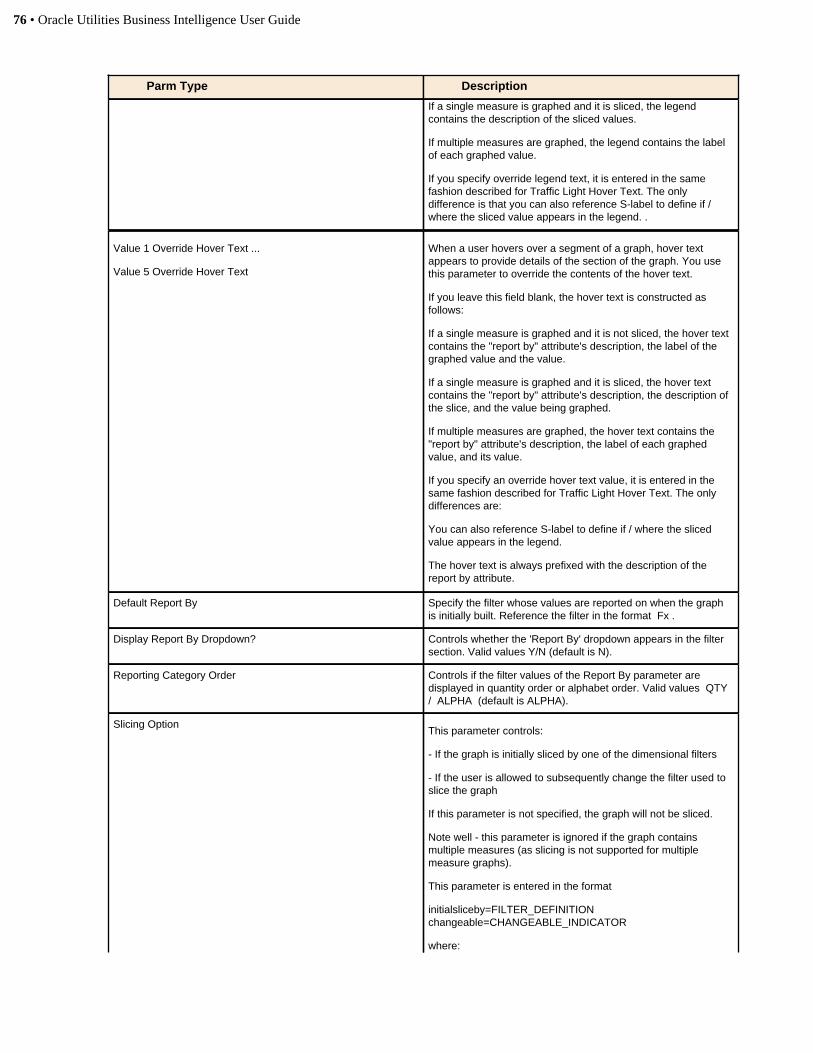
76 • Oracle Utilities Business Intelligence User Guide
Parm Type Description
If a single measure is graphed and it is sliced, the legendcontains the description of the sliced values.
If multiple measures are graphed, the legend contains the labelof each graphed value.
If you specify override legend text, it is entered in the samefashion described for Traffic Light Hover Text. The onlydifference is that you can also reference S-label to define if /where the sliced value appears in the legend. .
Value 1 Override Hover Text ...
Value 5 Override Hover Text
When a user hovers over a segment of a graph, hover textappears to provide details of the section of the graph. You usethis parameter to override the contents of the hover text.
If you leave this field blank, the hover text is constructed asfollows:
If a single measure is graphed and it is not sliced, the hover textcontains the "report by" attribute's description, the label of thegraphed value and the value.
If a single measure is graphed and it is sliced, the hover textcontains the "report by" attribute's description, the description ofthe slice, and the value being graphed.
If multiple measures are graphed, the hover text contains the"report by" attribute's description, the label of each graphedvalue, and its value.
If you specify an override hover text value, it is entered in thesame fashion described for Traffic Light Hover Text. The onlydifferences are:
You can also reference S-label to define if / where the slicedvalue appears in the legend.
The hover text is always prefixed with the description of thereport by attribute.
Default Report By Specify the filter whose values are reported on when the graphis initially built. Reference the filter in the format Fx .
Display Report By Dropdown? Controls whether the 'Report By' dropdown appears in the filtersection. Valid values Y/N (default is N).
Reporting Category Order Controls if the filter values of the Report By parameter aredisplayed in quantity order or alphabet order. Valid values QTY / ALPHA (default is ALPHA).
Slicing OptionThis parameter controls:
- If the graph is initially sliced by one of the dimensional filters
- If the user is allowed to subsequently change the filter used toslice the graph
If this parameter is not specified, the graph will not be sliced.
Note well - this parameter is ignored if the graph containsmultiple measures (as slicing is not supported for multiplemeasure graphs).
This parameter is entered in the format
initialsliceby=FILTER_DEFINITIONchangeable=CHANGEABLE_INDICATOR
where:

Oracle Utilities Business Intelligence User Guide • 77
Parm Type Description
- FILTER_DEFINITION identifies the dimensional filter that isused to slice the values. Valid values are F1 to F5 and N/A .A value of N/A means that the graph will not initially be sliced.
- CHANGEABLE_INDICATOR indicates if the user is allowedto change the filter used to slice the graph. The valid values are Y -yes, N -No; the default is Y . A value of N means that thezone's filter area will not contain a Slice by dropdown.
Type of GraphThis parameter controls the type of graph that is displayed. Thevalid values are:
CLUSTERED BAR . A bar graph where the slices (if any) orgraphed values are shown side-by-side
STACKED BAR . A bar graph where the slices (if any) orgraphed values are shown stacked on top of each other
Display a 3D Graph?This parameter controls whether or not the graph is displayed in3D. Valid entries are Y (yes) and N (no).
It is recommended that you do not use 3D if you use a targetline. The target line will also be shown in 3D and this can bedifficult to read.
Animate the Graph? This parameter controls if the graph is "animated" (it's hard toexplain, try it and see if you like the effect). The value values areY and N .
Override LabelsThese parameters can be used to override the default labelsused on a graph. For each, enter a field name or text string insingle quotes to display the description for that field as the labeltext.
Use Override Others Label to override the labelthat appears by the other amount (the "others" label onlyappears if a user slices by a dimension that has more than 5values).
Use Override Total Label to override the label thatappears by the total amount (totals only appear if the graph hasa single Graph Value and is not sliced by a user).
Dimensional Scorecard Zone Parameters
The following table describes the parameters that control dimensional scorecards zones.
Note: General parameters. The general listing of parameters describes additional parameters.
Parm Type Description
Dimensional Attributes 1 through 5These dimensional attributes define the combination ofdimensions that are "scored" by this zone. You may define up tofive dimensional attributes (and at least one is required).
We'll use an example to explain these attributes - if you wantto score revenue for every combination of customer class,jurisdiction and service type; you'd define three dimensionalattributes on the revenue scorecard zone.
All filters are defined in the format TABLE.COLUMN. Forexample, if customer class is held in the first user-definedfield (UDF) in the account dimension, you would enter CD_ACCT.UDF1_CD in the first filter.
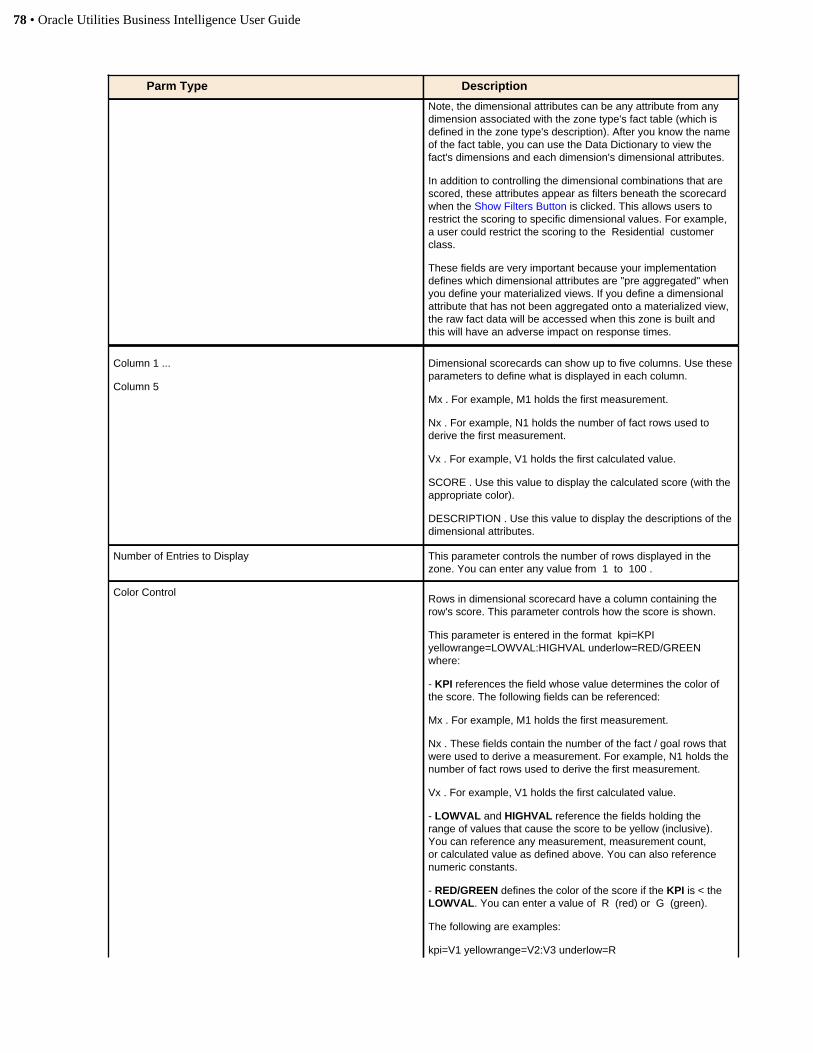
78 • Oracle Utilities Business Intelligence User Guide
Parm Type Description
Note, the dimensional attributes can be any attribute from anydimension associated with the zone type's fact table (which isdefined in the zone type's description). After you know the nameof the fact table, you can use the Data Dictionary to view thefact's dimensions and each dimension's dimensional attributes.
In addition to controlling the dimensional combinations that arescored, these attributes appear as filters beneath the scorecardwhen the Show Filters Button is clicked. This allows users torestrict the scoring to specific dimensional values. For example,a user could restrict the scoring to the Residential customerclass.
These fields are very important because your implementationdefines which dimensional attributes are "pre aggregated" whenyou define your materialized views. If you define a dimensionalattribute that has not been aggregated onto a materialized view,the raw fact data will be accessed when this zone is built andthis will have an adverse impact on response times.
Column 1 ...
Column 5
Dimensional scorecards can show up to five columns. Use theseparameters to define what is displayed in each column.
Mx . For example, M1 holds the first measurement.
Nx . For example, N1 holds the number of fact rows used toderive the first measurement.
Vx . For example, V1 holds the first calculated value.
SCORE . Use this value to display the calculated score (with theappropriate color).
DESCRIPTION . Use this value to display the descriptions of thedimensional attributes.
Number of Entries to Display This parameter controls the number of rows displayed in thezone. You can enter any value from 1 to 100 .
Color ControlRows in dimensional scorecard have a column containing therow's score. This parameter controls how the score is shown.
This parameter is entered in the format kpi=KPIyellowrange=LOWVAL:HIGHVAL underlow=RED/GREEN where:
- KPI references the field whose value determines the color ofthe score. The following fields can be referenced:
Mx . For example, M1 holds the first measurement.
Nx . These fields contain the number of the fact / goal rows thatwere used to derive a measurement. For example, N1 holds thenumber of fact rows used to derive the first measurement.
Vx . For example, V1 holds the first calculated value.
- LOWVAL and HIGHVAL reference the fields holding therange of values that cause the score to be yellow (inclusive).You can reference any measurement, measurement count,or calculated value as defined above. You can also referencenumeric constants.
- RED/GREEN defines the color of the score if the KPI is < theLOWVAL. You can enter a value of R (red) or G (green).
The following are examples:
kpi=V1 yellowrange=V2:V3 underlow=R

Oracle Utilities Business Intelligence User Guide • 79
Parm Type Description
kpi=V1 yellowrange=80:90 underlow=G
Score Hover Text When a user hovers over a score, a message appearsdescribing how the score is derived. You use this parameterto define what is shown in the hover text. See the Traffic LightHover Text for a description of the possible formats.
Show Worst First? This controls if the worst dimensional combinations are shownfirst (or last). If you'd like the worst combinations to appear first,enter Y; otherwise enter N. The default is Y.
Override Score, DescriptionThese parameters allow you to override the default headings forthe Score and Description headings.
Enter a field name or text string in single quotes to display thedescription for that field as the heading text.
Cube Explorer Zone Parameters
The following table describes the parameters that control cube explorer zones.
Note: General parameters. The general listing of parameters describes additional parameters.
Parm Type Description
Dimensional Filter 1 ...
Dimensional Filter 20
Cube explorers support 20 dimensional filters. See GeneralZone Parameters for the format.
Measure 1 through 10The following additional mnemonics are supported for measures:
The order= mnemonic defines the column's default sortorder. The valid values are ASC and DESC (ascending anddescending). ASC is the default.
The bgcolor= mnemonic defines the override backgroundcolor of a cell. The color value can be either explicitly declaredusing either an HTML color (e.g., red, yellow, green, etc) or anRGB combination (e.g., #FF0000, #CCCCCC, etc) or derivedby invoking a service script (where the service script returnseither an HTML color or an RGB combination). If a service scriptis used, it should be defined in quotes and the input= and output= mnemonics should be defined.
The input= mnemonic is used when a service script isinvoked to return the override background color of a cell(i.e., when bgcolor='service script' is used). The value isdefined in the format [ELEMENT_NAME=ELEMENT_REFELEMENT_NAME=ELEMENT_REF] where:
ELEMENT_NAME is the name of the element / field passed tothe service script
ELEMENT_REF is the value of the element / field passed to thefield. ELEMENT_REF may reference any of the following:
o Cx . These fields hold a value definedin an earlier column. For example, C1 holds the first column'svalue.
o Mx . These fields hold a value defined ina Measure. For example, M1 holds the first measure's value.
o Nx . These fields contain the number ofthe fact / goal rows that were used to derive the measure. For
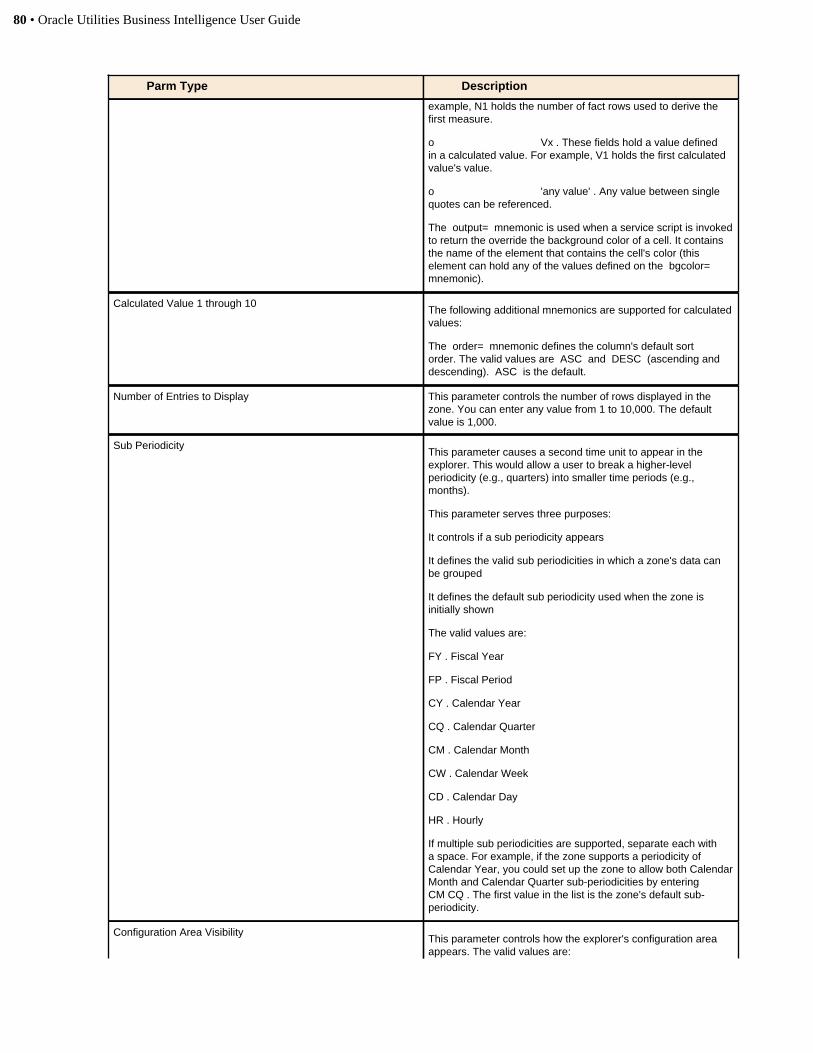
80 • Oracle Utilities Business Intelligence User Guide
Parm Type Description
example, N1 holds the number of fact rows used to derive thefirst measure.
o Vx . These fields hold a value definedin a calculated value. For example, V1 holds the first calculatedvalue's value.
o 'any value' . Any value between singlequotes can be referenced.
The output= mnemonic is used when a service script is invokedto return the override the background color of a cell. It containsthe name of the element that contains the cell's color (thiselement can hold any of the values defined on the bgcolor= mnemonic).
Calculated Value 1 through 10The following additional mnemonics are supported for calculatedvalues:
The order= mnemonic defines the column's default sortorder. The valid values are ASC and DESC (ascending anddescending). ASC is the default.
Number of Entries to Display This parameter controls the number of rows displayed in thezone. You can enter any value from 1 to 10,000. The defaultvalue is 1,000.
Sub PeriodicityThis parameter causes a second time unit to appear in theexplorer. This would allow a user to break a higher-levelperiodicity (e.g., quarters) into smaller time periods (e.g.,months).
This parameter serves three purposes:
It controls if a sub periodicity appears
It defines the valid sub periodicities in which a zone's data canbe grouped
It defines the default sub periodicity used when the zone isinitially shown
The valid values are:
FY . Fiscal Year
FP . Fiscal Period
CY . Calendar Year
CQ . Calendar Quarter
CM . Calendar Month
CW . Calendar Week
CD . Calendar Day
HR . Hourly
If multiple sub periodicities are supported, separate each witha space. For example, if the zone supports a periodicity ofCalendar Year, you could set up the zone to allow both CalendarMonth and Calendar Quarter sub-periodicities by entering CM CQ . The first value in the list is the zone's default sub-periodicity.
Configuration Area VisibilityThis parameter controls how the explorer's configuration areaappears. The valid values are:
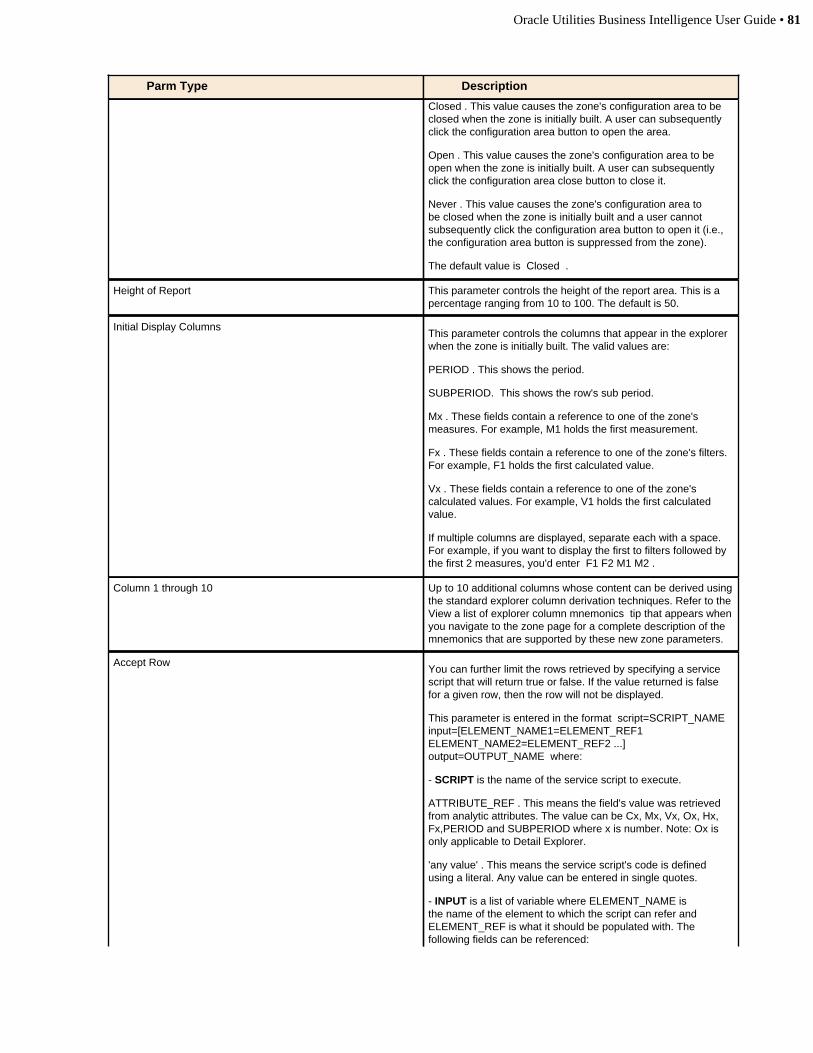
Oracle Utilities Business Intelligence User Guide • 81
Parm Type Description
Closed . This value causes the zone's configuration area to beclosed when the zone is initially built. A user can subsequentlyclick the configuration area button to open the area.
Open . This value causes the zone's configuration area to beopen when the zone is initially built. A user can subsequentlyclick the configuration area close button to close it.
Never . This value causes the zone's configuration area tobe closed when the zone is initially built and a user cannotsubsequently click the configuration area button to open it (i.e.,the configuration area button is suppressed from the zone).
The default value is Closed .
Height of Report This parameter controls the height of the report area. This is apercentage ranging from 10 to 100. The default is 50.
Initial Display ColumnsThis parameter controls the columns that appear in the explorerwhen the zone is initially built. The valid values are:
PERIOD . This shows the period.
SUBPERIOD. This shows the row's sub period.
Mx . These fields contain a reference to one of the zone'smeasures. For example, M1 holds the first measurement.
Fx . These fields contain a reference to one of the zone's filters.For example, F1 holds the first calculated value.
Vx . These fields contain a reference to one of the zone'scalculated values. For example, V1 holds the first calculatedvalue.
If multiple columns are displayed, separate each with a space.For example, if you want to display the first to filters followed bythe first 2 measures, you'd enter F1 F2 M1 M2 .
Column 1 through 10 Up to 10 additional columns whose content can be derived usingthe standard explorer column derivation techniques. Refer to theView a list of explorer column mnemonics tip that appears whenyou navigate to the zone page for a complete description of themnemonics that are supported by these new zone parameters.
Accept RowYou can further limit the rows retrieved by specifying a servicescript that will return true or false. If the value returned is falsefor a given row, then the row will not be displayed.
This parameter is entered in the format script=SCRIPT_NAMEinput=[ELEMENT_NAME1=ELEMENT_REF1ELEMENT_NAME2=ELEMENT_REF2 ...]output=OUTPUT_NAME where:
- SCRIPT is the name of the service script to execute.
ATTRIBUTE_REF . This means the field's value was retrievedfrom analytic attributes. The value can be Cx, Mx, Vx, Ox, Hx,Fx,PERIOD and SUBPERIOD where x is number. Note: Ox isonly applicable to Detail Explorer.
'any value' . This means the service script's code is definedusing a literal. Any value can be entered in single quotes.
- INPUT is a list of variable where ELEMENT_NAME isthe name of the element to which the script can refer andELEMENT_REF is what it should be populated with. Thefollowing fields can be referenced:
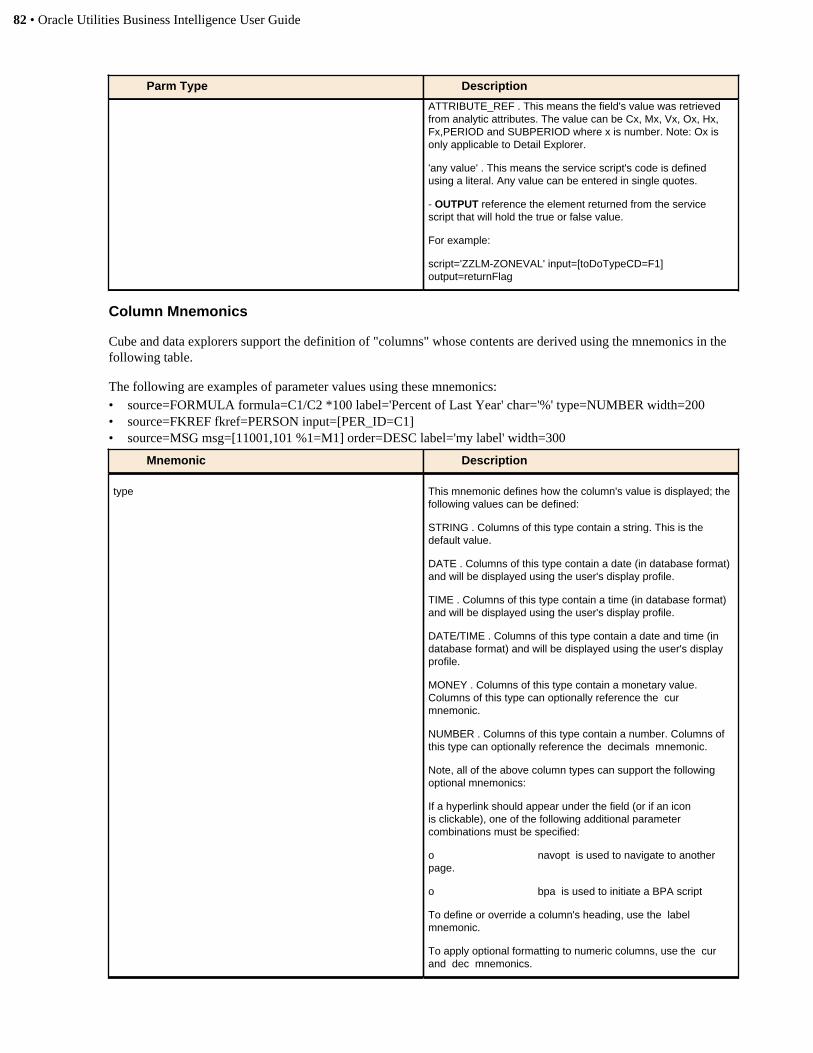
82 • Oracle Utilities Business Intelligence User Guide
Parm Type Description
ATTRIBUTE_REF . This means the field's value was retrievedfrom analytic attributes. The value can be Cx, Mx, Vx, Ox, Hx,Fx,PERIOD and SUBPERIOD where x is number. Note: Ox isonly applicable to Detail Explorer.
'any value' . This means the service script's code is definedusing a literal. Any value can be entered in single quotes.
- OUTPUT reference the element returned from the servicescript that will hold the true or false value.
For example:
script='ZZLM-ZONEVAL' input=[toDoTypeCD=F1]output=returnFlag
Column Mnemonics
Cube and data explorers support the definition of "columns" whose contents are derived using the mnemonics in thefollowing table.
The following are examples of parameter values using these mnemonics:• source=FORMULA formula=C1/C2 *100 label='Percent of Last Year' char='%' type=NUMBER width=200• source=FKREF fkref=PERSON input=[PER_ID=C1]• source=MSG msg=[11001,101 %1=M1] order=DESC label='my label' width=300
Mnemonic Description
type
This mnemonic defines how the column's value is displayed; thefollowing values can be defined:
STRING . Columns of this type contain a string. This is thedefault value.
DATE . Columns of this type contain a date (in database format)and will be displayed using the user's display profile.
TIME . Columns of this type contain a time (in database format)and will be displayed using the user's display profile.
DATE/TIME . Columns of this type contain a date and time (indatabase format) and will be displayed using the user's displayprofile.
MONEY . Columns of this type contain a monetary value.Columns of this type can optionally reference the cur mnemonic.
NUMBER . Columns of this type contain a number. Columns ofthis type can optionally reference the decimals mnemonic.
Note, all of the above column types can support the followingoptional mnemonics:
If a hyperlink should appear under the field (or if an iconis clickable), one of the following additional parametercombinations must be specified:
o navopt is used to navigate to anotherpage.
o bpa is used to initiate a BPA script
To define or override a column's heading, use the label mnemonic.
To apply optional formatting to numeric columns, use the cur and dec mnemonics.
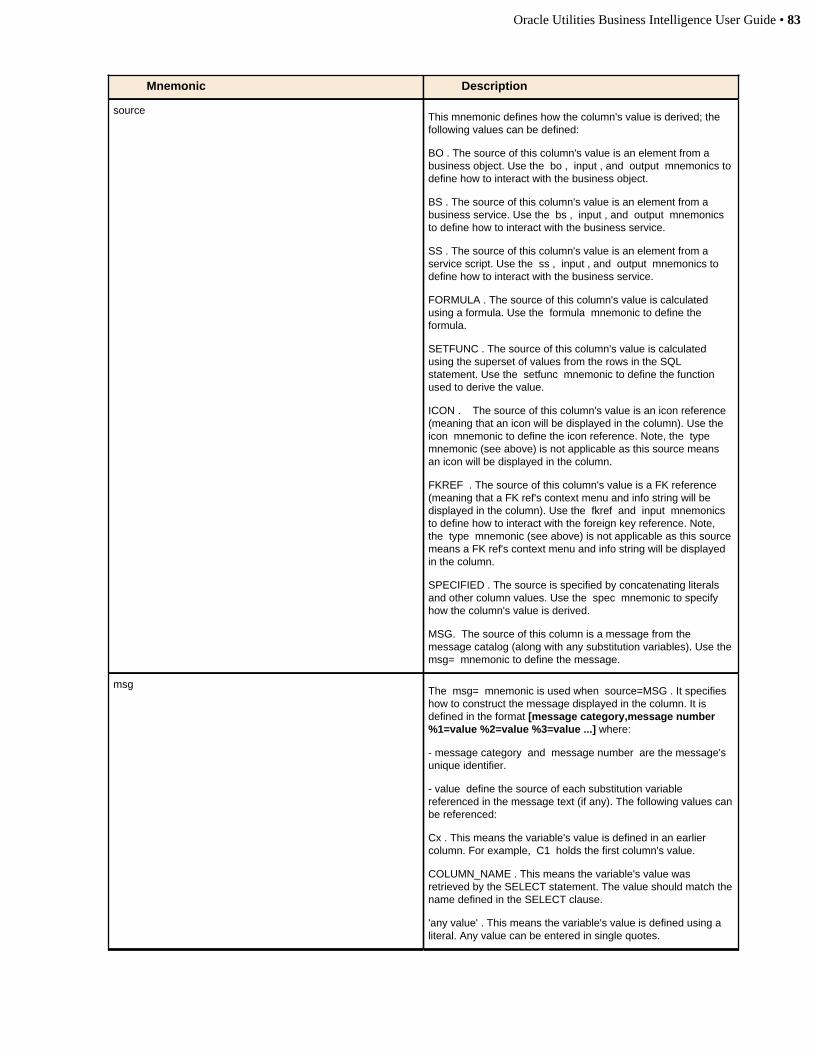
Oracle Utilities Business Intelligence User Guide • 83
Mnemonic Description
sourceThis mnemonic defines how the column's value is derived; thefollowing values can be defined:
BO . The source of this column's value is an element from abusiness object. Use the bo , input , and output mnemonics todefine how to interact with the business object.
BS . The source of this column's value is an element from abusiness service. Use the bs , input , and output mnemonicsto define how to interact with the business service.
SS . The source of this column's value is an element from aservice script. Use the ss , input , and output mnemonics todefine how to interact with the business service.
FORMULA . The source of this column's value is calculatedusing a formula. Use the formula mnemonic to define theformula.
SETFUNC . The source of this column's value is calculatedusing the superset of values from the rows in the SQLstatement. Use the setfunc mnemonic to define the functionused to derive the value.
ICON . The source of this column's value is an icon reference(meaning that an icon will be displayed in the column). Use the icon mnemonic to define the icon reference. Note, the type mnemonic (see above) is not applicable as this source meansan icon will be displayed in the column.
FKREF . The source of this column's value is a FK reference(meaning that a FK ref's context menu and info string will bedisplayed in the column). Use the fkref and input mnemonicsto define how to interact with the foreign key reference. Note,the type mnemonic (see above) is not applicable as this sourcemeans a FK ref's context menu and info string will be displayedin the column.
SPECIFIED . The source is specified by concatenating literalsand other column values. Use the spec mnemonic to specifyhow the column's value is derived.
MSG. The source of this column is a message from themessage catalog (along with any substitution variables). Use themsg= mnemonic to define the message.
msgThe msg= mnemonic is used when source=MSG . It specifieshow to construct the message displayed in the column. It isdefined in the format [message category,message number%1=value %2=value %3=value ...] where:
- message category and message number are the message'sunique identifier.
- value define the source of each substitution variablereferenced in the message text (if any). The following values canbe referenced:
Cx . This means the variable's value is defined in an earliercolumn. For example, C1 holds the first column's value.
COLUMN_NAME . This means the variable's value wasretrieved by the SELECT statement. The value should match thename defined in the SELECT clause.
'any value' . This means the variable's value is defined using aliteral. Any value can be entered in single quotes.
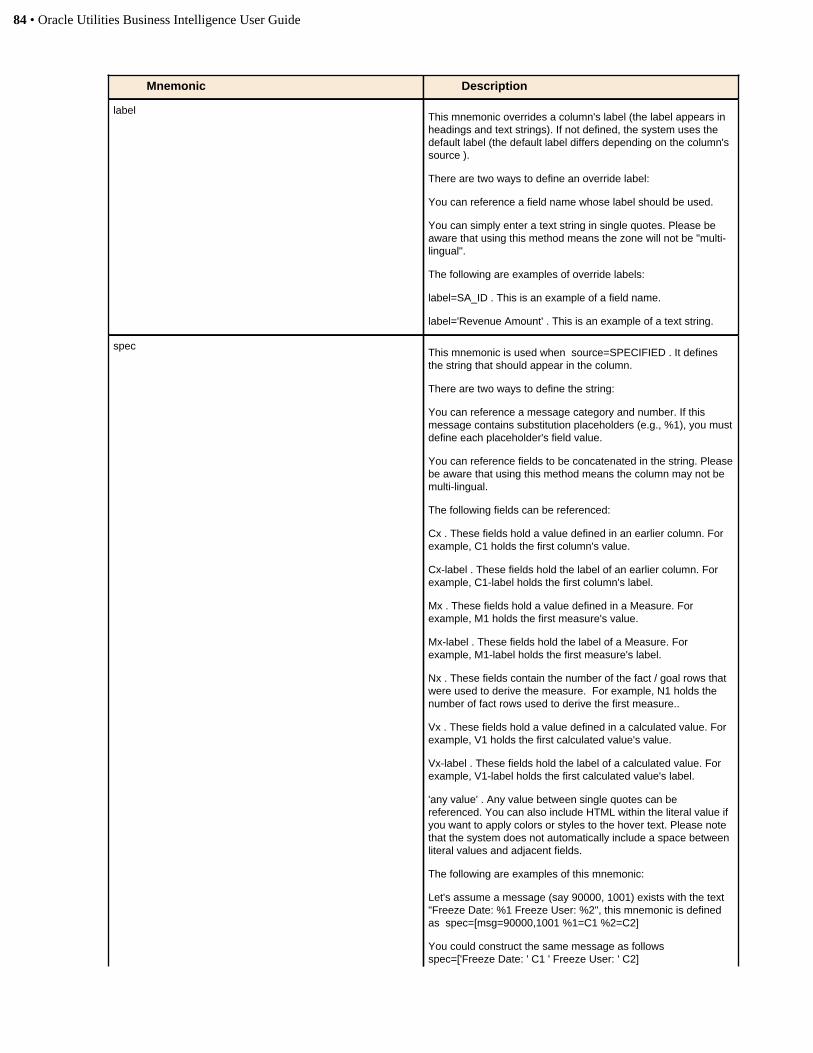
84 • Oracle Utilities Business Intelligence User Guide
Mnemonic Description
labelThis mnemonic overrides a column's label (the label appears inheadings and text strings). If not defined, the system uses thedefault label (the default label differs depending on the column's source ).
There are two ways to define an override label:
You can reference a field name whose label should be used.
You can simply enter a text string in single quotes. Please beaware that using this method means the zone will not be "multi-lingual".
The following are examples of override labels:
label=SA_ID . This is an example of a field name.
label='Revenue Amount' . This is an example of a text string.
specThis mnemonic is used when source=SPECIFIED . It definesthe string that should appear in the column.
There are two ways to define the string:
You can reference a message category and number. If thismessage contains substitution placeholders (e.g., %1), you mustdefine each placeholder's field value.
You can reference fields to be concatenated in the string. Pleasebe aware that using this method means the column may not bemulti-lingual.
The following fields can be referenced:
Cx . These fields hold a value defined in an earlier column. Forexample, C1 holds the first column's value.
Cx-label . These fields hold the label of an earlier column. Forexample, C1-label holds the first column's label.
Mx . These fields hold a value defined in a Measure. Forexample, M1 holds the first measure's value.
Mx-label . These fields hold the label of a Measure. Forexample, M1-label holds the first measure's label.
Nx . These fields contain the number of the fact / goal rows thatwere used to derive the measure. For example, N1 holds thenumber of fact rows used to derive the first measure..
Vx . These fields hold a value defined in a calculated value. Forexample, V1 holds the first calculated value's value.
Vx-label . These fields hold the label of a calculated value. Forexample, V1-label holds the first calculated value's label.
'any value' . Any value between single quotes can bereferenced. You can also include HTML within the literal value ifyou want to apply colors or styles to the hover text. Please notethat the system does not automatically include a space betweenliteral values and adjacent fields.
The following are examples of this mnemonic:
Let's assume a message (say 90000, 1001) exists with the text"Freeze Date: %1 Freeze User: %2", this mnemonic is definedas spec=[msg=90000,1001 %1=C1 %2=C2]
You could construct the same message as follows spec=['Freeze Date: ' C1 ' Freeze User: ' C2]
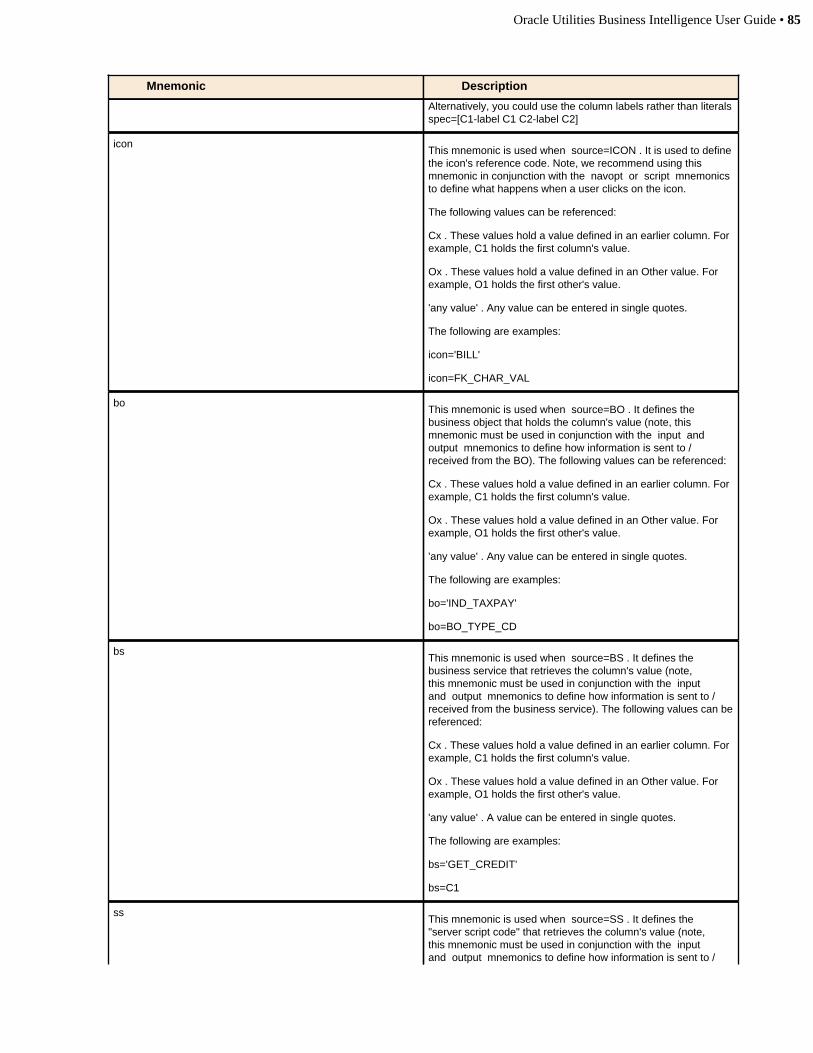
Oracle Utilities Business Intelligence User Guide • 85
Mnemonic Description
Alternatively, you could use the column labels rather than literalsspec=[C1-label C1 C2-label C2]
iconThis mnemonic is used when source=ICON . It is used to definethe icon's reference code. Note, we recommend using thismnemonic in conjunction with the navopt or script mnemonicsto define what happens when a user clicks on the icon.
The following values can be referenced:
Cx . These values hold a value defined in an earlier column. Forexample, C1 holds the first column's value.
Ox . These values hold a value defined in an Other value. Forexample, O1 holds the first other's value.
'any value' . Any value can be entered in single quotes.
The following are examples:
icon='BILL'
icon=FK_CHAR_VAL
boThis mnemonic is used when source=BO . It defines thebusiness object that holds the column's value (note, thismnemonic must be used in conjunction with the input and output mnemonics to define how information is sent to /received from the BO). The following values can be referenced:
Cx . These values hold a value defined in an earlier column. Forexample, C1 holds the first column's value.
Ox . These values hold a value defined in an Other value. Forexample, O1 holds the first other's value.
'any value' . Any value can be entered in single quotes.
The following are examples:
bo='IND_TAXPAY'
bo=BO_TYPE_CD
bsThis mnemonic is used when source=BS . It defines thebusiness service that retrieves the column's value (note,this mnemonic must be used in conjunction with the input and output mnemonics to define how information is sent to /received from the business service). The following values can bereferenced:
Cx . These values hold a value defined in an earlier column. Forexample, C1 holds the first column's value.
Ox . These values hold a value defined in an Other value. Forexample, O1 holds the first other's value.
'any value' . A value can be entered in single quotes.
The following are examples:
bs='GET_CREDIT'
bs=C1
ssThis mnemonic is used when source=SS . It defines the"server script code" that retrieves the column's value (note,this mnemonic must be used in conjunction with the input and output mnemonics to define how information is sent to /
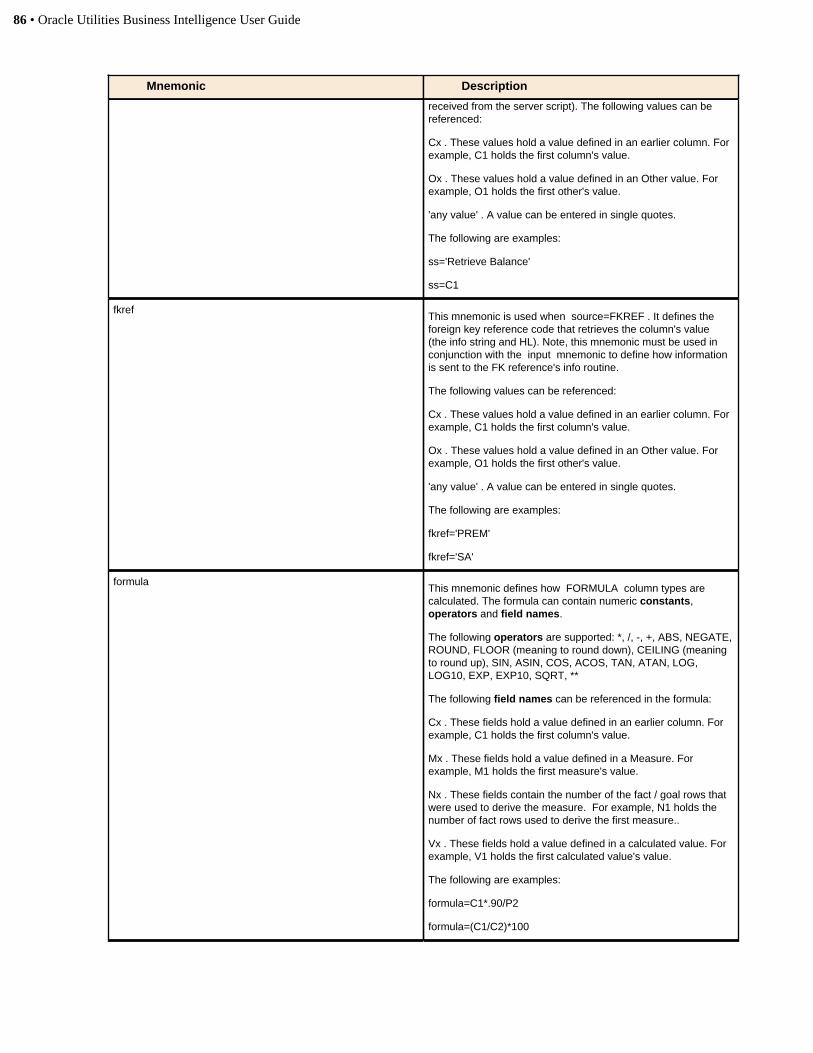
86 • Oracle Utilities Business Intelligence User Guide
Mnemonic Description
received from the server script). The following values can bereferenced:
Cx . These values hold a value defined in an earlier column. Forexample, C1 holds the first column's value.
Ox . These values hold a value defined in an Other value. Forexample, O1 holds the first other's value.
'any value' . A value can be entered in single quotes.
The following are examples:
ss='Retrieve Balance'
ss=C1
fkrefThis mnemonic is used when source=FKREF . It defines theforeign key reference code that retrieves the column's value(the info string and HL). Note, this mnemonic must be used inconjunction with the input mnemonic to define how informationis sent to the FK reference's info routine.
The following values can be referenced:
Cx . These values hold a value defined in an earlier column. Forexample, C1 holds the first column's value.
Ox . These values hold a value defined in an Other value. Forexample, O1 holds the first other's value.
'any value' . A value can be entered in single quotes.
The following are examples:
fkref='PREM'
fkref='SA'
formulaThis mnemonic defines how FORMULA column types arecalculated. The formula can contain numeric constants,operators and field names.
The following operators are supported: *, /, -, +, ABS, NEGATE,ROUND, FLOOR (meaning to round down), CEILING (meaningto round up), SIN, ASIN, COS, ACOS, TAN, ATAN, LOG,LOG10, EXP, EXP10, SQRT, **
The following field names can be referenced in the formula:
Cx . These fields hold a value defined in an earlier column. Forexample, C1 holds the first column's value.
Mx . These fields hold a value defined in a Measure. Forexample, M1 holds the first measure's value.
Nx . These fields contain the number of the fact / goal rows thatwere used to derive the measure. For example, N1 holds thenumber of fact rows used to derive the first measure..
Vx . These fields hold a value defined in a calculated value. Forexample, V1 holds the first calculated value's value.
The following are examples:
formula=C1*.90/P2
formula=(C1/C2)*100
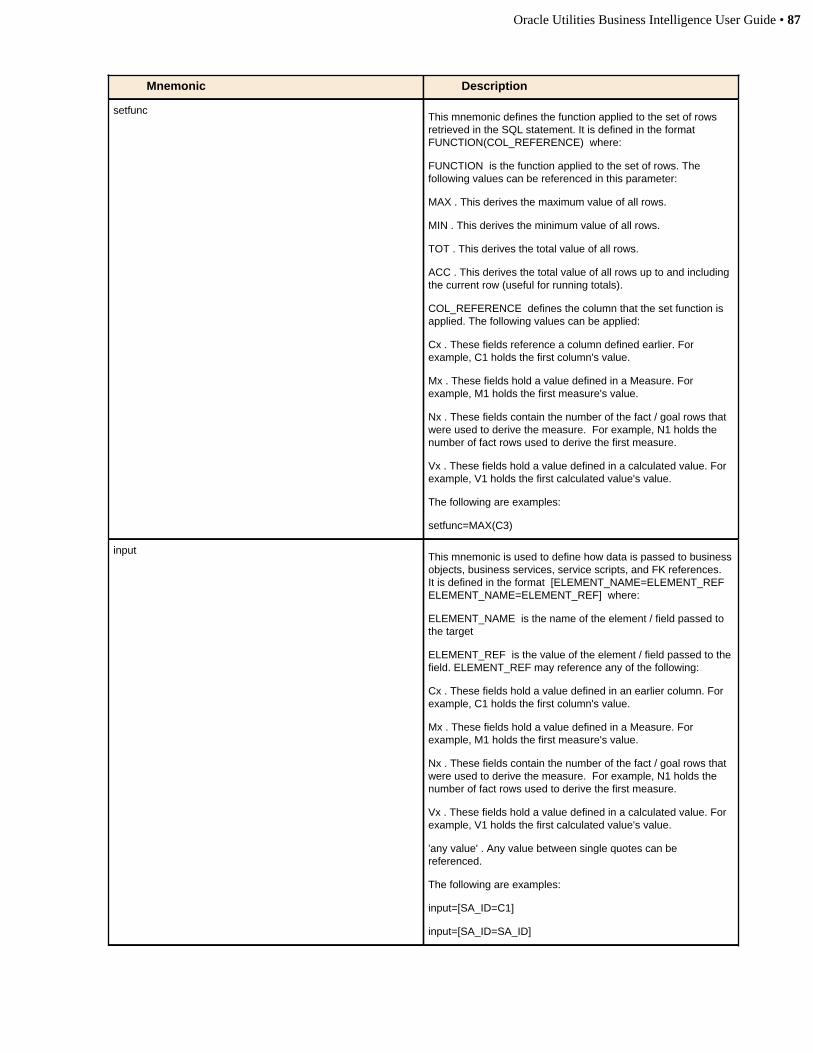
Oracle Utilities Business Intelligence User Guide • 87
Mnemonic Description
setfuncThis mnemonic defines the function applied to the set of rowsretrieved in the SQL statement. It is defined in the format FUNCTION(COL_REFERENCE) where:
FUNCTION is the function applied to the set of rows. Thefollowing values can be referenced in this parameter:
MAX . This derives the maximum value of all rows.
MIN . This derives the minimum value of all rows.
TOT . This derives the total value of all rows.
ACC . This derives the total value of all rows up to and includingthe current row (useful for running totals).
COL_REFERENCE defines the column that the set function isapplied. The following values can be applied:
Cx . These fields reference a column defined earlier. Forexample, C1 holds the first column's value.
Mx . These fields hold a value defined in a Measure. Forexample, M1 holds the first measure's value.
Nx . These fields contain the number of the fact / goal rows thatwere used to derive the measure. For example, N1 holds thenumber of fact rows used to derive the first measure.
Vx . These fields hold a value defined in a calculated value. Forexample, V1 holds the first calculated value's value.
The following are examples:
setfunc=MAX(C3)
inputThis mnemonic is used to define how data is passed to businessobjects, business services, service scripts, and FK references.It is defined in the format [ELEMENT_NAME=ELEMENT_REFELEMENT_NAME=ELEMENT_REF] where:
ELEMENT_NAME is the name of the element / field passed tothe target
ELEMENT_REF is the value of the element / field passed to thefield. ELEMENT_REF may reference any of the following:
Cx . These fields hold a value defined in an earlier column. Forexample, C1 holds the first column's value.
Mx . These fields hold a value defined in a Measure. Forexample, M1 holds the first measure's value.
Nx . These fields contain the number of the fact / goal rows thatwere used to derive the measure. For example, N1 holds thenumber of fact rows used to derive the first measure.
Vx . These fields hold a value defined in a calculated value. Forexample, V1 holds the first calculated value's value.
'any value' . Any value between single quotes can bereferenced.
The following are examples:
input=[SA_ID=C1]
input=[SA_ID=SA_ID]
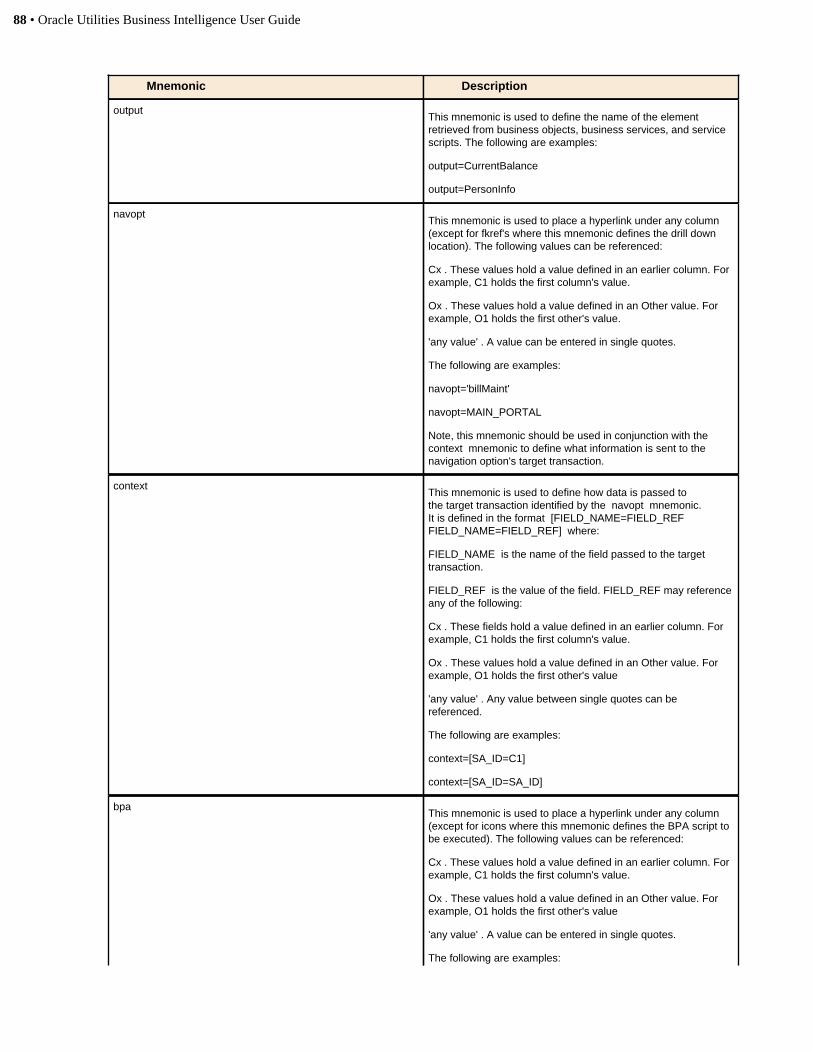
88 • Oracle Utilities Business Intelligence User Guide
Mnemonic Description
outputThis mnemonic is used to define the name of the elementretrieved from business objects, business services, and servicescripts. The following are examples:
output=CurrentBalance
output=PersonInfo
navoptThis mnemonic is used to place a hyperlink under any column(except for fkref's where this mnemonic defines the drill downlocation). The following values can be referenced:
Cx . These values hold a value defined in an earlier column. Forexample, C1 holds the first column's value.
Ox . These values hold a value defined in an Other value. Forexample, O1 holds the first other's value.
'any value' . A value can be entered in single quotes.
The following are examples:
navopt='billMaint'
navopt=MAIN_PORTAL
Note, this mnemonic should be used in conjunction with the context mnemonic to define what information is sent to thenavigation option's target transaction.
contextThis mnemonic is used to define how data is passed tothe target transaction identified by the navopt mnemonic.It is defined in the format [FIELD_NAME=FIELD_REFFIELD_NAME=FIELD_REF] where:
FIELD_NAME is the name of the field passed to the targettransaction.
FIELD_REF is the value of the field. FIELD_REF may referenceany of the following:
Cx . These fields hold a value defined in an earlier column. Forexample, C1 holds the first column's value.
Ox . These values hold a value defined in an Other value. Forexample, O1 holds the first other's value
'any value' . Any value between single quotes can bereferenced.
The following are examples:
context=[SA_ID=C1]
context=[SA_ID=SA_ID]
bpaThis mnemonic is used to place a hyperlink under any column(except for icons where this mnemonic defines the BPA script tobe executed). The following values can be referenced:
Cx . These values hold a value defined in an earlier column. Forexample, C1 holds the first column's value.
Ox . These values hold a value defined in an Other value. Forexample, O1 holds the first other's value
'any value' . A value can be entered in single quotes.
The following are examples:

Oracle Utilities Business Intelligence User Guide • 89
Mnemonic Description
bpa='CI_STOP'
bpa='CI_AUTOPAY'
Note, this mnemonic should be used in conjunction with the tempstorage mnemonic to define the temporary storage valuesthat will be initiated when the script is executed.
tempstorageThis mnemonic is used to define the temporary storagevariables initiated when the bpa mnemonic is used. Itis defined in the format [FIELD_NAME=FIELD_REFFIELD_NAME=FIELD_REF] where:
FIELD_NAME is the name of the temporary storage field.
FIELD_REF is the value of the field. FIELD_REF may referenceany of the following:
Cx . These fields hold a value defined in an earlier column. Forexample, C1 holds the first column's value.
Ox . These values hold a value defined in an Other value. Forexample, O1 holds the first other's value
'any value' . Any value between single quotes can bereferenced.
The following are examples:
tempstorage=[SA_ID=C1]
tempstorage=[SA_ID=SA_ID]
cur This mnemonic is used to apply a given currency code'sformatting to a numeric column (this is typically only used forcalculated values as elements retrieved via SQL or from callsto BO's, BS's and service scripts define if they are money). Forexample, entering cur=USD will apply the currency formattingof the USD currency code.
dec This mnemonic overrides the number of decimal places used forcalculated values. This parameter is entered in the format n or nR where n is the number of decimal places to show. Suffixingthe number of decimal places with R means that the systemshould round up / down. Simply specifying n (without an R )means that decimal places should be truncated. For example,entering dec=4 will display 4 decimal places and truncate theremainder.
char This mnemonic applies special character(s) to the column'svalue. This field is entered in the format 'x[ ]x' . Where x references the literal value to display and [ ] defines the relativeposition of the characters (before or after the value). You needonly include the [ ] if you want to position characters in front ofthe value. For example, char='%' will place a percent sign afterthe value. If you want to position the word minutes before avalue, enter char='minutes [ ]' . If you want to output a value like BUDGET $123.12 (YTD) , you'd enter char='BUDGET [ ] (YTD)'.
suppress This mnemonic is used to indicate a column should besuppressed (i.e., it is defined for calculation purposes only) andwill not be a dragable attribute. The valid values are Y and N . N is the default.
width This mnemonic is used to indicate the zone display width in aportal. Any number is a valid value.

90 • Oracle Utilities Business Intelligence User Guide
Mnemonic Description
order This mnemonic defines the column's default sort order. The validvalues are ASC and DESC (ascending and descending). ASC is the default.
colorThis mnemonic overrides the column's text color. You can entereither of the following:
A valid HTML "named" color ( red , yellow , green , etc).
An RGB combination (#FF0000, #CCCCCC, etc). Note: the # isrequired.
bgcolorThis mnemonic overrides the column's background color. Youcan enter either of the following:
A valid HTML "named" color ( red , yellow , green , etc).
An RGB combination (#FF0000, #CCCCCC, etc). Note: the # isrequired.
Pie Chart Zone Parameters
The following table describes the parameters that control pie chart zones.
Note: General parameters.The general listing of parameters describes additional parameters.
Parm Type Description
Slice ValueEnter the value that is sliced in the pie chart. The following fieldscan be referenced:
Mx . For example, M1 holds the first measurement.
Nx . These fields contain the number of the fact / goal rows thatwere used to derive a measurement. For example, N1 holds thenumber of fact rows used to derive the first measurement.
Vx . For example, V1 holds the first calculated value.
Slice Value Legend TextPie charts contain a legend that defines what each slice mean.This field is used to define the legend text. Note, the legend textwill be prefixed with a description of the dimensional attributetherefore you can leave this field blank if the legend onlydescribes each dimension's description.
By default, the legend will contain the descriptions of thedimensional attribute values that appear in the pie chart ,therefore you can leave this field blank if this is what you want.
The text string can be formatted in the same fashion describedfor Traffic Light Hover Text. The only difference is that you canalso specify the following fields:
- %. Shows the relative percentage of the slice.
- S-label. This field contains the description of the dimensionalattribute that appears in a slice.
For example, you could enter S-label M1 '-' % to show theslice's dimensional description, its measure amount, and themeasure's relative percentage in the pie chart.
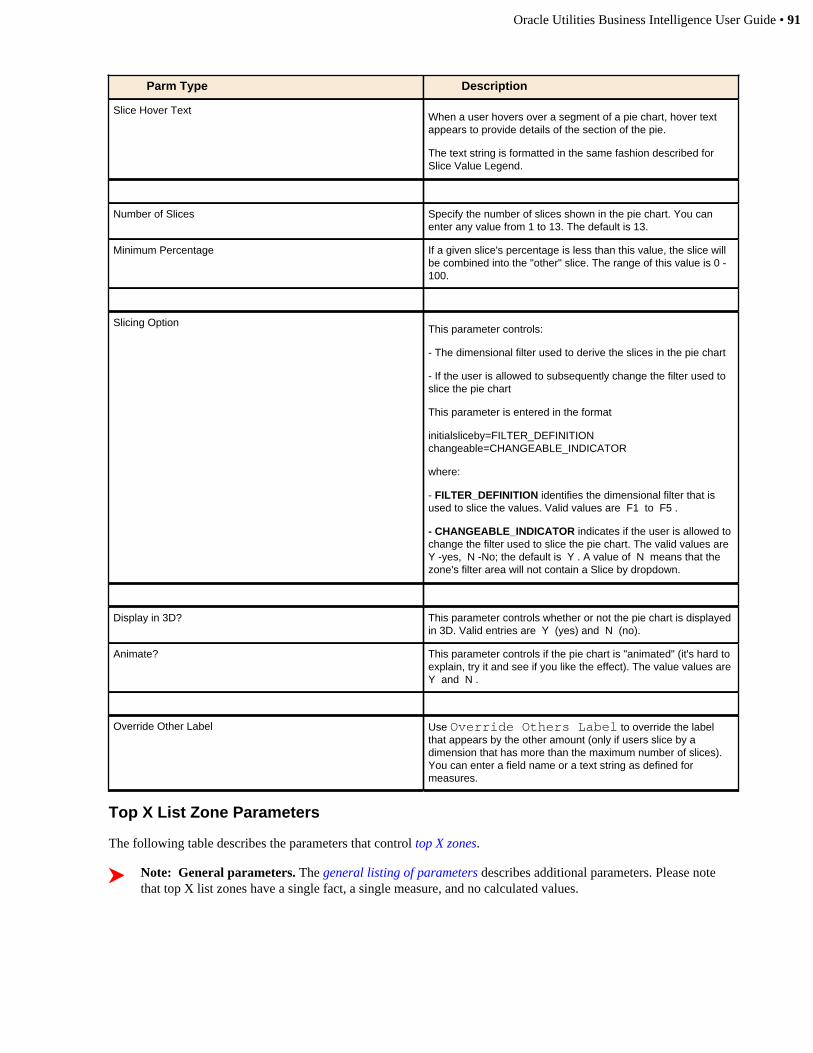
Oracle Utilities Business Intelligence User Guide • 91
Parm Type Description
Slice Hover TextWhen a user hovers over a segment of a pie chart, hover textappears to provide details of the section of the pie.
The text string is formatted in the same fashion described forSlice Value Legend.
Number of Slices Specify the number of slices shown in the pie chart. You canenter any value from 1 to 13. The default is 13.
Minimum Percentage If a given slice's percentage is less than this value, the slice willbe combined into the "other" slice. The range of this value is 0 -100.
Slicing OptionThis parameter controls:
- The dimensional filter used to derive the slices in the pie chart
- If the user is allowed to subsequently change the filter used toslice the pie chart
This parameter is entered in the format
initialsliceby=FILTER_DEFINITIONchangeable=CHANGEABLE_INDICATOR
where:
- FILTER_DEFINITION identifies the dimensional filter that isused to slice the values. Valid values are F1 to F5 .
- CHANGEABLE_INDICATOR indicates if the user is allowed tochange the filter used to slice the pie chart. The valid values are Y -yes, N -No; the default is Y . A value of N means that thezone's filter area will not contain a Slice by dropdown.
Display in 3D? This parameter controls whether or not the pie chart is displayedin 3D. Valid entries are Y (yes) and N (no).
Animate? This parameter controls if the pie chart is "animated" (it's hard toexplain, try it and see if you like the effect). The value values areY and N .
Override Other Label Use Override Others Label to override the labelthat appears by the other amount (only if users slice by adimension that has more than the maximum number of slices).You can enter a field name or a text string as defined formeasures.
Top X List Zone Parameters
The following table describes the parameters that control top X zones.
Note: General parameters. The general listing of parameters describes additional parameters. Please notethat top X list zones have a single fact, a single measure, and no calculated values.

92 • Oracle Utilities Business Intelligence User Guide
Parm Type Description
Dimensional Attributes 1 through 3These dimensional attributes define the combination ofdimensions that are "scored" by this zone. You may define up tothree dimensional attributes (and at least one is required).
We'll use an example to explain these attributes - if you wantto score revenue for every combination of customer class,jurisdiction and service type; you'd define three dimensionalattributes on the revenue scorecard zone.
Dimensional attributes are defined in the format
tf=TABLE.COLUMN descfield=DESCRfactfield=DIMENSION_FK
where:
- TABLE is the name of the dimension table (e.g. CD_ACCT)that holds the dimensional attribute key being used to restrict thefact rows.
- COLUMN is the name of the column on the TABLE that holdsthe dimensional attribute used to filter the rows.
- DESCR is the name of the column holding the description ofthe object on the TABLE
- DIMENSON_FK is only required if the fact has more than onereference to the dimension. In this situation, you must define thecolumn on the fact that holds the FK to desired dimension.
For example, to rank accounts you'd enter tf=CD_ACCT.SRC_ACCT_ID descfield=ACCT_INFO
See the Data Dictionary for the possible dimensions andcolumns for the fact defined above.
Conversion Factor If you want to convert the resulting measurement amount intoa different value before it is displayed, specify a mathematicaloperator and number. For example, / 24 would divide thenumber of hours by 24 (to derive days) before it is displayed.
Number of Entries to Display This parameter controls the number of ranks displayed in thezone. You can enter any value from 1 to 100 . It should bestressed that all "ties" (i.e., multiple rows with the same value)count as 1. This means that a given top X list could show morethan this number of rows.
Is Up Good? This zone type contains an arrow to highlight if the object beingranked has moved up or down in the ranking (as compared tothe previous period). This parameter controls the color of thisarrow. If moving up in the ranking is considered good, enter Y ;otherwise enter N .
Source System Navigation OptionUse this parameter to support drill back to the sourceapplication. When this parameter is specified, a hyperlinkappears under the dimensional attribute description in thetop X list. When clicked, the user is transferred to the sourcesystem with the key field(s) displayed in the target transaction.Note well - drill back can only be supported if the dimensionalattribute(s) defined above contain a "natural key" from thesource application (e.g., an account ID).
This parameter is entered in the format:
navopt=NAVIGATION_OPTION DAx=CONTEXT_FIELD_NAME
where:
- NAVIGATION_OPTION is the code of the navigationoption that defines the drill back application. This navigation
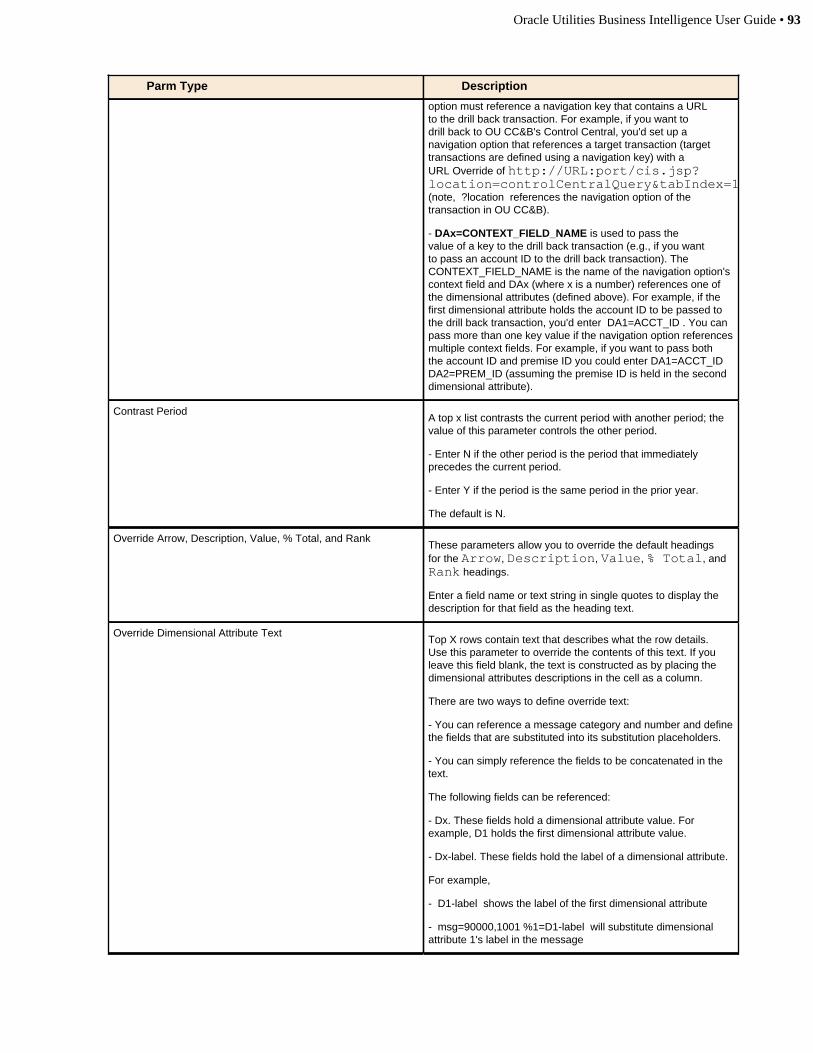
Oracle Utilities Business Intelligence User Guide • 93
Parm Type Description
option must reference a navigation key that contains a URLto the drill back transaction. For example, if you want todrill back to OU CC&B's Control Central, you'd set up anavigation option that references a target transaction (targettransactions are defined using a navigation key) with aURL Override of http://URL:port/cis.jsp?location=controlCentralQuery&tabIndex=1(note, ?location references the navigation option of thetransaction in OU CC&B).
- DAx=CONTEXT_FIELD_NAME is used to pass thevalue of a key to the drill back transaction (e.g., if you wantto pass an account ID to the drill back transaction). TheCONTEXT_FIELD_NAME is the name of the navigation option'scontext field and DAx (where x is a number) references one ofthe dimensional attributes (defined above). For example, if thefirst dimensional attribute holds the account ID to be passed tothe drill back transaction, you'd enter DA1=ACCT_ID . You canpass more than one key value if the navigation option referencesmultiple context fields. For example, if you want to pass boththe account ID and premise ID you could enter DA1=ACCT_IDDA2=PREM_ID (assuming the premise ID is held in the seconddimensional attribute).
Contrast PeriodA top x list contrasts the current period with another period; thevalue of this parameter controls the other period.
- Enter N if the other period is the period that immediatelyprecedes the current period.
- Enter Y if the period is the same period in the prior year.
The default is N.
Override Arrow, Description, Value, % Total, and RankThese parameters allow you to override the default headingsfor the Arrow, Description, Value, % Total, andRank headings.
Enter a field name or text string in single quotes to display thedescription for that field as the heading text.
Override Dimensional Attribute TextTop X rows contain text that describes what the row details.Use this parameter to override the contents of this text. If youleave this field blank, the text is constructed as by placing thedimensional attributes descriptions in the cell as a column.
There are two ways to define override text:
- You can reference a message category and number and definethe fields that are substituted into its substitution placeholders.
- You can simply reference the fields to be concatenated in thetext.
The following fields can be referenced:
- Dx. These fields hold a dimensional attribute value. Forexample, D1 holds the first dimensional attribute value.
- Dx-label. These fields hold the label of a dimensional attribute.
For example,
- D1-label shows the label of the first dimensional attribute
- msg=90000,1001 %1=D1-label will substitute dimensionalattribute 1's label in the message
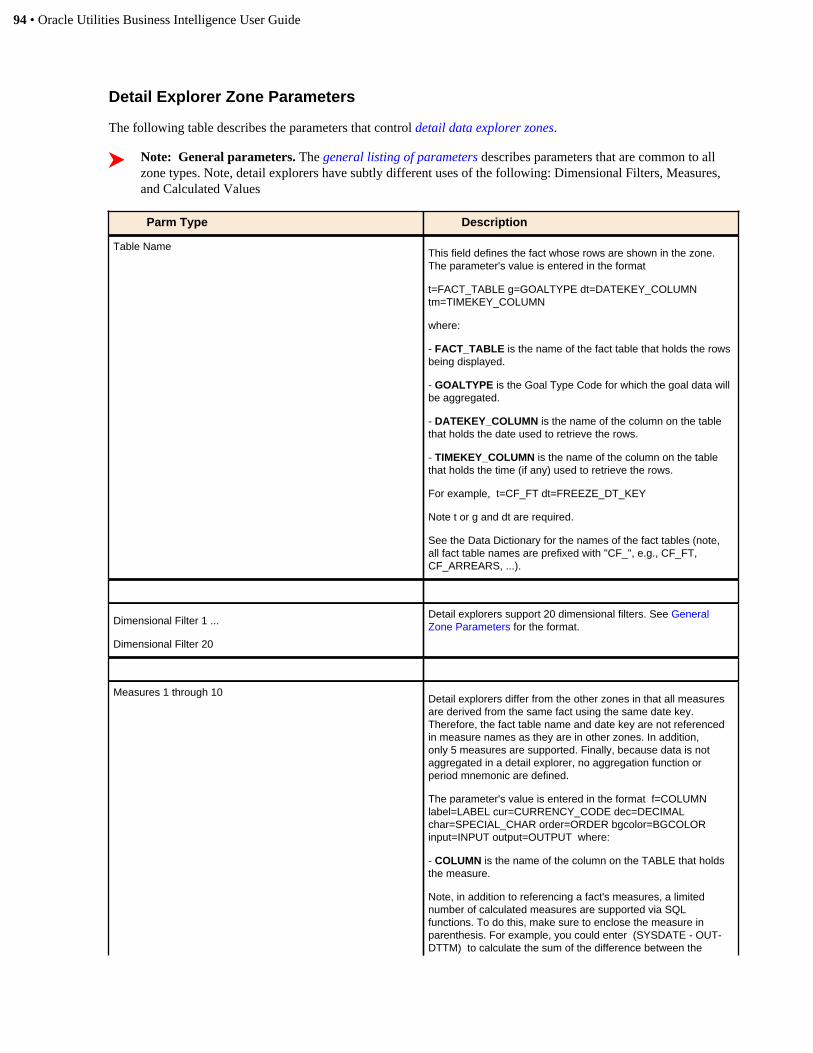
94 • Oracle Utilities Business Intelligence User Guide
Detail Explorer Zone Parameters
The following table describes the parameters that control detail data explorer zones.
Note: General parameters. The general listing of parameters describes parameters that are common to allzone types. Note, detail explorers have subtly different uses of the following: Dimensional Filters, Measures,and Calculated Values
Parm Type Description
Table NameThis field defines the fact whose rows are shown in the zone.The parameter's value is entered in the format
t=FACT_TABLE g=GOALTYPE dt=DATEKEY_COLUMNtm=TIMEKEY_COLUMN
where:
- FACT_TABLE is the name of the fact table that holds the rowsbeing displayed.
- GOALTYPE is the Goal Type Code for which the goal data willbe aggregated.
- DATEKEY_COLUMN is the name of the column on the tablethat holds the date used to retrieve the rows.
- TIMEKEY_COLUMN is the name of the column on the tablethat holds the time (if any) used to retrieve the rows.
For example, t=CF_FT dt=FREEZE_DT_KEY
Note t or g and dt are required.
See the Data Dictionary for the names of the fact tables (note,all fact table names are prefixed with "CF_", e.g., CF_FT,CF_ARREARS, ...).
Dimensional Filter 1 ...
Dimensional Filter 20
Detail explorers support 20 dimensional filters. See GeneralZone Parameters for the format.
Measures 1 through 10Detail explorers differ from the other zones in that all measuresare derived from the same fact using the same date key.Therefore, the fact table name and date key are not referencedin measure names as they are in other zones. In addition,only 5 measures are supported. Finally, because data is notaggregated in a detail explorer, no aggregation function orperiod mnemonic are defined.
The parameter's value is entered in the format f=COLUMNlabel=LABEL cur=CURRENCY_CODE dec=DECIMALchar=SPECIAL_CHAR order=ORDER bgcolor=BGCOLORinput=INPUT output=OUTPUT where:
- COLUMN is the name of the column on the TABLE that holdsthe measure.
Note, in addition to referencing a fact's measures, a limitednumber of calculated measures are supported via SQLfunctions. To do this, make sure to enclose the measure inparenthesis. For example, you could enter (SYSDATE - OUT-DTTM) to calculate the sum of the difference between the
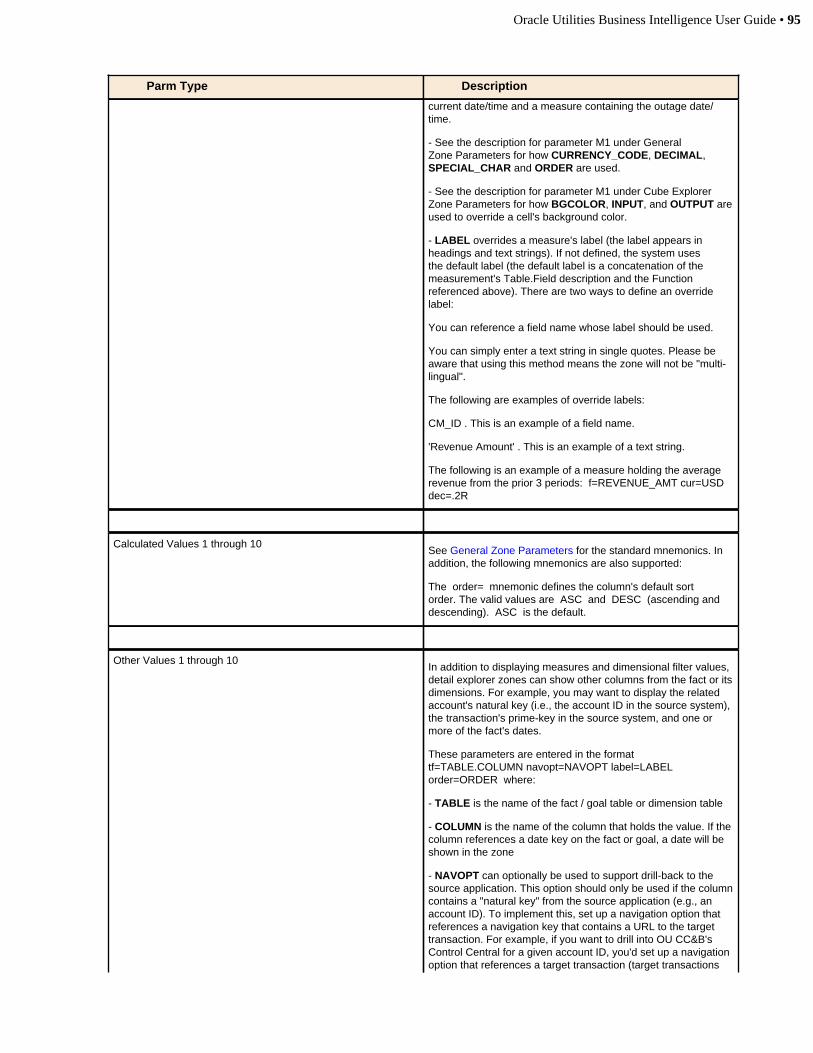
Oracle Utilities Business Intelligence User Guide • 95
Parm Type Description
current date/time and a measure containing the outage date/time.
- See the description for parameter M1 under GeneralZone Parameters for how CURRENCY_CODE, DECIMAL,SPECIAL_CHAR and ORDER are used.
- See the description for parameter M1 under Cube ExplorerZone Parameters for how BGCOLOR, INPUT, and OUTPUT areused to override a cell's background color.
- LABEL overrides a measure's label (the label appears inheadings and text strings). If not defined, the system usesthe default label (the default label is a concatenation of themeasurement's Table.Field description and the Functionreferenced above). There are two ways to define an overridelabel:
You can reference a field name whose label should be used.
You can simply enter a text string in single quotes. Please beaware that using this method means the zone will not be "multi-lingual".
The following are examples of override labels:
CM_ID . This is an example of a field name.
'Revenue Amount' . This is an example of a text string.
The following is an example of a measure holding the averagerevenue from the prior 3 periods: f=REVENUE_AMT cur=USDdec=.2R
Calculated Values 1 through 10See General Zone Parameters for the standard mnemonics. Inaddition, the following mnemonics are also supported:
The order= mnemonic defines the column's default sortorder. The valid values are ASC and DESC (ascending anddescending). ASC is the default.
Other Values 1 through 10In addition to displaying measures and dimensional filter values,detail explorer zones can show other columns from the fact or itsdimensions. For example, you may want to display the relatedaccount's natural key (i.e., the account ID in the source system),the transaction's prime-key in the source system, and one ormore of the fact's dates.
These parameters are entered in the format tf=TABLE.COLUMN navopt=NAVOPT label=LABELorder=ORDER where:
- TABLE is the name of the fact / goal table or dimension table
- COLUMN is the name of the column that holds the value. If thecolumn references a date key on the fact or goal, a date will beshown in the zone
- NAVOPT can optionally be used to support drill-back to thesource application. This option should only be used if the columncontains a "natural key" from the source application (e.g., anaccount ID). To implement this, set up a navigation option thatreferences a navigation key that contains a URL to the targettransaction. For example, if you want to drill into OU CC&B'sControl Central for a given account ID, you'd set up a navigationoption that references a target transaction (target transactions
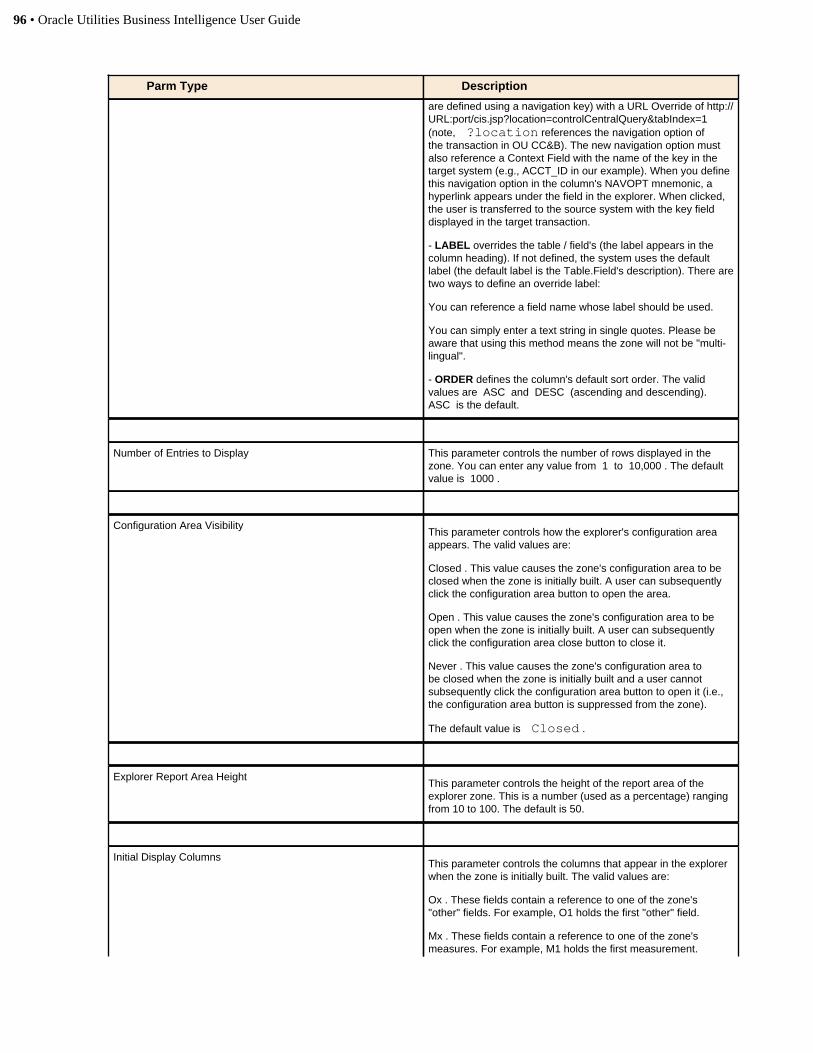
96 • Oracle Utilities Business Intelligence User Guide
Parm Type Description
are defined using a navigation key) with a URL Override of http://URL:port/cis.jsp?location=controlCentralQuery&tabIndex=1(note, ?location references the navigation option ofthe transaction in OU CC&B). The new navigation option mustalso reference a Context Field with the name of the key in thetarget system (e.g., ACCT_ID in our example). When you definethis navigation option in the column's NAVOPT mnemonic, ahyperlink appears under the field in the explorer. When clicked,the user is transferred to the source system with the key fielddisplayed in the target transaction.
- LABEL overrides the table / field's (the label appears in thecolumn heading). If not defined, the system uses the defaultlabel (the default label is the Table.Field's description). There aretwo ways to define an override label:
You can reference a field name whose label should be used.
You can simply enter a text string in single quotes. Please beaware that using this method means the zone will not be "multi-lingual".
- ORDER defines the column's default sort order. The validvalues are ASC and DESC (ascending and descending). ASC is the default.
Number of Entries to Display This parameter controls the number of rows displayed in thezone. You can enter any value from 1 to 10,000 . The defaultvalue is 1000 .
Configuration Area VisibilityThis parameter controls how the explorer's configuration areaappears. The valid values are:
Closed . This value causes the zone's configuration area to beclosed when the zone is initially built. A user can subsequentlyclick the configuration area button to open the area.
Open . This value causes the zone's configuration area to beopen when the zone is initially built. A user can subsequentlyclick the configuration area close button to close it.
Never . This value causes the zone's configuration area tobe closed when the zone is initially built and a user cannotsubsequently click the configuration area button to open it (i.e.,the configuration area button is suppressed from the zone).
The default value is Closed .
Explorer Report Area HeightThis parameter controls the height of the report area of theexplorer zone. This is a number (used as a percentage) rangingfrom 10 to 100. The default is 50.
Initial Display ColumnsThis parameter controls the columns that appear in the explorerwhen the zone is initially built. The valid values are:
Ox . These fields contain a reference to one of the zone's"other" fields. For example, O1 holds the first "other" field.
Mx . These fields contain a reference to one of the zone'smeasures. For example, M1 holds the first measurement.
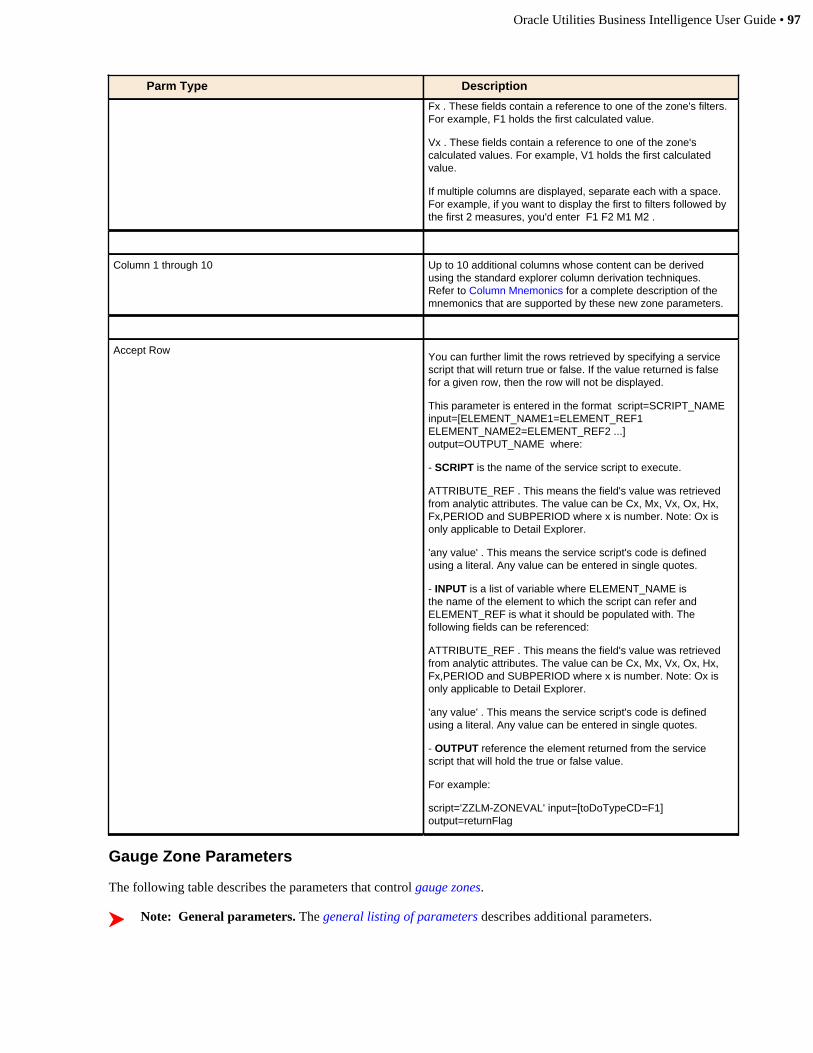
Oracle Utilities Business Intelligence User Guide • 97
Parm Type Description
Fx . These fields contain a reference to one of the zone's filters.For example, F1 holds the first calculated value.
Vx . These fields contain a reference to one of the zone'scalculated values. For example, V1 holds the first calculatedvalue.
If multiple columns are displayed, separate each with a space.For example, if you want to display the first to filters followed bythe first 2 measures, you'd enter F1 F2 M1 M2 .
Column 1 through 10 Up to 10 additional columns whose content can be derivedusing the standard explorer column derivation techniques.Refer to Column Mnemonics for a complete description of themnemonics that are supported by these new zone parameters.
Accept RowYou can further limit the rows retrieved by specifying a servicescript that will return true or false. If the value returned is falsefor a given row, then the row will not be displayed.
This parameter is entered in the format script=SCRIPT_NAMEinput=[ELEMENT_NAME1=ELEMENT_REF1ELEMENT_NAME2=ELEMENT_REF2 ...]output=OUTPUT_NAME where:
- SCRIPT is the name of the service script to execute.
ATTRIBUTE_REF . This means the field's value was retrievedfrom analytic attributes. The value can be Cx, Mx, Vx, Ox, Hx,Fx,PERIOD and SUBPERIOD where x is number. Note: Ox isonly applicable to Detail Explorer.
'any value' . This means the service script's code is definedusing a literal. Any value can be entered in single quotes.
- INPUT is a list of variable where ELEMENT_NAME isthe name of the element to which the script can refer andELEMENT_REF is what it should be populated with. Thefollowing fields can be referenced:
ATTRIBUTE_REF . This means the field's value was retrievedfrom analytic attributes. The value can be Cx, Mx, Vx, Ox, Hx,Fx,PERIOD and SUBPERIOD where x is number. Note: Ox isonly applicable to Detail Explorer.
'any value' . This means the service script's code is definedusing a literal. Any value can be entered in single quotes.
- OUTPUT reference the element returned from the servicescript that will hold the true or false value.
For example:
script='ZZLM-ZONEVAL' input=[toDoTypeCD=F1]output=returnFlag
Gauge Zone Parameters
The following table describes the parameters that control gauge zones.
Note: General parameters. The general listing of parameters describes additional parameters.

98 • Oracle Utilities Business Intelligence User Guide
Parm Type Description
Gauge TextYou use this parameter to define what is shown in the gaugehover text. There are two ways to define what is shown:
- You can reference a message category and number and definethe fields that are substituted into its substitution placeholders.
- You can simply reference the fields to be concatenated in thehover text.
The following fields can be referenced:
- Mx . These fields hold a measurement. For example, M1 holdsthe first measurement.
- Nx . These fields hold the count of fact / goal rows that wereused to derive the measurement. For example, N1 holds thenumber of fact rows used to derive the first measurement.
- Mx-label . These fields hold the label of a measurement. Forexample, M1-label holds the name of the first measurement.
- Px . These fields hold the label of a measurement's time-period. For example, P1 holds the time period of the firstmeasurement.
- Vx . These fields hold a calculated value. For example, V1would be used to reference the first calculated value.
- Vx-label . These fields contain the label of a calculated value.For example, V1-label holds the name of the first measurement.
- 'any value' . Any value between single quotes can bereferenced. You can also include HTML within the literal value ifyou want to apply colors or styles to the hover text. Please notethat the system does not automatically include a space betweenliteral values and adjacent fields.
For example, if you wanted the hover text to be Percent of Goal:50% - Revenue $100,000 / Budget Revenue $200,000 , you canachieve this in two ways:
- You can set up a message (say 90000, 1001) with the text"Percent of Goal: %1 - Revenue %2 / Budget Revenue %3" andthen define this parameter as msg=90000,1001 %1=V1 %2=M1%3=M2
- You can define this parameter as 'Percent of Goal: ' V1 ' - 'M1-label M1 ' / ' M2-label M2
Gauge ValueIn this field (the gauge value), you define the value shown by theneedle on the gauge.
The following fields can be referenced:
- Mx . For example, M1 holds the first measurement.
- Nx . For example, N1 holds the number of fact rows used toderive the first measurement.
- Vx . For example, V1 holds the first calculated value.
Range 1 to 5This parameter controls how the color ranges in the guageare derived. This parameter is entered in the format lowval=LOWVAL highval=HIGHVAL color=COLOR where:
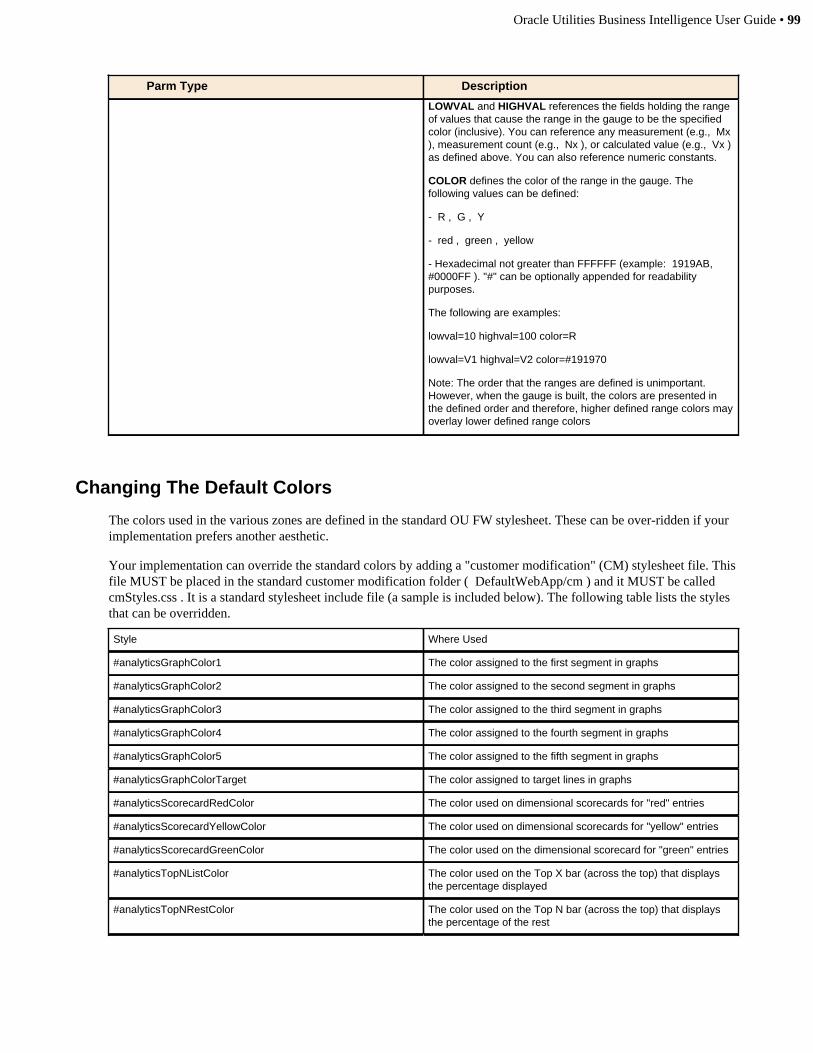
Oracle Utilities Business Intelligence User Guide • 99
Parm Type Description
LOWVAL and HIGHVAL references the fields holding the rangeof values that cause the range in the gauge to be the specifiedcolor (inclusive). You can reference any measurement (e.g., Mx), measurement count (e.g., Nx ), or calculated value (e.g., Vx )as defined above. You can also reference numeric constants.
COLOR defines the color of the range in the gauge. Thefollowing values can be defined:
- R , G , Y
- red , green , yellow
- Hexadecimal not greater than FFFFFF (example: 1919AB,#0000FF ). "#" can be optionally appended for readabilitypurposes.
The following are examples:
lowval=10 highval=100 color=R
lowval=V1 highval=V2 color=#191970
Note: The order that the ranges are defined is unimportant.However, when the gauge is built, the colors are presented inthe defined order and therefore, higher defined range colors mayoverlay lower defined range colors
Changing The Default Colors
The colors used in the various zones are defined in the standard OU FW stylesheet. These can be over-ridden if yourimplementation prefers another aesthetic.
Your implementation can override the standard colors by adding a "customer modification" (CM) stylesheet file. Thisfile MUST be placed in the standard customer modification folder ( DefaultWebApp/cm ) and it MUST be called cmStyles.css . It is a standard stylesheet include file (a sample is included below). The following table lists the stylesthat can be overridden.
Style Where Used
#analyticsGraphColor1 The color assigned to the first segment in graphs
#analyticsGraphColor2 The color assigned to the second segment in graphs
#analyticsGraphColor3 The color assigned to the third segment in graphs
#analyticsGraphColor4 The color assigned to the fourth segment in graphs
#analyticsGraphColor5 The color assigned to the fifth segment in graphs
#analyticsGraphColorTarget The color assigned to target lines in graphs
#analyticsScorecardRedColor The color used on dimensional scorecards for "red" entries
#analyticsScorecardYellowColor The color used on dimensional scorecards for "yellow" entries
#analyticsScorecardGreenColor The color used on the dimensional scorecard for "green" entries
#analyticsTopNListColor The color used on the Top X bar (across the top) that displaysthe percentage displayed
#analyticsTopNRestColor The color used on the Top N bar (across the top) that displaysthe percentage of the rest
100 • Oracle Utilities Business Intelligence User Guide
You may override any entries in any combination or order. For example, you can override #analyticsGraphColor2 and leave the other graph colors with their default values.
To override an entry, specify a "background-color" attribute and value. The value MUST be in RGB format (i.e.#FF0000). The following is an example:
#analyticsGraphColor1 {
background-color: #000000;
}
#analyticsGraphColor2 {
background-color: #FF0000;
}
#analyticsScorecardRedColor {
background-color: #FF00FF;
}
ETL ProcessThis chapter describes the Oracle Utilities Business Intelligence Extract-Transform-Load (ETL) process
Oracle Warehouse Builder
Oracle Warehouse Builder is Oracle's data warehousing tool. Oracle Utilities Business Intelligence uses this tool asfollows:
• It holds the table design of the star-schemas.• It holds the data mappings that are used to generate that batch jobs that perform extract-transform-load (ETL)
operations.• It holds the process flows that validate the extracted information, load the star-schemas, and perform exception
handling.
FMI: Refer to Oracle's documentation for the detailed information on Oracle Warehouse Builder and OracleWorkflow.
ETL Methodology
The following diagram illustrates the components involved in Oracle Utilities Business Intelligence's ETLmethodology:
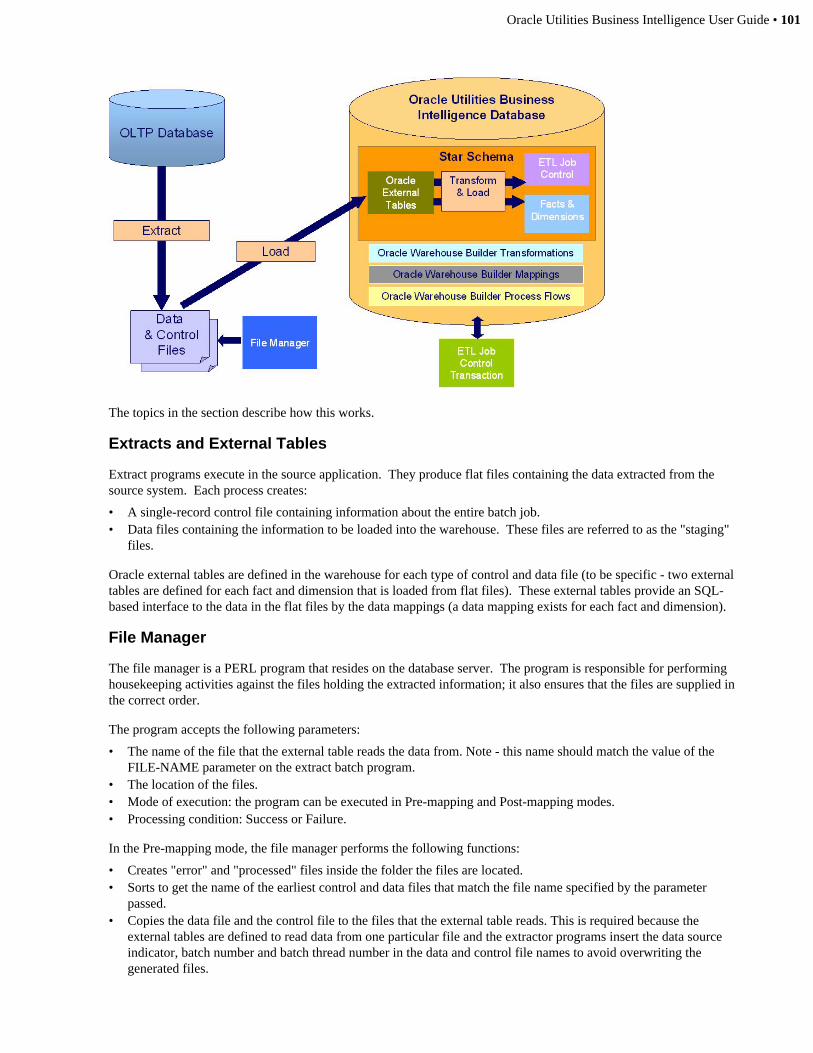
Oracle Utilities Business Intelligence User Guide • 101
The topics in the section describe how this works.
Extracts and External Tables
Extract programs execute in the source application. They produce flat files containing the data extracted from thesource system. Each process creates:
• A single-record control file containing information about the entire batch job. • Data files containing the information to be loaded into the warehouse. These files are referred to as the "staging"
files.
Oracle external tables are defined in the warehouse for each type of control and data file (to be specific - two externaltables are defined for each fact and dimension that is loaded from flat files). These external tables provide an SQL-based interface to the data in the flat files by the data mappings (a data mapping exists for each fact and dimension).
File Manager
The file manager is a PERL program that resides on the database server. The program is responsible for performinghousekeeping activities against the files holding the extracted information; it also ensures that the files are supplied inthe correct order.
The program accepts the following parameters:
• The name of the file that the external table reads the data from. Note - this name should match the value of theFILE-NAME parameter on the extract batch program.
• The location of the files.• Mode of execution: the program can be executed in Pre-mapping and Post-mapping modes.• Processing condition: Success or Failure.
In the Pre-mapping mode, the file manager performs the following functions:
• Creates "error" and "processed" files inside the folder the files are located.• Sorts to get the name of the earliest control and data files that match the file name specified by the parameter
passed.• Copies the data file and the control file to the files that the external table reads. This is required because the
external tables are defined to read data from one particular file and the extractor programs insert the data sourceindicator, batch number and batch thread number in the data and control file names to avoid overwriting thegenerated files.
102 • Oracle Utilities Business Intelligence User Guide
• Saves the name of the file being processed in a temporary file. This file is later used in Post-mapping stage toknow the name of the file that was processed. It is also used by the subsequent executions to know if a file is beingprocessed.
In Post-mapping mode, depending on the processing condition specified, the file manager moves the processedcontrol and data file to either the "error" or the "processed" folder. It also removes the temporary file created in thePre-mapping mode.
Oracle Warehouse Builder Transformations
The contents of this section describe the various transformations used to load the extracted information into the data-warehouse.
Pre and Post Mapping Functions
The topics in this section describe how the pre and post mapping functions validate and load extracted informationinto the warehouse. Note, these functions are invoked by process flows before and after the data mappings areexecuted.
SPL_PREMAP_PROCESS_FNC (Pre-Mapping)
DescriptionThis function is used to validate and load the contents of acontrol file into the ETL Job Control table before the mappingloads the data file.
The function performs the following validations:
The file has not been loaded previously
Another file is not being processed at the same time
If a previous load process failed, the file belongs to the samebatch, i.e., it has the same batch number as the failed process. In other words, the function ensures that all the files of a batchare loaded successfully before another batch can be loaded.
Once the validations have been made, the function inserts orupdates an ETL Job Control record and marks it "In Progress".
Parameters The function accepts the name of the external table for thecontrol file to be processed as the input parameter.
SPL_POSTMAP_PROCESS_FNC (Pre-Mapping)
Description This function updates the ETL Job Control record to "Completed"or "In Error" depending on the status of the data mapping.
Parameters The function accepts the name of the external table for thecontrol file being processed and the value of 1 for success and 0for error status of the data mapping.
Setup Procedures
Setup processes are database-stored procedures used to populate some of the dimensions in the warehouse. Thefollowing setup processes are included:
SPL_LOADDATE
Description This process generates data in the DATE dimension table( CD_DATE) for a range of dates. This process should beexecuted only when setting up the data warehouse for the firsttime.

Oracle Utilities Business Intelligence User Guide • 103
ParametersThis stored procedure accepts start date and end date as inputparameters. The dates should be defined in the format:
start date: to_date('19800101','YYYYMMDD')
end date: to_date('20101231','YYYYMMDD')
If this process is executed AFTER the data has been loaded intothe star schemas, ensure that same start date is passed.
SPL_LOADSNAPTYPE
Description The process generates data in the SNAPSHOT TYPE dimensiontable ( CD_SNAPTYPE).
ParametersNA
SPL_LOAD_DEFAULT_VALUE
Description The process seeds the various dimension tables with '0' keyvalue and '***' dimensional attribute codes. This value isreferenced on fact rows that do not contain a reference to agiven dimension (i.e., they avoid optional foreign keys on thevarious fact tables).
Parameters This stored procedure accepts description for the dimensionalattribute code value of '***' as an optional parameter. Thedefault description for '***' code is 'None'.
Dimension Update Procedures
Type-II slowly changing dimensions (SCD) are dimensions where a history of all changes is kept (to allow for time-series analysis). The following points describe what happens when a change to a dimension is detected:
• The effective end date on the latest record is updated to the change date• A new dimension record is created with the effective start date
Data mappings for such dimensions can be very complex to create. We workaround this problem by creating anupdate procedure for each such dimension. These procedures are called by the pre-mapping functions to update andinsert the dimensional records when a change occurs.
Note: Dimension documentation. For a list of the various type-II dimensions and their update procedures,please use the Table Search zone and limit the tables shown to dimensions.
OUBI_REFRESH_MV_FNC Function
Description This function refreshes a materialized view.
Parameters This stored procedure accepts the name of the materialized viewas a required parameter.
Return Value This function returns 1 if the refresh was done without error, 0 ifan Oracle error is encountered.
Data Mappings
The data mappings load data from the external tables (produced by the extracts) into the facts and dimensions in thewarehouse.
For a list of the facts and dimensions, their external tables, and the related data mappings, refer to the table mappingportal. This portal describes the source application's facts and dimensions and how they are populated.
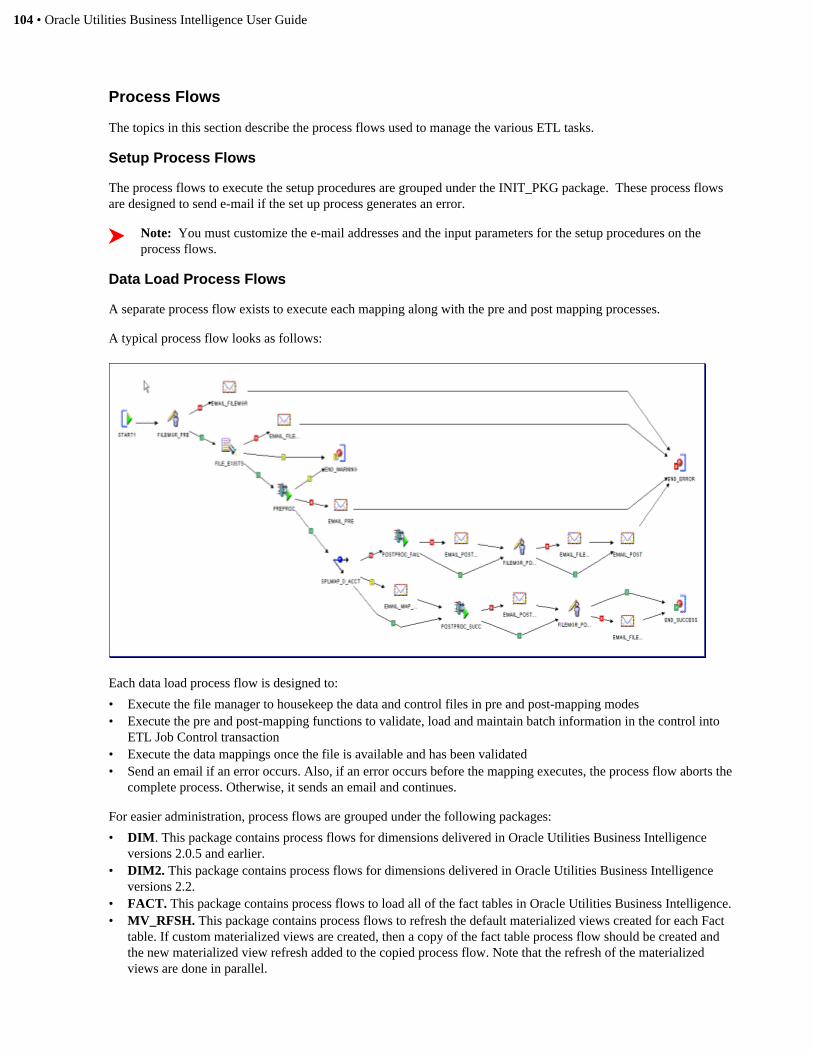
104 • Oracle Utilities Business Intelligence User Guide
Process Flows
The topics in this section describe the process flows used to manage the various ETL tasks.
Setup Process Flows
The process flows to execute the setup procedures are grouped under the INIT_PKG package. These process flowsare designed to send e-mail if the set up process generates an error.
Note: You must customize the e-mail addresses and the input parameters for the setup procedures on theprocess flows.
Data Load Process Flows
A separate process flow exists to execute each mapping along with the pre and post mapping processes.
A typical process flow looks as follows:
Each data load process flow is designed to:
• Execute the file manager to housekeep the data and control files in pre and post-mapping modes• Execute the pre and post-mapping functions to validate, load and maintain batch information in the control into
ETL Job Control transaction• Execute the data mappings once the file is available and has been validated• Send an email if an error occurs. Also, if an error occurs before the mapping executes, the process flow aborts the
complete process. Otherwise, it sends an email and continues.
For easier administration, process flows are grouped under the following packages:
• DIM. This package contains process flows for dimensions delivered in Oracle Utilities Business Intelligenceversions 2.0.5 and earlier.
• DIM2. This package contains process flows for dimensions delivered in Oracle Utilities Business Intelligenceversions 2.2.
• FACT. This package contains process flows to load all of the fact tables in Oracle Utilities Business Intelligence.• MV_RFSH. This package contains process flows to refresh the default materialized views created for each Fact
table. If custom materialized views are created, then a copy of the fact table process flow should be created andthe new materialized view refresh added to the copied process flow. Note that the refresh of the materializedviews are done in parallel.
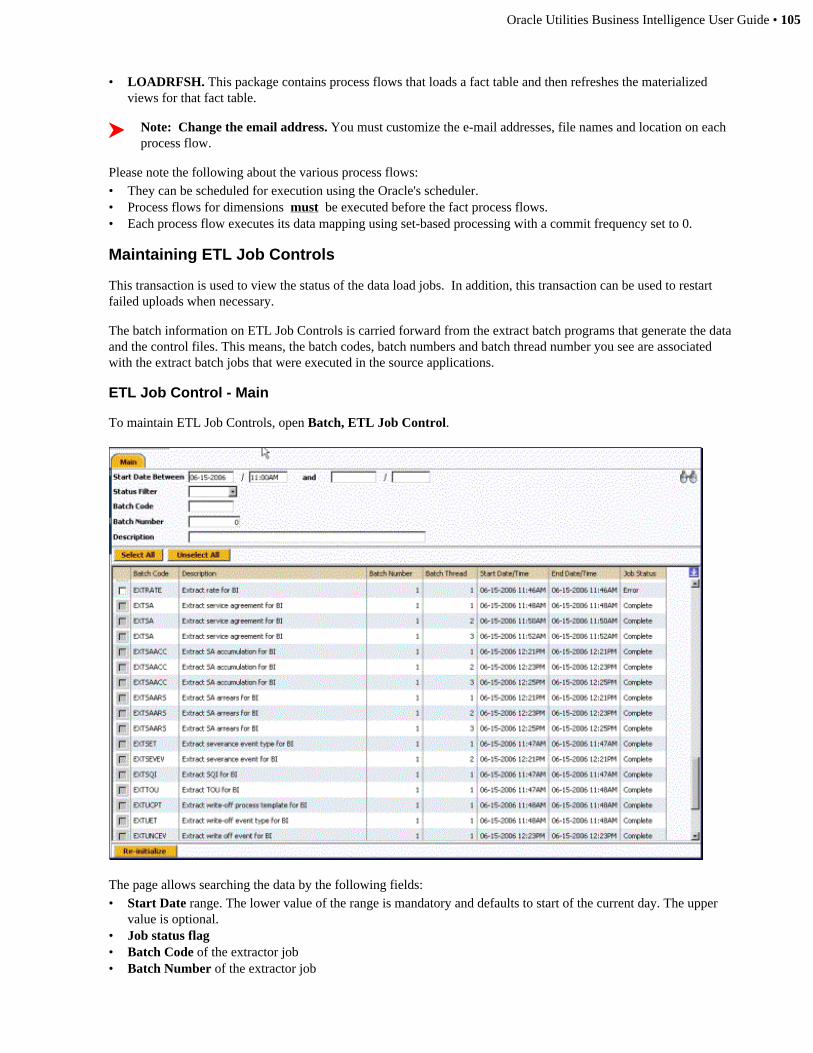
Oracle Utilities Business Intelligence User Guide • 105
• LOADRFSH. This package contains process flows that loads a fact table and then refreshes the materializedviews for that fact table.
Note: Change the email address. You must customize the e-mail addresses, file names and location on eachprocess flow.
Please note the following about the various process flows:• They can be scheduled for execution using the Oracle's scheduler.• Process flows for dimensions must be executed before the fact process flows.• Each process flow executes its data mapping using set-based processing with a commit frequency set to 0.
Maintaining ETL Job Controls
This transaction is used to view the status of the data load jobs. In addition, this transaction can be used to restartfailed uploads when necessary.
The batch information on ETL Job Controls is carried forward from the extract batch programs that generate the dataand the control files. This means, the batch codes, batch numbers and batch thread number you see are associatedwith the extract batch jobs that were executed in the source applications.
ETL Job Control - Main
To maintain ETL Job Controls, open Batch, ETL Job Control.
The page allows searching the data by the following fields:• Start Date range. The lower value of the range is mandatory and defaults to start of the current day. The upper
value is optional.• Job status flag• Batch Code of the extractor job• Batch Number of the extractor job

106 • Oracle Utilities Business Intelligence User Guide
• Description of the extractor batch program
The data area displays the following fields:• Batch Code of the extractor job• Description of the extractor batch program• Batch Number of the extractor job• Batch Thread Number of the extractor job• Start date and time for the data load job• End date and time for the data load job. This date is only set for the jobs that have successfully completed.• Status of the load job
To restart the failed job, select the individual failed jobs and press Re-initialize button. Alternatively, you can userestart all the failed jobs by using Select All button.
Note: Move the files after re-initialization. After re-initializing a failed job, you must move the data and thecontrol files out of the "error" folder so they will be processed next time.
Configuration TasksSetting up Oracle Utilities Business Intelligence involves populating meta-data that describes your facts, dimensions,portals, and zones. The topics in this section provide an overview of the configuration tasks.
The concepts described in Business Intelligence Fundamentals and Configuring Oracle Utilities Business IntelligencePortals and Zones are essential prerequisites to this chapter.
Setting Up the System
The topics in this section describe how to set up the system.
Understand the Facts and Dimensions
The first step in configuring the system is to understand the facts and their associated dimensions and measures. Thetopics in the section describe the various methods that can be used to gain this understanding.
Table Mapping Portal
The Table Mapping portal is used to view and maintain information about the tables behind the star schemas. Thisinformation includes everything from the list of columns to how each column is populated during Extract TransformLoad (ETL) processing. Navigate to Admin Menu, Table Mapping to open this portal.
The topics in this section describe the zones on this portal.
Table Search
Every star schema is composed of a fact table that references multiple dimensions. Most fact and dimension tables arepopulated using an ETL load process that reads records on two flat files:• The control file holds a summary record about a given extract;• The staging file contains the extracted records.
Information about a given load process is stored on an "ETL map". This zone shows the fact and dimension tablesand their related ETL maps. This zone also contains numerous buttons that initiate business processes that maintainthis information. Please refer to the zone's help text for a detailed description of what each button does.
Note: Most facts and dimensions have a single ETL load process. While most facts and dimensions arepopulated using a single extract process, it's possible for a given fact or dimension to be populated by severalextracts. When this is the case, you will see the fact or dimension multiple times in this zone's search results.
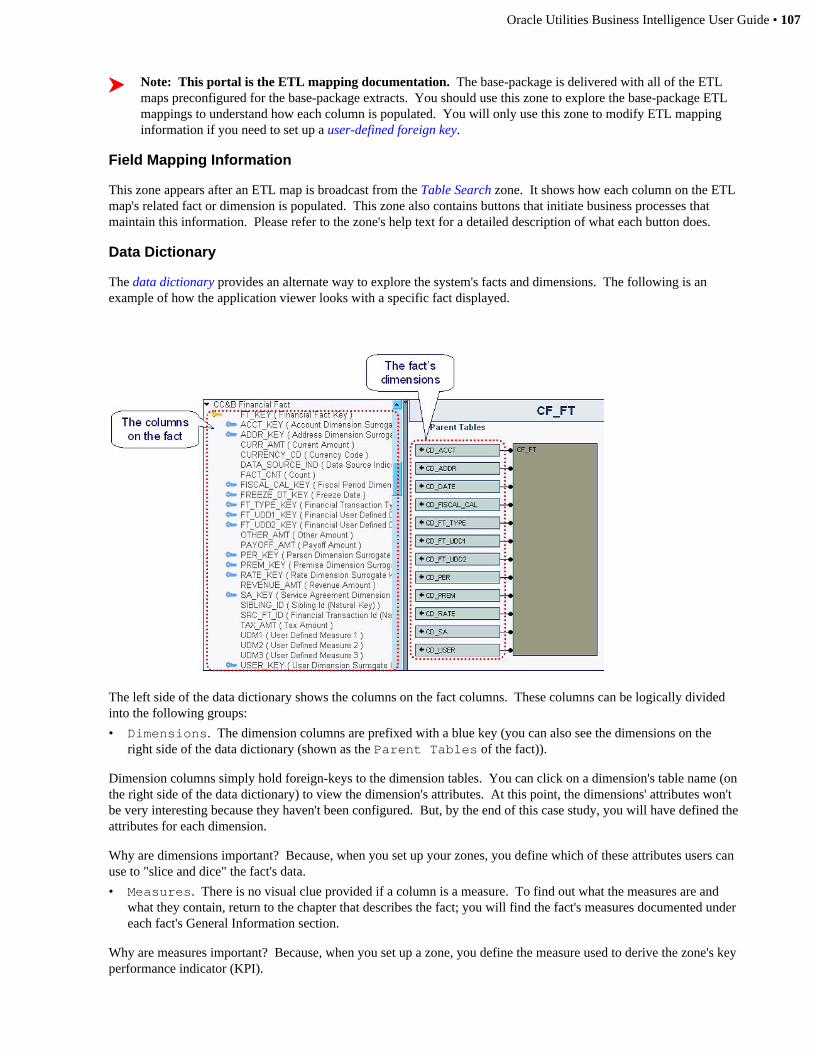
Oracle Utilities Business Intelligence User Guide • 107
Note: This portal is the ETL mapping documentation. The base-package is delivered with all of the ETLmaps preconfigured for the base-package extracts. You should use this zone to explore the base-package ETLmappings to understand how each column is populated. You will only use this zone to modify ETL mappinginformation if you need to set up a user-defined foreign key.
Field Mapping Information
This zone appears after an ETL map is broadcast from the Table Search zone. It shows how each column on the ETLmap's related fact or dimension is populated. This zone also contains buttons that initiate business processes thatmaintain this information. Please refer to the zone's help text for a detailed description of what each button does.
Data Dictionary
The data dictionary provides an alternate way to explore the system's facts and dimensions. The following is anexample of how the application viewer looks with a specific fact displayed.
The left side of the data dictionary shows the columns on the fact columns. These columns can be logically dividedinto the following groups:
• Dimensions. The dimension columns are prefixed with a blue key (you can also see the dimensions on theright side of the data dictionary (shown as the Parent Tables of the fact)).
Dimension columns simply hold foreign-keys to the dimension tables. You can click on a dimension's table name (onthe right side of the data dictionary) to view the dimension's attributes. At this point, the dimensions' attributes won'tbe very interesting because they haven't been configured. But, by the end of this case study, you will have defined theattributes for each dimension.
Why are dimensions important? Because, when you set up your zones, you define which of these attributes users canuse to "slice and dice" the fact's data.
• Measures. There is no visual clue provided if a column is a measure. To find out what the measures are andwhat they contain, return to the chapter that describes the fact; you will find the fact's measures documented undereach fact's General Information section.
Why are measures important? Because, when you set up a zone, you define the measure used to derive the zone's keyperformance indicator (KPI).
108 • Oracle Utilities Business Intelligence User Guide
• Other. You will find that there are other columns on a fact (e.g., columns containing the prime-keys of sourcetransactions).
Finding the table name. Use the Table Search zone to find the names of the facts and dimensions associated witha given source application. For example, you can use this zone to display a list of the facts populated from OracleUtilities Customer Care and Billing.
Populate the Date Dimension
The date dimension contains a separate row for every date in Oracle Utilities Business Intelligence. This dimensionis unusual in that it does NOT have an extract program. Rather, a utility generates the rows in this dimension. Thisutility is supplied in the form of a database-stored procedure called SPL_LOADDATE. This stored procedure isdelivered with the Oracle Warehouse Builder package. Note, the same procedure is also included in the initial datawarehouse setup workflow package called INIT_PKG for the execution. This stored procedure has start date and enddate as input parameters. These dates should be defined in the format:
• start date: to_date('20000101','YYYYMMDD')• end date: to_date('20090331','YYYYMMDD')
Enter the Description Of Each UDF
Enter the description of each user-defined fields (UDF) for every dimension.
Take special care with the value you enter. Why? Because this description appears in headings and labels throughoutOracle Utilities Business Intelligence. For example, it appears in the Filter Description, the Filter Area, the SliceBy values in the Graph Options Area, etc.
To define a dimension's UDF descriptions:
• Display the dimension on the Table - Main page.• Enter the desired description of each UDF in the Override Label field.
Note: If you are using Oracle Utilities Business Intelligence v2.3.0 or later, default descriptions for each UDFfield will already be entered for each table, so you will only need to update the descriptions for those UDFs thatare not extracted by default, or if the default extract is changed.
Add Indexes for UDF Columns
Oracle Utilities Business Intelligence is not delivered with indexes on every user-defined field (UDF) because weanticipate that each implementation would use only a small subset of UDFs. If you choose to use a UDF column on adimension table, you should strongly consider adding an Oracle bitmapped index on each UDF code and descriptionthat your implementation uses. This will greatly improve performance when the application retrieves the distinctvalues for each UDF (these values appear throughout the application).
Since the Oracle Business Intelligence Enterprise Edition Dashboards use materialized views in most cases, this is nota necessary step unless performance issues are seen when selecting drop-down values from dashboard prompts.
Enter the Description Of Each UDM
Enter the description of each user-defined measure (UDM) for every fact that necessitates such (this should be rare).
Take special care with the value you enter. Why? Because this description appears everywhere that the data for theUDM is shown in Oracle Utilities Business Intelligence.
To define a fact's UDM descriptions:
• Display the fact on the table page.• Enter the desired description of each UDM in the Override Label field.
Oracle Utilities Business Intelligence User Guide • 109
Note: If you are using Oracle Utilities Business Intelligence v2.3.0 or later, default descriptions for each UDMfield will already be entered for each table, so you will only need to update the descriptions for those UDMsthat are not extracted by default, or if the default extract is changed.
Enter the Description Of Each UDDGEN
Enter the description of each user-defined degenerate dimension (UDDGEN) for every degenerate dimension.
Take special care with the value you enter. Why? Because this description appears in headings and labels throughoutOracle Utilities Business Intelligence. For example, it appears in the Filter Description, the Filter Area, the SliceBy values in the Graph Options Area, etc.
To define a UDDGEN's description:• Display the fact on the Table - Main page.• Enter the desired description of each UDDGEN in the Override Label field.
If the UDDGEN appears as a filter in a zone:• Define a predefined value characteristic type for the UDDGEN:
• This characteristic type must be configured with a characteristic entity of BI Table Field .• A characteristic value should be defined for every value of the UDDGEN; the characteristic value's description
is the value that appears in the headings, labels and dropdowns.• Link the characteristic type to the UDDGEN column using the table transaction described above.
Note: If you are using Oracle Utilities Business Intelligence v2.3.0 or later, default descriptions for eachUDDGEN field will already be entered for each table, so you will only need to update the descriptions for thoseUDDGENs that are not extracted by default, or if the default extract is changed.
Add References To Existing Dimensions
Note: Not all facts support this feature. A limited number of facts allow an implementation to introducereferences to existing dimensions. The following section explains how to determine if a fact supports thisfeature.
Facts are delivered referencing the dimensions required by most implementations. However, there are requirementsthat can only be satisfied by changing the fact to reference an existing dimension. We will use a case study toexplain. Assume that the case fact is not delivered with a reference to the service agreement dimension. Also assumethat your users need to slice and filter cases by dimensional attributes on the service agreement dimension. If this is arequirement, you must perform the following tasks to add the service agreement dimension to the case fact:• Find the case fact on the Table Search zone and then click the Edit Staging button adjacent to the fact's Staging
Table name. This will cause the ETL Staging Table Maintenance dialog to open with the fields on thecase fact's staging table displayed. Look for fields that contain UDDFK. These fields are placeholders thatimplementations can use to add references to existing dimensions; if you don't see such fields on the stagingtable, then its fact does not support the ability to add references to existing dimensions. If you do see such fields,nominate one of them to hold the natural key of the service agreement.
• Update the UDDFK field to 0 for any existing records. This will allow the Foreign Key constraint to be defined.• Create a foreign key constraint in the database from the case fact to the service agreement dimension for the
UDDFK field chosen above. For example, assuming that UDDFK1_KEY field was chosen, use the followingSQL statement to create the foreign key constraint:
alter table CF_CASEadd constraint UDDF1_R1X FOREIGN KEY (UDDF1_KEY)REFERENCES CD_SA (SA_KEY);
• Modify the case table metadata for the UDDFK field. This needs to be done in the Table Maintenance screen. The label for the UDDFK field should be changed to indicate that it is now used as a Foreign key to the serviceagreement dimension. Also, a new foreign key constraint needs to be added on the Constraints tab.
• The name of the foreign key constraint should be 'CM_UDDF1_R1X'

110 • Oracle Utilities Business Intelligence User Guide
• The Constraint Type Flag should be 'Foreign Key'• The Enable Referential Integrity should be checked• The Referring Constraint ID can be selected by pressing the Lookup Icon and searching for the CD_SA table• The Constraint Field(s) field should be UDDF1_KEY• The sequence should be 1• Find a fact that already references the service agreement dimension. The easiest way to do this is to open the data
dictionary and display the dimension. You'll see a list of all of the facts that reference the dimension. Pick one ofthese facts (we'll refer to this as the "sample fact" below).
• Find the sample fact on the Table Search zone and then click the broadcast button adjacent to the fact's table nameto open the Field Mapping Information zone. This zone lists every field on the sample fact. Click the Edit iconadjacent to the field that contains the foreign key to the service agreement dimension. This will cause the ETLMap Fact Field Maintenance dialog to open with the ETL mapping rules used to populate the service agreementdimension on the sample fact. You should note these mapping rules as almost identical rules will be used topopulate the dimension on the case fact.
• Redisplay the case fact on the Table Search zone and then click the broadcast button adjacent to the fact's tablename to open the Field Mapping Information zone. Click the Edit icon adjacent to the UDDFK field that willhold a reference to the SA dimension on the case fact. This will cause the ETL Map Fact Field Maintenancedialog to open with the ETL mapping rules ready to be populated. You should enter rules almost identically to therules from the sample fact. The only difference should be the value of the Source Field on Staging; this shouldreference the UDDFK field on the staging record nominated in the first step.
• At this point, you are finished updating the meta-data that will be used to generate the OWB transform and loadlogic. To complete the population of the UDDFK you must now:
• Update the case extract program to populate the service agreement's natural key in the respective UDDFK field onthe case extract staging file.
• Regenerate OWB so it will use the new mapping rules to translate the natural service agreement ID on the stagingtable to a foreign key to the service agreement dimension.
To regenerate OWB, the following steps should be followed:• Run the GenOWB.exe file for the fact table. This program can be found in the scripts folder in the Database
Package.
GenOWB.exe -d spluser,spluser_pw,BICONN -t CF_CASE -m M -x YGenOWB.exe -d spluser,spluser_pw,BICONN -t CF_CASE -m W -x Y
• This will create the following two files: source SPLMAP_F_CASE.TCL and SPLWF_F_CASE.TCL• Load the TCL scripts created above into the OWB repository using OMBPlus from the OWB administrator menu• Connect to the repository as described using one of the following OMBCONNECT commands depending on the
OWB version you are using. (Note that the database connection settings will have to be changed).OMBCONNECT birepo/[email protected]:1521:BI2200WF USE REPOS 'BIREPOWN' /* owb10G */OMBCONNECT birepown/[email protected]:1521:BI2200QN USE REPOS 'SPLBIREP' /* owb 11g */
• Load the Mapping first using this OMBPlus command: source SPLMAP_F_CASE.TCL• Then Load the Workflow using this OMBPlus command: source SPLWF_F_CASE.TCL• Finally run the EditFP.tcl and editmail.tcl scripts used when OWB was initially set up for OUBI to set the Folder
and Mail setting for the modified Mappings and Process Flows• Enter the OMBCOMMIT command to save the changes in the repository• After the TCL files are loaded, the modified Mapping and Process flows need to be deployed in OWB.• The SPLMAP_F_CASE Mapping should be deployed first, using the Replace deployment action.• The FACT process flow package can then be deployed, also using the Replace deployment action.
Configure the Source Application
The installation of Oracle Utilities Business Intelligence also affects the source application (e.g., Oracle UtilitiesCustomer Care & Billing). The source application is impacted in two ways:• New background processes are installed to extract the data from the source application• Triggers are installed on the source application's database

Oracle Utilities Business Intelligence User Guide • 111
The topics in this section describe configuration tasks in the source application.
Confirm the Triggers In the Source System
When you installed Oracle Utilities Business Intelligence's components in the source application, triggers wereintroduced onto the database. These triggers insert a record on the change log table whenever an object whose datais held in Oracle Utilities Business Intelligence is added or changed. If you have not introduced user-exit code to theextract programs to extract additional information, you shouldn't have to change these triggers. However, it would bea good idea to confirm that they have been installed and are operational at this point.
FMI: Refer to Capturing Changes In Source Data for more information about triggers and the Change Log.
Recommendation. The base-package triggers should be considered as samples. These sample triggers containlogic that creates a change log whenever Oracle Utilities Business Intelligence sensitive fields are changed. Yourimplementation probably only cares about a subset of these fields (e.g., you might only use 3 fields on the addressdimension, but the trigger caters for 10 fields). We therefore recommend that you excise logic from the sampletriggers for unused fields. By excising this extraneous logic, you will reduce the number of rows on your dimensions.
Product-Specific Configuration Tasks
The topics in this section describe configuration tasks unique to each source product.
Customer Care and Billing
When you installed Oracle Utilities Business Intelligence's components in the Oracle Utilities Customer Care andBilling product, background processes were introduced. These processes extract data from the source application. Perform the following tasks before executing these programs:
• Display each extract process's batch control in the source application and populate its parameters accordingly. Keep in mind that those extract programs that populate UDFs and UDMs must have their parameters set upaccordingly.
• Populate a Feature Configuration with the file path in which the extract flat files will be placed. This featurewill have a Feature Type of Extract Analytics ; and a single O ption Type of File Path with an Option Valueof the location of the flat files produced by the extract processes. When supplying the File Path option value, thedirectory specified in the File Path must already exist and must grant write access to the administrator account.You may need to verify a proper location with your system administrator. The syntax of the File Path depends onthe platform used for your application server. Contact your system administrator for verification. For example, ifthe platform is UNIX, use forward slashes and be sure to put a trailing slash, for example /extracts/filepath/ .
Extract documentation. Refer to Common Behavior Of Extract Processes for a generic description of the variousparameters supplied to all extract batch processes. For a description of a specific extract process's parameters,navigate to the Table Search zone and click the Edit Mapping button adjacent to a given fact or dimension.
Extract recent changes mode. Every extract has a parameter that controls if the process extracts everything OR onlyrecent changes. We strongly recommend setting this parameter on the batch control to extract recent changes as youwill only execute the extract in "extract everything mode" once.
Network Management System
Most of the Oracle Utilities Network Management Systems fact and dimensions have an extract process whichis called by one or more of the following Oracle Utilities Network Management Systems scripts: nrt_extractor,bi_common_extractor, bi_customer_extractor and bi_event_extractor. These PL/SQL processes extract data fromOracle Utilities Network Management Systems system and transfer it to flat files. Along with each flat file containingthe extract data (data file), a one-line control file containing the batch information about the extractor program is alsogenerated. The data and the control flat files, in turn, are loaded into the Oracle Utilities Business Intelligence datawarehouse as described in Business Intelligence Fundamentals. The topics in this section describe aspects commonto these extract processes.

112 • Oracle Utilities Business Intelligence User Guide
Extracts and Triggers in Network Management System
The installation of Oracle Utilities Business Intelligence also affects the source application (e.g., Oracle UtilitiesNetwork Management Systems). The Oracle Utilities Network Management Systems application is impacted in threeways:
• A new field is added to source tables that do not have a field that indicates when the record was last updated. This field is called LAST_UPDATE_TIME. Note that tables that already have modification date fields (such asNETWORK_COMPONENTS) do not have this field added.
• Triggers are installed in the Oracle Utilities Network Management Systems database that update this newly addedfield when records are inserted or updated, or the keys for deleted records are inserted into a new Delete Log tablewhen a record is deleted. These triggers are only added for tables that required the LAST_UPDATE_TIME fieldadded.
• Views are created that merge the data written by each extract process with a value of when the data last changed.
The extract programs identify the recent change by querying the appropriate Oracle Utilities Network ManagementSystems view and looking for records that have been modified since the last run of the extractor. The last run time foran extractor is stored in the BI_EXTRACTOR_LOG table. The triggers will update the LAST_UPDATE_TIME fieldwhen any field in transferred tables is modified.
Mode of Execution in Network Management System
The Oracle Utilities Network Management Systems extract programs only support one mode of execution. OracleUtilities Network Management Systems data always extract data that has been modified since the last extractionprocess. However, when the Oracle Utilities Business Intelligence application is first installed in the Oracle UtilitiesNetwork Management Systems database by running the install_business_intelligence script, the Last Extraction Timestored in the BI_EXTRACTOR_LOG table for each extractor is set to a default value of 01-JAN-1990, which willcause all of the Oracle Utilities Network Management Systems data to be extracted when the extractor programs arefirst run.
If all of the data needs to be re-extracted, then the install_business_intelligence script can be rerun which will resetthe Last Extraction Time for all of the extractors.
Populating UDFs and UDMs in Network Management System
Most extract processes support populating User Defined Fields (UDFs) and User Defined Measure (UDMs) fieldson their flat file records with specific fields from the source system. For example, you can set up the premise extractprogram to populate the first UDF on its flat file with the premise's city (or county or any address-oriented field).
You indicate which fields to populate on the flat file by changing the definition of the Oracle Utilities NetworkManagement Systems view that is used to extract the data. This change should be made by creating a project-specificversion of the base view definition file, and by changing the definition of this file to extract what is required for theproject. Any information in the Oracle Utilities Network Management Systems database is available for extracting.However, if changes to tables that currently do not have a modification date field need to be extracted, then triggerswould have to be defined for these tables.
If changes are made to the view definitions, then the script refresh_business_intelligence can be run to recreate thePL/SQL extractor programs stored in the database, and reload the view definitions for each of the extract views. This will not cause all of the data to be re-extracted; it will just change the data that is stored in the extract files goingforward.
Oracle Utilities Work and Asset Management
Oracle Utilities Business Intelligence for Oracle Utilities Work & Asset Management uses extraction programspackaged with the Oracle Utilities Application Framework. The extraction programs for Oracle Utilities Work &Asset Management are written in PL/SQL and are loaded into Oracle Utilities Business Intelligence using OracleUtilities Application Framework

Oracle Utilities Business Intelligence User Guide • 113
Users can view batch control records, submit batch jobs and view the batch run tree using the Oracle Utilities Work &Asset Management application.
FMI: Please refer to the Oracle Utilities Work & Asset Management Configuration Guide for details on therequired configurations or contact your Oracle representative for more information.
Extract Everything From the Source Application
At this point, you are ready to schedule the extract processes. To do this, execute every extract process in extracteverything mode. Each extract will produce a flat file. These flat files will contain the data to be transferred fromthe source application to Oracle Utilities Business Intelligence. After the flat files exist, transfer to Oracle UtilitiesBusiness Intelligence and upload these flat files using the Oracle Warehouse Builder workflow engine.
Prepare To Extract Recent Changes
Set up your batch scheduler in the source application to periodically execute every extract process in extract recentchanges mode. Each extract will produce a flat file. These flat files will contain changes to the facts and dimensionsthat took place since the last time the extract was executed. You must also set up the Oracle Warehouse Builderworkflow engine to upload these files.
Set Up Zones
Having determined the Facts and Dimensions you wish to display in an analytic, it now needs to be configured usingZone Maintenance. The parameter descriptions provide a rich source of information about the available settings forthe parameter and, often, there is an example. All required parameters must be given a value but there are also manyoptional parameters that you can use to enhance the analytic (some of which have default values).
The Demo environment provided with the Oracle Utilities Business Intelligence release contains many examplezones. These can be examined for techniques regarding zone configuration, or simply copied if they fulfill therequirements.
The only thing left to do is determine if you are going to restrict access to specific zones. We anticipate that this willbe fairly rare because we assume most implementations will simply restrict access to portals (and if a user doesn'thave access to a portal, they can't see any of its zones).
If you want to restrict access to specific zones, you must set up an application service for the zone. We wouldrecommend naming this application service the same as the zone's code.
If you only plan to implement security at the portal level, create a single application service (e.g., CM UNSECUR ).You will then define this application service on your zones.
Note: This only applies only to the user interface used in Oracle Utilities Business Intelligence versions 2.0.5and 2.2.x. If you are using Oracle Utilities Business Intelligence v2.3.0 or later, standard answers will alreadybe part of the delivery.
Set Up Portals
After your zones have been set up, you can set up your portals. The following points describe how to do this:
• Add a new portal and specify its zones.• When the portal is added, the system also adds an application service behind the scenes (the name is shown on
the portal page). You will need to grant the appropriate user groups access to this application service before theirusers can see the portal. Refer to Granting Access To A Portal for the details.
• When the portal is added, the system also adds a navigation option behind the scenes (the name is shown on theportal page). You must specify this navigation option on the appropriate menu before it appears on a menu. Youshould also consider updating this navigation option's usage so it can be used as a favorite transaction by yourusers.

114 • Oracle Utilities Business Intelligence User Guide
Note: This only applies only to the user interface used in Oracle Utilities Business Intelligence versions 2.0.5and 2.2.x. If you are using Oracle Utilities Business Intelligence v2.3.0 or later, standard dashboards willalready be part of the delivery.
Set Up Materialized Views
After your zones are set up, you must set up materialized views so the SQL generated from the zones performsadequately.
Note: This only applies only to the user interface used in Oracle Utilities Business Intelligence versions 2.0.5and 2.2.x. If you are using Oracle Utilities Business Intelligence v2.3.0 or later, standard materialized viewswill already be part of the delivery, as described in the Working With Materialized Views section below.
Configure Oracle Warehouse Builder
The following points describe how to configure Oracle Warehouse Builder:
• Define the email address of the recipient of emails sent by Oracle Warehouse Builder. This is defined on thevarious process flows.
• Define the file location in which the extract flat files are placed (this must be the same location as defined for the extract jobs). The file location is defined on the various data load process flows (in the parameters passed to thefile manager). The same location must be used when registering the flat file locations during Oracle WarehouseBuilder deployment.
• Finally, set up the job scheduling engine that your implementation will use to periodically execute the variousprocess flows.
Working With Materialized Views
The topics in this section provide background information about materialized views.
FMI: This section summarizes how materialized views are used in Oracle Utilities Business Intelligence; itis not meant to replace Oracle's documentation. Refer to Oracle's Data Warehousing Guide for a thoroughdescription of materialized views.
The Need for Materialized Views
Fact tables typically contain many rows. In order for the queries against a data-warehouse to perform adequately, thefacts must be summarized. While online analytic processing (OLAP) servers are designed to perform this task, werecommend a less costly approach - use "materialized views" to hold your summarized analytic data.
A materialized view is a database object that stores the results of a query. In data warehouses, materialized views areused to compute and store aggregated data such as sums, averages and counts.
Materialized views improve query performance by pre-calculating resource intensive joins between fact anddimension tables and aggregation operations on the database prior to execution and storing the results in the database.Additionally, the query optimizer automatically recognizes when an existing materialized view can be used tosatisfy a request. It then transparently rewrites the request to use the materialized view. Queries go directly to thematerialized view and not to the underlying tables. In general, rewriting queries to use materialized views rather thanunderlying tables improves response.
Materialized views are similar to indexes in several ways:
• The purpose of a materialized view is to increase query execution performance.• The existence of a materialized view is transparent to SQL applications. A database administrator (DBA) can
create or drop materialized views at any time without affecting the validity of SQL applications.• A materialized view contains data and consumes storage space.• Materialized views must be updated when the underlying tables are modified.
Unlike indexes, materialized views can be accessed directly using a SELECT statement.
Oracle Utilities Business Intelligence User Guide • 115
Periodic Refreshing of Materialized Views
During the ETL (Extract, Transform, and Load) process, new and changed data from the source application isloaded into the data warehouse schema. After the load processing is complete, you would typically build indexes,validate constraints, and take backups before making the new data available to end-users. An additional step isrequired when materialized views exist - you must refresh the materialized view to reflect the latest data.
Oracle offers the ability to update materialized views automatically (e.g., when the underlying tables are changing)or refresh them on demand. Oracle also allows you to indicate whether a materialized view is rebuilt completely orincrementally.
FMI: Refer to Oracle's Data Warehousing Guide for the details on these options.
Query Rewrite is the Key
One of the major benefits of creating and maintaining materialized views is the ability to take advantage of "queryrewrite". Query rewrite transforms an SQL statement expressed in terms of facts and dimension tables into astatement accessing one or more materialized views. The transformation is transparent to the end user or application,requiring no intervention and no reference to the materialized view in the SQL statement. Because query rewriteis transparent, materialized views can be added or dropped just like indexes without invalidating the SQL in theapplication code.
Before the query is rewritten, it is subjected to several checks to determine whether it is a candidate for query rewrite.If the query fails any of the checks, the query is applied directly to the fact and the dimension tables rather than thematerialized view. This is not desirable since it can be costly in terms of response time and processing power.
The Oracle optimizer uses two different methods to recognize when to rewrite a query in terms of one or morematerialized views. The first method is based on matching the SQL text of the query with the SQL text of thematerialized view definition. If the first method fails, the optimizer uses a more general method in which it comparesjoins, selections, data columns, grouping columns, and aggregate functions between the query and a materializedview.
When using query rewrite, you may want to create a materialized view that satisfies multiple queries. For example,if you identify 10 answers for a fact table, you might be able to satisfy them all with a few, well-written materializedviews.
A query is rewritten only when a certain number of conditions are met:
• Query rewrite is enabled for the session.• A materialized view is enabled for query rewrite.• The rewrite integrity level set for the session allows the use of the materialized view.• The database must be able to resolve the executed query by fetching results from the existing materialized views.
To assist in designing and using materialized view, Oracle provides an explain rewrite procedure which will advisewhether query rewrite is possible on a query and if so, which materialized views will be used.
To help design materialized views, Oracle provides a set of advisory procedures in the DBMS_OLAP package to helpin designing and evaluating materialized views for query rewrite. These functions are also known as the SummaryAdvisor. Oracle's Enterprise Manager provides user interface to work with Summary Advisor.
FMI: Refer to Oracle's Data Warehousing Guide to learn more about Query Rewrite functionality.
Materialized Views in Oracle Utilities Business Intelligence
Oracle Utilities Business Intelligence answers retrieve data from the fact and dimension tables and are unaware ofthe existence of materialized views in the database. To get faster response, materialized views must be created andmaintained in the database.
116 • Oracle Utilities Business Intelligence User Guide
The following features are built into Oracle Utilities Business Intelligence to support the usage of materialized views:• Oracle Utilities Business Intelligence star-schemas abide by classic data-warehousing theory, i.e., the dimension
tables join directly to the fact table and "snowflakes" (i.e., dimensions referencing other dimensions) are avoided.• Foreign key constraints between the fact tables and their dimension tables are defined in the database.• Foreign keys on facts are always populated (a dimension's default value is referenced on a fact if the fact doesn't
reference a given dimension).• Hierarchies between dimensional attributes are defined when appropriate.• Date and Fiscal calendar dimension tables have been designed to avoid the date-folding issues.• The default Oracle Business Intelligence Enterprise Edition answers delivered in Oracle Utilities Business
Intelligence generate star-queries that can be rewritten using the standard materialized views that are providedwith the base installation package.
Creating Standard Materialized Views
The standard materialized views are defined in the OWB metadata for Oracle Utilities Customer Care and Billing,Oracle Utilities Work and Asset Management, and Oracle Utilities Network Management System. For OracleUtilities Meter Data Management, the materialized views documented in the Oracle Utilities Meter Data ManagementBusiness Intelligence Data Mapping Guide will need to be created in the Meter Data Management database before theMeter Data Management analytics will be usable.
To create a materialized view, follow the OWB configuration steps in the Installation documentation for deployingthe materialized views. Note that it’s possible to wait to deploy the materialized views until after the initial loadof data from the edge app. This will limit the change capture data needed in the materialized view logs for eachmaterialized view.
FMI: Refer to Oracle's Data Warehousing Guide to learn more about configuring materialized views.
Customizing Materialized Views
We recommend creating copies of the Materialized views instead of modifying the default materialized views if anychanges are made for custom changes. The following list describes customizations that will require changes to thematerialized views:• Non-standard data requirements: If any answers have new fields added that are not already present in an
existing materialized view, then they will need to be added to an existing materialized view.• Parallelism: The materialized views do not include any parallelism clauses, so if the data warehouse supports
parallelism then a parallel hint can be added to the Select query of the materialized view creation statement.
Refreshing Materialized Views
The Materialized view creation statements make use of the FAST option when the underlying data can support a Fastrefresh. However, a few materialized views can not always be maintained using Fast refresh, so these materializedviews default to FORCE, which means that the refresh will be Fast if possible, but Complete otherwise.
Materialized View Logs on the underlying tables have been created based on the standard columns in each of thematerialized views. If customizations are required, then the materialized view logs for each table can be modified tocontain extra columns that are not present by default in the standard materialized views.
To refresh a materialized view, the DBMS_MVIEW.REFRESH procedure can be used. For example, to refresh theB1_WRKORD_TK_MON_MV1 view, use this SQL command:
exec dbms_mview.refresh( 'B1_WRKORD_TK_MON_MV1' );
The refresh of the materialized views are supported in OWB by calling the OUBI_REFRESH_MV_FNC for thematerialized view that should be refreshed.
A refresh should be run after data is loaded into the Fact table that the materialized view is created from. So in therefresh example above, the B1_WRKORD_TK_MON_MV1 view should be refreshed after the CF_WRKORD_TKtable is loaded with new extract files. To refresh materialized views after loading data into a fact table, call the
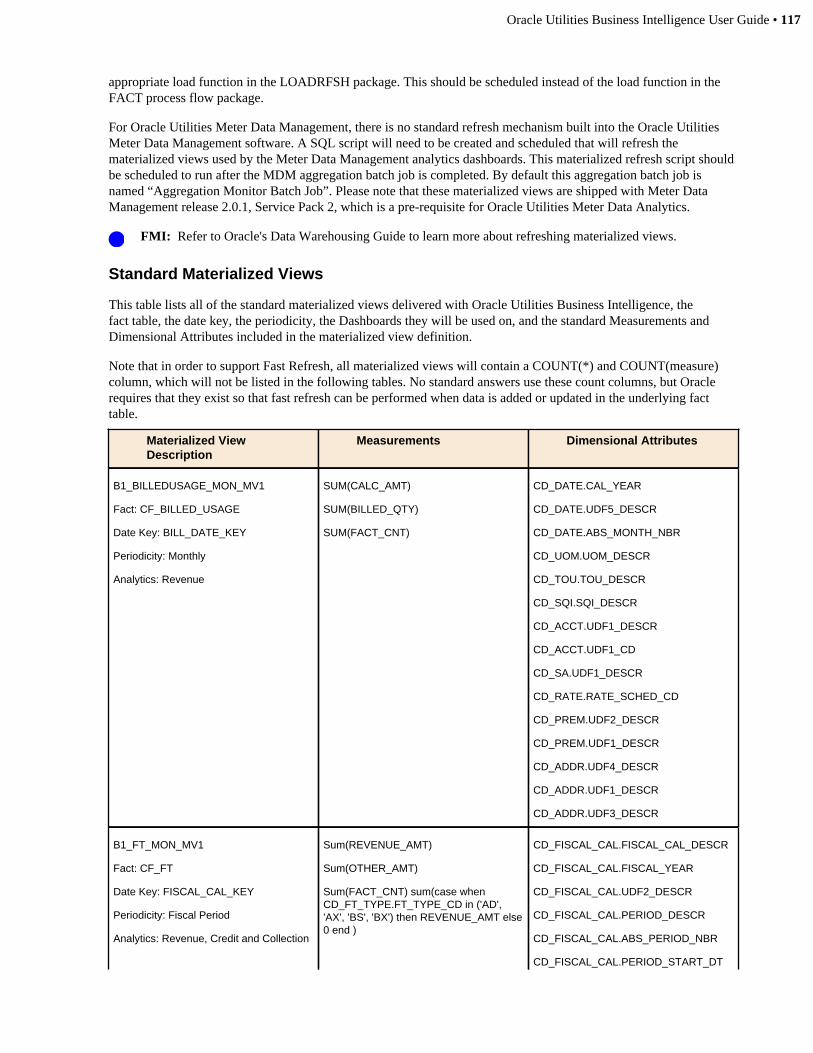
Oracle Utilities Business Intelligence User Guide • 117
appropriate load function in the LOADRFSH package. This should be scheduled instead of the load function in theFACT process flow package.
For Oracle Utilities Meter Data Management, there is no standard refresh mechanism built into the Oracle UtilitiesMeter Data Management software. A SQL script will need to be created and scheduled that will refresh thematerialized views used by the Meter Data Management analytics dashboards. This materialized refresh script shouldbe scheduled to run after the MDM aggregation batch job is completed. By default this aggregation batch job isnamed “Aggregation Monitor Batch Job”. Please note that these materialized views are shipped with Meter DataManagement release 2.0.1, Service Pack 2, which is a pre-requisite for Oracle Utilities Meter Data Analytics.
FMI: Refer to Oracle's Data Warehousing Guide to learn more about refreshing materialized views.
Standard Materialized Views
This table lists all of the standard materialized views delivered with Oracle Utilities Business Intelligence, thefact table, the date key, the periodicity, the Dashboards they will be used on, and the standard Measurements andDimensional Attributes included in the materialized view definition.
Note that in order to support Fast Refresh, all materialized views will contain a COUNT(*) and COUNT(measure)column, which will not be listed in the following tables. No standard answers use these count columns, but Oraclerequires that they exist so that fast refresh can be performed when data is added or updated in the underlying facttable.
Materialized ViewDescription
Measurements Dimensional Attributes
B1_BILLEDUSAGE_MON_MV1
Fact: CF_BILLED_USAGE
Date Key: BILL_DATE_KEY
Periodicity: Monthly
Analytics: Revenue
SUM(CALC_AMT)
SUM(BILLED_QTY)
SUM(FACT_CNT)
CD_DATE.CAL_YEAR
CD_DATE.UDF5_DESCR
CD_DATE.ABS_MONTH_NBR
CD_UOM.UOM_DESCR
CD_TOU.TOU_DESCR
CD_SQI.SQI_DESCR
CD_ACCT.UDF1_DESCR
CD_ACCT.UDF1_CD
CD_SA.UDF1_DESCR
CD_RATE.RATE_SCHED_CD
CD_PREM.UDF2_DESCR
CD_PREM.UDF1_DESCR
CD_ADDR.UDF4_DESCR
CD_ADDR.UDF1_DESCR
CD_ADDR.UDF3_DESCR
B1_FT_MON_MV1
Fact: CF_FT
Date Key: FISCAL_CAL_KEY
Periodicity: Fiscal Period
Analytics: Revenue, Credit and Collection
Sum(REVENUE_AMT)
Sum(OTHER_AMT)
Sum(FACT_CNT) sum(case whenCD_FT_TYPE.FT_TYPE_CD in ('AD','AX', 'BS', 'BX') then REVENUE_AMT else0 end )
CD_FISCAL_CAL.FISCAL_CAL_DESCR
CD_FISCAL_CAL.FISCAL_YEAR
CD_FISCAL_CAL.UDF2_DESCR
CD_FISCAL_CAL.PERIOD_DESCR
CD_FISCAL_CAL.ABS_PERIOD_NBR
CD_FISCAL_CAL.PERIOD_START_DT
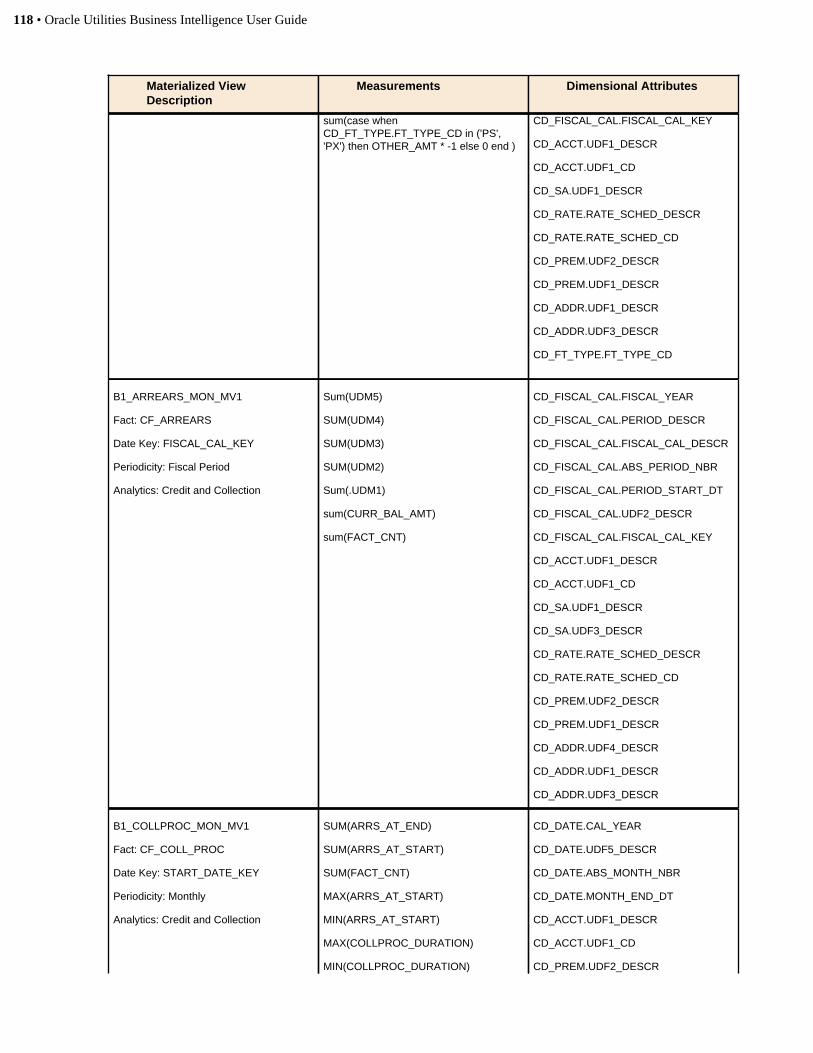
118 • Oracle Utilities Business Intelligence User Guide
Materialized ViewDescription
Measurements Dimensional Attributes
sum(case whenCD_FT_TYPE.FT_TYPE_CD in ('PS','PX') then OTHER_AMT * -1 else 0 end )
CD_FISCAL_CAL.FISCAL_CAL_KEY
CD_ACCT.UDF1_DESCR
CD_ACCT.UDF1_CD
CD_SA.UDF1_DESCR
CD_RATE.RATE_SCHED_DESCR
CD_RATE.RATE_SCHED_CD
CD_PREM.UDF2_DESCR
CD_PREM.UDF1_DESCR
CD_ADDR.UDF1_DESCR
CD_ADDR.UDF3_DESCR
CD_FT_TYPE.FT_TYPE_CD
B1_ARREARS_MON_MV1
Fact: CF_ARREARS
Date Key: FISCAL_CAL_KEY
Periodicity: Fiscal Period
Analytics: Credit and Collection
Sum(UDM5)
SUM(UDM4)
SUM(UDM3)
SUM(UDM2)
Sum(.UDM1)
sum(CURR_BAL_AMT)
sum(FACT_CNT)
CD_FISCAL_CAL.FISCAL_YEAR
CD_FISCAL_CAL.PERIOD_DESCR
CD_FISCAL_CAL.FISCAL_CAL_DESCR
CD_FISCAL_CAL.ABS_PERIOD_NBR
CD_FISCAL_CAL.PERIOD_START_DT
CD_FISCAL_CAL.UDF2_DESCR
CD_FISCAL_CAL.FISCAL_CAL_KEY
CD_ACCT.UDF1_DESCR
CD_ACCT.UDF1_CD
CD_SA.UDF1_DESCR
CD_SA.UDF3_DESCR
CD_RATE.RATE_SCHED_DESCR
CD_RATE.RATE_SCHED_CD
CD_PREM.UDF2_DESCR
CD_PREM.UDF1_DESCR
CD_ADDR.UDF4_DESCR
CD_ADDR.UDF1_DESCR
CD_ADDR.UDF3_DESCR
B1_COLLPROC_MON_MV1
Fact: CF_COLL_PROC
Date Key: START_DATE_KEY
Periodicity: Monthly
Analytics: Credit and Collection
SUM(ARRS_AT_END)
SUM(ARRS_AT_START)
SUM(FACT_CNT)
MAX(ARRS_AT_START)
MIN(ARRS_AT_START)
MAX(COLLPROC_DURATION)
MIN(COLLPROC_DURATION)
CD_DATE.CAL_YEAR
CD_DATE.UDF5_DESCR
CD_DATE.ABS_MONTH_NBR
CD_DATE.MONTH_END_DT
CD_ACCT.UDF1_DESCR
CD_ACCT.UDF1_CD
CD_PREM.UDF2_DESCR
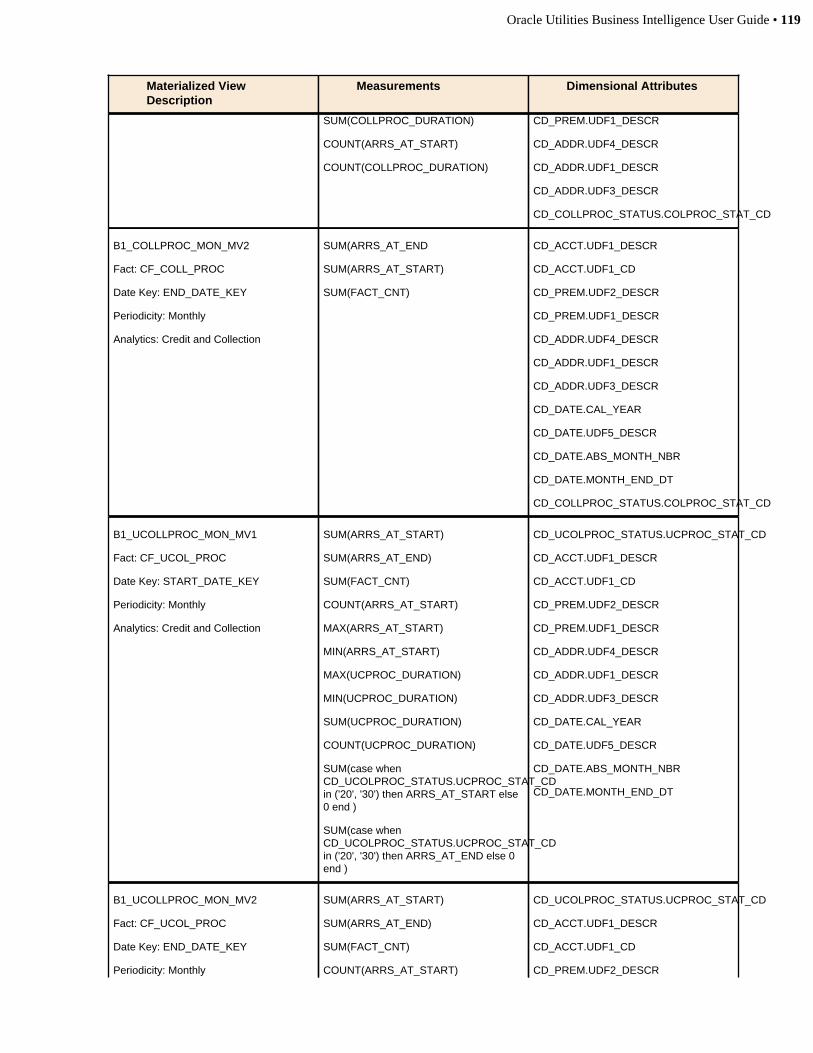
Oracle Utilities Business Intelligence User Guide • 119
Materialized ViewDescription
Measurements Dimensional Attributes
SUM(COLLPROC_DURATION)
COUNT(ARRS_AT_START)
COUNT(COLLPROC_DURATION)
CD_PREM.UDF1_DESCR
CD_ADDR.UDF4_DESCR
CD_ADDR.UDF1_DESCR
CD_ADDR.UDF3_DESCR
CD_COLLPROC_STATUS.COLPROC_STAT_CD
B1_COLLPROC_MON_MV2
Fact: CF_COLL_PROC
Date Key: END_DATE_KEY
Periodicity: Monthly
Analytics: Credit and Collection
SUM(ARRS_AT_END
SUM(ARRS_AT_START)
SUM(FACT_CNT)
CD_ACCT.UDF1_DESCR
CD_ACCT.UDF1_CD
CD_PREM.UDF2_DESCR
CD_PREM.UDF1_DESCR
CD_ADDR.UDF4_DESCR
CD_ADDR.UDF1_DESCR
CD_ADDR.UDF3_DESCR
CD_DATE.CAL_YEAR
CD_DATE.UDF5_DESCR
CD_DATE.ABS_MONTH_NBR
CD_DATE.MONTH_END_DT
CD_COLLPROC_STATUS.COLPROC_STAT_CD
B1_UCOLLPROC_MON_MV1
Fact: CF_UCOL_PROC
Date Key: START_DATE_KEY
Periodicity: Monthly
Analytics: Credit and Collection
SUM(ARRS_AT_START)
SUM(ARRS_AT_END)
SUM(FACT_CNT)
COUNT(ARRS_AT_START)
MAX(ARRS_AT_START)
MIN(ARRS_AT_START)
MAX(UCPROC_DURATION)
MIN(UCPROC_DURATION)
SUM(UCPROC_DURATION)
COUNT(UCPROC_DURATION)
SUM(case whenCD_UCOLPROC_STATUS.UCPROC_STAT_CDin ('20', '30') then ARRS_AT_START else0 end )
SUM(case whenCD_UCOLPROC_STATUS.UCPROC_STAT_CDin ('20', '30') then ARRS_AT_END else 0end )
CD_UCOLPROC_STATUS.UCPROC_STAT_CD
CD_ACCT.UDF1_DESCR
CD_ACCT.UDF1_CD
CD_PREM.UDF2_DESCR
CD_PREM.UDF1_DESCR
CD_ADDR.UDF4_DESCR
CD_ADDR.UDF1_DESCR
CD_ADDR.UDF3_DESCR
CD_DATE.CAL_YEAR
CD_DATE.UDF5_DESCR
CD_DATE.ABS_MONTH_NBR
CD_DATE.MONTH_END_DT
B1_UCOLLPROC_MON_MV2
Fact: CF_UCOL_PROC
Date Key: END_DATE_KEY
Periodicity: Monthly
SUM(ARRS_AT_START)
SUM(ARRS_AT_END)
SUM(FACT_CNT)
COUNT(ARRS_AT_START)
CD_UCOLPROC_STATUS.UCPROC_STAT_CD
CD_ACCT.UDF1_DESCR
CD_ACCT.UDF1_CD
CD_PREM.UDF2_DESCR
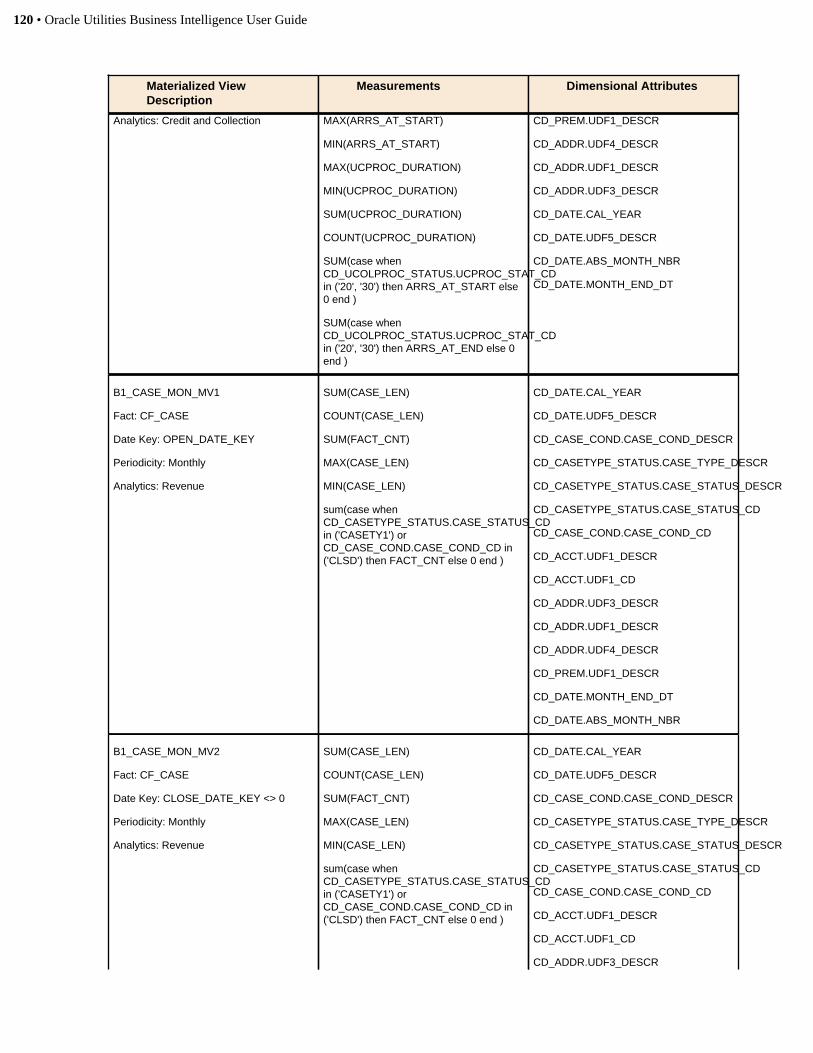
120 • Oracle Utilities Business Intelligence User Guide
Materialized ViewDescription
Measurements Dimensional Attributes
Analytics: Credit and Collection MAX(ARRS_AT_START)
MIN(ARRS_AT_START)
MAX(UCPROC_DURATION)
MIN(UCPROC_DURATION)
SUM(UCPROC_DURATION)
COUNT(UCPROC_DURATION)
SUM(case whenCD_UCOLPROC_STATUS.UCPROC_STAT_CDin ('20', '30') then ARRS_AT_START else0 end )
SUM(case whenCD_UCOLPROC_STATUS.UCPROC_STAT_CDin ('20', '30') then ARRS_AT_END else 0end )
CD_PREM.UDF1_DESCR
CD_ADDR.UDF4_DESCR
CD_ADDR.UDF1_DESCR
CD_ADDR.UDF3_DESCR
CD_DATE.CAL_YEAR
CD_DATE.UDF5_DESCR
CD_DATE.ABS_MONTH_NBR
CD_DATE.MONTH_END_DT
B1_CASE_MON_MV1
Fact: CF_CASE
Date Key: OPEN_DATE_KEY
Periodicity: Monthly
Analytics: Revenue
SUM(CASE_LEN)
COUNT(CASE_LEN)
SUM(FACT_CNT)
MAX(CASE_LEN)
MIN(CASE_LEN)
sum(case whenCD_CASETYPE_STATUS.CASE_STATUS_CDin ('CASETY1') orCD_CASE_COND.CASE_COND_CD in('CLSD') then FACT_CNT else 0 end )
CD_DATE.CAL_YEAR
CD_DATE.UDF5_DESCR
CD_CASE_COND.CASE_COND_DESCR
CD_CASETYPE_STATUS.CASE_TYPE_DESCR
CD_CASETYPE_STATUS.CASE_STATUS_DESCR
CD_CASETYPE_STATUS.CASE_STATUS_CD
CD_CASE_COND.CASE_COND_CD
CD_ACCT.UDF1_DESCR
CD_ACCT.UDF1_CD
CD_ADDR.UDF3_DESCR
CD_ADDR.UDF1_DESCR
CD_ADDR.UDF4_DESCR
CD_PREM.UDF1_DESCR
CD_DATE.MONTH_END_DT
CD_DATE.ABS_MONTH_NBR
B1_CASE_MON_MV2
Fact: CF_CASE
Date Key: CLOSE_DATE_KEY <> 0
Periodicity: Monthly
Analytics: Revenue
SUM(CASE_LEN)
COUNT(CASE_LEN)
SUM(FACT_CNT)
MAX(CASE_LEN)
MIN(CASE_LEN)
sum(case whenCD_CASETYPE_STATUS.CASE_STATUS_CDin ('CASETY1') orCD_CASE_COND.CASE_COND_CD in('CLSD') then FACT_CNT else 0 end )
CD_DATE.CAL_YEAR
CD_DATE.UDF5_DESCR
CD_CASE_COND.CASE_COND_DESCR
CD_CASETYPE_STATUS.CASE_TYPE_DESCR
CD_CASETYPE_STATUS.CASE_STATUS_DESCR
CD_CASETYPE_STATUS.CASE_STATUS_CD
CD_CASE_COND.CASE_COND_CD
CD_ACCT.UDF1_DESCR
CD_ACCT.UDF1_CD
CD_ADDR.UDF3_DESCR
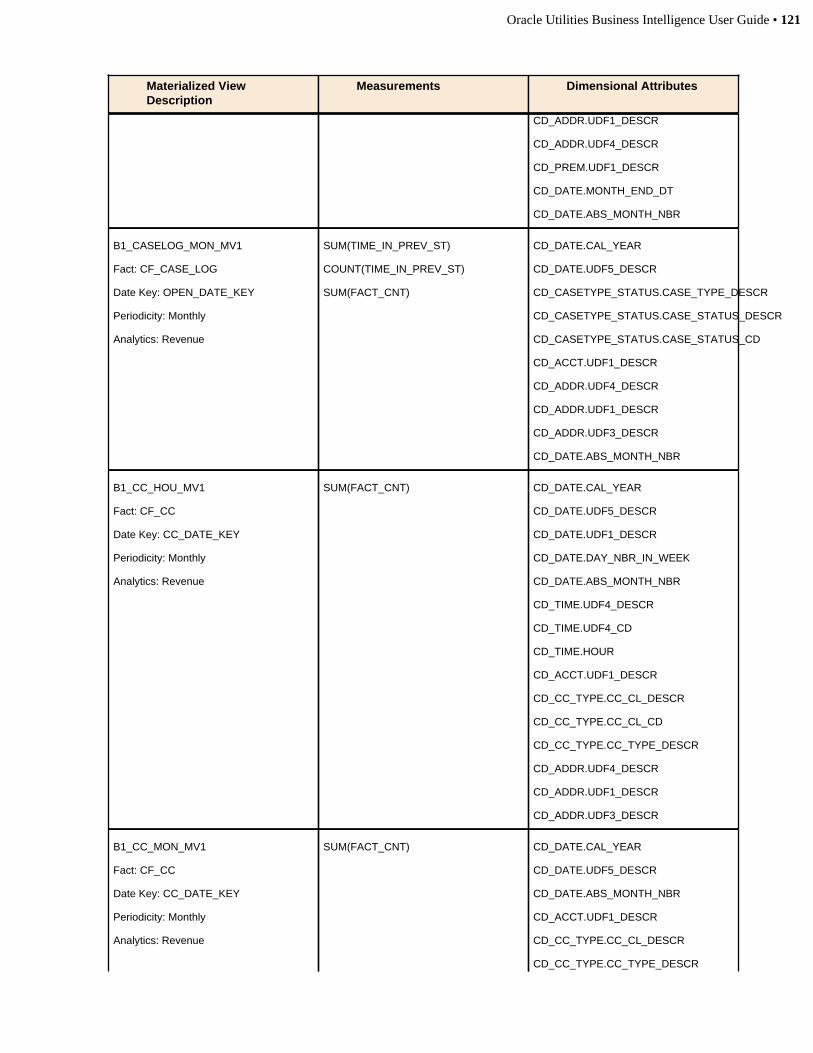
Oracle Utilities Business Intelligence User Guide • 121
Materialized ViewDescription
Measurements Dimensional Attributes
CD_ADDR.UDF1_DESCR
CD_ADDR.UDF4_DESCR
CD_PREM.UDF1_DESCR
CD_DATE.MONTH_END_DT
CD_DATE.ABS_MONTH_NBR
B1_CASELOG_MON_MV1
Fact: CF_CASE_LOG
Date Key: OPEN_DATE_KEY
Periodicity: Monthly
Analytics: Revenue
SUM(TIME_IN_PREV_ST)
COUNT(TIME_IN_PREV_ST)
SUM(FACT_CNT)
CD_DATE.CAL_YEAR
CD_DATE.UDF5_DESCR
CD_CASETYPE_STATUS.CASE_TYPE_DESCR
CD_CASETYPE_STATUS.CASE_STATUS_DESCR
CD_CASETYPE_STATUS.CASE_STATUS_CD
CD_ACCT.UDF1_DESCR
CD_ADDR.UDF4_DESCR
CD_ADDR.UDF1_DESCR
CD_ADDR.UDF3_DESCR
CD_DATE.ABS_MONTH_NBR
B1_CC_HOU_MV1
Fact: CF_CC
Date Key: CC_DATE_KEY
Periodicity: Monthly
Analytics: Revenue
SUM(FACT_CNT) CD_DATE.CAL_YEAR
CD_DATE.UDF5_DESCR
CD_DATE.UDF1_DESCR
CD_DATE.DAY_NBR_IN_WEEK
CD_DATE.ABS_MONTH_NBR
CD_TIME.UDF4_DESCR
CD_TIME.UDF4_CD
CD_TIME.HOUR
CD_ACCT.UDF1_DESCR
CD_CC_TYPE.CC_CL_DESCR
CD_CC_TYPE.CC_CL_CD
CD_CC_TYPE.CC_TYPE_DESCR
CD_ADDR.UDF4_DESCR
CD_ADDR.UDF1_DESCR
CD_ADDR.UDF3_DESCR
B1_CC_MON_MV1
Fact: CF_CC
Date Key: CC_DATE_KEY
Periodicity: Monthly
Analytics: Revenue
SUM(FACT_CNT) CD_DATE.CAL_YEAR
CD_DATE.UDF5_DESCR
CD_DATE.ABS_MONTH_NBR
CD_ACCT.UDF1_DESCR
CD_CC_TYPE.CC_CL_DESCR
CD_CC_TYPE.CC_TYPE_DESCR

122 • Oracle Utilities Business Intelligence User Guide
Materialized ViewDescription
Measurements Dimensional Attributes
CD_CC_TYPE.CC_CL_CD
CD_CC_TYPE.CC_TYPE_CD
CD_ADDR.UDF4_DESCR
CD_ADDR.UDF1_DESCR
CD_ADDR.UDF3_DESCR
B1_SA_MON_MV1
Fact: CF_SA
Date Key: START_DATE_KEY
Periodicity: Monthly
Analytics: Revenue
SUM(FACT_CNT) CD_DATE.CAL_YEAR
CD_DATE.UDF5_DESCR
CD_SA.UDF1_DESCR
CD_SA.UDF2_DESCR
CD_SA.UDF3_DESCR
CD_ACCT.UDF1_DESCR
CD_ACCT.UDF1_CD
CD_ADDR.UDF3_DESCR
CD_ADDR.UDF1_DESCR
CD_ADDR.UDF4_DESCR
CD_PREM.UDF1_DESCR
CD_DATE.MONTH_END_DT
CD_DATE.ABS_MONTH_NBR
B1_SA_MON_MV2
Fact: CF_SA
Date Key: END_DATE_KEY <> 0
Periodicity: Monthly
Analytics: Revenue
SUM(FACT_CNT) CD_DATE.CAL_YEAR
CD_DATE.UDF5_DESCR
CD_SA.UDF1_DESCR
CD_SA.UDF2_DESCR
CD_SA.UDF3_DESCR
CD_ACCT.UDF1_DESCR
CD_ACCT.UDF1_CD
CD_ADDR.UDF3_DESCR
CD_ADDR.UDF1_DESCR
CD_ADDR.UDF4_DESCR
CD_PREM.UDF1_DESCR
CD_DATE.MONTH_END_DT
CD_DATE.ABS_MONTH_NBR
B1_FEEDER_DLVRD_MON_MV1
Fact: CF_FEEDER_DLVRD_LOAD
Date Key: SNAPSHOT_DATE_KEY
Periodicity: Monthly
Analytics: Distribution
SUM(KVA)
COUNT(KVA)
SUM(KW)
COUNT(KW)
SUM(KVAR)
CF_FEEDER_DLVRD_LOAD.UDDGEN1
CF_FEEDER_DLVRD_LOAD.VOLTAGE
CD_CTRL_ZONE.UDF1_DESCR
CD_CTRL_ZONE.UDF2_DESCR
CD_CTRL_ZONE.UDF3_DESCR
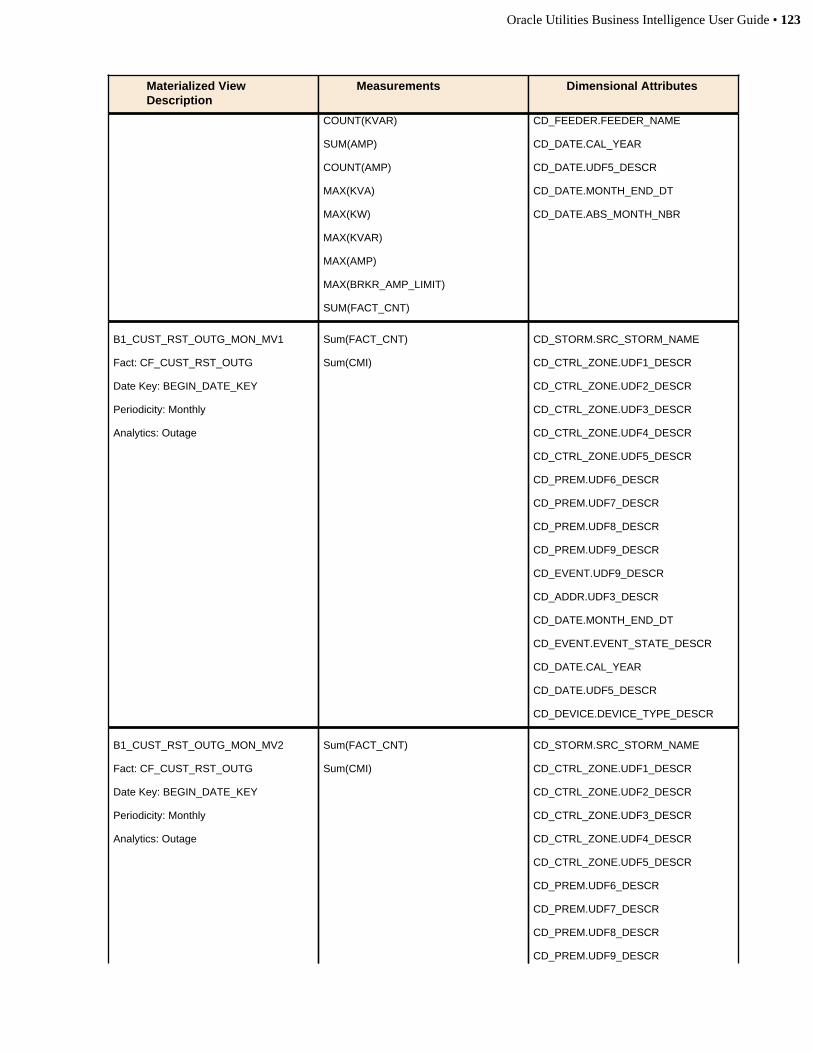
Oracle Utilities Business Intelligence User Guide • 123
Materialized ViewDescription
Measurements Dimensional Attributes
COUNT(KVAR)
SUM(AMP)
COUNT(AMP)
MAX(KVA)
MAX(KW)
MAX(KVAR)
MAX(AMP)
MAX(BRKR_AMP_LIMIT)
SUM(FACT_CNT)
CD_FEEDER.FEEDER_NAME
CD_DATE.CAL_YEAR
CD_DATE.UDF5_DESCR
CD_DATE.MONTH_END_DT
CD_DATE.ABS_MONTH_NBR
B1_CUST_RST_OUTG_MON_MV1
Fact: CF_CUST_RST_OUTG
Date Key: BEGIN_DATE_KEY
Periodicity: Monthly
Analytics: Outage
Sum(FACT_CNT)
Sum(CMI)
CD_STORM.SRC_STORM_NAME
CD_CTRL_ZONE.UDF1_DESCR
CD_CTRL_ZONE.UDF2_DESCR
CD_CTRL_ZONE.UDF3_DESCR
CD_CTRL_ZONE.UDF4_DESCR
CD_CTRL_ZONE.UDF5_DESCR
CD_PREM.UDF6_DESCR
CD_PREM.UDF7_DESCR
CD_PREM.UDF8_DESCR
CD_PREM.UDF9_DESCR
CD_EVENT.UDF9_DESCR
CD_ADDR.UDF3_DESCR
CD_DATE.MONTH_END_DT
CD_EVENT.EVENT_STATE_DESCR
CD_DATE.CAL_YEAR
CD_DATE.UDF5_DESCR
CD_DEVICE.DEVICE_TYPE_DESCR
B1_CUST_RST_OUTG_MON_MV2
Fact: CF_CUST_RST_OUTG
Date Key: BEGIN_DATE_KEY
Periodicity: Monthly
Analytics: Outage
Sum(FACT_CNT)
Sum(CMI)
CD_STORM.SRC_STORM_NAME
CD_CTRL_ZONE.UDF1_DESCR
CD_CTRL_ZONE.UDF2_DESCR
CD_CTRL_ZONE.UDF3_DESCR
CD_CTRL_ZONE.UDF4_DESCR
CD_CTRL_ZONE.UDF5_DESCR
CD_PREM.UDF6_DESCR
CD_PREM.UDF7_DESCR
CD_PREM.UDF8_DESCR
CD_PREM.UDF9_DESCR
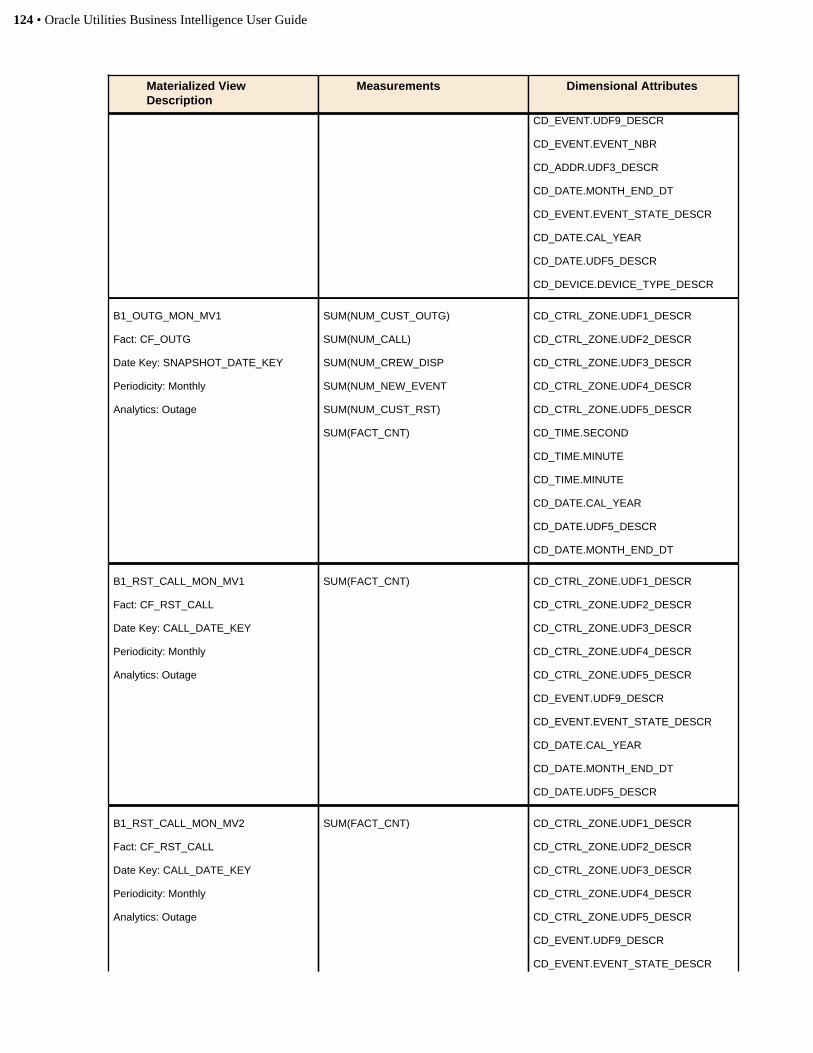
124 • Oracle Utilities Business Intelligence User Guide
Materialized ViewDescription
Measurements Dimensional Attributes
CD_EVENT.UDF9_DESCR
CD_EVENT.EVENT_NBR
CD_ADDR.UDF3_DESCR
CD_DATE.MONTH_END_DT
CD_EVENT.EVENT_STATE_DESCR
CD_DATE.CAL_YEAR
CD_DATE.UDF5_DESCR
CD_DEVICE.DEVICE_TYPE_DESCR
B1_OUTG_MON_MV1
Fact: CF_OUTG
Date Key: SNAPSHOT_DATE_KEY
Periodicity: Monthly
Analytics: Outage
SUM(NUM_CUST_OUTG)
SUM(NUM_CALL)
SUM(NUM_CREW_DISP
SUM(NUM_NEW_EVENT
SUM(NUM_CUST_RST)
SUM(FACT_CNT)
CD_CTRL_ZONE.UDF1_DESCR
CD_CTRL_ZONE.UDF2_DESCR
CD_CTRL_ZONE.UDF3_DESCR
CD_CTRL_ZONE.UDF4_DESCR
CD_CTRL_ZONE.UDF5_DESCR
CD_TIME.SECOND
CD_TIME.MINUTE
CD_TIME.MINUTE
CD_DATE.CAL_YEAR
CD_DATE.UDF5_DESCR
CD_DATE.MONTH_END_DT
B1_RST_CALL_MON_MV1
Fact: CF_RST_CALL
Date Key: CALL_DATE_KEY
Periodicity: Monthly
Analytics: Outage
SUM(FACT_CNT) CD_CTRL_ZONE.UDF1_DESCR
CD_CTRL_ZONE.UDF2_DESCR
CD_CTRL_ZONE.UDF3_DESCR
CD_CTRL_ZONE.UDF4_DESCR
CD_CTRL_ZONE.UDF5_DESCR
CD_EVENT.UDF9_DESCR
CD_EVENT.EVENT_STATE_DESCR
CD_DATE.CAL_YEAR
CD_DATE.MONTH_END_DT
CD_DATE.UDF5_DESCR
B1_RST_CALL_MON_MV2
Fact: CF_RST_CALL
Date Key: CALL_DATE_KEY
Periodicity: Monthly
Analytics: Outage
SUM(FACT_CNT) CD_CTRL_ZONE.UDF1_DESCR
CD_CTRL_ZONE.UDF2_DESCR
CD_CTRL_ZONE.UDF3_DESCR
CD_CTRL_ZONE.UDF4_DESCR
CD_CTRL_ZONE.UDF5_DESCR
CD_EVENT.UDF9_DESCR
CD_EVENT.EVENT_STATE_DESCR
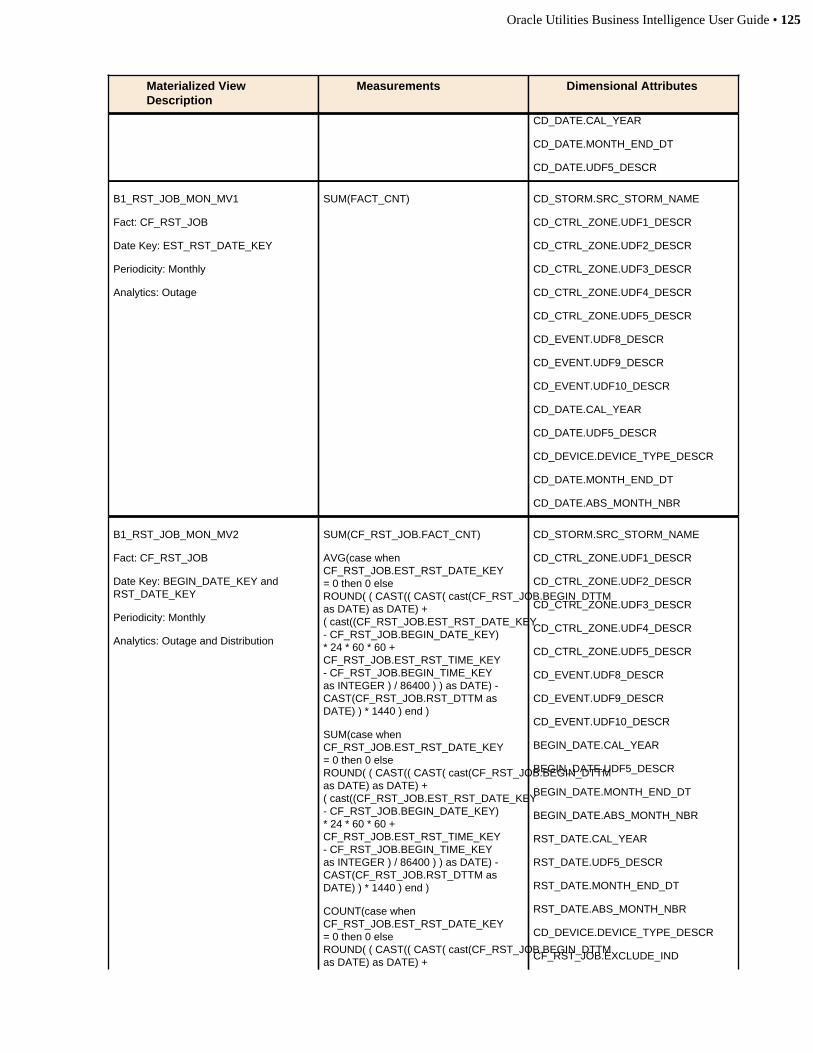
Oracle Utilities Business Intelligence User Guide • 125
Materialized ViewDescription
Measurements Dimensional Attributes
CD_DATE.CAL_YEAR
CD_DATE.MONTH_END_DT
CD_DATE.UDF5_DESCR
B1_RST_JOB_MON_MV1
Fact: CF_RST_JOB
Date Key: EST_RST_DATE_KEY
Periodicity: Monthly
Analytics: Outage
SUM(FACT_CNT) CD_STORM.SRC_STORM_NAME
CD_CTRL_ZONE.UDF1_DESCR
CD_CTRL_ZONE.UDF2_DESCR
CD_CTRL_ZONE.UDF3_DESCR
CD_CTRL_ZONE.UDF4_DESCR
CD_CTRL_ZONE.UDF5_DESCR
CD_EVENT.UDF8_DESCR
CD_EVENT.UDF9_DESCR
CD_EVENT.UDF10_DESCR
CD_DATE.CAL_YEAR
CD_DATE.UDF5_DESCR
CD_DEVICE.DEVICE_TYPE_DESCR
CD_DATE.MONTH_END_DT
CD_DATE.ABS_MONTH_NBR
B1_RST_JOB_MON_MV2
Fact: CF_RST_JOB
Date Key: BEGIN_DATE_KEY andRST_DATE_KEY
Periodicity: Monthly
Analytics: Outage and Distribution
SUM(CF_RST_JOB.FACT_CNT)
AVG(case whenCF_RST_JOB.EST_RST_DATE_KEY= 0 then 0 elseROUND( ( CAST(( CAST( cast(CF_RST_JOB.BEGIN_DTTMas DATE) as DATE) +( cast((CF_RST_JOB.EST_RST_DATE_KEY- CF_RST_JOB.BEGIN_DATE_KEY)* 24 * 60 * 60 +CF_RST_JOB.EST_RST_TIME_KEY- CF_RST_JOB.BEGIN_TIME_KEYas INTEGER ) / 86400 ) ) as DATE) -CAST(CF_RST_JOB.RST_DTTM asDATE) ) * 1440 ) end )
SUM(case whenCF_RST_JOB.EST_RST_DATE_KEY= 0 then 0 elseROUND( ( CAST(( CAST( cast(CF_RST_JOB.BEGIN_DTTMas DATE) as DATE) +( cast((CF_RST_JOB.EST_RST_DATE_KEY- CF_RST_JOB.BEGIN_DATE_KEY)* 24 * 60 * 60 +CF_RST_JOB.EST_RST_TIME_KEY- CF_RST_JOB.BEGIN_TIME_KEYas INTEGER ) / 86400 ) ) as DATE) -CAST(CF_RST_JOB.RST_DTTM asDATE) ) * 1440 ) end )
COUNT(case whenCF_RST_JOB.EST_RST_DATE_KEY= 0 then 0 elseROUND( ( CAST(( CAST( cast(CF_RST_JOB.BEGIN_DTTMas DATE) as DATE) +
CD_STORM.SRC_STORM_NAME
CD_CTRL_ZONE.UDF1_DESCR
CD_CTRL_ZONE.UDF2_DESCR
CD_CTRL_ZONE.UDF3_DESCR
CD_CTRL_ZONE.UDF4_DESCR
CD_CTRL_ZONE.UDF5_DESCR
CD_EVENT.UDF8_DESCR
CD_EVENT.UDF9_DESCR
CD_EVENT.UDF10_DESCR
BEGIN_DATE.CAL_YEAR
BEGIN_DATE.UDF5_DESCR
BEGIN_DATE.MONTH_END_DT
BEGIN_DATE.ABS_MONTH_NBR
RST_DATE.CAL_YEAR
RST_DATE.UDF5_DESCR
RST_DATE.MONTH_END_DT
RST_DATE.ABS_MONTH_NBR
CD_DEVICE.DEVICE_TYPE_DESCR
CF_RST_JOB.EXCLUDE_IND
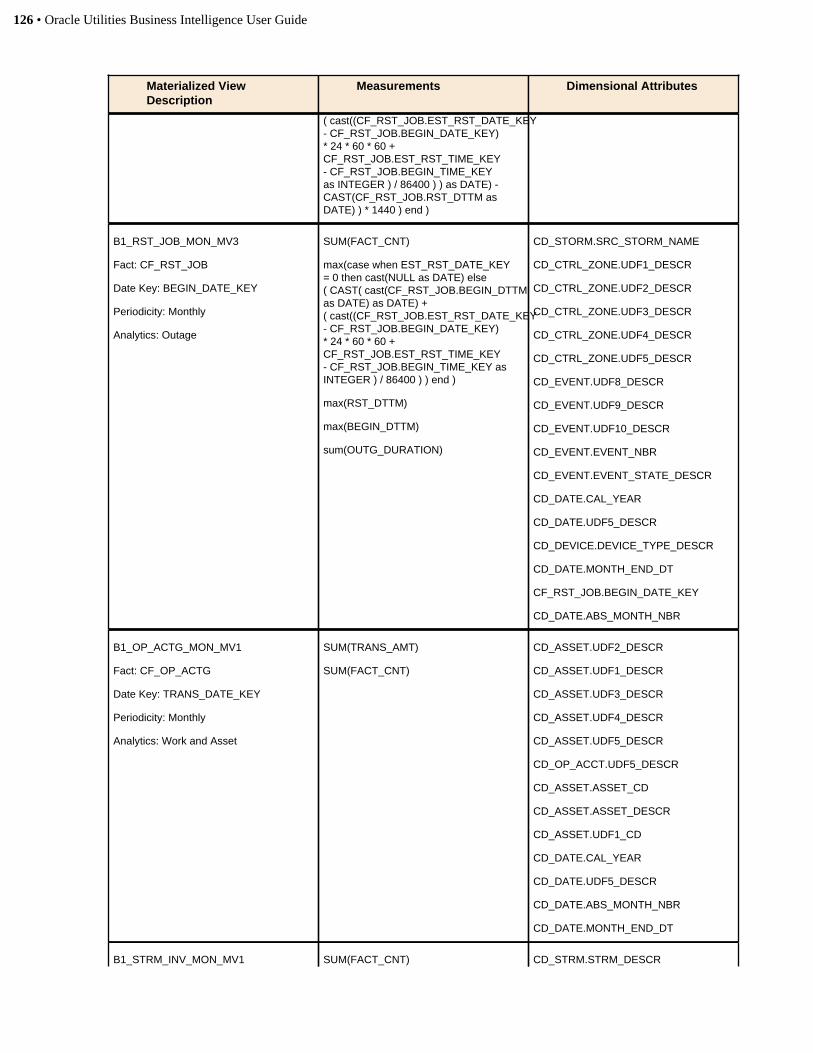
126 • Oracle Utilities Business Intelligence User Guide
Materialized ViewDescription
Measurements Dimensional Attributes
( cast((CF_RST_JOB.EST_RST_DATE_KEY- CF_RST_JOB.BEGIN_DATE_KEY)* 24 * 60 * 60 +CF_RST_JOB.EST_RST_TIME_KEY- CF_RST_JOB.BEGIN_TIME_KEYas INTEGER ) / 86400 ) ) as DATE) -CAST(CF_RST_JOB.RST_DTTM asDATE) ) * 1440 ) end )
B1_RST_JOB_MON_MV3
Fact: CF_RST_JOB
Date Key: BEGIN_DATE_KEY
Periodicity: Monthly
Analytics: Outage
SUM(FACT_CNT)
max(case when EST_RST_DATE_KEY= 0 then cast(NULL as DATE) else( CAST( cast(CF_RST_JOB.BEGIN_DTTMas DATE) as DATE) +( cast((CF_RST_JOB.EST_RST_DATE_KEY- CF_RST_JOB.BEGIN_DATE_KEY)* 24 * 60 * 60 +CF_RST_JOB.EST_RST_TIME_KEY- CF_RST_JOB.BEGIN_TIME_KEY asINTEGER ) / 86400 ) ) end )
max(RST_DTTM)
max(BEGIN_DTTM)
sum(OUTG_DURATION)
CD_STORM.SRC_STORM_NAME
CD_CTRL_ZONE.UDF1_DESCR
CD_CTRL_ZONE.UDF2_DESCR
CD_CTRL_ZONE.UDF3_DESCR
CD_CTRL_ZONE.UDF4_DESCR
CD_CTRL_ZONE.UDF5_DESCR
CD_EVENT.UDF8_DESCR
CD_EVENT.UDF9_DESCR
CD_EVENT.UDF10_DESCR
CD_EVENT.EVENT_NBR
CD_EVENT.EVENT_STATE_DESCR
CD_DATE.CAL_YEAR
CD_DATE.UDF5_DESCR
CD_DEVICE.DEVICE_TYPE_DESCR
CD_DATE.MONTH_END_DT
CF_RST_JOB.BEGIN_DATE_KEY
CD_DATE.ABS_MONTH_NBR
B1_OP_ACTG_MON_MV1
Fact: CF_OP_ACTG
Date Key: TRANS_DATE_KEY
Periodicity: Monthly
Analytics: Work and Asset
SUM(TRANS_AMT)
SUM(FACT_CNT)
CD_ASSET.UDF2_DESCR
CD_ASSET.UDF1_DESCR
CD_ASSET.UDF3_DESCR
CD_ASSET.UDF4_DESCR
CD_ASSET.UDF5_DESCR
CD_OP_ACCT.UDF5_DESCR
CD_ASSET.ASSET_CD
CD_ASSET.ASSET_DESCR
CD_ASSET.UDF1_CD
CD_DATE.CAL_YEAR
CD_DATE.UDF5_DESCR
CD_DATE.ABS_MONTH_NBR
CD_DATE.MONTH_END_DT
B1_STRM_INV_MON_MV1 SUM(FACT_CNT) CD_STRM.STRM_DESCR
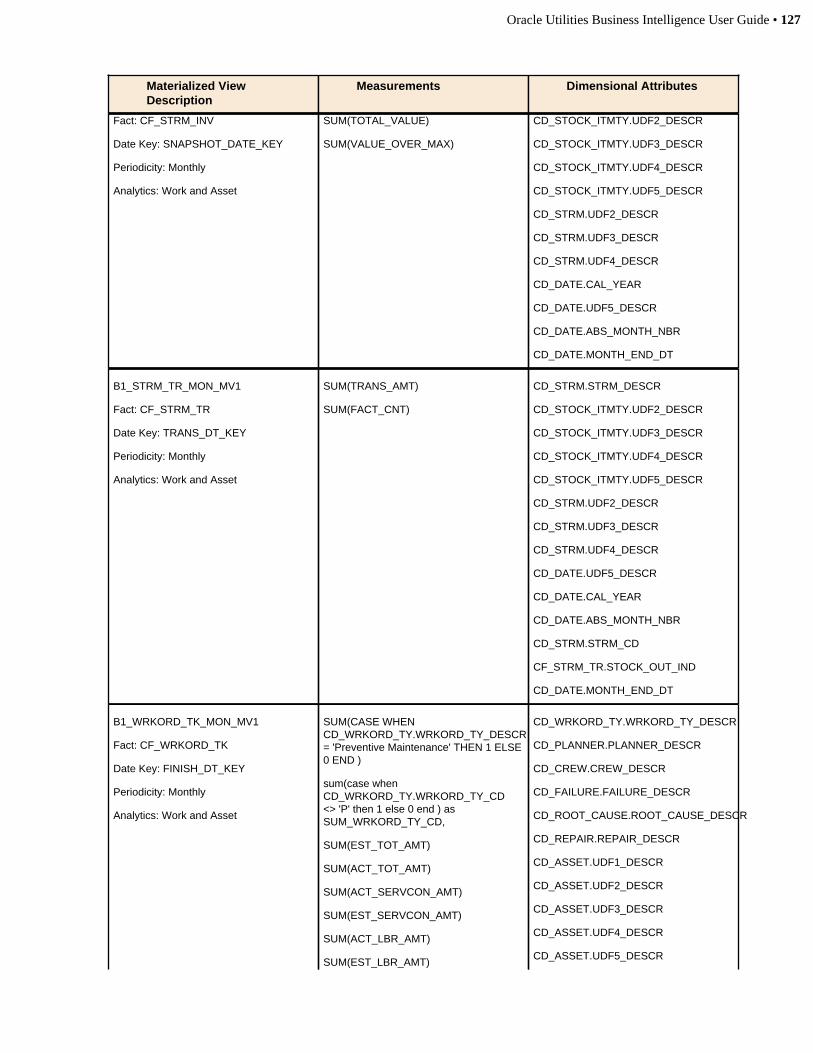
Oracle Utilities Business Intelligence User Guide • 127
Materialized ViewDescription
Measurements Dimensional Attributes
Fact: CF_STRM_INV
Date Key: SNAPSHOT_DATE_KEY
Periodicity: Monthly
Analytics: Work and Asset
SUM(TOTAL_VALUE)
SUM(VALUE_OVER_MAX)
CD_STOCK_ITMTY.UDF2_DESCR
CD_STOCK_ITMTY.UDF3_DESCR
CD_STOCK_ITMTY.UDF4_DESCR
CD_STOCK_ITMTY.UDF5_DESCR
CD_STRM.UDF2_DESCR
CD_STRM.UDF3_DESCR
CD_STRM.UDF4_DESCR
CD_DATE.CAL_YEAR
CD_DATE.UDF5_DESCR
CD_DATE.ABS_MONTH_NBR
CD_DATE.MONTH_END_DT
B1_STRM_TR_MON_MV1
Fact: CF_STRM_TR
Date Key: TRANS_DT_KEY
Periodicity: Monthly
Analytics: Work and Asset
SUM(TRANS_AMT)
SUM(FACT_CNT)
CD_STRM.STRM_DESCR
CD_STOCK_ITMTY.UDF2_DESCR
CD_STOCK_ITMTY.UDF3_DESCR
CD_STOCK_ITMTY.UDF4_DESCR
CD_STOCK_ITMTY.UDF5_DESCR
CD_STRM.UDF2_DESCR
CD_STRM.UDF3_DESCR
CD_STRM.UDF4_DESCR
CD_DATE.UDF5_DESCR
CD_DATE.CAL_YEAR
CD_DATE.ABS_MONTH_NBR
CD_STRM.STRM_CD
CF_STRM_TR.STOCK_OUT_IND
CD_DATE.MONTH_END_DT
B1_WRKORD_TK_MON_MV1
Fact: CF_WRKORD_TK
Date Key: FINISH_DT_KEY
Periodicity: Monthly
Analytics: Work and Asset
SUM(CASE WHENCD_WRKORD_TY.WRKORD_TY_DESCR= 'Preventive Maintenance' THEN 1 ELSE0 END )
sum(case whenCD_WRKORD_TY.WRKORD_TY_CD<> 'P' then 1 else 0 end ) asSUM_WRKORD_TY_CD,
SUM(EST_TOT_AMT)
SUM(ACT_TOT_AMT)
SUM(ACT_SERVCON_AMT)
SUM(EST_SERVCON_AMT)
SUM(ACT_LBR_AMT)
SUM(EST_LBR_AMT)
CD_WRKORD_TY.WRKORD_TY_DESCR
CD_PLANNER.PLANNER_DESCR
CD_CREW.CREW_DESCR
CD_FAILURE.FAILURE_DESCR
CD_ROOT_CAUSE.ROOT_CAUSE_DESCR
CD_REPAIR.REPAIR_DESCR
CD_ASSET.UDF1_DESCR
CD_ASSET.UDF2_DESCR
CD_ASSET.UDF3_DESCR
CD_ASSET.UDF4_DESCR
CD_ASSET.UDF5_DESCR
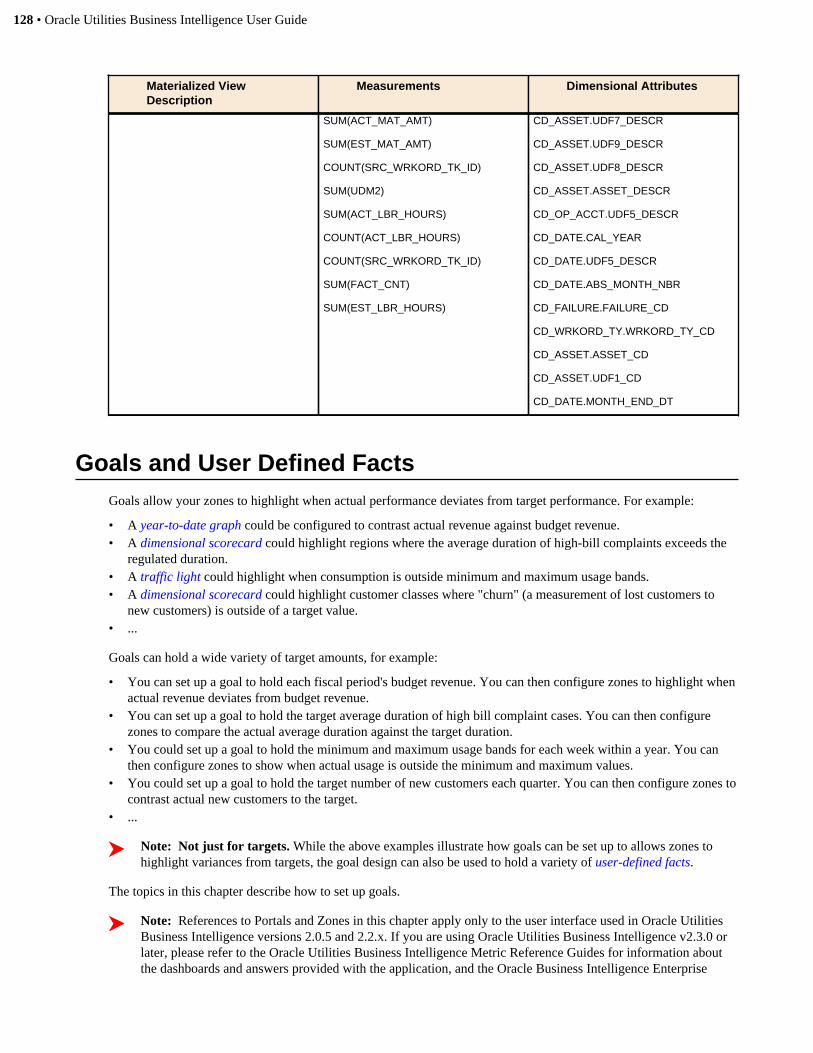
128 • Oracle Utilities Business Intelligence User Guide
Materialized ViewDescription
Measurements Dimensional Attributes
SUM(ACT_MAT_AMT)
SUM(EST_MAT_AMT)
COUNT(SRC_WRKORD_TK_ID)
SUM(UDM2)
SUM(ACT_LBR_HOURS)
COUNT(ACT_LBR_HOURS)
COUNT(SRC_WRKORD_TK_ID)
SUM(FACT_CNT)
SUM(EST_LBR_HOURS)
CD_ASSET.UDF7_DESCR
CD_ASSET.UDF9_DESCR
CD_ASSET.UDF8_DESCR
CD_ASSET.ASSET_DESCR
CD_OP_ACCT.UDF5_DESCR
CD_DATE.CAL_YEAR
CD_DATE.UDF5_DESCR
CD_DATE.ABS_MONTH_NBR
CD_FAILURE.FAILURE_CD
CD_WRKORD_TY.WRKORD_TY_CD
CD_ASSET.ASSET_CD
CD_ASSET.UDF1_CD
CD_DATE.MONTH_END_DT
Goals and User Defined FactsGoals allow your zones to highlight when actual performance deviates from target performance. For example:
• A year-to-date graph could be configured to contrast actual revenue against budget revenue.• A dimensional scorecard could highlight regions where the average duration of high-bill complaints exceeds the
regulated duration.• A traffic light could highlight when consumption is outside minimum and maximum usage bands.• A dimensional scorecard could highlight customer classes where "churn" (a measurement of lost customers to
new customers) is outside of a target value.• ...
Goals can hold a wide variety of target amounts, for example:
• You can set up a goal to hold each fiscal period's budget revenue. You can then configure zones to highlight whenactual revenue deviates from budget revenue.
• You can set up a goal to hold the target average duration of high bill complaint cases. You can then configurezones to compare the actual average duration against the target duration.
• You could set up a goal to hold the minimum and maximum usage bands for each week within a year. You canthen configure zones to show when actual usage is outside the minimum and maximum values.
• You could set up a goal to hold the target number of new customers each quarter. You can then configure zones tocontrast actual new customers to the target.
• ...
Note: Not just for targets. While the above examples illustrate how goals can be set up to allows zones tohighlight variances from targets, the goal design can also be used to hold a variety of user-defined facts.
The topics in this chapter describe how to set up goals.
Note: References to Portals and Zones in this chapter apply only to the user interface used in Oracle UtilitiesBusiness Intelligence versions 2.0.5 and 2.2.x. If you are using Oracle Utilities Business Intelligence v2.3.0 orlater, please refer to the Oracle Utilities Business Intelligence Metric Reference Guides for information aboutthe dashboards and answers provided with the application, and the Oracle Business Intelligence Enterprise
Oracle Utilities Business Intelligence User Guide • 129
Edition documentation for information on creating and configuring Oracle Business Intelligence EnterpriseEdition dashboards and answers.
The Big Picture of Goal Types
You must set up a goal type to define the structure of each goal. For example, if you have a goal that holds "budgetrevenue", and another that holds "target average complaint duration", you'd need two goal types.
On a goal type you define:
• The goal's related fact table. This field is important because the fact's dimensions are the goal's potentialdimensions.
Note: Multi-fact fact goals. You may have goals that span facts. For example, you might have a target KPIthat is computed by dividing monthly revenue by the total amount of debt that is older than 30 days. Whenyou set up this variety of goal type, just pick one of the associated fact tables (it doesn't matter which one).
• The goal's granularity. We'll use an example to explain - if your organization budgets revenue at the customerclass and region level, these two attributes define the goal's granularity (customer class comes from the accountdimension, and region comes from the address dimension). Please note the following:
• When you set up a goal type, you define its related fact table. The dimensions that are related to this table definethe set of dimensional attributes that can be used when defining the goal's granularity. For example, if a goal'srelated fact references the Address and Unit-of-Measure dimensions, this means the goal can be defined for anycombination of dimensional attributes on the Address and Unit-of-Measure dimensions.
• You can define a goal's granularity using any combination of attributes from the related fact's dimensions.• The type of goal amounts. You can define several amounts on a goal. For example, the goal type that holds the
target average complaint duration can also hold the target minimum and maximum durations.• The name of the physical table on which the goal's data is stored. Please be aware that a single physical table
can hold the data for an unlimited number of goal types (e.g., you can store budget revenue and target complaintduration on the same physical table).
• The base package is supplied with a sample physical table to hold your goal data. If you require additionalphysical tables, please copy the columns on it verbatim. The name of this physical table is B1_GOAL_DATA .
• The goal's periodicity. For example, you can define that the revenue budget goal is held at the Fiscal Period level, whereas the target complaint duration goal is held at the Calendar Month level.
If a zone requires a periodicity that is greater than the goal's periodicity, the system accumulates the goal data asappropriate. For example, if you have a goal that's defined at the Calendar Month level, and a zone that showsinformation grouped by Calendar Quarter , the system will accumulate the goal data from each quarter's months.
User-Defined Facts
The word "goal" typically means a target value against which actual performance is compared. It's important tounderstand that you can use the goal objects to hold things other than target values. For example,
• If your users want a zone that contrasts revenue versus expenses and the data-warehouse doesn't contain expenses,you can:
• Set up a goal type to hold expenses.• Have users enter monthly expenses using the goal transaction.• After the expenses are entered, you can contrast revenue (held in a "real" fact) with expenses (held in a goal)
on any number of zones.• If your users want a zone that shows the correlation between temperature variations and revenue trends, you can:
• Set up a goal type to hold daily temperature deviations from the norm (some refer to this as a "degree day").• Have users enter the temperature variations (perhaps by region).• After the degree days exist, you can use them to calculate normalized revenue (using a calculated value on a
zone) and show the calculated value on graphs and other zones.
The list is limited only by your imagination.
130 • Oracle Utilities Business Intelligence User Guide
Note: User defined facts. You may find it useful to think of a goal type as the meta-data that defines thestructure of a user-defined fact.
When A Fact Has Multiple Goal Types
Whether or not a fact has one or more goal types depends on the nature of your goals and your organization'sstructure. The following points will help explain:
• Different periodicities will result in different goal types. When you set up a goal type, you define theperiodicity in which the goal is entered. For example, if budget revenue is defined per month, and degree-daysare defined for each day, you'd need two goal types (one with a periodicity of Calendar Month , the other with aperiodicity of Daily ).
• Different granularity will result in different goal types. When you set up a goal type, you define thedimensional attribute combinations in which the goal is entered. For example, if budget revenue is defined forcombinations of customer class and division; and degree days are entered per climate zone; you'd need two goaltypes (one with dimensions of Customer Class and Division, the other with a dimension of Climate Zone).
The Big Picture of Goal Events
After you've set up goal types, you set up goal events to define the goal values. A goal event is a record of goal valuesthat are active for a given time-period. For example, if you've set up a goal type for budget revenue, you'll create agoal event whenever budgets are published or revised.
Please be aware that you can override specific time periods without losing the original values. We will use anexample to explain:
• Let's assume that the annual budget is published sometime before the fiscal year begins. At this time, you'd createa goal event with the budget amounts for each fiscal period. You'd then indicate all time periods in the event areactive.
• Sometime during the budget year, the finance department publishes a revised budget for the remaining periodsin the year. At this time, you can create a new budget event for the remaining periods (rather than override theoriginal budget values). You would then need to return to the original budget event and indicate that it's onlyactive during the first part of the budget year.
Using and Displaying Goals On Zones
A zone can be configured to retrieve values from any combination of facts and goals. For example, you couldconfigure a zone to show actual revenue (from the financial fact) and budget revenue (from the budget goal type).You tell the zone how to retrieve a value when you set up the zone's measures.
FMI: Refer to General Zone Parameters (see the Measure parameter) for the configuration options.
Sample Zones Using Goals
Refer to Goal Samples various ideas on how to integrate goals into your zones.
Defining Goal Types
Select Admin Menu, Goal Type to maintain goal types.
FMI: Refer to The Big Picture of Goal Types for background information.

Oracle Utilities Business Intelligence User Guide • 131
Description of Page
Specify an easily recognizable Zone Type identifier and Description. Use the Long Description todescribe in detail what the zone type does.
Define the principal Fact Table associated with this goal. The attributes on this fact's dimensions define the possiblegranularity of this goal. You define the specific dimensional attributes at which this goal is defined in the DimensionMapping grid below.
Define the Goal Table on which the goal's data is physically stored. Please be aware that a single physical table canhold the data for an unlimited number of goal types (e.g., you can store budget revenue and target complaint durationon the same physical table). The base package is supplied with a sample physical table to hold your goal data. Ifyou require additional physical tables, please copy the columns on it verbatim. The name of this physical table is B1_GOAL_DATA .
Define the Periodicity in which the goal's data is entered. For example, you can define that the budget goal is held atthe Fiscal Period level, whereas the target complaint duration goal is held at the Calendar Month level.
Note: Accumulating lower level periodicities. If a zone requires a periodicity that is greater than the goal'speriodicity, the system accumulates the goal data as appropriate. For example, if the goal is defined at the Calendar Month level and a zone needs information grouped by Calendar Quarter , the system accumulates thegoal data from each quarter's months.
The Dimension Mapping grid defines the granularity of this goal. For example, if your organization budgets revenueat the customer class and region level, you'd need two entries in the grid. The following information is defined foreach dimensional mapping:
• Goal Field defines that attribute on the Goal Table that holds the dimensional attribute's value.• Mapped Table defines the table on which the dimensional attribute resides. Dimensional attributes can reside on
any of the Fact Table's dimensions. In addition, you can also define goals for any degenerate dimension on theFact Table.
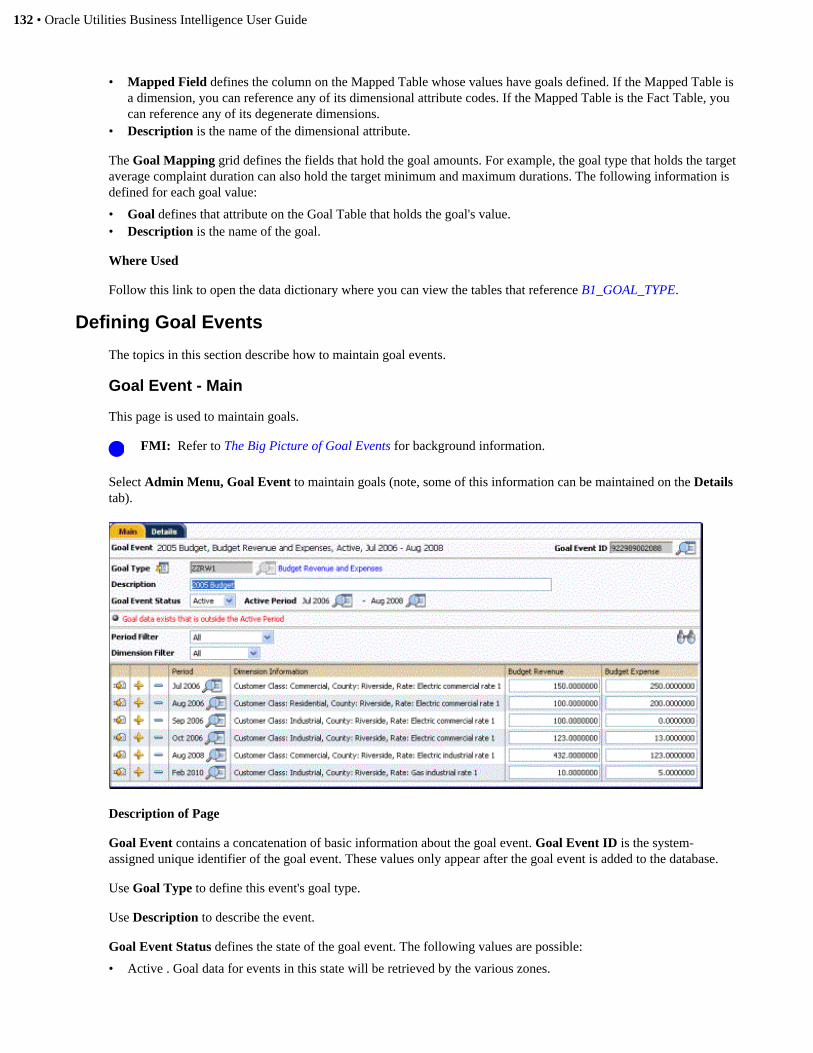
132 • Oracle Utilities Business Intelligence User Guide
• Mapped Field defines the column on the Mapped Table whose values have goals defined. If the Mapped Table isa dimension, you can reference any of its dimensional attribute codes. If the Mapped Table is the Fact Table, youcan reference any of its degenerate dimensions.
• Description is the name of the dimensional attribute.
The Goal Mapping grid defines the fields that hold the goal amounts. For example, the goal type that holds the targetaverage complaint duration can also hold the target minimum and maximum durations. The following information isdefined for each goal value:
• Goal defines that attribute on the Goal Table that holds the goal's value.• Description is the name of the goal.
Where Used
Follow this link to open the data dictionary where you can view the tables that reference B1_GOAL_TYPE.
Defining Goal Events
The topics in this section describe how to maintain goal events.
Goal Event - Main
This page is used to maintain goals.
FMI: Refer to The Big Picture of Goal Events for background information.
Select Admin Menu, Goal Event to maintain goals (note, some of this information can be maintained on the Detailstab).
Description of Page
Goal Event contains a concatenation of basic information about the goal event. Goal Event ID is the system-assigned unique identifier of the goal event. These values only appear after the goal event is added to the database.
Use Goal Type to define this event's goal type.
Use Description to describe the event.
Goal Event Status defines the state of the goal event. The following values are possible:
• Active . Goal data for events in this state will be retrieved by the various zones.
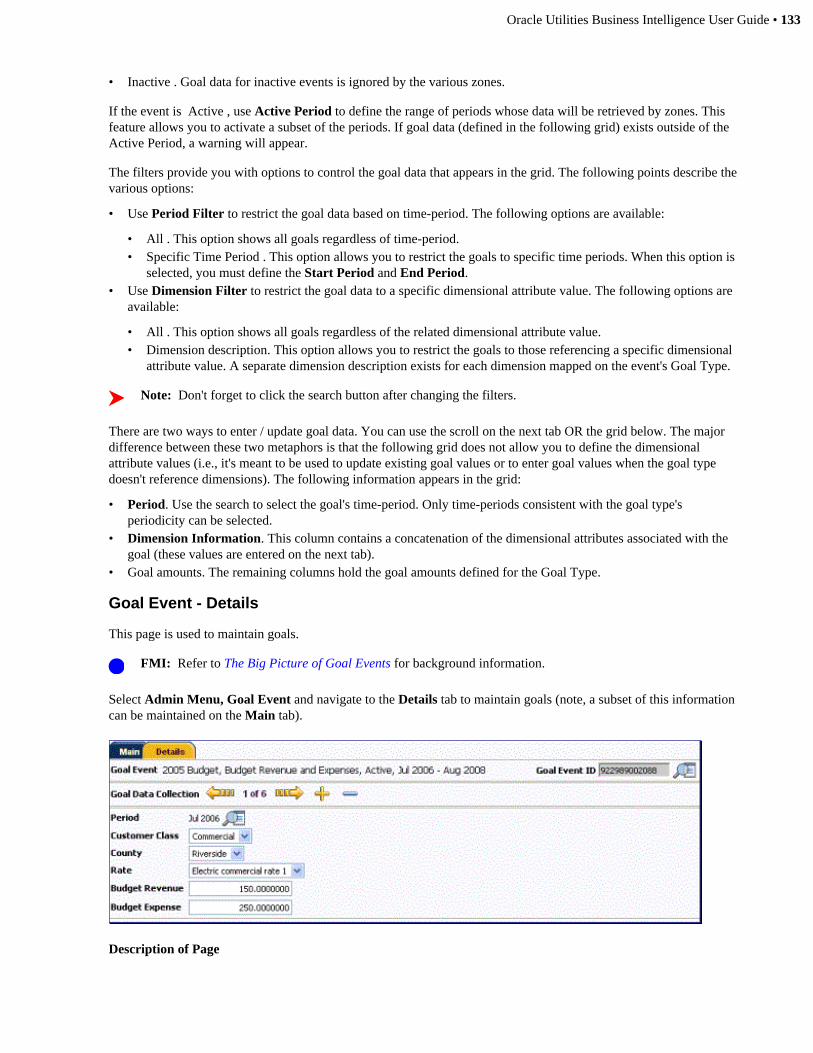
Oracle Utilities Business Intelligence User Guide • 133
• Inactive . Goal data for inactive events is ignored by the various zones.
If the event is Active , use Active Period to define the range of periods whose data will be retrieved by zones. Thisfeature allows you to activate a subset of the periods. If goal data (defined in the following grid) exists outside of theActive Period, a warning will appear.
The filters provide you with options to control the goal data that appears in the grid. The following points describe thevarious options:
• Use Period Filter to restrict the goal data based on time-period. The following options are available:
• All . This option shows all goals regardless of time-period.• Specific Time Period . This option allows you to restrict the goals to specific time periods. When this option is
selected, you must define the Start Period and End Period.• Use Dimension Filter to restrict the goal data to a specific dimensional attribute value. The following options are
available:
• All . This option shows all goals regardless of the related dimensional attribute value.• Dimension description. This option allows you to restrict the goals to those referencing a specific dimensional
attribute value. A separate dimension description exists for each dimension mapped on the event's Goal Type.
Note: Don't forget to click the search button after changing the filters.
There are two ways to enter / update goal data. You can use the scroll on the next tab OR the grid below. The majordifference between these two metaphors is that the following grid does not allow you to define the dimensionalattribute values (i.e., it's meant to be used to update existing goal values or to enter goal values when the goal typedoesn't reference dimensions). The following information appears in the grid:
• Period. Use the search to select the goal's time-period. Only time-periods consistent with the goal type'speriodicity can be selected.
• Dimension Information. This column contains a concatenation of the dimensional attributes associated with thegoal (these values are entered on the next tab).
• Goal amounts. The remaining columns hold the goal amounts defined for the Goal Type.
Goal Event - Details
This page is used to maintain goals.
FMI: Refer to The Big Picture of Goal Events for background information.
Select Admin Menu, Goal Event and navigate to the Details tab to maintain goals (note, a subset of this informationcan be maintained on the Main tab).
Description of Page
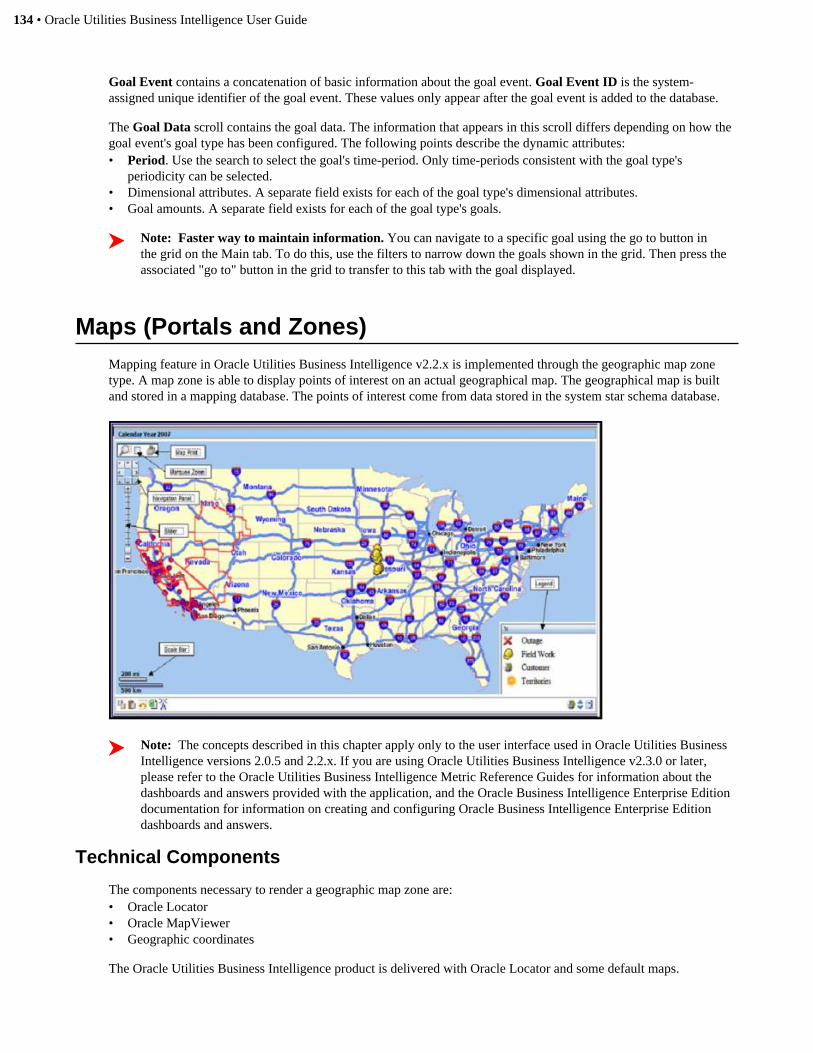
134 • Oracle Utilities Business Intelligence User Guide
Goal Event contains a concatenation of basic information about the goal event. Goal Event ID is the system-assigned unique identifier of the goal event. These values only appear after the goal event is added to the database.
The Goal Data scroll contains the goal data. The information that appears in this scroll differs depending on how thegoal event's goal type has been configured. The following points describe the dynamic attributes:• Period. Use the search to select the goal's time-period. Only time-periods consistent with the goal type's
periodicity can be selected.• Dimensional attributes. A separate field exists for each of the goal type's dimensional attributes.• Goal amounts. A separate field exists for each of the goal type's goals.
Note: Faster way to maintain information. You can navigate to a specific goal using the go to button inthe grid on the Main tab. To do this, use the filters to narrow down the goals shown in the grid. Then press theassociated "go to" button in the grid to transfer to this tab with the goal displayed.
Maps (Portals and Zones)Mapping feature in Oracle Utilities Business Intelligence v2.2.x is implemented through the geographic map zonetype. A map zone is able to display points of interest on an actual geographical map. The geographical map is builtand stored in a mapping database. The points of interest come from data stored in the system star schema database.
Note: The concepts described in this chapter apply only to the user interface used in Oracle Utilities BusinessIntelligence versions 2.0.5 and 2.2.x. If you are using Oracle Utilities Business Intelligence v2.3.0 or later,please refer to the Oracle Utilities Business Intelligence Metric Reference Guides for information about thedashboards and answers provided with the application, and the Oracle Business Intelligence Enterprise Editiondocumentation for information on creating and configuring Oracle Business Intelligence Enterprise Editiondashboards and answers.
Technical Components
The components necessary to render a geographic map zone are:• Oracle Locator• Oracle MapViewer• Geographic coordinates
The Oracle Utilities Business Intelligence product is delivered with Oracle Locator and some default maps.

Oracle Utilities Business Intelligence User Guide • 135
Oracle Locator
Oracle Locator is a feature of Oracle Database Standard and Enterprise Editions. It stores g eographic informationsystem data and fully integrates it in the Oracle server itself. Locator provides significant capabilities required tosupport Internet and wireless service-based applications and partner-based GIS solutions.
Note: Refer to Oracle's documentation for the detailed information on Oracle Locator.
Oracle MapViewer
Oracle MapViewer is an Oracle Application Server Java component and JDeveloper extension used for maprendering and viewing geospatial data managed by Oracle Spatial or Locator. It complements the geographic datamanagement capacity of the Oracle Database by providing a generic web-based means of delivering and viewing anygeographic data in the database.
MapViewer includes a feature called Oracle Maps, which consists of a map cache server and an AJAX based webmapping client library. Geographic map zone type uses Oracle Maps' JavaScript API.
Note: Refer to Oracle's documentation for the detailed information on Oracle MapViewer.
Geographic Coordinates
In order to place information on a geographic map, the fact must reference the full latitude and longitude coordinates.Populating the latitude and longitude coordinates is referred to as geocoding.
Geocoding can be performed in several ways:• Oracle Spatial provides an embedded Geocoding engine (Oracle Spatial is not included with the product)• By purchasing datasets from suppliers, for example Navteq• There are resources on the Internet (e.g. U.S. Census Bureau Gazatteer)
Structure of a Map
Internally, map contents are organized into layers, visual representations of geographic features that share certaincommon attributes.
All the layers except the fixed figures layer get automatically updated and realigned by the client library when themap is dragged or zoomed. The fixed figures layer will never be moved.
Note: Refer to Oracle's documentation for the detailed information on map layers.
Base Map Layers
Base map layer displays a background map. It consists of multiple adjacent map tiles, fixed-size map image files thatcover a small, pre-determined area of the overall map coverage.
Note: When associated with a MapViewer base map the map image tiles in a map cache instance are generatedby MapViewer using its own rendering engine.
Theme Based FOI Layers
Theme based Features of Interest (FOI) layers displays Features of Interest that respond to mouse rollover with tool-tip like info window. Attributes of each Feature of Interest are accessible through the JavaScript API.
User Defined FOI Layer
User defined Features of Interest (FOI) layer displays individual, dynamically created Features Of Interest.
136 • Oracle Utilities Business Intelligence User Guide
Info Window Layer
An info window is a small pop-up window that displays customizable content in the map. It is typically associatedwith FOIs and is placed directly above the user defined FOI layer.
Fixed Figures Layer
The topmost layer contains fixed figures, which are immovable elements such as copyright notes, scale bar andnavigation panel.
Building a Map
The essential steps to building the geographic map application using the Oracle Maps JavaScript API are:• Loading the Oracle Maps JavaScript API library, a single file named oraclemaps.js , from the MapViewer server
into the browser in the beginning of the oraGeoMap.jsp page:
<script language="Javascript" src="code/oraclemaps.js"></script>
• Placing an HTML DIV component that serves as the master map container on the page. It can be placed anywhere
on the Web page. The unique id should be passed to the Oracle Maps library so that it knows where to display themap content.
<div id="map" style="left:0px; top:0px; width:100%; height:100%"></div>
• Writing custom JavaScript code to set up initial map contents (base-map, FOI layers, etc) and implement
application specific logic. This custom JavaScrip has to be loaded in the beginning of the oraGeoMap.jsp page:
<script language="Javascript" src="code/oraGeoMap.js"></script>
<script language="Javascript" src="code/oraGeoMapSupport.js"></script>
• Next the browser invokes the oraShowMap() function on the page load to execute the application logic and
display the map.
<body onload="oraShowMap()">
Configuring a Map
Once the initial map contents and the application specific logic are implemented in the oraGeoMap.jsp page the nextstep is to configure a feature configuration using the Geo Map Default Attributes feature type with default settingsfor all map zones.
Creating a Map Zone
Geographic Map Feature Configuration
The following table describes the parameters that control geographic map zones.
Geographic maps require some technical information such as URLs and zoom levels. These can often be sharedamong all maps used by an installation. These parameter values have been made available as a Feature Configuration

Oracle Utilities Business Intelligence User Guide • 137
that means that many map zones can omit this information while still being able to override the value. Below is adescription of the Geo Map Default Attributes options and example values:
Option Description
Map URL Is a URL to the map browser file. This could be an HTML file ora JSP file, etc. For example b1/oraGeoMap.jsp
Map Server Is a URL to the Oracle MapViewer server (or the server of analternate mapping tool). For example http://yourServer:8888/mapviewer
Base Map Is the identifier of the basic map (often a city, state or country).It is in the format of dataSource.mapName. For example mvDemo.DEMO_MAP.
Center Coordinates Is the coordinates where the map should be centered on theinitial view, This is in the formation of latitude,longitutde. Forexample -122.22,37.77.
Zoom Level The zoom level for when the map is initially displayed. This isa number based upon the available zoom levels defined in themap viewer when the map is created. For example 4 (often aregion level zoom).
Street Zoom Level The zoom level (number) which is necessary to see streetdetails. For example 8.
City Zoom LevelThe zoom level (number) which is necessary to see city details.For example 6.
Region Zoom Level The zoom level (number) which is necessary to see regiondetails (for example, county or state detail). For example 4.
Legend Defines if the legend should be displayed or not. It may be set totrue or false . If this is not defined, true is the default value.
Geographic Map Parameters
The following table describes the parameters that control geographic map zones.
Note: General parameters. The general listing of parameters describes additional parameters.
Parm Type Description
Override Map DefaultsUse this parameter to override mapping defaults provided in theConfiguration Features. The available overrides are:
- MAPURL is a URL to the map browser file. This could be anHTML file or a JSP file, etc.
- MAPSERVER is a URL to the mapviewer server.
- BASEMAP is the identifier of the basic map (often a city, stateor country). It is in the format of dataSource.mapName. Forexample baseMap=mvDemo.DEMO_MAP
- CENTERCOORDINATE is the coordinates wherethe map should be centered on the initial view, Thisis in the formation of latitude,longitutde. For example centerCoordinate=-122.22,37.77
- ZOOM is the zoom level for when the map is initially displayed.This is a number based upon the available zoom levels definedin the map viewer when the map is created.
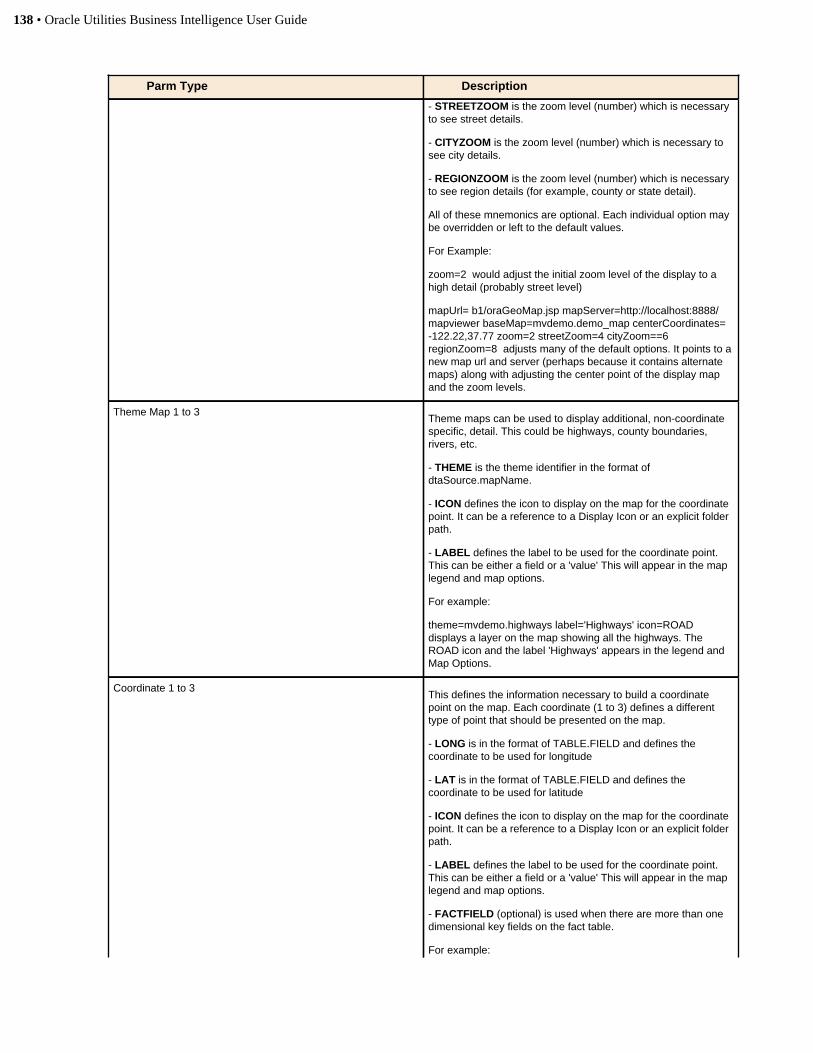
138 • Oracle Utilities Business Intelligence User Guide
Parm Type Description
- STREETZOOM is the zoom level (number) which is necessaryto see street details.
- CITYZOOM is the zoom level (number) which is necessary tosee city details.
- REGIONZOOM is the zoom level (number) which is necessaryto see region details (for example, county or state detail).
All of these mnemonics are optional. Each individual option maybe overridden or left to the default values.
For Example:
zoom=2 would adjust the initial zoom level of the display to ahigh detail (probably street level)
mapUrl= b1/oraGeoMap.jsp mapServer=http://localhost:8888/mapviewer baseMap=mvdemo.demo_map centerCoordinates=-122.22,37.77 zoom=2 streetZoom=4 cityZoom==6regionZoom=8 adjusts many of the default options. It points to anew map url and server (perhaps because it contains alternatemaps) along with adjusting the center point of the display mapand the zoom levels.
Theme Map 1 to 3Theme maps can be used to display additional, non-coordinatespecific, detail. This could be highways, county boundaries,rivers, etc.
- THEME is the theme identifier in the format ofdtaSource.mapName.
- ICON defines the icon to display on the map for the coordinatepoint. It can be a reference to a Display Icon or an explicit folderpath.
- LABEL defines the label to be used for the coordinate point.This can be either a field or a 'value' This will appear in the maplegend and map options.
For example:
theme=mvdemo.highways label='Highways' icon=ROAD displays a layer on the map showing all the highways. TheROAD icon and the label 'Highways' appears in the legend andMap Options.
Coordinate 1 to 3This defines the information necessary to build a coordinatepoint on the map. Each coordinate (1 to 3) defines a differenttype of point that should be presented on the map.
- LONG is in the format of TABLE.FIELD and defines thecoordinate to be used for longitude
- LAT is in the format of TABLE.FIELD and defines thecoordinate to be used for latitude
- ICON defines the icon to display on the map for the coordinatepoint. It can be a reference to a Display Icon or an explicit folderpath.
- LABEL defines the label to be used for the coordinate point.This can be either a field or a 'value' This will appear in the maplegend and map options.
- FACTFIELD (optional) is used when there are more than onedimensional key fields on the fact table.
For example:
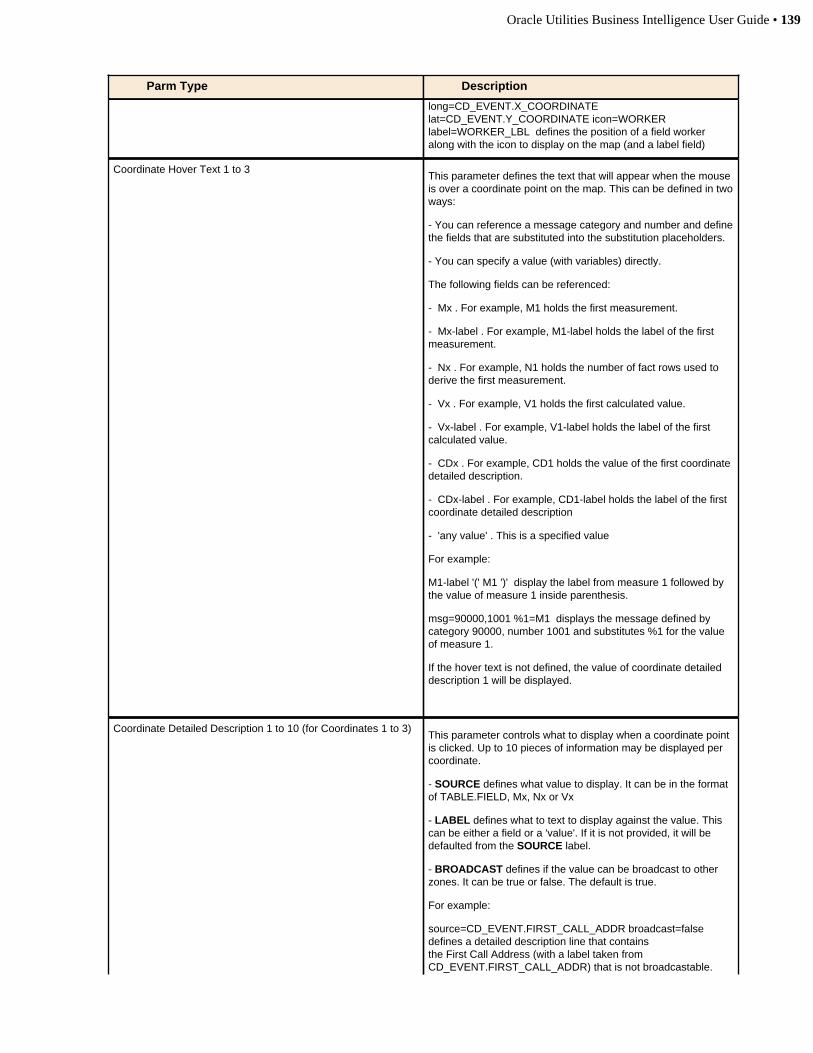
Oracle Utilities Business Intelligence User Guide • 139
Parm Type Description
long=CD_EVENT.X_COORDINATElat=CD_EVENT.Y_COORDINATE icon=WORKERlabel=WORKER_LBL defines the position of a field workeralong with the icon to display on the map (and a label field)
Coordinate Hover Text 1 to 3This parameter defines the text that will appear when the mouseis over a coordinate point on the map. This can be defined in twoways:
- You can reference a message category and number and definethe fields that are substituted into the substitution placeholders.
- You can specify a value (with variables) directly.
The following fields can be referenced:
- Mx . For example, M1 holds the first measurement.
- Mx-label . For example, M1-label holds the label of the firstmeasurement.
- Nx . For example, N1 holds the number of fact rows used toderive the first measurement.
- Vx . For example, V1 holds the first calculated value.
- Vx-label . For example, V1-label holds the label of the firstcalculated value.
- CDx . For example, CD1 holds the value of the first coordinatedetailed description.
- CDx-label . For example, CD1-label holds the label of the firstcoordinate detailed description
- 'any value' . This is a specified value
For example:
M1-label '(' M1 ')' display the label from measure 1 followed bythe value of measure 1 inside parenthesis.
msg=90000,1001 %1=M1 displays the message defined bycategory 90000, number 1001 and substitutes %1 for the valueof measure 1.
If the hover text is not defined, the value of coordinate detaileddescription 1 will be displayed.
Coordinate Detailed Description 1 to 10 (for Coordinates 1 to 3)This parameter controls what to display when a coordinate pointis clicked. Up to 10 pieces of information may be displayed percoordinate.
- SOURCE defines what value to display. It can be in the formatof TABLE.FIELD, Mx, Nx or Vx
- LABEL defines what to text to display against the value. Thiscan be either a field or a 'value'. If it is not provided, it will bedefaulted from the SOURCE label.
- BROADCAST defines if the value can be broadcast to otherzones. It can be true or false. The default is true.
For example:
source=CD_EVENT.FIRST_CALL_ADDR broadcast=false defines a detailed description line that containsthe First Call Address (with a label taken fromCD_EVENT.FIRST_CALL_ADDR) that is not broadcastable.

140 • Oracle Utilities Business Intelligence User Guide
Parm Type Description
source=CD_EVENT.REMEDY_CD label=ACTION_TO_FIX_LBLdefines a detailed description line that contains the RemedyCode (with a label taken from a field) that is broadcastable.
Additional Toolbar Options for Geographic Maps
Show Map Options
Click the show map options icon to show the Graph Options Area in the Multi-Use Area. This button only appears ifa graph is shown in the Graphic Display Area.
When the graph options appear in the multi-use area, a "red x" is superimposed on top of the graph options icon. Ifyou push the icon again, the multi-use area will be suppressed.
Additional Display Areas for Geographic Maps
Map Options Area
Note: Only appears for geographic maps. The Map Options Area is only available when a map is shown inthe Graphic Display Area.
Expose the Map Options Area (by clicking Show Map Options) if you want to do the following:
• Hide one or more visible layers (themes or coordinate point information)
The following is an example of how the Map Options area looks:
Maps (Oracle Business Intelligence Enterprise Edition)
Mapping feature in Oracle Utilities Business Intelligence 2.3.x is implemented using an HTML Static Text box inan answer that queries Geographical Data from the Data Warehouse. The geographical data must match predefinedgeographical data stored in MapViewer geographical features, typically State, County, City and Zip Code boundaries.It can also match geographical entities present in the Oracle Utilities Network Management network model, or anyother geographical feature that may exist in the MapViewer configuration and in the Data Warehouse tables.
Note: The concepts described in this chapter apply only to the user interface used in Oracle Utilities BusinessIntelligence versions 2.3.0 or later. If you are using Oracle Utilities Business Intelligence v2.0.5 or 2.2., pleaserefer to the previous section describing Maps with Portals and Zones.
Oracle Utilities Business Intelligence User Guide • 141
Technical Components
The components necessary to render a geographic map are:
• Oracle eLocation, Google Maps, or Bing Maps• Oracle Map Viewer• Geographic Spatial Data
The Oracle Utilities Business Intelligence product is delivered configured to use Oracle eLocation and contain somedefault maps that will not work unless a customer loads Geographic Spatial data.
Oracle eLocation
Oracle eLocation is an Oracle-hosted web site that contains a number of components including geocoding, mappingand a routing engine ,that combines to give you a very comprehensive location mapping tool. Location Services is100% Java, it uses Oracle Application Server, Oracle Spatial and NAVTEQ data. We use this web site as the defaultbase map that all other spatial data is displayed on top of.
We also provide support for using Google Maps or Yahoo maps as a base map. The base map can be changed in theMap Attribute Profile screen from the Oracle Utilities Business Intelligence Application, as described in the OracleUtilities Advanced Spatial Analytics Installation Guide.
Oracle Map Viewer
Oracle MapViewer is an Oracle Application Server Java component and JDeveloper extension used for maprendering and viewing geospatial data managed by Oracle Spatial or Locator. It complements the geographic datamanagement capacity of the Oracle Database by providing a generic web-based means of delivering and viewing anygeographic data in the database.
MapViewer includes a feature called Oracle Maps, which consists of a map cache server and an AJAX based webmapping client library. Geographic maps use Oracle Maps' JavaScript API to render a map in an answer. The OracleMapViewer server must be setup on the same server as Oracle Business Intelligence Enterprise Edition, since URLsare created from one server to another based on the current URL address.
Oracle MapViewer is also used to import Geographical data for display on top of the Base Map, based on matchingdata queried from the data warehouse.
For instructions on how to setup and configure Oracle MapViewer, refer to the Oracle Utilities Advanced SpatialAnalytics Installation Guide.
Note: Refer to Oracle's documentation for the detailed information on Oracle MapViewer.
Geographic Spatial Data
In order to place information on a geographic map, data in the data warehouse must match Geographic data (Themes)that is configured in Oracle MapViewer.
The standard map answers delivered with Oracle Utilities Business Intelligence include maps that query State, City,County, Zip Code and Network Model summary data. Since Oracle Utilities Business Intelligence does not haveaccess to this spatial data (and each customer would require different spatial data), it is the responsibility of theimplementation team to setup the Geographic Themes used in the maps. For detailed instructions on how to setupthese standard spatial themes, refer to the Oracle Utilities Advanced Spatial Analytics Installation Guide.
Disabling Map Answers
By default, the maps answers delivered with the product will be displayed whether or not MapViewer is installed. IfMapViewer is not installed, then error message will be displayed, and each answer will be empty. So if a customer
142 • Oracle Utilities Business Intelligence User Guide
does not want to display maps, a global variable has been setup in the UtilitiesBusinessAnalytics232.rpd file thatenables or disables the display of Map answers.
To turn off the display of map answers, follow these steps:
1. Open UtilitiesBusinessAnalytics232.rpd using the Oracle Business Intelligence Administration Tool.2. Select Manage -> Variables.3. Click on Repository -> Variables -> Static.4. Edit the OUBI_SPATIAL_ENABLED variable, changing the Default Initializer from ‘Y’ to ‘N’.5. Save the RPD file changes and restart the Oracle Business Intelligence Enterprise Edition Server.
Configuring Maps
This section provides guidelines for configuring maps used with Oracle Business Intelligence Enterprise Edition.
Global Settings
Once the MapViewer contents are installed, the next step is to configure a feature configuration using the MapAttribute Profile feature type with default settings for all map answers.
The following parameters are available for global Map setup:
Base Map Specifies the base map to used. The default value is:b1_world_map. Change this only if you do not follow thestandard installation steps and create a different base map.
Profile Cache Specifies whether to cache all map attribute and theme profilesettings. Valid values are true or false.
Copyright Text Defines copyright text to display on each map.
Default Data Source Database Connection String for the database that contains theMapViewer data
Weather Bug API Key The API Key provided by Weather Bug. Used only if usingWeather Bug to display radar images on maps.
Weather Bug PID Key The PID Key provided by Weather Bug . Used only if usingWeather Bug to display radar images on maps.
User Third Party Map Type Specifies type of Map to display if using Google or Bing Maps.
User Third Party Map Specifies the third party map type to use. Valid values aregoogle, bing, none
Bing Map Source The URL for Bing Map. Used only if using Bing maps.For example: http://ecn.dev.virtualearth.net/mapcontrol/mapcontrol.ashx?v=6.2
Bing Map API Key The API key for Bing maps. Used only if using Bing Maps.
Google Map Source The URL for Google Maps. Used only if using Google maps. Forexample: http://maps.google.com/maps?file=api&v=2
Google Map API Key The API key for Google maps. Used only if using Google Maps.
Map Theme Settings
Each map answer displays data in a map based on Themes defined in the Map Theme Profile menu from the OracleUtilities Business Intelligence Application. Assuming a standard installation with no configuration changes, none ofthe pre-defined themes will need to be modified.
To view the themes that are used in a Answer, open the answer using the Oracle Business Intelligence EnterpriseEdition Answers Tool, select the Results Tab, and click the Edit View icon on the Static Text box. Note that usingInternet Explorer is recommended for this since Firefox may truncate the Static text if there is a large amount of code.

Oracle Utilities Business Intelligence User Guide • 143
After opening the static text, you will see code similar to this code from the Arrears Map answer:
<div id="MapNode1"style="margin:0px;padding:0px;width=100%;height=600px;"></div><script language="javascript"src="/mapviewer/fsmc/jslib/obiee_mapping_inc.js"></script><script language="javascript"> setMapUrl('/mapviewer/fsmc/oraGeoMap.jsp');
var parm1 = new Array(); parm1['nodeId'] = 'MapNode1'; parm1['themeProfile'] = 'B1-012-THEME'; parm1['legendSelected'] = 'Y'; parm1['legendLabel'] = '@{biServer.variables['NQ_SESSION.CD_ADDR_UDF3_DESCR']}'; parm1['geographicalKeyColumn'] = parm1['legendLabel']; parm1['valueColumn'] = '@{biServer.variables['NQ_SESSION.CF_ARREARS_UDM5']}'; parm1['legendTitle'] = '@{biServer.variables['NQ_SESSION.B1_LEGEND_LBL']}'; parm1['getAnalyticColumn'] = 'Y'; parm1['legendLabel'] = ' '; addNSDPThemeParameter(1, parm1);
showBirdseyeMap();
</script>
In this example, the Map Theme Profile being used is B1-012-THEME. The other parameters set in this code overridethe base settings in the Map Theme Profile, allowing us to send configuration text to the Labels, which is not possiblein the Map Theme Profile configuration.
The first 4 lines and last two lines must be present in every map answer, and the following line of text must exist in anHTML block on the dashboard:
<script language="javascript"src="/mapviewer/fsmc/jslib/obiee_mapping_inc.js"></script>
By default, this line of text exists in an Initialize JS HTML text block just above the map answer on every dashboardpage that contains a map.