oracle utilities analytics dasboards for distribution ...€¦ · oracle utilities analytics...
TRANSCRIPT

Oracle Utilities Analytics Dasboards for Distribution Analytics, Outage AnalyticsMetric Reference Guide
Release 2.5.0.0.2
E49006-03
May 2014

Oracle Utilities Analytics Dasboards for Distribution Analytics, Outage Analytics Metric Reference Guide
E49006-03
Copyright © 2013, 2014 Oracle and/or its affiliates. All rights reserved.
This software and related documentation are provided under a license agreement containing restrictions on use and disclosure and are protected by intellectual property laws. Except as expressly permitted in your license agreement or allowed by law, you may not use, copy, reproduce, translate, broadcast, modify, license, transmit, distribute, exhibit, perform, publish, or display any part, in any form, or by any means. Reverse engineering, disassembly, or decompilation of this software, unless required by law for interoperability, is prohibited.
The information contained herein is subject to change without notice and is not warranted to be error-free. If you find any errors, please report them to us in writing.
If this is software or related documentation that is delivered to the U.S. Government or anyone licensing it on behalf of the U.S. Government, the following notice is applicable:
U.S. GOVERNMENT END USERS: Oracle programs, including any operating system, integrated software, any programs installed on the hardware, and/or documentation, delivered to U.S. Government end users are “commercial computer software” pursuant to the applicable Federal Acquisition Regulation and agency-specific supplemental regulations. As such, use, duplication, disclosure, modification, and adaptation of the programs, including any operating system, integrated software, any programs installed on the hardware, and/or documentation, shall be subject to license terms and license restrictions applicable to the programs. No other rights are granted to the U.S. Government.
This software or hardware is developed for general use in a variety of information management applications. It is not developed or intended for use in any inherently dangerous applications, including applications that may create a risk of personal injury. If you use this software or hardware in dangerous applications, then you shall be responsible to take all appropriate fail-safe, backup, redundancy, and other measures to ensure its safe use. Oracle Corporation and its affiliates disclaim any liability for any damages caused by use of this software or hardware in dangerous applications.
Oracle and Java are registered trademarks of Oracle and/or its affiliates. Other names may be trademarks of their respective owners.
Intel and Intel Xeon are trademarks or registered trademarks of Intel Corporation. All SPARC trademarks are used under license and are trademarks or registered trademarks of SPARC International, Inc. AMD, Opteron, the AMD logo, and the AMD Opteron logo are trademarks or registered trademarks of Advanced Micro Devices. UNIX is a registered trademark of The Open Group.
This software or hardware and documentation may provide access to or information on content, products, and services from third parties. Oracle Corporation and its affiliates are not responsible for and expressly disclaim all warranties of any kind with respect to third-party content, products, and services. Oracle Corporation and its affiliates will not be responsible for any loss, costs, or damages incurred due to your access to or use of third-party content, products, or services.

Contents - iMetric Reference Guide
Contents
Preface................................................................................................................................................................................. i-iAudience ............................................................................................................................................................................................... i-iRelated Documents ............................................................................................................................................................................. i-iNotational Conventions .................................................................................................................................................................... i-ii
Chapter 1Dashboard Content Reference........................................................................................................................................... 1-1
Outage Analytics ................................................................................................................................................................................ 1-1Overview ............................................................................................................................................................................ 1-1Current Outages ................................................................................................................................................................ 1-5Customers and Crews..................................................................................................................................................... 1-11Customers and Events.................................................................................................................................................... 1-15Historical Outages........................................................................................................................................................... 1-21Reliability .......................................................................................................................................................................... 1-26
Distribution Analytics ..................................................................................................................................................................... 1-34Distribution ...................................................................................................................................................................... 1-34

Preface
This document describes the Oracle Utilities Network Management Analytics components (such as metrics, dashboards, analyses, and subject areas) available in Oracle Utilities Analytics Dashboards. These metrics are used in the pre-built analyses, and/or available for customers to use via OBIEE Answers in building new analyses or extending existing analyses.
AudienceThis guide is intended for all users of Oracle Utilities Analytics Dashboards for Oracle Utilities Network Management System.
Related DocumentsFor more information, see the following documents:
• Oracle Utilities Analytics for Oracle Utilities Extractors and Schema and Oracle Utilities Analytics Dashboards Installation Guide
• Oracle Utilities Analytics for Oracle Utilities Extractors and Schema and Oracle Utilities Analytics Dashboards Quick Install Guide
• Oracle Utilities Analytics for Oracle Utilities Extractors and Schema and Oracle Utilities Analytics Dashboards Release Notes
• Oracle Utilities Analytics for Oracle Utilities Extractors and Schema and Oracle Utilities Analytics Dashboards User's Guide
• Oracle Utilities Analytics for Oracle Utilities Extractors and Schema and Oracle Utilities Analytics Dashboards Administration Guide
• Oracle Utilities Extractors and Schema for Oracle Utilities Network Management System Data Mapping Guide
See Also:
• Oracle Utilities Network Management System Documentation Library
Preface - iMetric Reference Guide

Notational ConventionsThe following notational conventions are used in this document:
Notation Indicates
boldface Graphical user interface elements associated with an action, terms defined in text, or terms defines in the glossary
italic Book titles, emphasis, or placeholder variables for which you supply particular values
monospace Commands within a paragraph, URLs, code in examples, text that appears on the screen, or text that you enter
Preface - iiMetric Reference Guide

Chapter 1Dashboard Content Reference
Oracle Utilities Analytics Dashboards, Release 2.5.0.0.2, provides analysis of and data from Oracle Utilities Network Management System using Oracle Business Intelligence Enterprise Edition built-in metrics. Non-spatial analytics, information that is not tied to geography, is represented in a series of dashboards showing tables, bar graphs, pie charts, and gauges. Spatial analytics, or information that is geographically related, use OBIEE integrated Map Viewer technology to represent events, weather data, map data, and other geographical information.
This chapter describes the Oracle Utilities Analytics Dashboards content for Oracle Utilities Network Management System. The dashboards are grouped by the following analytics:
• Outage Analytics
• Distribution Analytics
Outage AnalyticsThis section describes the metrics available in Outage Analytics of Oracle Utilities Analytics Dashboards. Outage Analytics enables utilities’ customers to monitor and measure outage management system metrics.
Outage Analytics mainly focuses on restoration of power. It helps business users to prioritize restoration efforts and manage resources based on the criteria, such as number of customers impacted, locations of emergency facilities, size of outages, duration of outages, and more.
Oracle Utilities Analytics provides Outage Analytics content in the following dashboards:
• Overview
• Current Outages
• Customers and Crews
• Customers and Events
• Historical Outages
• Reliability
OverviewThe Overview dashboard provides a high-level overview of the near real-time information about outages. The near real-time period can be configured.
To access this dashboard:
1. Go to the Home page.
2. Select Dashboards > Outage Analytics > Overview.
Dashboard Content Reference 1-1Metric Reference Guide

Outage Summary
Restoration Status
Property Details
Description This analysis shows a summary of outage details, such as the average outage duration, customer minutes interrupted, and customers impacted, as on the last extraction time, along with the count of various types of outages at various control zone hierarchy levels.
Purpose Outage managers can get a quick overview of the extent of outages and customers impacted from the current outages.
Representation The green, yellow, and red legends represent the number of custom-ers impacted due to outages. Each color depicts the severity in the impact.
The table displays the outage information, along with a tree view of control zone hierarchy. The outage duration, customer minutes inter-rupted, and customers impacted are also displayed.
Drill Down The Outage Events column link drills down to the Overview (in the Current Outages dashboard) and Overview (in the Historical Out-ages dashboard) dashboard pages for more details about the events.
The Customers Impacted column link drills down to the Custom-ers Impacted dashboard page for specific customer details.
Source Object Recent Customer Outage Fact, Recent Job Fact
OBIEE Subject Area NMS - NRT Overview
Metrics Non Outage Events, Outage Events, Fuzzy Events, Dispatched Out-ages, Confirmed Outages, Device Outages, Service Outages, Average Outage Duration, CMI, Customers Impacted
Property Details
Description This analysis shows the number of customers currently in outage, the number of customers who have been restored, the number of new customers in outage, and the total number of events. The data is shown as of the last 24 hours.
Purpose Business users can analyze the extent of outages and number of cus-tomers impacted. They can help to prioritize restoration efforts and managing resources based upon the criteria, such as locations of emergency facilities, size of outages, and duration of outages.
Dashboard Content Reference 1-2Metric Reference Guide

Critical Customers Without Power
Current Outages by Device Type
Representation The bar graph shows the number of new customers in outage, num-ber of customers restored, and number of customers still experiencing outage. The line graph represents number of events.
The X-axis represents the snapshot time in hours. The Y1-axis repre-sents the number of customers, while the Y2-axis represents the num-ber of total events. Hover over the bars for specific details.
At some point, the customers still experiencing outage should reach zero indicating that all the customers experiencing outages are restored.
Drill Down No drill down
Source Object Outage Fact
OBIEE Subject Area NMS - NRT Overview
Metrics Number of Customers Out, Customers Restored, Customers Remain-ing Out, Number of Events
Property Details
Description This analysis focuses on the critical, key, medical, and LSE customers affected by the current outages as of the last extraction date.
Purpose This tool provides the details of major customers impacted due to an outage. Business users can prioritize the restoration services accord-ingly.
Representation The bar graph shows the number of customers against each type of customer classification. The X-axis represents the branch of the cus-tomer. The Y-axis represents the number of customers. Hover over the bars for specific values.
The table shows the total number of customers impacted and the number of customers against each customer bucket. The details are collated according to a control zone hierarchy.
Drill Down The Customers Impacted column link drills down to the Custom-ers Impacted dashboard page for specific customer details.
Source Object Recent Customer Outage Fact
OBIEE Subject Area NMS - NRT Overview
Metrics Total Customers Impacted, Critical Customers, Key Customers, Med-ical Customers, LSE Customers
Property Details
Description This analysis shows the number of events against each device type. The data is shown as of the current date.
Property Details
Dashboard Content Reference 1-3Metric Reference Guide
Crew Assignment Summary
Wire Down Overview
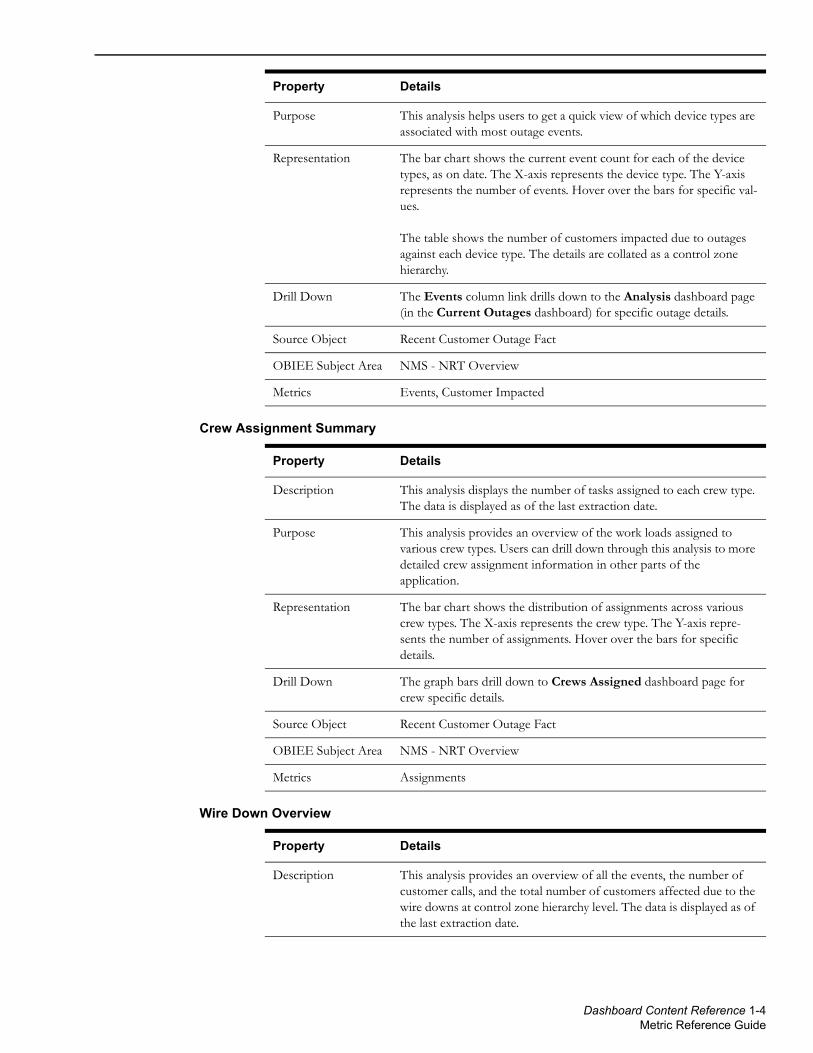
Purpose This analysis helps users to get a quick view of which device types are associated with most outage events.
Representation The bar chart shows the current event count for each of the device types, as on date. The X-axis represents the device type. The Y-axis represents the number of events. Hover over the bars for specific val-ues.
The table shows the number of customers impacted due to outages against each device type. The details are collated as a control zone hierarchy.
Drill Down The Events column link drills down to the Analysis dashboard page (in the Current Outages dashboard) for specific outage details.
Source Object Recent Customer Outage Fact
OBIEE Subject Area NMS - NRT Overview
Metrics Events, Customer Impacted
Property Details
Description This analysis displays the number of tasks assigned to each crew type. The data is displayed as of the last extraction date.
Purpose This analysis provides an overview of the work loads assigned to various crew types. Users can drill down through this analysis to more detailed crew assignment information in other parts of the application.
Representation The bar chart shows the distribution of assignments across various crew types. The X-axis represents the crew type. The Y-axis repre-sents the number of assignments. Hover over the bars for specific details.
Drill Down The graph bars drill down to Crews Assigned dashboard page for crew specific details.
Source Object Recent Customer Outage Fact
OBIEE Subject Area NMS - NRT Overview
Metrics Assignments
Property Details
Description This analysis provides an overview of all the events, the number of customer calls, and the total number of customers affected due to the wire downs at control zone hierarchy level. The data is displayed as of the last extraction date.
Property Details
Dashboard Content Reference 1-4Metric Reference Guide

Current OutagesThe Current Outages dashboard provides a snapshot of the network outages recorded in a region.
To access this dashboard:
1. Go to the Home page.
2. Select Dashboards > Outage Analytics > Current Outages.
The dashboard includes the following dashboard pages. The data for current calendar year and month is displayed by default. You may modify the criteria per requirement.
• Overview
• Hourly Trend
• Analysis
• Wire Down Events
OverviewThe Overview dashboard page provides a geographical representation of all the recent outage events in a region.
Outage Map
Purpose This analysis provides a summary view of wire down events recorded in each control zone hierarchy level. It also provides the number of events, as well as customers impacted and calls received in relation to these wire down events.
Users can drill down through this analysis to detailed information about wire down events and their status in other parts of the application.
Representation The table shows the number of customer calls and customers impacted due to events. The details are collated as a control zone hier-archy.
Drill Down The Events column link drills down to the Wire Down Events dash-board page for more details.
Source Object Recent Job Fact, Recent Customer Outage Fact, Recent Call Fact
OBIEE Subject Area NMS - NRT Overview
Metrics Number of Events, Customers Interrupted, Number of Calls
Property Details
Property Details
Description This map displays all outage events that are within near real-time range.
The map also shows the regions where outage events occurred, the number of customers impacted on the respective events, and the crew working on those events.
Dashboard Content Reference 1-5Metric Reference Guide
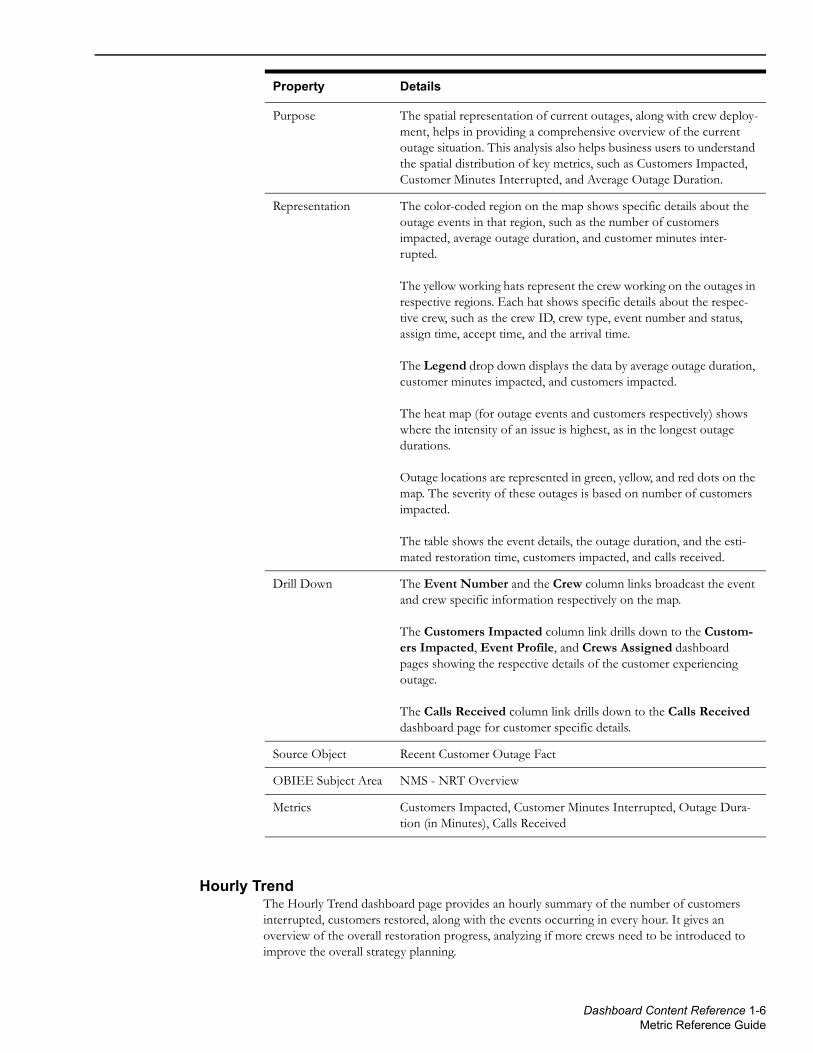
Hourly TrendThe Hourly Trend dashboard page provides an hourly summary of the number of customers interrupted, customers restored, along with the events occurring in every hour. It gives an overview of the overall restoration progress, analyzing if more crews need to be introduced to improve the overall strategy planning.
Purpose The spatial representation of current outages, along with crew deploy-ment, helps in providing a comprehensive overview of the current outage situation. This analysis also helps business users to understand the spatial distribution of key metrics, such as Customers Impacted, Customer Minutes Interrupted, and Average Outage Duration.
Representation The color-coded region on the map shows specific details about the outage events in that region, such as the number of customers impacted, average outage duration, and customer minutes inter-rupted.
The yellow working hats represent the crew working on the outages in respective regions. Each hat shows specific details about the respec-tive crew, such as the crew ID, crew type, event number and status, assign time, accept time, and the arrival time.
The Legend drop down displays the data by average outage duration, customer minutes impacted, and customers impacted.
The heat map (for outage events and customers respectively) shows where the intensity of an issue is highest, as in the longest outage durations.
Outage locations are represented in green, yellow, and red dots on the map. The severity of these outages is based on number of customers impacted.
The table shows the event details, the outage duration, and the esti-mated restoration time, customers impacted, and calls received.
Drill Down The Event Number and the Crew column links broadcast the event and crew specific information respectively on the map.
The Customers Impacted column link drills down to the Custom-ers Impacted, Event Profile, and Crews Assigned dashboard pages showing the respective details of the customer experiencing outage.
The Calls Received column link drills down to the Calls Received dashboard page for customer specific details.
Source Object Recent Customer Outage Fact
OBIEE Subject Area NMS - NRT Overview
Metrics Customers Impacted, Customer Minutes Interrupted, Outage Dura-tion (in Minutes), Calls Received
Property Details
Dashboard Content Reference 1-6Metric Reference Guide

Restoration Status
Estimated Number of Restorations
Property Details
Description This analysis shows the number of customers currently in outage, the number of customers who have been restored, the number of new customers in outage, and the number of events. The data is shown as of the last 24 hours.
Purpose Business users can analyze the extent of outages and number of cus-tomers impacted. They can help to prioritize restoration efforts and managing resources based upon the criteria, such as locations of emergency facilities, size of outages, and duration of outages.
Representation The bar graph shows the number of new customers in outage, num-ber of customers restored, and number of customers still experiencing outage. The line graph represents the number of events.
The X-axis represents the snapshot time in hours. The Y1-axis repre-sents the number of customers, while the Y2-axis represents the num-ber of outage events. Hover over the bars for specific details.
At some point, the customers still experiencing outage should reach zero indicating that all the customers experiencing outages are restored.
Drill Down No drill down
Source Object Outage Fact
OBIEE Subject Area NMS - NRT Overview
Metrics Number of Customers Append, Number of New Customers Out, Number of Events
Property Details
Description This analysis shows the number of customers expected to be restored in the next 24 hours.
Purpose Business users can track the number of customers that can be restored at each time interval.
Representation The line graph shows the number of customers going to be restored on an hourly basis. The X-axis represents the time in hours. The Y-axis represents the number of customers. Hover over the line for spe-cific details.
Drill Down No drill down
Source Object Outage Fact
OBIEE Subject Area NMS - NRT Overview
Metrics Number of customers expected to be restored
Dashboard Content Reference 1-7Metric Reference Guide
Events Hourly Trend
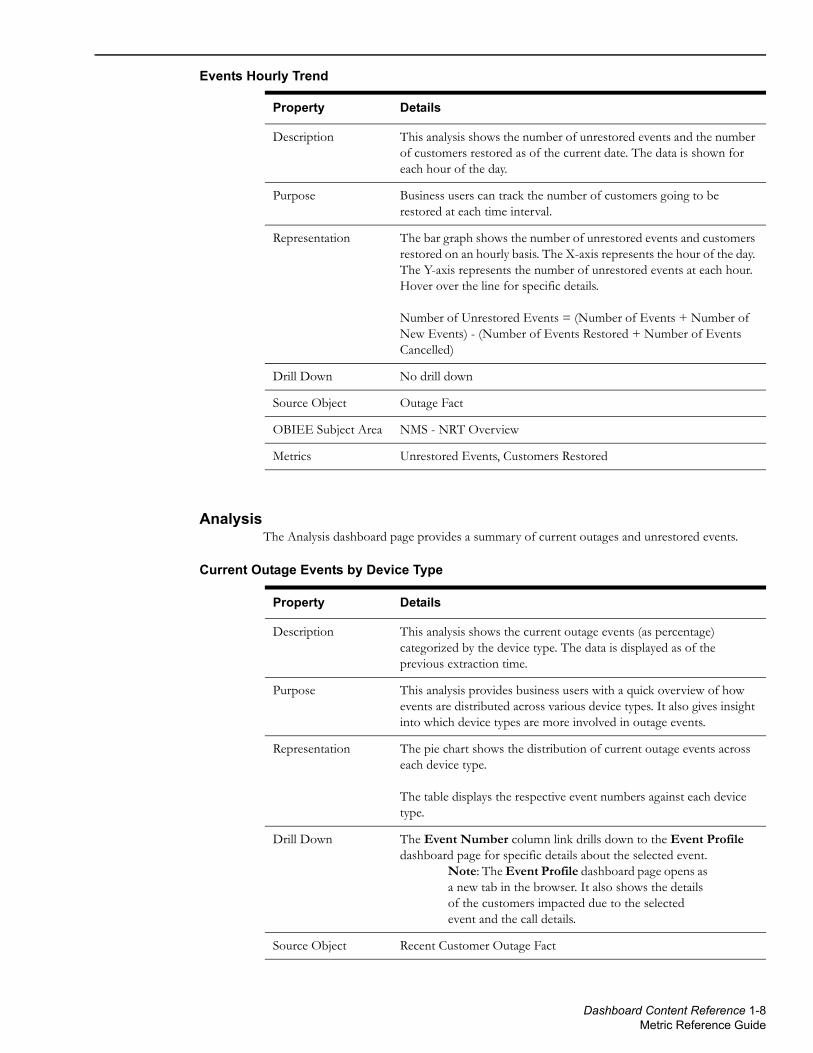
AnalysisThe Analysis dashboard page provides a summary of current outages and unrestored events.
Current Outage Events by Device Type
Property Details
Description This analysis shows the number of unrestored events and the number of customers restored as of the current date. The data is shown for each hour of the day.
Purpose Business users can track the number of customers going to be restored at each time interval.
Representation The bar graph shows the number of unrestored events and customers restored on an hourly basis. The X-axis represents the hour of the day. The Y-axis represents the number of unrestored events at each hour. Hover over the line for specific details.
Number of Unrestored Events = (Number of Events + Number of New Events) - (Number of Events Restored + Number of Events Cancelled)
Drill Down No drill down
Source Object Outage Fact
OBIEE Subject Area NMS - NRT Overview
Metrics Unrestored Events, Customers Restored
Property Details
Description This analysis shows the current outage events (as percentage) categorized by the device type. The data is displayed as of the previous extraction time.
Purpose This analysis provides business users with a quick overview of how events are distributed across various device types. It also gives insight into which device types are more involved in outage events.
Representation The pie chart shows the distribution of current outage events across each device type.
The table displays the respective event numbers against each device type.
Drill Down The Event Number column link drills down to the Event Profile dashboard page for specific details about the selected event.
Note: The Event Profile dashboard page opens as a new tab in the browser. It also shows the details of the customers impacted due to the selected event and the call details.
Source Object Recent Customer Outage Fact
Dashboard Content Reference 1-8Metric Reference Guide

Unresolved Events
Wire Down EventsThe Wire Down Events dashboard page displays the near real-time events associated with all wire downs. It provides details of all current events related to wire down scenarios, along with the number of calls received and name of the calling entity, and lays out this data according to the control zone.
The page also provides information on wire down event hourly trend, as well as trend in number of calls received related to wire downs.
OBIEE Subject Area NMS - NRT Overview
Metrics Events, Device Type
Property Details
Description This analysis displays the number of customer calls received corresponding to a given event, grouped by the event status.
The events are categorized into event statuses. For example: new (NEW), onsite (ONS), assigned (ASN), and enroute (ENR). The data is displayed as on the last extraction time.
Note: A single event can have an impact on multiple customers.
Purpose Based on the number of calls against each event, business analysts can quickly identify the state with highest priority.
Representation The bar graph shows the number of calls received from customers against each outage event status. The X-axis represents the event sta-tus. The Y-axis represents the number of customer calls received. Hover over the graph for respective values.
The table shows the number of customer calls received per each out-age event number against the respective event status.
Drill Down The Event Number column link drills down to the Event Profile dashboard page for specific details about the selected event.
Note: The Event Profile dashboard page opens as a new tab in the browser. It also shows the details of the customers impacted due to the selected event and the call details.
Source Object Recent Call Fact
OBIEE Subject Area NMS - NRT Overview
Metrics Number of Calls
Property Details
Dashboard Content Reference 1-9Metric Reference Guide
Events with Wire Down Calls
Call Summary
Property Details
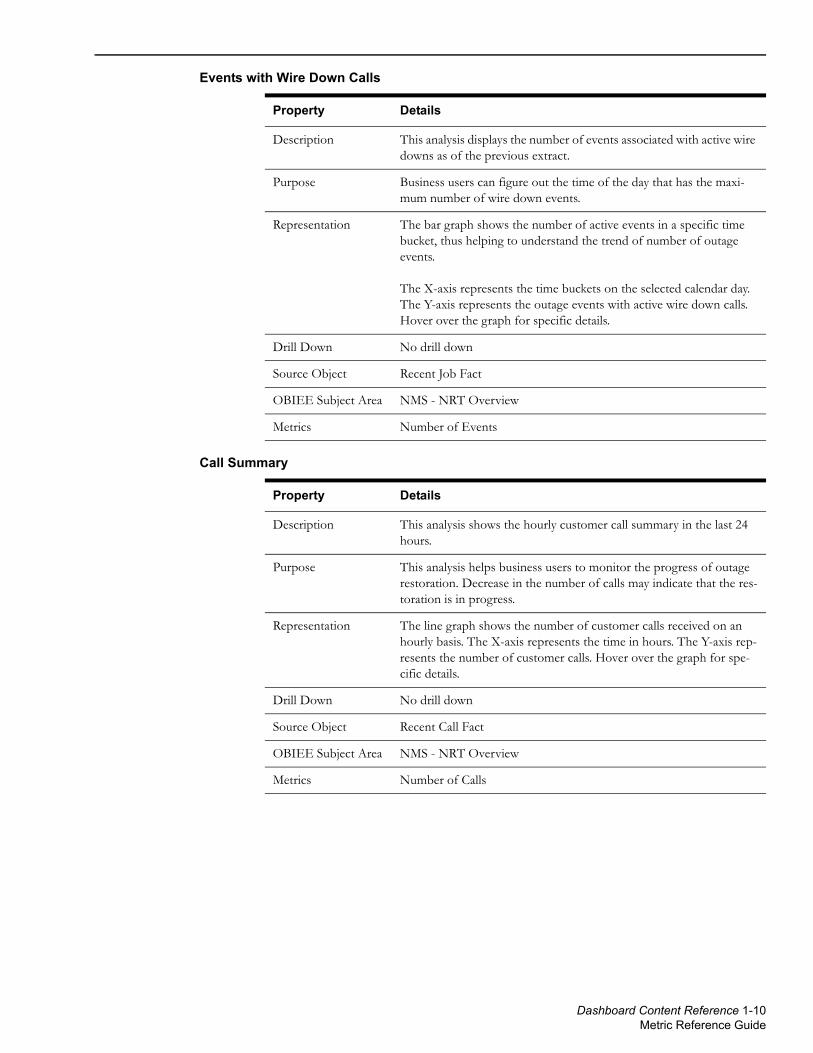
Description This analysis displays the number of events associated with active wire downs as of the previous extract.
Purpose Business users can figure out the time of the day that has the maxi-mum number of wire down events.
Representation The bar graph shows the number of active events in a specific time bucket, thus helping to understand the trend of number of outage events.
The X-axis represents the time buckets on the selected calendar day. The Y-axis represents the outage events with active wire down calls. Hover over the graph for specific details.
Drill Down No drill down
Source Object Recent Job Fact
OBIEE Subject Area NMS - NRT Overview
Metrics Number of Events
Property Details
Description This analysis shows the hourly customer call summary in the last 24 hours.
Purpose This analysis helps business users to monitor the progress of outage restoration. Decrease in the number of calls may indicate that the res-toration is in progress.
Representation The line graph shows the number of customer calls received on an hourly basis. The X-axis represents the time in hours. The Y-axis rep-resents the number of customer calls. Hover over the graph for spe-cific details.
Drill Down No drill down
Source Object Recent Call Fact
OBIEE Subject Area NMS - NRT Overview
Metrics Number of Calls
Dashboard Content Reference 1-10Metric Reference Guide
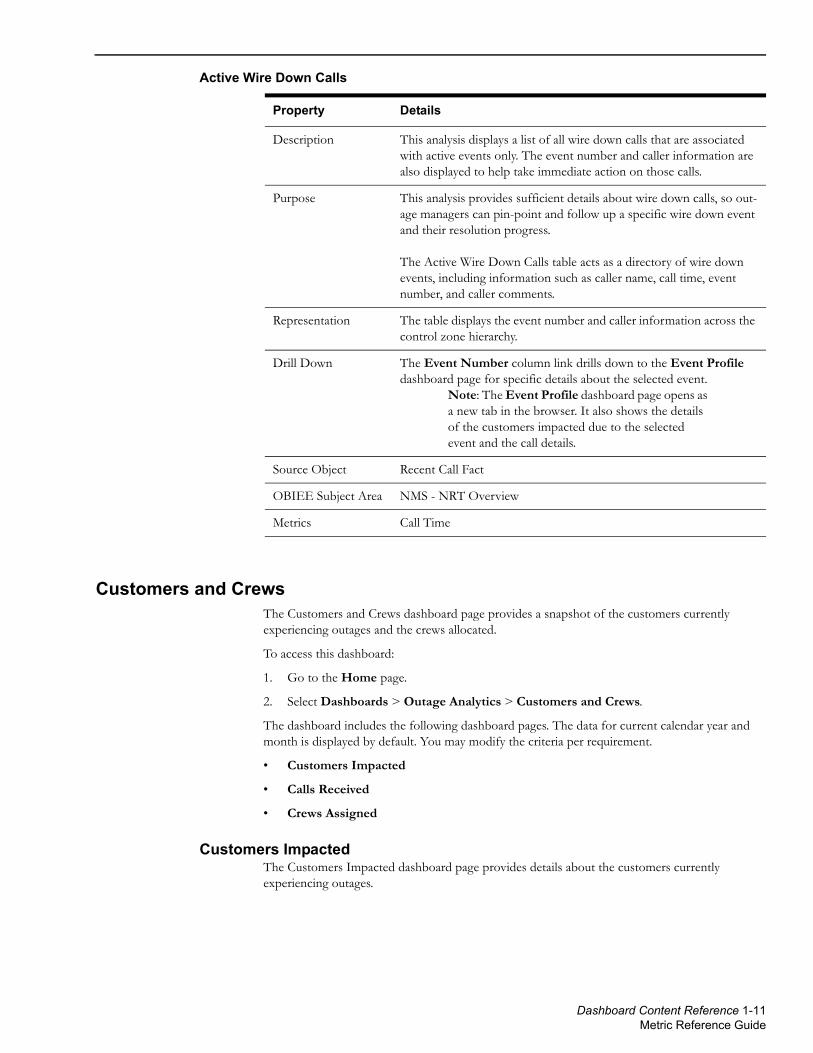
Active Wire Down Calls
Customers and CrewsThe Customers and Crews dashboard page provides a snapshot of the customers currently experiencing outages and the crews allocated.
To access this dashboard:
1. Go to the Home page.
2. Select Dashboards > Outage Analytics > Customers and Crews.
The dashboard includes the following dashboard pages. The data for current calendar year and month is displayed by default. You may modify the criteria per requirement.
• Customers Impacted
• Calls Received
• Crews Assigned
Customers ImpactedThe Customers Impacted dashboard page provides details about the customers currently experiencing outages.
Property Details
Description This analysis displays a list of all wire down calls that are associated with active events only. The event number and caller information are also displayed to help take immediate action on those calls.
Purpose This analysis provides sufficient details about wire down calls, so out-age managers can pin-point and follow up a specific wire down event and their resolution progress.
The Active Wire Down Calls table acts as a directory of wire down events, including information such as caller name, call time, event number, and caller comments.
Representation The table displays the event number and caller information across the control zone hierarchy.
Drill Down The Event Number column link drills down to the Event Profile dashboard page for specific details about the selected event.
Note: The Event Profile dashboard page opens as a new tab in the browser. It also shows the details of the customers impacted due to the selected event and the call details.
Source Object Recent Call Fact
OBIEE Subject Area NMS - NRT Overview
Metrics Call Time
Dashboard Content Reference 1-11Metric Reference Guide

Customers Impacted
Customer Details
Property Details
Description This analysis provides a spatial representation of customers currently experiencing outages in a specific region.
Purpose This analysis provides a spatial representation of customers impacted based on the postal code. It helps business users to quickly pin-point areas where most customer impact is recorded. Besides this measure, the view also allows users to view average outage duration and cus-tomer minutes interrupted across postal codes.
Representation The color-coded region on the map shows specific details about the customers impacted in that region, such as customers impacted, aver-age outage duration, and customer minutes interrupted, along with its postal code.
The postal code link broadcasts the postal code value to the Cus-tomer Details analysis on the same dashboard page.
Drill Down No drill down
Source Object Recent Customer Outage Fact
OBIEE Subject Area NMS - NRT Overview
Metrics Customers Impacted, Outage Duration, CMIs
Property Details
Description This analysis displays a list of all customers currently experiencing outages in a specific region (postal code). The customers are displayed along with the associated event, which helps in analyzing the number of customers out due to each event.
The data is based on the postal code selected on the Customers Impacted map.
Purpose This analysis enables business users to quickly pin-point areas of cus-tomers experiencing long outage duration and take remedial action. It also allows the users to identify critical customers without power in a specific postal code area, so that they can be attended to at the earli-est.
Representation The Postal Code drop down lists the postal codes for specific areas.
The table displays customer information, outage duration, event num-ber, and the estimated restoration time for the selected postal code.
Drill Down The Customer Name column link drills down to the Customer Profile dashboard page for specific details about the selected cus-tomer. The Event Number column link drills down to the Event Profile dashboard page for specific details about the selected event.
Note: Both the Customer Profile and the Event Profile dashboard pages open as new tabs in the browser.
Dashboard Content Reference 1-12Metric Reference Guide
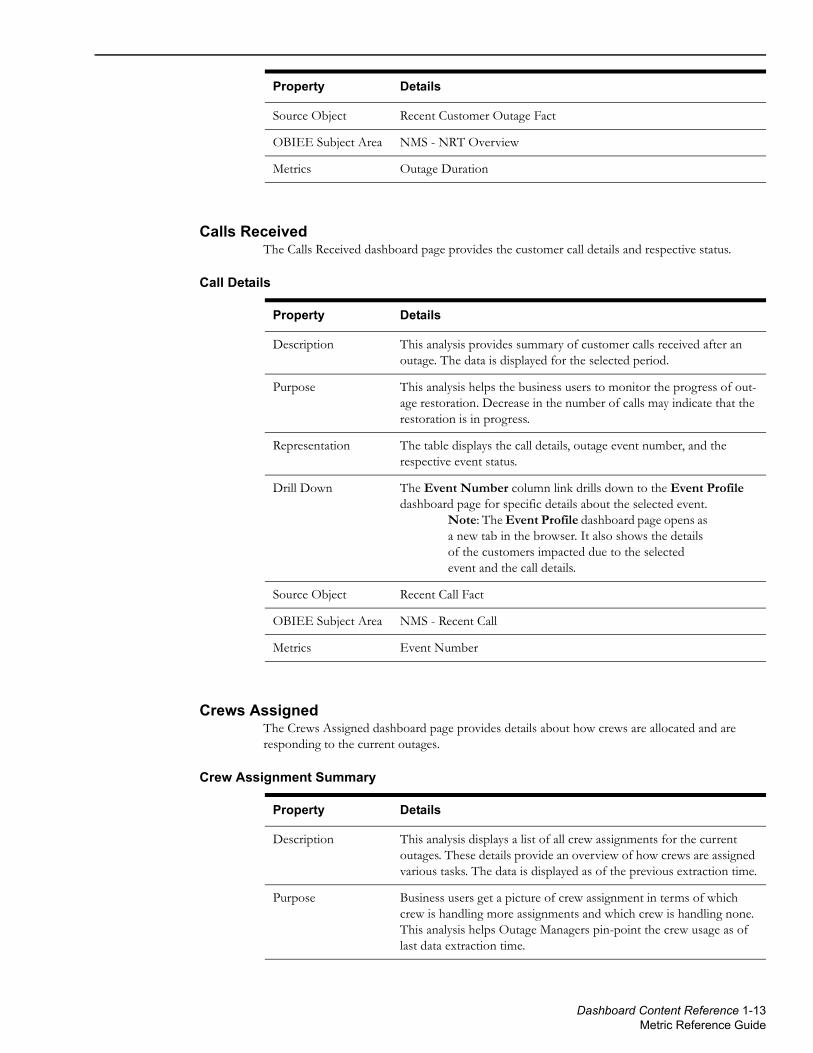
Calls ReceivedThe Calls Received dashboard page provides the customer call details and respective status.
Call Details
Crews AssignedThe Crews Assigned dashboard page provides details about how crews are allocated and are responding to the current outages.
Crew Assignment Summary
Source Object Recent Customer Outage Fact
OBIEE Subject Area NMS - NRT Overview
Metrics Outage Duration
Property Details
Property Details
Description This analysis provides summary of customer calls received after an outage. The data is displayed for the selected period.
Purpose This analysis helps the business users to monitor the progress of out-age restoration. Decrease in the number of calls may indicate that the restoration is in progress.
Representation The table displays the call details, outage event number, and the respective event status.
Drill Down The Event Number column link drills down to the Event Profile dashboard page for specific details about the selected event.
Note: The Event Profile dashboard page opens as a new tab in the browser. It also shows the details of the customers impacted due to the selected event and the call details.
Source Object Recent Call Fact
OBIEE Subject Area NMS - Recent Call
Metrics Event Number
Property Details
Description This analysis displays a list of all crew assignments for the current outages. These details provide an overview of how crews are assigned various tasks. The data is displayed as of the previous extraction time.
Purpose Business users get a picture of crew assignment in terms of which crew is handling more assignments and which crew is handling none. This analysis helps Outage Managers pin-point the crew usage as of last data extraction time.
Dashboard Content Reference 1-13Metric Reference Guide

On-site Crew List
Crew Assignments by Control Zone
Representation The table displays the crew type, crew names corresponding to each type, and the number of assignments for each of the crews.
Drill Down The Assignments column link drills down to the Event Detail dash-board page for specific event details.
Source Object Recent Crew Activity Fact
OBIEE Subject Area NMS - NRT Overview
Metrics Number of Assignments
Property Details
Description This analysis displays a list of all crews who are assigned the outage restoration tasks. These crews represent the resources actively working on restoring the current outages. The data is displayed as of the last extraction time.
Purpose Business users can get a snapshot of which crew is assigned which task, as well as other specific outage details.
Representation The table displays the crew details (crew and crew type), along with assignment time, en route time, and on site time for each of the crews.
Drill Down The Event Number column link drills down to the Event Profile dashboard page for specific details about the selected event.
Note: The Event Profile page opens as a new tab in the browser. It also shows the details of the customers impacted due to the selected event and the call details.
Source Object Recent Crew Activity Fact
OBIEE Subject Area NMS - NRT Overview
Metrics Assignment Time, En-route time, On-site Time
Property Details
Description This analysis shows the status of crews at various control zone level hierarchies. The data is displayed as of the previous extraction date.
Purpose Business users can view the crew assignment details across Control Zone layers. This analysis also gives information on the total crew deployed, and how many are in which state of engagement.
Property Details
Dashboard Content Reference 1-14Metric Reference Guide

Customers and EventsThe Customers and Events dashboard focuses on customers’ profile, the outage events, and the respective details.
To access this dashboard:
1. Go to the Home page.
2. Select Dashboards > Outage Analytics > Customers and Events.
The dashboard includes the following dashboard pages. The data for current calendar year and month is displayed by default. You may modify the criteria per requirement.
• Events
• Customers
• Customer Profile
• Event Profile
EventsThe Events dashboard page provides details about the events and the customers impacted due to the events.
Events
Representation The table displays the total number of crew assignments and also the status (unassigned, assigned, en-route, on-site, or complete) of each event as of the previous extraction time.
The bar graph shows the number of crew assignments in each status bucket, at branch level of the control zone hierarchy. The X-axis rep-resents the branch. The Y-axis represents the number of assignments. Hover over the bars for specific details.
Drill Down No drill down
Source Object Recent Crew Activity Fact
OBIEE Subject Area NMS - NRT Overview
Metrics Unassigned, Assigned, En-route, On-site, Completed, Total
Property Details
Property Details
Description This analysis displays the event number, its status, and the outage duration for each of the event in the selected month or date range.
Purpose Based on the number of calls against each outage event, business ana-lysts can quickly identify the state with highest priority.
Dashboard Content Reference 1-15Metric Reference Guide

CustomersThe Customers dashboard page provides insight into the details of customers being served by the utility.
Customers
Representation The table shows the number of customer calls received per each event number against the respective event status. It shows the number of customers impacted due to each event, the number of calls received, and the restoration date/time for each of the events. Further, the table also shows if a crew has been assigned to restore the respective outages.
Drill Down The Event Number column link drills down to the Event Profile dashboard page for specific details about the selected event.
Note: The Event Profile dashboard page opens as a new tab in the browser. It also shows the details of the customers impacted due to the selected event and the call details.
Source Object Recent Customer Outage Fact
OBIEE Subject Area NMS - NRT Overview
Metrics Customers Impacted, Calls Received
Property Details
Property Details
Description This analysis displays a list of customers served by the utility.
Purpose Business users can quickly search for the customer and view associ-ated address, device and meter information.
Representation The table shows the customer details (name, contact number, and the address), the name of the device installed at each customer location, and the respective meter reading of each device. It also identifies the criticality type for each customer.
Drill Down The Customer Name column link drills down to the Customer Profile dashboard page for specific details about the selected cus-tomer.
Note: The Customer Profile dashboard page opens as a new tab in the browser. It also shows the event and call summaries.
Source Object This analysis is not associated with any of the fact tables.
OBIEE Subject Area Shared SNL
Metrics No metrics
Dashboard Content Reference 1-16Metric Reference Guide

Customer ProfileThe Customer Profile dashboard page displays the details of the customer selected in the Customers dashboard page, as a new tab in the browser.
Note: This dashboard page is not accessible directly to business users. The users will be able to navigate to this page only from the Customers dashboard page.
Customer Locations
Recent Outages Locations
Property Details
Description This analysis shows a list of all addresses associated with the selected customer.
Purpose The Customer Service representatives use these details while responding to customer calls.
Representation The table shows the customer details (name, contact number, ID, and the address), the meter reading on the device installed at the customer location, and the criticality type of the customer.
Drill Down No drill down
Source Object This analysis loads data from the Supply Node Lookup (CD_SNL) dimension table. It is not associated with any of the fact tables.
OBIEE Subject Area Shared - SNL
Metrics None
Property Details
Description This analysis shows the location details that experienced an outage recently, along with the number of days since last outage, for the specific address of the customer.
Note: This analysis is based on a combination of dimensional attributes and is not associated with any fact table. Its response time may be greater than the other analyses. You may prefer to hide it to avoid any performance issues.
Purpose Business users can identify the locations with recent outage and ana-lyze the cause and trend.
Representation The table shows the customer contact details and the locations where there was an outage.
Drill Down No drill down
Source Object Recent Customer Outage Fact
OBIEE Subject Area NMS - Recent Customer Outage
Metrics Days Since Last Outage
Dashboard Content Reference 1-17Metric Reference Guide

Event Summary
Event Log
Property Details
Description This analysis shows the summary of all events for the selected customer.
Purpose The Customer Service representatives use these details while responding to customer calls. Business users can plan effective resto-ration processes to reduce the outage durations.
Representation The table shows the number of events in each month.
Drill Down The Month column link show the master-detail interaction with the Event Log analysis on the same dashboard page. Clicking a specific month will refresh the Event Log analysis to show the data for that month.
Source Object Restored Customer Outage Fact
OBIEE Subject Area NMS - Historical Overview
Metrics Events
Property Details
Description This analysis shows the events that occurred in the selected month for the specific customer. It also shows the begin date, corresponding status, outage duration, and the restoration date/time for each event.
Note: The Month Year value for which the data is shown in this analysis can also be broadcast from the Event Summary analysis on the same dashboard page.
Purpose Business users can get a clear picture on the events that occurred in a month for the selected customer. If there are multiple events at same location, they can analyze the reasons for the same and take appropri-ate measures.
Representation The Month Year drop down filters the data for the specific month.
The table shows the outage begin date, its restoration date, and the outage duration for each of the events. It also shows the status of each event.
Drill Down No drill down
Source Object Restored Customer Outage Fact
OBIEE Subject Area NMS - Restored Customer Outage
Metrics Outage Duration
Dashboard Content Reference 1-18Metric Reference Guide

Call Summary
Call Log
Event ProfileThe Event Profile dashboard page displays the details of the event selected in the Events dashboard page, as a new tab in the browser.
Note: This dashboard page is not accessible directly to the users. They will be able to navigate to this page only from the Events dashboard page or by clicking the Event Number column link in the respective analyses.
Property Details
Description This analysis shows the summary of all calls received from the selected customer.
Purpose The Customer Service representatives use these details to analyze the number of calls from the customer and identify any priority calls.
Representation The table shows the number of customer calls received in each month.
Drill Down The Month column link show the master-detail interaction with the Call Log analysis on the same dashboard page. Clicking a specific month will refresh the Call Log analysis to show the data for that month.
Source Object Restored Call Fact
OBIEE Subject Area NMS - Restored Call
Metrics Number of Calls
Property Details
Description This analysis shows the date when the customer call was logged, the call ID, and its status (resolved/pending).
Note: The Month value for which the data is shown in this analysis can also be broadcast from the Call Summary analysis on the same dashboard page.
Purpose Business users can view the number of calls from a specific customer and analyze the call details. They can also identify the priority calls logged and the respective status of each call.
Representation The Month drop down filters the data for the specific month.
The table shows the date and time when the call was received, the caller details (such as name, ID), the call’s priority, and its status (pending or resolved).
Drill Down No drill down
Source Object Restored Call Fact
OBIEE Subject Area NMS - Restored Call
Metrics None
Dashboard Content Reference 1-19Metric Reference Guide

Event Profile
Customers Impacted
Calls
Property Details
Description This analysis shows the profile and the crew details for the selected event.
Purpose Business users can identify all possible details of the selected event, such as the feeder ID, the substation of the feeder, the event’s status, its restoration date, etc.
Representation The first table shows the location and feeder details of the selected outage event, its status, cause for the outage, number of customers impacted, and the outage duration.
The second table displays the details of the crew assigned to the selected event, such as the crew name, assignment time, arrival time, and completion time.
Drill Down No drill down
Source Object Restored Job Fact, Restored Crew Activity Fact
OBIEE Subject Area NMS - Restored Job, NMS - Restored Crew Activity
Metrics Customers Impacted, Outage Duration, Assignment Time, Unassign-ment Time, Acceptance Time, Arrival Time, Completion Time
Property Details
Description This analysis shows the list of customers impacted due to the selected event.
Purpose Business users can identify the number of customers impacted due to a specific event. They can further analyze if there are multiple loca-tions of the same customer being impacted due to the outage.
Representation The table shows the details of the customers impacted, such the customer name, location details, outage duration, and the estimated restoration time.
Drill Down No drill down
Source Object Restored Customer Outage Fact
OBIEE Subject Area NMS - Restored Customer Outage
Metrics Outage Duration
Property Details
Description This analysis shows the date when the specific event was reported, the caller details, and its status (resolved/pending).
Dashboard Content Reference 1-20Metric Reference Guide

Historical OutagesThe Historical Outages dashboard provides historical information showing trends that help plan for future actions. The historical data can be filtered by date range, storm name, control zone, etc.
To access this dashboard:
1. Go to the Home page.
2. Select Dashboards > Outage Analytics > Historical Outages.
The dashboard includes the following dashboard pages. The data for current calendar year and month is displayed by default. You may modify the criteria per requirement.
• Overview
• Historical Outage Map
• Trend
• Duration Analysis
• Event Detail
OverviewThe Overview dashboard page provides a high-level summary of the outages.
Yearly Summary
Purpose Business users can view the number of calls logged against the spe-cific event and analyze the event details. They can also identify the pri-ority calls logged and the respective status of each call.
Representation The table shows the date and time when the call (reporting an outage) was received, the caller details (such as name, ID), the call’s priority, and its status (pending or resolved).
Drill Down No drill down
Source Object Restored Call Fact
OBIEE Subject Area NMS - Restored Call
Metrics No metrics
Property Details
Property Details
Description This analysis displays the number of events against the impacted customers, aggregated by year. It shows a trend of whether the number of events are increasing or decreasing over the years.
Purpose Business users can compare the data and analyze the event trend. If there is an increase in the number of events from the previous year, appropriate business decisions need to be taken to reduce it.
Dashboard Content Reference 1-21Metric Reference Guide

Events by Device Type
Outage Causes
Representation The bar graph show the year-on-year comparison of the customers interrupted. The X-axis represents the year. The Y1-axis represents the number of customers impacted due to outage events. The Y-2 axis represents the number of outage events. Hover over the bars for spe-cific values.
The line shows the number of events by year. It also shows the trend in increase or decrease of events in those years.
Drill Down The bars drills down to the Trend dashboard page for specific details.
Source Object Restored Job Fact, Restored Customer Outage Fact
OBIEE Subject Area NMS - Historical Overview
Metrics Number of Events, Customer Interrupted
Property Details
Description This analysis shows the number of events against each device type. The data is shown for the previous six months.
Purpose Business users can identify the device types that are majorly causing the events.
Representation The pie chart shows the distribution of events (as percentage of total) for each device type.
Drill Down No drill down
Source Object Restored Job Fact, Restored Customer Outage Fact
OBIEE Subject Area NMS - Historical Overview
Metrics Percentage of Events per Device Type
Property Details
Description This analysis shows the number of events by each outage cause for the previous six months. The outage causes can include tree trimming, foreign interference, weather, etc.
Purpose This analysis helps the business users to plan the current outage resto-rations to prevent any outages in the future.
Representation The pie chart shows the distribution of outage causes (as percentage of total) for the previous six months.
Drill Down The pie chart drills down to the Trend dashboard page for specific outage cause details.
Source Object Restored Job Fact
OBIEE Subject Area NMS - Historical Overview
Property Details
Dashboard Content Reference 1-22Metric Reference Guide

Historical Outage MapThe Historical Outage Map dashboard page provides a geographical representation of the outage details.
Historical Monthly Outage Playback
TrendThe Trend dashboard page provides a snapshot of all the events occurred throughout the calendar year, along with their impact on customers.
Monthly Summary
Metrics Percentage of Events per Outage Cause
Property Details
Property Details
Description Replay on this map is played using historical data that could span over several years. The entire data for the result set is shown on the map. The playback is based on a monthly summary of all outage events.
Purpose This analysis is typically used to analyze how quickly outages in a region are restored in various circumstances, such as during a storm.
Representation The color-coded region on the map shows the customers impacted and minutes interrupted in that region.
The Legend drop down displays the data by customer minutes impacted and customers impacted.
Outage locations are represented in green, yellow, and red dots on the map. The severity of these outages is based on number of customers impacted.
Drill Down No drill down
Source Object Restored Customer Outage Fact
OBIEE Subject Area NMS - Historical Overview
Metrics Customer impacted, CMIs
Property Details
Description This analysis displays the number of events against the impacted customers. It shows a trend of whether the number of events are increasing or decreasing over the months.
Purpose Business users can compare the data and analyze the event trend. If there is an increase in the number of events from the previous month, appropriate business decisions need to be taken to reduce it.
Dashboard Content Reference 1-23Metric Reference Guide

Estimated Versus Actual Restoration Time
Outage Causes Trend
Representation The bars show a monthly comparison of the customers interrupted. The line shows the number of events for the selected time scale. It also shows the trend in increase or decrease of events in those months.
The X-axis represents the month and year. The Y1-axis represents the number of customers impacted due to events, while the Y-axis repre-sents the number of events. Hover over the bars for specific values.
Drill Down No drill down
Source Object Restored Job Fact, Restored Customer Outage Fact
OBIEE Subject Area NMS - Historical Overview
Metrics Number of Events, Customer Interrupted
Property Details
Description This analysis shows the average difference between estimated restoration time and restoration time for selected time scale.
Purpose If there is a large difference between the estimated and the actual res-torations times, businesses may need to change their estimation meth-ods.
Representation The line graph shows the average difference between estimated resto-ration time and restoration time, for each month. The X-axis repre-sents the month and year. The Y-axis represents the time in minutes. Hover over the graph for specific values.
Drill Down No drill down
Source Object Restored Job Fact
OBIEE Subject Area NMS - Historical Overview
Metrics Average Difference Between ERT, Restore Time
Property Details
Description This analysis displays the monthly trend in outage events caused due to specific outage causes. It shows whether the number of events are increasing or decreasing over the years.
Purpose This analysis helps the business users to plan the current outage resto-rations to prevent any outages in the future.
Representation The stacked bar graph shows a month-on-month comparison of the number of events occurred due to each outage cause. The X-axis rep-resents the month and year. The Y-axis represents the number of events. Hover over the bars for specific values.
Drill Down No drill down
Property Details
Dashboard Content Reference 1-24Metric Reference Guide

Average Duration by Crew Activities
Duration AnalysisThe Duration Analysis dashboard page provides a detailed analysis of the outage durations.
Estimated Restoration Time Analysis
Source Object Restored Job Fact
OBIEE Subject Area NMS - Historical Overview
Metrics Number of Events
Property Details
Description This analysis shows the average duration (in minutes) of various crew activities for the selected time scale.
Purpose This analysis helps the business users to plan the current outage resto-rations to prevent any outages in the future.
Representation The stacked bar graph displays the average duration taken for each crew activity in the selected month. The X-axis represents the year and month. The Y-axis represents the average duration. Hover over the bars for specific details.
Drill Down No drill down
Source Object Restored Crew Activity Fact
OBIEE Subject Area NMS - Historical Overview
Metrics Arrive to Complete, Dispatch to Arrive, Assign to Dispatch, Call to Assign
Property Details
Property Details
Description This analysis shows the actual restoration time, estimated restoration time, and the difference (variation) for the selected period
Purpose Business users can identify any deviations in restoring the outages within the estimated time and analyze the reasons for the same.
Representation The View By drop down slices the data by crew, crew type, substa-tion, or outage cause dimension attributes.
The table displays the estimated restoration time, actual restoration time, and the difference between actual and estimated restoration times for the selected dimension attribute.
Difference = Estimated (In Minutes) - Actual (In Minutes)
Drill Down No drill down
Source Object Restored Job Fact
Dashboard Content Reference 1-25Metric Reference Guide
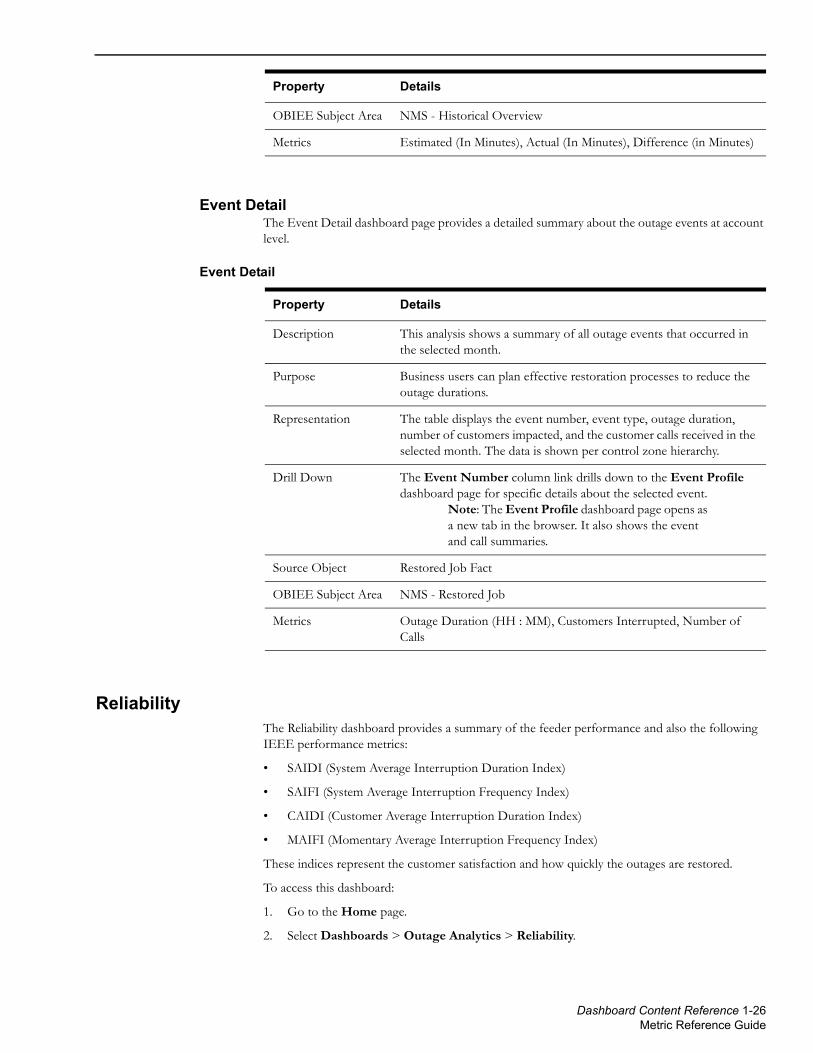
Event DetailThe Event Detail dashboard page provides a detailed summary about the outage events at account level.
Event Detail
ReliabilityThe Reliability dashboard provides a summary of the feeder performance and also the following IEEE performance metrics:
• SAIDI (System Average Interruption Duration Index)
• SAIFI (System Average Interruption Frequency Index)
• CAIDI (Customer Average Interruption Duration Index)
• MAIFI (Momentary Average Interruption Frequency Index)
These indices represent the customer satisfaction and how quickly the outages are restored.
To access this dashboard:
1. Go to the Home page.
2. Select Dashboards > Outage Analytics > Reliability.
OBIEE Subject Area NMS - Historical Overview
Metrics Estimated (In Minutes), Actual (In Minutes), Difference (in Minutes)
Property Details
Property Details
Description This analysis shows a summary of all outage events that occurred in the selected month.
Purpose Business users can plan effective restoration processes to reduce the outage durations.
Representation The table displays the event number, event type, outage duration, number of customers impacted, and the customer calls received in the selected month. The data is shown per control zone hierarchy.
Drill Down The Event Number column link drills down to the Event Profile dashboard page for specific details about the selected event.
Note: The Event Profile dashboard page opens as a new tab in the browser. It also shows the event and call summaries.
Source Object Restored Job Fact
OBIEE Subject Area NMS - Restored Job
Metrics Outage Duration (HH : MM), Customers Interrupted, Number of Calls
Dashboard Content Reference 1-26Metric Reference Guide
The dashboard includes the following dashboard pages. The data for current calendar year and month is displayed by default. You may modify the criteria per requirement.
• Feeder Performance
• Trend
• Reliability by Control Zone
• Reliability
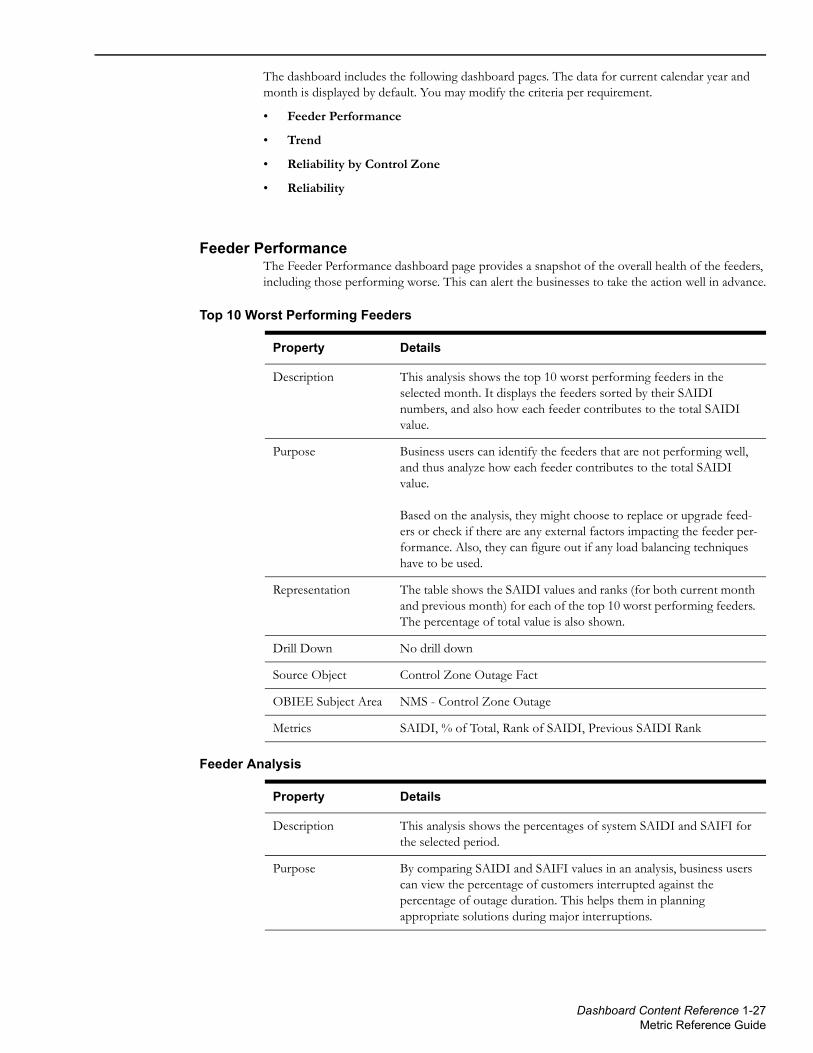
Feeder PerformanceThe Feeder Performance dashboard page provides a snapshot of the overall health of the feeders, including those performing worse. This can alert the businesses to take the action well in advance.
Top 10 Worst Performing Feeders
Feeder Analysis
Property Details
Description This analysis shows the top 10 worst performing feeders in the selected month. It displays the feeders sorted by their SAIDI numbers, and also how each feeder contributes to the total SAIDI value.
Purpose Business users can identify the feeders that are not performing well, and thus analyze how each feeder contributes to the total SAIDI value.
Based on the analysis, they might choose to replace or upgrade feed-ers or check if there are any external factors impacting the feeder per-formance. Also, they can figure out if any load balancing techniques have to be used.
Representation The table shows the SAIDI values and ranks (for both current month and previous month) for each of the top 10 worst performing feeders. The percentage of total value is also shown.
Drill Down No drill down
Source Object Control Zone Outage Fact
OBIEE Subject Area NMS - Control Zone Outage
Metrics SAIDI, % of Total, Rank of SAIDI, Previous SAIDI Rank
Property Details
Description This analysis shows the percentages of system SAIDI and SAIFI for the selected period.
Purpose By comparing SAIDI and SAIFI values in an analysis, business users can view the percentage of customers interrupted against the percentage of outage duration. This helps them in planning appropriate solutions during major interruptions.
Dashboard Content Reference 1-27Metric Reference Guide
Top 10 Worst Feeders Impact on System SAIFI
TrendThe Trend dashboard page provides a snapshot of the SAIDI trends for the selected period.
System Monthly Trend
Representation The scatter graph shows the percentages of SAIDI and SAIFI. The X-axis represents the percentage of system SAIFI. The Y-axis represents the percentage of system SAIDI. Hover over the dots for specific values.
SAIDI = Customer Minutes Interrupted/Number of Customers
SAIFI = Number of Customers Interrupted/Number of Customers
% System SAIFI = SAIFI of a feeder/system SAIFI
% System SAIDI = SAIDI of a feeder/system SAIDI
Drill Down No drill down
Source Object Control Zone Outage Fact
OBIEE Subject Area NMS - Control Zone Outage
Metrics % System SAIFI , % System SAIDI
Property Details
Description This analysis shows the percentage of system SAIFI and cumulative percentage of system SAIFI for the top ten worst performing feeders. The data is displayed for the selected period.
Purpose Business users can focus on those feeders causing adverse impact on the transmission, and thus plan the restoration.
Representation The line graph shows the percentages of system SAIFI for each of the feeders. The X-axis represents the feeder. The Y-axis represents the percentage of SAIFI. Hover over the bars to view specific values.
Drill Down No drill down
Source Object Control Zone Outage Fact
OBIEE Subject Area NMS - Control Zone Outage
Metrics % of System SAIFI, Cumulative % of System SAIFI
Property Details
Property Details
Description This analysis shows the SAIDI trend in the previous 12 months.
Dashboard Content Reference 1-28Metric Reference Guide

Feeder Monthly Trend
System Rolling Year To Date
Purpose The analysis compares the SAIDI values for the current and previous months. Business users can analyze whether the system performance is better or worse than the previous period. Users can thus identify any system issues.
Representation The line graph shows the SAIDI values for each month, along with the average monthly SAIDI. The X-axis represents the month and year. The Y-axis represents the SAIDI values. Hover over the lines for specific details.
Drill Down No drill down
Source Object Control Zone Outage Fact
OBIEE Subject Area NMS - Control Zone Outage
Metrics Monthly SAIDI, Average Monthly SAIDI
Property Details
Description This analysis shows the SAIDI trend for the selected feeder in the previous 12 months.
Purpose The analysis compares the SAIDI values for the current and previous months. Business users can analyze whether the feeder performance is better or worse than the previous period. Users can thus identify any feeder issues.
Representation The Feeder drop down slices the data by various feeders in the sys-tem.
The line graph shows the SAIDI values for each month, along with the average monthly SAIDI, for the selected feeder. The X-axis repre-sents the month and year. The Y-axis represents the SAIDI values. Hover over the lines for specific details.
Drill Down No drill down
Source Object Control Zone Outage Fact
OBIEE Subject Area NMS - Control Zone Outage
Metrics Monthly SAIDI, Average Monthly SAIDI
Property Details
Description This analysis shows the trend of cumulative SAIDI for the year to date (YTD) period. The data is shown from January of the selected year till the selected month.
Purpose The analysis compares the SAIDI values for the current and previous months. Business users can analyze whether the system performance is better or worse than the previous period. Users can thus identify any system issues.
Property Details
Dashboard Content Reference 1-29Metric Reference Guide

Feeder Rolling Year To Date
System Rolling 12 Months
Representation The line graph shows the year to date SAIDI values for each month. The X-axis represents the month and year. The Y-axis represents the SAIDI values. Hover over the lines for specific details.
Drill Down No drill down
Source Object Control Zone Outage Fact
OBIEE Subject Area NMS - Control Zone Outage
Metrics YTD SAIDI
Property Details
Description This analysis shows the trend of cumulative SAIDI for year to date (YTD) period for selected feeder. The data is shown from January of the selected year till the selected month.
Purpose The analysis compares the SAIDI values for the current and previous months. Business users can analyze whether the feeder performance is better or worse than the previous period. Users can thus identify any feeder issues.
Representation The Feeder drop down slices the data by various feeders in the sys-tem.
The line graph shows the year to date SAIDI values for each month. The X-axis represents the month and year. The Y-axis represents the SAIDI values. Hover over the lines for specific details.
Drill Down No drill down
Source Object Control Zone Outage Fact
OBIEE Subject Area NMS - Control Zone Outage
Metrics YTD SAIDI
Property Details
Description This analysis shows the sum of SAIDI for the previous 12 months for each month on the X-axis.
Purpose The analysis compares the SAIDI values over the previous 12 months. Business users can analyze whether the system performance is better or worse than the previous period. Users can thus identify any system issues.
Representation The line graph shows the respective 12-month rolling SAIDI values for each month. The X-axis represents the month and year. The Y-axis represents the SAIDI values. Hover over the lines for specific details.
Drill Down No drill down
Property Details
Dashboard Content Reference 1-30Metric Reference Guide

Feeder Rolling 12 Months
Reliability by Control ZoneThe Reliability by Control Zone dashboard page focuses on the reliability indices calculated for each control zone.
Momentary/Sustained Interruptions
Source Object Control Zone Outage Fact
OBIEE Subject Area NMS - Control Zone Outage
Metrics 12-Month Rolling SAIDI
Property Details
Description This analysis shows the sum of SAIDI for the previous 12 months for each month on the X-axis for the selected feeder.
Purpose The analysis compares the SAIDI values over the previous 12 month. Business users can analyze whether the feeder performance is better or worse than the previous period. Users can thus identify any feeder issues.
Representation The Feeder drop down slices the data by various feeders in the sys-tem.
The line graph shows the respective 12-month rolling SAIDI values for each month. The X-axis represents the month and year. The Y-axis represents the SAIDI values. Hover over the lines for specific details.
Drill Down No drill down
Source Object Control Zone Outage Fact
OBIEE Subject Area NMS - Control Zone Outage
Metrics 12-Month Rolling SAIDI
Property Details
Property Details
Description This analysis shows the feeder performance for momentary interruptions and sustained interruptions occurring for a considerable period in the selected year.
Purpose Business users can analyze the data and identify the customers impacted in a specific control zone.
Representation The first table shows the number of momentary interruptions and the customers impacted in the control zone hierarchy. The second table shows the number of sustained interruptions and the customers impacted in the control zone hierarchy, along with SAIDI, CMI, SAIFI, and CAIDI values. The data is shown for the selected month.
Dashboard Content Reference 1-31Metric Reference Guide

Substation Interruption Events
Feeder Interruption Events
Drill Down No drill down
Source Object Control Zone Outage Fact
OBIEE Subject Area NMS - Control Zone Outage
Metrics MAIFI, Number of Momentary Interruptions, Number of Customer Served, SAIDI, SAIFI, ASAI, CMI, CAIDI
Property Details
Description This analysis shows the interruptions occurring at the substations for a considerable period in the selected year.
Purpose Business users can identify the substations where more number of outages are occurring.
Representation The stacked bar graph shows the momentary and sustained interrup-tions in each of the substations. The X-axis represents the substations. The Y-axis represents the outage events. Hover over the bars for spe-cific details.
Drill Down The labels on the X-axis of the stacked bar graph have the master-detail interaction with the Feeder Interruption Events analysis on the same dashboard page.
Clicking on a specific substation label refreshes the Feeder Interrup-tion Events to show the data for the specific substation.
Source Object Control Zone Outage Fact
OBIEE Subject Area NMS - Control Zone Outage
Metrics Sustained Interruptions, Momentary Interruptions
Property Details
Description This analysis shows the interruptions occurring at the feeders for a considerable period in the selected year.
Purpose Business users can identify the substations where more number of outages are occurring.
Representation The stacked bar graph shows the momentary and sustained interrup-tions in each of the substations. The X-axis represents the substations. The Y-axis represents the outage events. Hover over the bars for spe-cific details.
Drill Down The labels on the X-axis of the stacked bar graph have the master-detail interaction with the Feeder Interruption Events analysis on the same dashboard page.
Clicking on a specific substation label refreshes the Feeder Interrup-tion Events to show the data for the specific substation.
Property Details
Dashboard Content Reference 1-32Metric Reference Guide

ReliabilityThe Reliability dashboard page provides a summary of the reliability indices calculated for each city and control zone.
Reliability by City
Source Object Control Zone Outage Fact
OBIEE Subject Area NMS - Control Zone Outage
Metrics Sustained Interruptions, Momentary Interruptions
Property Details
Property Details
Description This analysis provides a spatial representation of the customers interrupted in a specific region. It displays the reliability indices calculated for each city in the selected month.
Purpose Business users can identify improvements on reliability for the lowest cost.
Representation The color-coded region on the map shows the customers interrupted in that region. The table displays the number of customers inter-rupted in each city, along with the respective SAIDI, CMI, CAIDI, and SAIFI indices.
Drill Down No drill down
Source Object City Outage Fact
OBIEE Subject Area NMS - City Outage
Metrics Customers Interrupted, SAIDI, CAIDI, CMI
Dashboard Content Reference 1-33Metric Reference Guide

Distribution AnalyticsThis section describes the metrics available in Distribution Analytics of Oracle Utilities Analytics Dashboards. The analytics enable the Utilities' customers to monitor and measure network distribution.
The analytics mainly focus on feeder functionality. Based on certain feeder values (such as its length, capacity, etc), users can calculate the power actually distributed.
Oracle Utilities Analytics Dashboards for Oracle Utilities Network Management System provides Distribution Analytics content in the Distribution dashboard.
DistributionThe Distribution dashboard provides various analytics about feeders and their performance.
To access this dashboard:
1. Go to the Home page.
2. Select Dashboards > Distribution Analytics > Distribution.
The dashboard includes the following dashboard pages. The data for current calendar year and previous month is displayed by default. You may modify the criteria per requirement.
• Feeder Load (Composite)
• Feeder Performance
Feeder Load (Composite)The Feeder Load (Composite) dashboard page focuses on the feeder load statistics in the Oracle Utilities Network Management System model.
Feeder Load
Property Details
Description This analysis shows the average feeder load, on a monthly basis, for the previous 15 months. The load is measured in kilovolt-ampere (kVA).
Purpose Business users can analyze if the feeder is handling the load as per its capacity or it is being overloaded.
Representation The line graph shows the average feeder load for the previous 15 months. Hover over the line for specific details. The X-axis denotes the calendar month. The Y-axis denotes the average feeder load in kVA. Use the graph to view the low-level details of the feeder load.
Drill Down No drill down
Source Object Feeder Delivered Load Snapshot Fact
OBIEE Subject Area DMS - Feeder Delivered Load Snapshot
Metrics Average kVA, kw, kVAr, Amp, Voltage
Dashboard Content Reference 1-34Metric Reference Guide

Feeder Load Detail
Greatest Feeder Peak Load Detail
Smallest Feeder Capacity Margin
Property Details
Description This analysis displays the maximum daily feeder load details for the selected month. The details include feeder information and maximum load that can be carried by the feeder in terms of amperes, voltage, etc.
Purpose Business users can analyze the data and observe or monitor the peaks in the feeder load for the selected month. Any deviations in the load will impact the network distribution.
Representation The table shows the name of the feeder, manufacturing company of the feeder, and load details for the selected month.
Drill Down No drill down
Source Object Feeder Delivered Load Snapshot Fact
OBIEE Subject Area DMS - Feeder Delivered Load Snapshot
Metrics Maximum kVA, Maximum kw, Maximum kVAr, Maximum Amp, Maximum Voltage
Property Details
Description This analysis shows the feeders that experienced the maximum peak load (in kVA) in the selected month. It also shows where the heaviest load exists within the distribution network.
Purpose The feeders are ranked based on the load each one of them experi-enced in the selected month. Business users can monitor such feeders closely to ensure that the overload conditions do not occur. Overload might cause breakdown leading to outages.
Representation The table shows the maximum load for each of the feeder and also the ranking.
Drill Down No drill down
Source Object Feeder Delivered Load Snapshot Fact
OBIEE Subject Area DMS - Feeder Delivered Load Snapshot
Metrics Maximum kVA
Property Details
Description “Breaker capacity” is the margin before which an overload may occur.
This analysis displays the breaker capacity for each feeder that helps to determine the feeders having the smallest remaining margin before overloads may occur, possibly resulting in a breaker lock out.
Dashboard Content Reference 1-35Metric Reference Guide

Feeder PerformanceThe Feeder Performance dashboard page provides a snapshot of the overall health of feeders, such as worst performing feeders. It also compares the feeder performance with that of the previous period, along with the number of interruptions and customers impacted. This can alert the businesses to take preventive action in advance.
Feeder Performance
Top 10 Worst Performing Feeders
Purpose Business users can identify the feeders with lowest margin and take necessary measures to set an even distribution amongst the feeders.
Representation The table shows the maximum amplitude, maximum breaker amp limit, and the capacity margin for the respective feeder.
Capacity Margin = (Maximum Breaker Amp Limit - Maximum Amp)
Drill Down No drill down
Source Object Feeder Delivered Load Snapshot Fact
OBIEE Subject Area DMS - Feeder Delivered Load Snapshot
Metrics Capacity Margin, Maximum Amp, Maximum Breaker Amp Limit
Property Details
Property Details
Description This analysis displays the reliability indices for company, region, branch, substation, and feeder level, along with the number of cus-tomers served per control zone. The data is displayed for the selected calendar year.
Purpose Business users can verify the reliability indices to state the effective-ness of feeders. Users can identify the impact of outages in a specific year and control zone.
Representation The table shows the number of sustained interruptions, number of momentary interruptions, number of customers served, and the rela-tive reliability indices, for the selected calendar year.
Drill Down No drill down
Source Object Control Zone Outage Fact
OBIEE Subject Area NMS - Control Zone Outage
Metrics SAIDI, SAIFI, CMI, CAIDI, MAIFI, Number of Sustained Interrup-tions, Number of Customer Served
Property Details
Description This analysis displays the top 10 worst performing feeders in the selected month, sorted by their SAIDI numbers.
Dashboard Content Reference 1-36Metric Reference Guide
Top 10 Consecutive Worst Performing Feeders
Purpose Business users can identify the feeders that are not performing well, and thus analyze how each feeder contributes to the total SAIDI value.
Based on the analysis, they might choose to replace or upgrade feed-ers or check if there are any external factors impacting the feeder per-formance. Also, they can figure out if any load balancing techniques have to be used.
Representation The table shows the SAIDI values for each of the feeders and their corresponding SAIDI rank. The previous SAIDI rank is also shown to compare the performance in the current month and the previous month. It also shows the percentage of total SAIDI for each of the feeders.
% of Total = (SAIDI * 100) / Total SAIDI
The pie chart shows the share of each feeder in total SAIDI.
Drill Down No drill down
Source Object Control Zone Outage Fact
OBIEE Subject Area NMS - Control Zone Outage
Metrics SAIDI, SAIFI, CMI, CAIDI, MAIFI, Number of Sustained Interrup-tions, Number of Customer Served
Property Details
Description Sometimes, feeders tend to under perform due to environmental fac-tors, overload, or outdated hardware issues.
This analysis displays the top 10 feeders that are consecutively per-forming badly. The data is shown for the selected month.
Purpose Feeders that consecutively perform worse might need more attention. Any degrade in the performance might need necessary measures.
Representation The table shows the SAIDI values and the respective SAIDI ranks for each of the top 10 worst performing feeders in the selected and previ-ous months. It also shows the percentage of total SAIDI for each of the feeders.
% of Total = (SAIDI * 100) / Total SAIDI
The Rank text box displays selected ranks in the report.
Drill Down No drill down
Source Object Control Zone Outage Fact
OBIEE Subject Area NMS - Control Zone Outage
Property Details
Dashboard Content Reference 1-37Metric Reference Guide

Metrics SAIDI, % of Total, Rank of SAIDI, Previous SAIDI Rank, Previous SAIDI
Property Details
Dashboard Content Reference 1-38Metric Reference Guide