oracle obiee 12c tuning guide - v1-2016!02!12
Post on 12-Jul-2016
391 views
DESCRIPTION
Oracle OBIEE 12c Tuning GuideTRANSCRIPT
1
Disclaimer:
All tuning information stated in this guide is for orientation only. Tuning is an iterative
process, every modification has to be tested and its impact should be monitored and
analyzed.
Before implementing any of the tuning settings, it is recommended to carry out end to
end performance testing that will also include to obtain baseline performance data for
the default configurations, make incremental changes to the tuning settings and then
collect performance data. Otherwise it may worsen the system performance.
Best Practices Guide for Infrastructure Tuning
Oracle® Business Intelligence Enterprise Edition
12c (12.2.1)
An Oracle® White Paper
February 2016
2
TABLE OF CONTENTS
INTRODUCTION ................................................................................................................................ 3
1.0 PERFORMANCE OVERVIEW ................................................................................................ 3
1.1 INTRODUCTION TO ORACLE® BUSINESS INTELLIGENCE EE PERFORMANCE....................... 3 1.2 PERFORMANCE TERMINOLOGY ............................................................................................ 3 1.3 UNDERSTANDING KEY PERFORMANCE DRIVERS ................................................................. 4
2.0 TOP TUNING RECOMMENDATIONS FOR OBIEE ........................................................... 5
2.1 TUNE OPERATING SYSTEMS PARAMETERS ............................................................................... 6 2.1.1 Linux Tuning Parameters ................................................................................................ 6 2.1.2 Windows Server 2012 Tuning Parameters ...................................................................... 7 2.1.3 AIX Tuning Parameters .................................................................................................. 8 2.1.4 Oracle® Sun Solaris Tuning Parameters ...................................................................... 10
2.2 TUNE ORACLE® WEBLOGIC SERVER (WLS) PARAMETERS ................................................... 12 2.3 TUNE 64BIT JAVA VIRTUAL MACHINES (JVM) ...................................................................... 18
2.3.1 Tuning 64bit Oracle® JVM ........................................................................................... 18 2.4 TUNE HTTP SERVER PARAMETERS ........................................................................................ 20
2.4.1 IIS 7.5 / 8.5 HTTP Server Tuning ................................................................................. 20 2.4.2 Oracle® HTTP Server (OHS) Tuning .......................................................................... 22
2.5 TUNE HTTP SERVER COMPRESSION / CACHING ..................................................................... 23 2.5.1 Oracle® HTTP Server (OHS) ....................................................................................... 24 2.5.2 IIS 7.5 / 8.5 HTTP Server .............................................................................................. 26 2.5.3 Apache 2.2.x HTTP Server ............................................................................................ 28 2.5.4 Oracle® iPlanet HTTP Server ....................................................................................... 29
2.6 TUNE WEB BROWSER SETTINGS ............................................................................................. 30 2.7 TUNE DATABASE PARAMETERS .............................................................................................. 30
3.0 PERFORMANCE MONITORING AND TESTING OBIEE ............................................... 31
3.1 BUILT-IN BI METRICS FOR PERFORMANCE MONITORING ...................................................... 31 3.2 DIAGNOSING AND RESOLVING ISSUES IN ORACLE BUSINESS INTELLIGENCE ........................ 34 3.3 PERFORMANCE TESTING ORACLE BUSINESS INTELLIGENCE ENTERPRISE EDITION .............. 34 3.4 HOW TO ANALYZE HOST METRICS ......................................................................................... 35
4.0 TUNING OBIEE COMPONENTS .......................................................................................... 38
4.1 ORACLE® BI PRESENTATION SERVICES COMPONENT ........................................................... 39 4.2 ORACLE® BI SERVER COMPONENT ........................................................................................ 42 4.3 ORACLE® JAVAHOST COMPONENT ........................................................................................ 48 4.4 ORACLE® BI SCHEDULERS COMPONENT ............................................................................... 50 4.5 VERTICALLY SCALE PRESENTATION SERVICES / JAVAHOST / BISERVER COMPONENTS ...... 51 4.6 CONFIGURE THE EXTERNAL SUBJECT AREA (XSA) CACHE FOR DATA BLENDING| MASHUP51
5.0 TUNING ORACLE® ESSBASE ............................................................................................. 52
5.1 ESSBASE AGGREGATE STORAGE (ASO) TUNING ................................................................... 52
3
INTRODUCTION This document is written for people who monitor performance and tune the
components in a BI environment. It is assumed that readers know server
administration, Oracle® Fusion Middleware (FMW), hardware performance tuning
fundamentals, web servers, java application servers and database.
1.0 PERFORMANCE OVERVIEW This chapter discusses performance and tuning concepts for Oracle® Business
Intelligence Enterprise Edition. This chapter contains the following sections:
1.1 Introduction to Oracle® Business Intelligence EE System Performance
1.2 Performance Terminology
1.3 Understanding Key Performance Drivers
1.1 Introduction to Oracle® Business Intelligence EE Performance To maximize Oracle® Business Intelligence Enterprise Edition performance, you
need to monitor, analyze, and tune all the Fusion Middleware / BI components. This
guide describes the tools that you can use to monitor performance and the
techniques for optimizing the performance of Oracle® Business Intelligence
Enterprise Edition components.
1.2 Performance Terminology This guide uses the following performance terminologies:
Scalability
o System's ability to perform within specification under increasing
user load, data load and hardware expansion.
Latency
o Time between the issuing of a request and the time when the work
actually begins on the request.
Think time
o The time a real user pauses to think between actions.
Resource utilization
o A consumption metric, for example, the percent of CPU usage.
Response time
o A time metric, for example round-trip time it takes the server to
deliver a Web page.
4
Throughput
o A rate metric (requests per unit of time), for example, requests per
second, bits per second. For example, if an application can handle
20 customer requests simultaneously and each request takes one
second to process, this site has a potential throughput of 20
requests per second.
1.3 Understanding Key Performance Drivers To optimize your deployment, you must understand the elements that influence
performance and scalability. A factor that dictates performance is called a key
performance driver. Knowing how the drivers behave in combination further
enhances your ability to deploy Oracle® Business Intelligence Enterprise Edition
optimally, based on the unique requirements of each deployment.
- Hardware Capacity - Factors such as number of servers, quantity and speed
of processors, available RAM, network speed etc.
- Technical Platforms Tuning – Fine tuning other third party software
required for installing and running Oracle® Business Intelligence Enterprise
Edition product; for example: relational databases, Java application servers,
Web servers, Server / Client Operating System and browsers.
- Business Application Design - Application design is an important factor in
OBIEE system performance i.e. structure, size, and use of product / custom
features in designing reports and dashboards etc.
- Business process usage - Activities carried out by users in the normal flow of
your business cycle.
o Business process usage has three components:
User activity—Activities available to users for reporting and
analysis.
Rate of user activity – A number of transactions executed by one
user per one hour.
User concurrency—Number of users for each activity being carried
out simultaneously.
5
2.0 TOP TUNING RECOMMENDATIONS FOR OBIEE Performance tuning Oracle® Business Intelligence Enterprise Edition is a complex
iterative process, care needs to be taken to have appropriate backups, proceed
incrementally and thoroughly test with each incremental change.
To get you started, we have created a list of recommendations to help you optimize
your Oracle® Business Intelligence Enterprise Edition performance.
This chapter includes the following sections that provide a quick start for
performance tuning Oracle® Business Intelligence Enterprise Edition infrastructure.
2.1 Tune Operating Systems parameters.
2.2 Tune Oracle® WebLogic Server (WLS) parameters.
2.3 Tune 64bit Java Virtual Machines (JVM).
2.4 Tune HTTP Server parameters.
2.5 Tune HTTP Server Compression / Caching.
2.6 Tune Web Browser Settings.
2.7 Tune Database Parameters.
Note: While the list in each of the above stated section is a useful tool in starting
your performance tuning, it is not meant to be comprehensive list of areas to tune.
You must monitor and track specific performance issues within your Business
Intelligence Enterprise Edition dashboards / reports design to understand where
tuning can improve performance.
6
2.1 Tune Operating Systems parameters Proper OS tuning might improves system performance by preventing the occurrence
of error conditions. Operating system error conditions always degrade performance.
The following sections describe issues related to operating system performance:
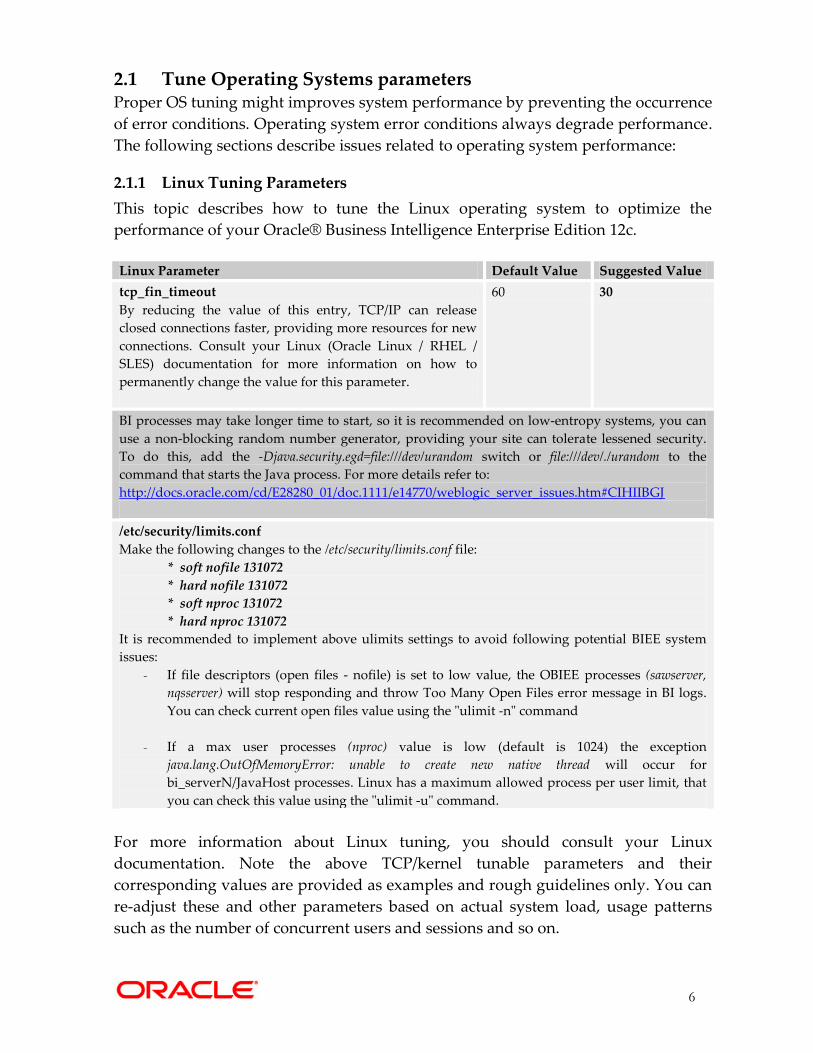
2.1.1 Linux Tuning Parameters
This topic describes how to tune the Linux operating system to optimize the
performance of your Oracle® Business Intelligence Enterprise Edition 12c.
Linux Parameter Default Value Suggested Value
tcp_fin_timeout
By reducing the value of this entry, TCP/IP can release
closed connections faster, providing more resources for new
connections. Consult your Linux (Oracle Linux / RHEL /
SLES) documentation for more information on how to
permanently change the value for this parameter.
60 30
BI processes may take longer time to start, so it is recommended on low-entropy systems, you can
use a non-blocking random number generator, providing your site can tolerate lessened security.
To do this, add the -Djava.security.egd=file:///dev/urandom switch or file:///dev/./urandom to the
command that starts the Java process. For more details refer to:
http://docs.oracle.com/cd/E28280_01/doc.1111/e14770/weblogic_server_issues.htm#CIHIIBGJ
/etc/security/limits.conf
Make the following changes to the /etc/security/limits.conf file:
* soft nofile 131072
* hard nofile 131072
* soft nproc 131072
* hard nproc 131072
It is recommended to implement above ulimits settings to avoid following potential BIEE system
issues:
- If file descriptors (open files - nofile) is set to low value, the OBIEE processes (sawserver,
nqsserver) will stop responding and throw Too Many Open Files error message in BI logs.
You can check current open files value using the "ulimit -n" command
- If a max user processes (nproc) value is low (default is 1024) the exception
java.lang.OutOfMemoryError: unable to create new native thread will occur for
bi_serverN/JavaHost processes. Linux has a maximum allowed process per user limit, that
you can check this value using the "ulimit -u" command.
For more information about Linux tuning, you should consult your Linux
documentation. Note the above TCP/kernel tunable parameters and their
corresponding values are provided as examples and rough guidelines only. You can
re-adjust these and other parameters based on actual system load, usage patterns
such as the number of concurrent users and sessions and so on.
7
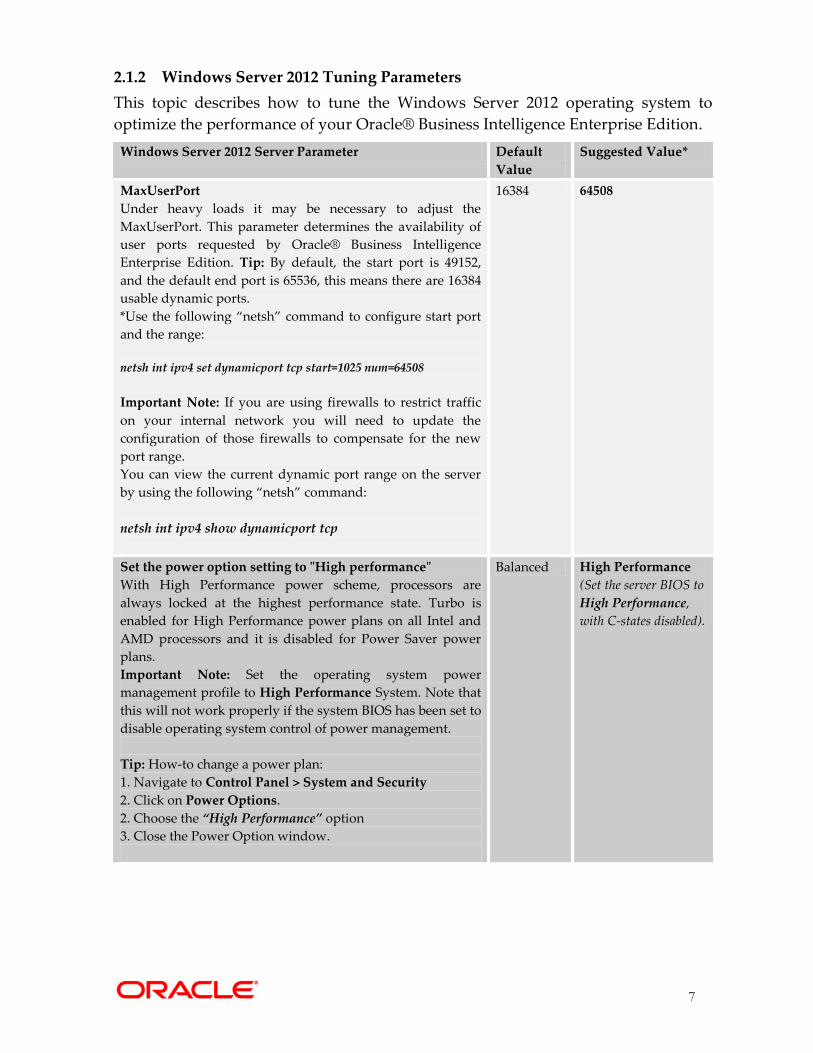
2.1.2 Windows Server 2012 Tuning Parameters
This topic describes how to tune the Windows Server 2012 operating system to
optimize the performance of your Oracle® Business Intelligence Enterprise Edition.
Windows Server 2012 Server Parameter Default
Value
Suggested Value*
MaxUserPort
Under heavy loads it may be necessary to adjust the
MaxUserPort. This parameter determines the availability of
user ports requested by Oracle® Business Intelligence
Enterprise Edition. Tip: By default, the start port is 49152,
and the default end port is 65536, this means there are 16384
usable dynamic ports.
*Use the following “netsh” command to configure start port
and the range:
netsh int ipv4 set dynamicport tcp start=1025 num=64508
Important Note: If you are using firewalls to restrict traffic
on your internal network you will need to update the
configuration of those firewalls to compensate for the new
port range.
You can view the current dynamic port range on the server
by using the following “netsh” command:
netsh int ipv4 show dynamicport tcp
16384 64508
Set the power option setting to "High performance"
With High Performance power scheme, processors are
always locked at the highest performance state. Turbo is
enabled for High Performance power plans on all Intel and
AMD processors and it is disabled for Power Saver power
plans.
Important Note: Set the operating system power
management profile to High Performance System. Note that
this will not work properly if the system BIOS has been set to
disable operating system control of power management.
Tip: How-to change a power plan:
1. Navigate to Control Panel > System and Security
2. Click on Power Options.
2. Choose the “High Performance” option
3. Close the Power Option window.
Balanced High Performance
(Set the server BIOS to
High Performance,
with C-states disabled).
8
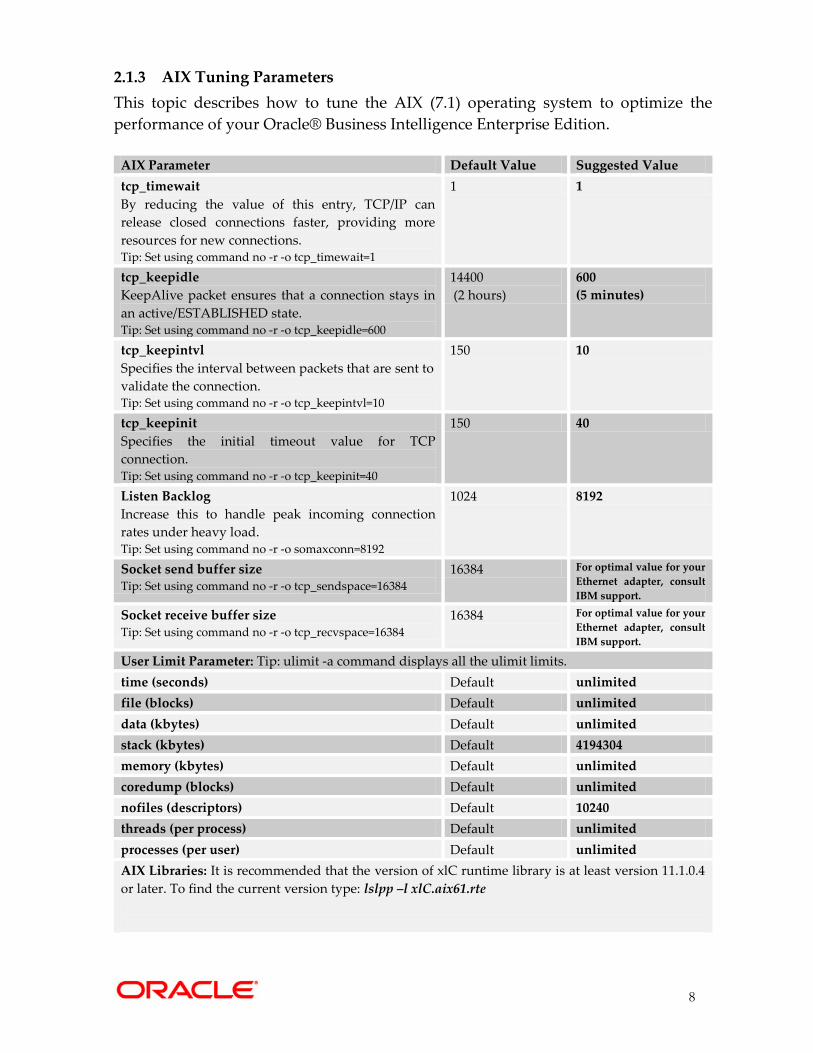
2.1.3 AIX Tuning Parameters
This topic describes how to tune the AIX (7.1) operating system to optimize the
performance of your Oracle® Business Intelligence Enterprise Edition.
AIX Parameter Default Value Suggested Value
tcp_timewait
By reducing the value of this entry, TCP/IP can
release closed connections faster, providing more
resources for new connections. Tip: Set using command no -r -o tcp_timewait=1
1 1
tcp_keepidle
KeepAlive packet ensures that a connection stays in
an active/ESTABLISHED state. Tip: Set using command no -r -o tcp_keepidle=600
14400
(2 hours)
600
(5 minutes)
tcp_keepintvl
Specifies the interval between packets that are sent to
validate the connection. Tip: Set using command no -r -o tcp_keepintvl=10
150 10
tcp_keepinit
Specifies the initial timeout value for TCP
connection. Tip: Set using command no -r -o tcp_keepinit=40
150 40
Listen Backlog
Increase this to handle peak incoming connection
rates under heavy load. Tip: Set using command no -r -o somaxconn=8192
1024 8192
Socket send buffer size Tip: Set using command no -r -o tcp_sendspace=16384
16384 For optimal value for your
Ethernet adapter, consult
IBM support.
Socket receive buffer size Tip: Set using command no -r -o tcp_recvspace=16384
16384
For optimal value for your
Ethernet adapter, consult
IBM support.
User Limit Parameter: Tip: ulimit -a command displays all the ulimit limits.
time (seconds) Default unlimited
file (blocks) Default unlimited
data (kbytes) Default unlimited
stack (kbytes) Default 4194304
memory (kbytes) Default unlimited
coredump (blocks) Default unlimited
nofiles (descriptors) Default 10240
threads (per process) Default unlimited
processes (per user) Default unlimited
AIX Libraries: It is recommended that the version of xlC runtime library is at least version 11.1.0.4
or later. To find the current version type: lslpp –l xlC.aix61.rte
9
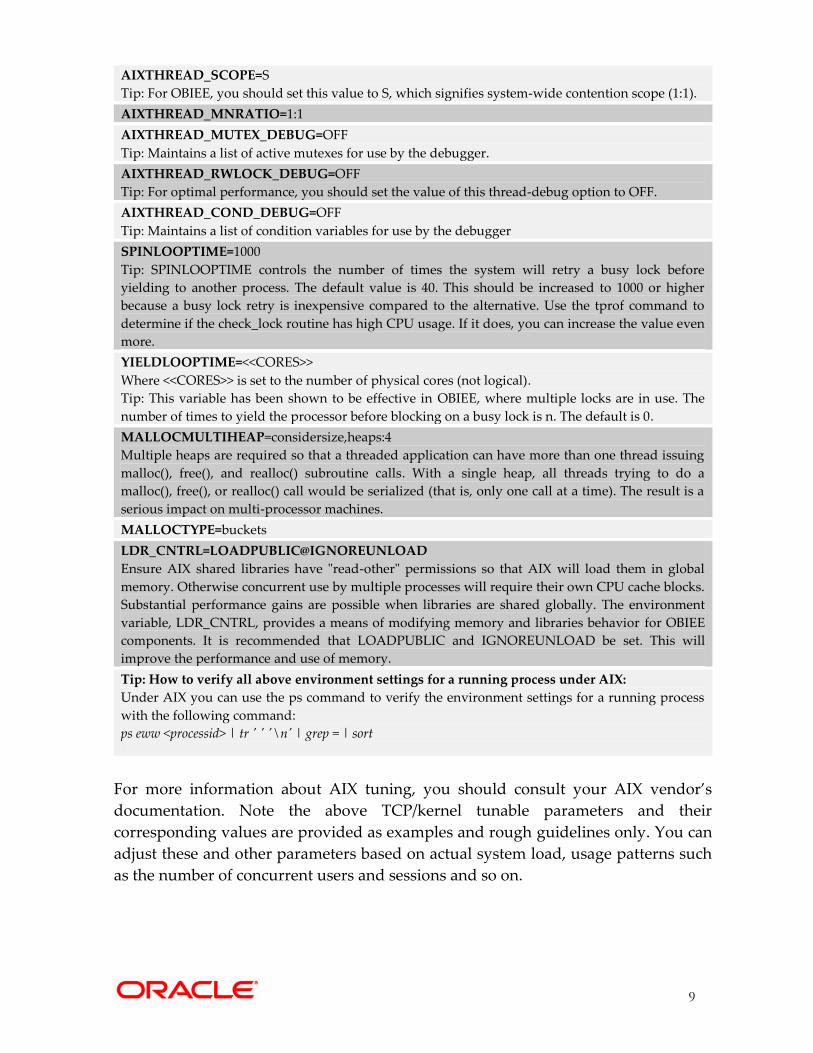
AIXTHREAD_SCOPE=S
Tip: For OBIEE, you should set this value to S, which signifies system-wide contention scope (1:1).
AIXTHREAD_MNRATIO=1:1
AIXTHREAD_MUTEX_DEBUG=OFF
Tip: Maintains a list of active mutexes for use by the debugger.
AIXTHREAD_RWLOCK_DEBUG=OFF
Tip: For optimal performance, you should set the value of this thread-debug option to OFF.
AIXTHREAD_COND_DEBUG=OFF
Tip: Maintains a list of condition variables for use by the debugger
SPINLOOPTIME=1000
Tip: SPINLOOPTIME controls the number of times the system will retry a busy lock before
yielding to another process. The default value is 40. This should be increased to 1000 or higher
because a busy lock retry is inexpensive compared to the alternative. Use the tprof command to
determine if the check_lock routine has high CPU usage. If it does, you can increase the value even
more.
YIELDLOOPTIME=<<CORES>>
Where <<CORES>> is set to the number of physical cores (not logical).
Tip: This variable has been shown to be effective in OBIEE, where multiple locks are in use. The
number of times to yield the processor before blocking on a busy lock is n. The default is 0.
MALLOCMULTIHEAP=considersize,heaps:4
Multiple heaps are required so that a threaded application can have more than one thread issuing
malloc(), free(), and realloc() subroutine calls. With a single heap, all threads trying to do a
malloc(), free(), or realloc() call would be serialized (that is, only one call at a time). The result is a
serious impact on multi-processor machines.
MALLOCTYPE=buckets
LDR_CNTRL=LOADPUBLIC@IGNOREUNLOAD
Ensure AIX shared libraries have "read-other" permissions so that AIX will load them in global
memory. Otherwise concurrent use by multiple processes will require their own CPU cache blocks.
Substantial performance gains are possible when libraries are shared globally. The environment
variable, LDR_CNTRL, provides a means of modifying memory and libraries behavior for OBIEE
components. It is recommended that LOADPUBLIC and IGNOREUNLOAD be set. This will
improve the performance and use of memory.
Tip: How to verify all above environment settings for a running process under AIX:
Under AIX you can use the ps command to verify the environment settings for a running process
with the following command:
ps eww <processid> | tr ' ' '\n' | grep = | sort
For more information about AIX tuning, you should consult your AIX vendor’s
documentation. Note the above TCP/kernel tunable parameters and their
corresponding values are provided as examples and rough guidelines only. You can
adjust these and other parameters based on actual system load, usage patterns such
as the number of concurrent users and sessions and so on.
10
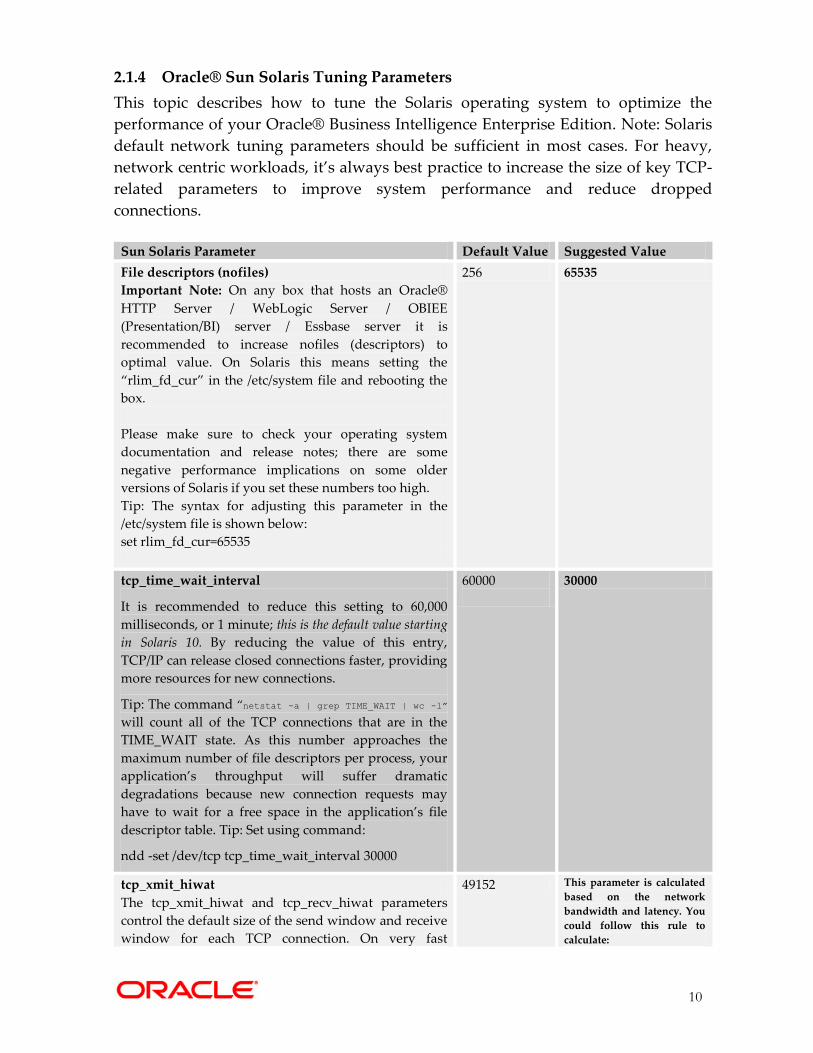
2.1.4 Oracle® Sun Solaris Tuning Parameters
This topic describes how to tune the Solaris operating system to optimize the
performance of your Oracle® Business Intelligence Enterprise Edition. Note: Solaris
default network tuning parameters should be sufficient in most cases. For heavy,
network centric workloads, it’s always best practice to increase the size of key TCP-
related parameters to improve system performance and reduce dropped
connections.
Sun Solaris Parameter Default Value Suggested Value
File descriptors (nofiles)
Important Note: On any box that hosts an Oracle®
HTTP Server / WebLogic Server / OBIEE
(Presentation/BI) server / Essbase server it is
recommended to increase nofiles (descriptors) to
optimal value. On Solaris this means setting the
“rlim_fd_cur” in the /etc/system file and rebooting the
box.
Please make sure to check your operating system
documentation and release notes; there are some
negative performance implications on some older
versions of Solaris if you set these numbers too high.
Tip: The syntax for adjusting this parameter in the
/etc/system file is shown below:
set rlim_fd_cur=65535
256 65535
tcp_time_wait_interval
It is recommended to reduce this setting to 60,000
milliseconds, or 1 minute; this is the default value starting
in Solaris 10. By reducing the value of this entry,
TCP/IP can release closed connections faster, providing
more resources for new connections.
Tip: The command “netstat -a | grep TIME_WAIT | wc -l”
will count all of the TCP connections that are in the
TIME_WAIT state. As this number approaches the
maximum number of file descriptors per process, your
application’s throughput will suffer dramatic
degradations because new connection requests may
have to wait for a free space in the application’s file
descriptor table. Tip: Set using command:
ndd -set /dev/tcp tcp_time_wait_interval 30000
60000
30000
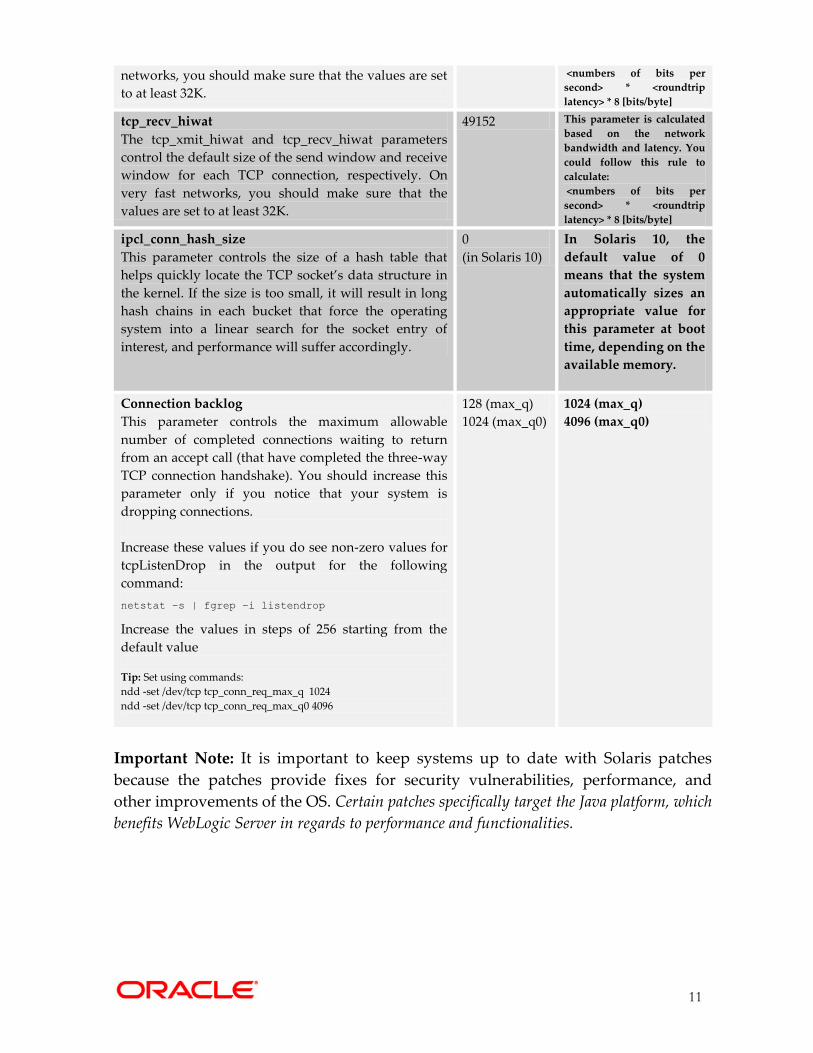
tcp_xmit_hiwat
The tcp_xmit_hiwat and tcp_recv_hiwat parameters
control the default size of the send window and receive
window for each TCP connection. On very fast
49152 This parameter is calculated
based on the network
bandwidth and latency. You
could follow this rule to
calculate:
11
networks, you should make sure that the values are set
to at least 32K.
<numbers of bits per
second> * <roundtrip
latency> * 8 [bits/byte]
tcp_recv_hiwat
The tcp_xmit_hiwat and tcp_recv_hiwat parameters
control the default size of the send window and receive
window for each TCP connection, respectively. On
very fast networks, you should make sure that the
values are set to at least 32K.
49152 This parameter is calculated
based on the network
bandwidth and latency. You
could follow this rule to
calculate:
<numbers of bits per
second> * <roundtrip
latency> * 8 [bits/byte]
ipcl_conn_hash_size
This parameter controls the size of a hash table that
helps quickly locate the TCP socket’s data structure in
the kernel. If the size is too small, it will result in long
hash chains in each bucket that force the operating
system into a linear search for the socket entry of
interest, and performance will suffer accordingly.
0
(in Solaris 10)
In Solaris 10, the
default value of 0
means that the system
automatically sizes an
appropriate value for
this parameter at boot
time, depending on the
available memory.
Connection backlog
This parameter controls the maximum allowable
number of completed connections waiting to return
from an accept call (that have completed the three-way
TCP connection handshake). You should increase this
parameter only if you notice that your system is
dropping connections.
Increase these values if you do see non-zero values for
tcpListenDrop in the output for the following
command:
netstat –s | fgrep –i listendrop
Increase the values in steps of 256 starting from the
default value
Tip: Set using commands:
ndd -set /dev/tcp tcp_conn_req_max_q 1024
ndd -set /dev/tcp tcp_conn_req_max_q0 4096
128 (max_q)
1024 (max_q0)
1024 (max_q)
4096 (max_q0)
Important Note: It is important to keep systems up to date with Solaris patches
because the patches provide fixes for security vulnerabilities, performance, and
other improvements of the OS. Certain patches specifically target the Java platform, which
benefits WebLogic Server in regards to performance and functionalities.
12
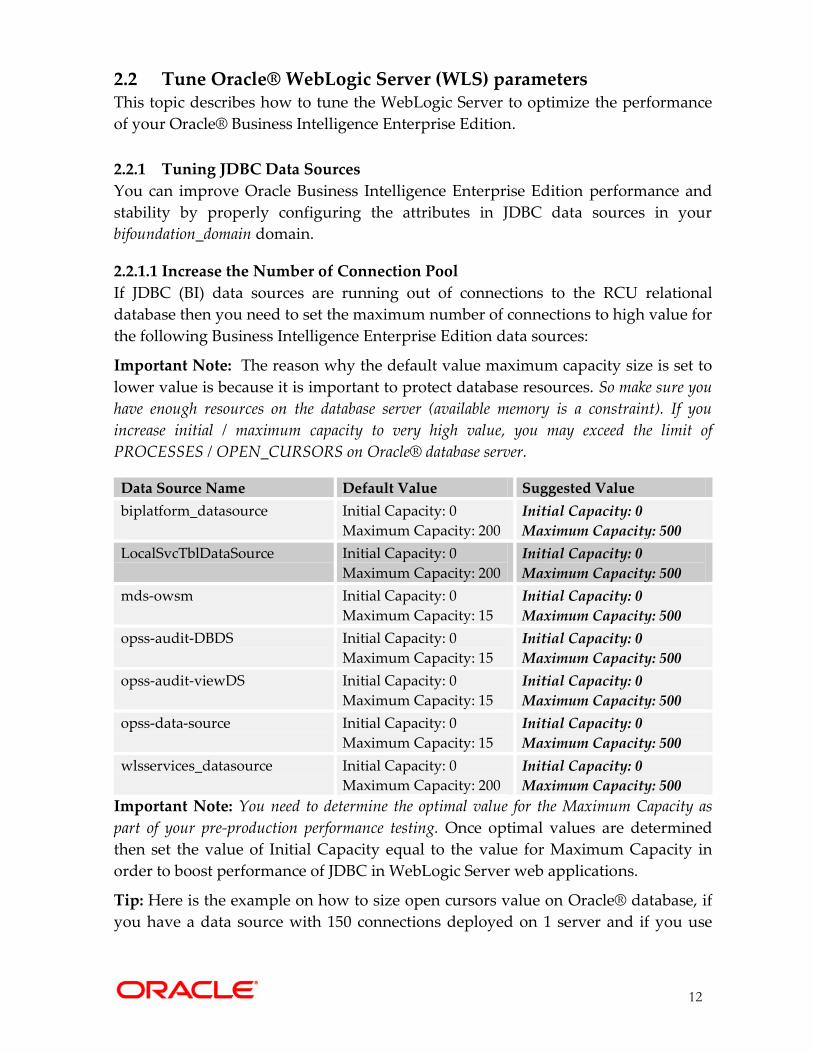
2.2 Tune Oracle® WebLogic Server (WLS) parameters This topic describes how to tune the WebLogic Server to optimize the performance
of your Oracle® Business Intelligence Enterprise Edition.
2.2.1 Tuning JDBC Data Sources
You can improve Oracle Business Intelligence Enterprise Edition performance and
stability by properly configuring the attributes in JDBC data sources in your
bifoundation_domain domain.
2.2.1.1 Increase the Number of Connection Pool
If JDBC (BI) data sources are running out of connections to the RCU relational
database then you need to set the maximum number of connections to high value for
the following Business Intelligence Enterprise Edition data sources:
Important Note: The reason why the default value maximum capacity size is set to
lower value is because it is important to protect database resources. So make sure you
have enough resources on the database server (available memory is a constraint). If you
increase initial / maximum capacity to very high value, you may exceed the limit of
PROCESSES / OPEN_CURSORS on Oracle® database server.
Data Source Name Default Value Suggested Value
biplatform_datasource Initial Capacity: 0
Maximum Capacity: 200
Initial Capacity: 0
Maximum Capacity: 500
LocalSvcTblDataSource Initial Capacity: 0
Maximum Capacity: 200
Initial Capacity: 0
Maximum Capacity: 500
mds-owsm Initial Capacity: 0
Maximum Capacity: 15
Initial Capacity: 0
Maximum Capacity: 500
opss-audit-DBDS Initial Capacity: 0
Maximum Capacity: 15
Initial Capacity: 0
Maximum Capacity: 500
opss-audit-viewDS Initial Capacity: 0
Maximum Capacity: 15
Initial Capacity: 0
Maximum Capacity: 500
opss-data-source Initial Capacity: 0
Maximum Capacity: 15
Initial Capacity: 0
Maximum Capacity: 500
wlsservices_datasource Initial Capacity: 0
Maximum Capacity: 200
Initial Capacity: 0
Maximum Capacity: 500
Important Note: You need to determine the optimal value for the Maximum Capacity as
part of your pre-production performance testing. Once optimal values are determined
then set the value of Initial Capacity equal to the value for Maximum Capacity in
order to boost performance of JDBC in WebLogic Server web applications.
Tip: Here is the example on how to size open cursors value on Oracle® database, if
you have a data source with 150 connections deployed on 1 server and if you use
13
default Statement Cache Size 10, you may open 1500 (150 x 1 x 10) cursors on your
database server for the cached statements.
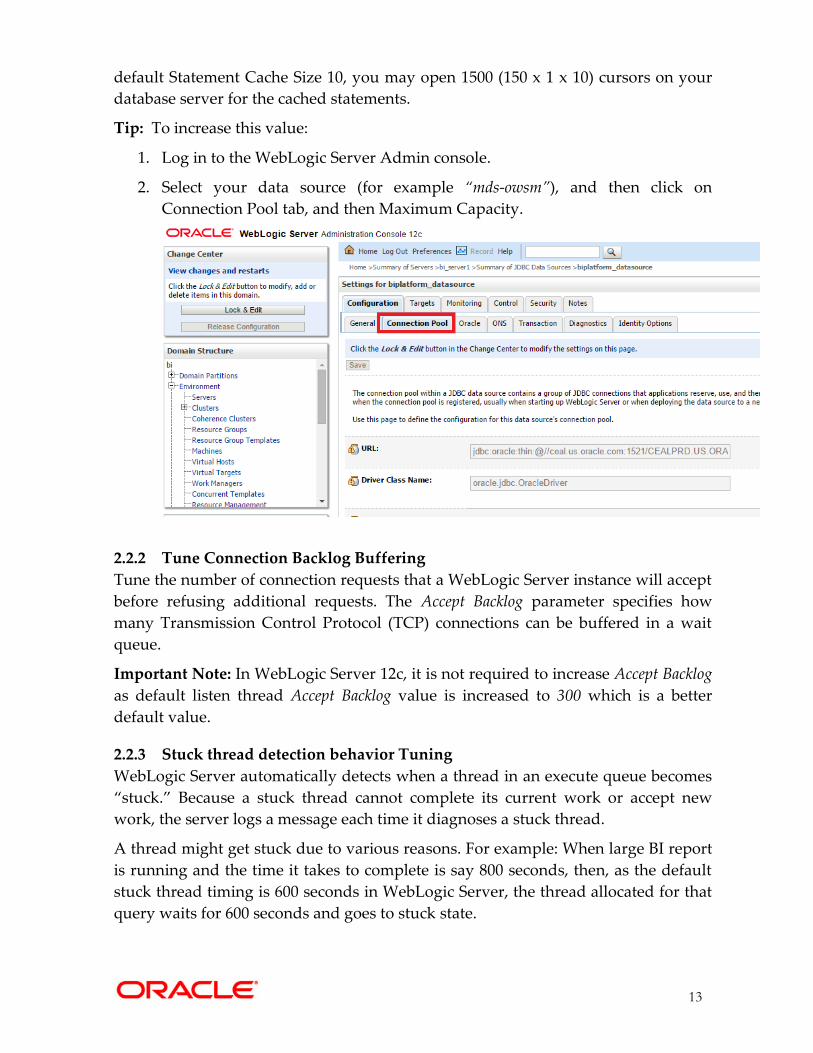
Tip: To increase this value:
1. Log in to the WebLogic Server Admin console.
2. Select your data source (for example “mds-owsm”), and then click on
Connection Pool tab, and then Maximum Capacity.
2.2.2 Tune Connection Backlog Buffering
Tune the number of connection requests that a WebLogic Server instance will accept
before refusing additional requests. The Accept Backlog parameter specifies how
many Transmission Control Protocol (TCP) connections can be buffered in a wait
queue.
Important Note: In WebLogic Server 12c, it is not required to increase Accept Backlog
as default listen thread Accept Backlog value is increased to 300 which is a better
default value.
2.2.3 Stuck thread detection behavior Tuning
WebLogic Server automatically detects when a thread in an execute queue becomes
“stuck.” Because a stuck thread cannot complete its current work or accept new
work, the server logs a message each time it diagnoses a stuck thread.
A thread might get stuck due to various reasons. For example: When large BI report
is running and the time it takes to complete is say 800 seconds, then, as the default
stuck thread timing is 600 seconds in WebLogic Server, the thread allocated for that
query waits for 600 seconds and goes to stuck state.
14
Note: the stuck state does not mean that it is stuck forever and it might get unstuck
at a later point of time which can be checked in the BI managed server logs. But if
there is no reference like that then it might infer that the thread got stuck forever
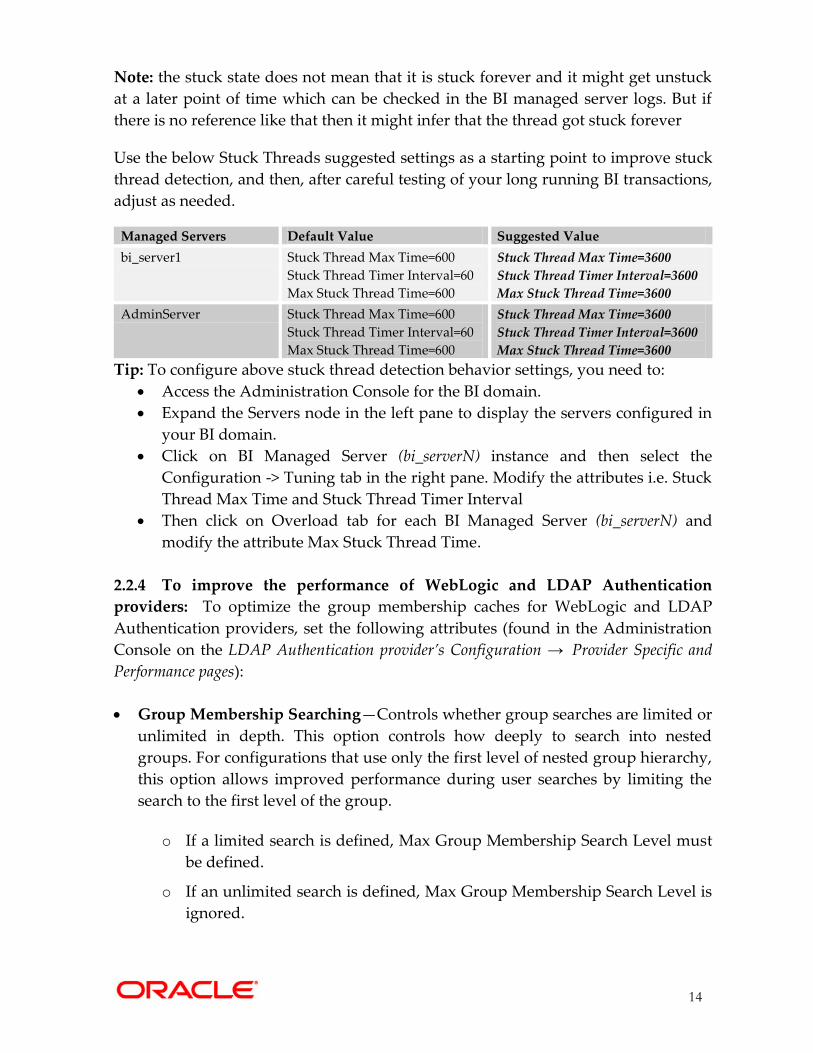
Use the below Stuck Threads suggested settings as a starting point to improve stuck
thread detection, and then, after careful testing of your long running BI transactions,
adjust as needed.
Managed Servers Default Value Suggested Value
bi_server1 Stuck Thread Max Time=600
Stuck Thread Timer Interval=60
Max Stuck Thread Time=600
Stuck Thread Max Time=3600
Stuck Thread Timer Interval=3600
Max Stuck Thread Time=3600
AdminServer Stuck Thread Max Time=600
Stuck Thread Timer Interval=60
Max Stuck Thread Time=600
Stuck Thread Max Time=3600
Stuck Thread Timer Interval=3600
Max Stuck Thread Time=3600
Tip: To configure above stuck thread detection behavior settings, you need to:
Access the Administration Console for the BI domain.
Expand the Servers node in the left pane to display the servers configured in
your BI domain.
Click on BI Managed Server (bi_serverN) instance and then select the
Configuration -> Tuning tab in the right pane. Modify the attributes i.e. Stuck
Thread Max Time and Stuck Thread Timer Interval
Then click on Overload tab for each BI Managed Server (bi_serverN) and
modify the attribute Max Stuck Thread Time.
2.2.4 To improve the performance of WebLogic and LDAP Authentication
providers: To optimize the group membership caches for WebLogic and LDAP
Authentication providers, set the following attributes (found in the Administration
Console on the LDAP Authentication provider’s Configuration → Provider Specific and
Performance pages):
Group Membership Searching—Controls whether group searches are limited or
unlimited in depth. This option controls how deeply to search into nested
groups. For configurations that use only the first level of nested group hierarchy,
this option allows improved performance during user searches by limiting the
search to the first level of the group.
o If a limited search is defined, Max Group Membership Search Level must
be defined.
o If an unlimited search is defined, Max Group Membership Search Level is
ignored.
15
Max Group Membership Search Level—Controls the depth of a group
membership search if Group Membership Searching is defined. Possible values
are:
o 0—Indicates only direct groups will be found. That is, when searching for
membership in Group A, only direct members of Group A will be found.
If Group B is a member of Group A, the members will not be found by this
search.
o Any positive number—indicates the number of levels to search. For
example, if this option is set to 1, a search for membership in Group A will
return direct members of Group A. If Group B is a member of Group A,
the members of Group B will also be found by this search. However, if
Group C is a member of Group B, the members of Group C will not be
found by this search.
Tip: If you see BI Managed Server JVM segfaults and then it restarts / hangs when a user
logs in, check the user group memberships in Active Directory. If the user belongs to groups
in a circular reference (group A belongs to group B that belongs to group A), without
additional configuration parameters, the JVM may segfaults. To workaround that set in
WebLogic Server Admin console the "Max Group Membership Search Level" for the AD
provider. For more information, refer to “Improving the Performance of WebLogic and
LDAP Authentication Providers” section at http://download.oracle.com/docs/cd/E12840_01/wls/docs103/secmanage/atn.html .
16
2.2.5 Tune LibOVD searches
LibOVD is a java library providing virtualization capabilities over LDAP
authentication providers in Oracle Fusion Middleware. LibOVD is activated when
you set the property virtualize=true for the identity store provider in jps-config.xml.
By setting the libOVD property attribute parameter OPTIMIZE_SEARCH=true will
improve the performance of searches as it forces libOVD to search only within the
users and groups search bases defined in the authenticator providers. No searches
are performed elsewhere.
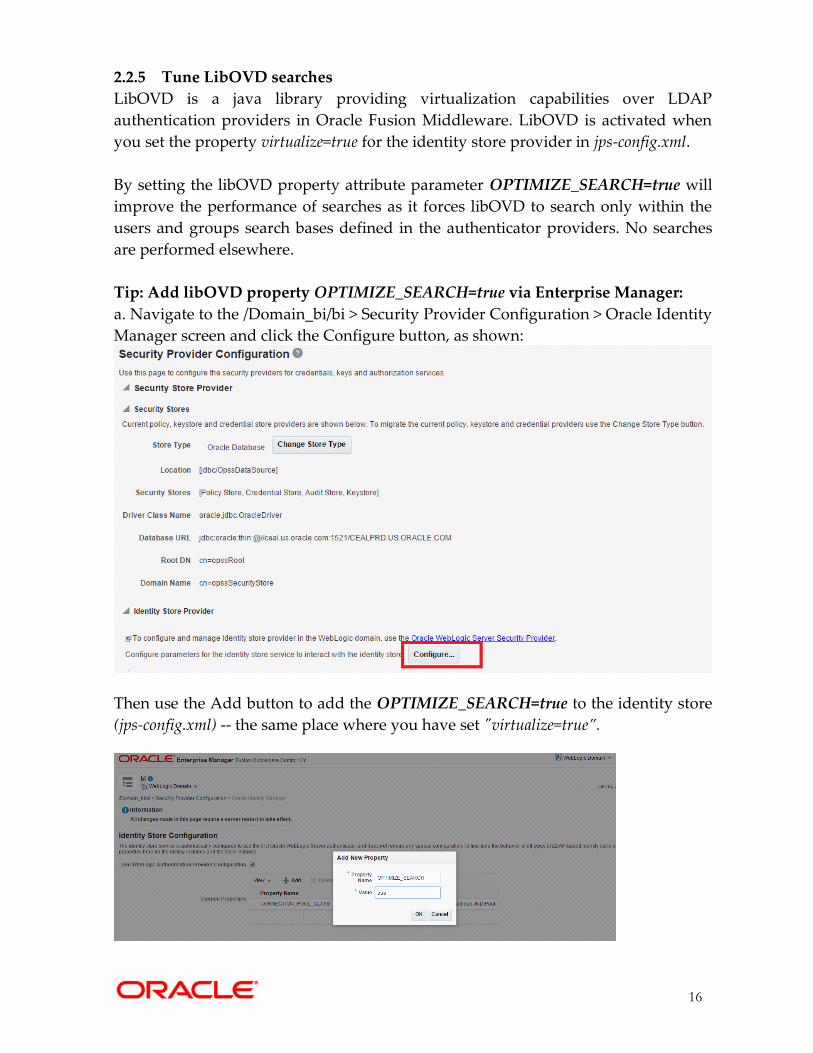
Tip: Add libOVD property OPTIMIZE_SEARCH=true via Enterprise Manager:
a. Navigate to the /Domain_bi/bi > Security Provider Configuration > Oracle Identity
Manager screen and click the Configure button, as shown:
Then use the Add button to add the OPTIMIZE_SEARCH=true to the identity store
(jps-config.xml) -- the same place where you have set "virtualize=true”.
17
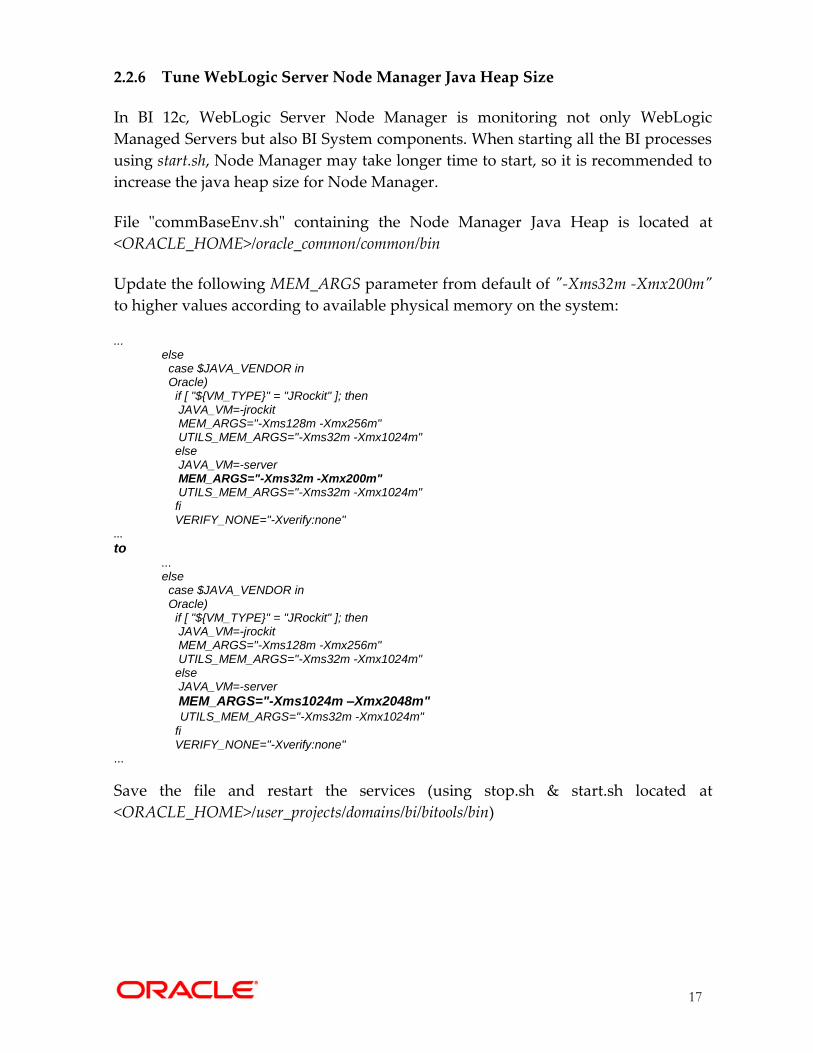
2.2.6 Tune WebLogic Server Node Manager Java Heap Size
In BI 12c, WebLogic Server Node Manager is monitoring not only WebLogic
Managed Servers but also BI System components. When starting all the BI processes
using start.sh, Node Manager may take longer time to start, so it is recommended to
increase the java heap size for Node Manager.
File "commBaseEnv.sh" containing the Node Manager Java Heap is located at
<ORACLE_HOME>/oracle_common/common/bin
Update the following MEM_ARGS parameter from default of "-Xms32m -Xmx200m"
to higher values according to available physical memory on the system:
... else case $JAVA_VENDOR in Oracle) if [ "${VM_TYPE}" = "JRockit" ]; then JAVA_VM=-jrockit MEM_ARGS="-Xms128m -Xmx256m" UTILS_MEM_ARGS="-Xms32m -Xmx1024m" else JAVA_VM=-server MEM_ARGS="-Xms32m -Xmx200m" UTILS_MEM_ARGS="-Xms32m -Xmx1024m" fi VERIFY_NONE="-Xverify:none"
... to
... else case $JAVA_VENDOR in Oracle) if [ "${VM_TYPE}" = "JRockit" ]; then JAVA_VM=-jrockit MEM_ARGS="-Xms128m -Xmx256m" UTILS_MEM_ARGS="-Xms32m -Xmx1024m" else JAVA_VM=-server
MEM_ARGS="-Xms1024m –Xmx2048m" UTILS_MEM_ARGS="-Xms32m -Xmx1024m"
fi VERIFY_NONE="-Xverify:none"
...
Save the file and restart the services (using stop.sh & start.sh located at
<ORACLE_HOME>/user_projects/domains/bi/bitools/bin)
18
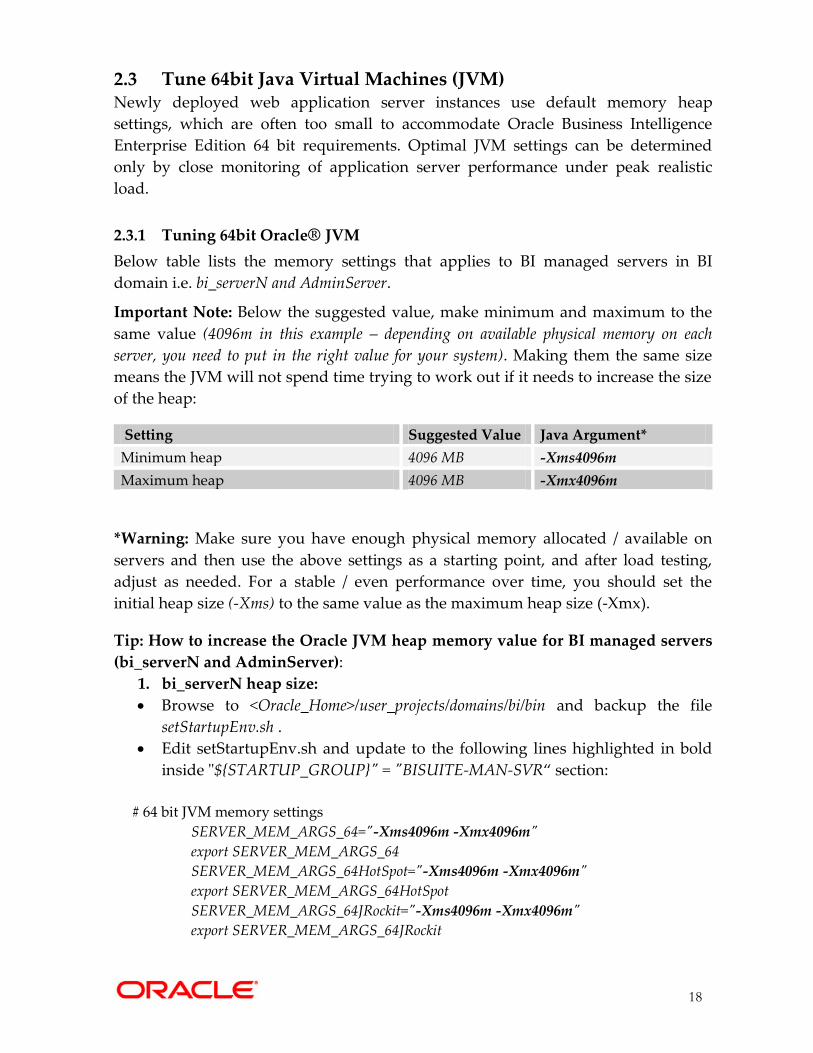
2.3 Tune 64bit Java Virtual Machines (JVM) Newly deployed web application server instances use default memory heap
settings, which are often too small to accommodate Oracle Business Intelligence
Enterprise Edition 64 bit requirements. Optimal JVM settings can be determined
only by close monitoring of application server performance under peak realistic
load.
2.3.1 Tuning 64bit Oracle® JVM
Below table lists the memory settings that applies to BI managed servers in BI
domain i.e. bi_serverN and AdminServer.
Important Note: Below the suggested value, make minimum and maximum to the
same value (4096m in this example – depending on available physical memory on each
server, you need to put in the right value for your system). Making them the same size
means the JVM will not spend time trying to work out if it needs to increase the size
of the heap:
Setting Suggested Value Java Argument*
Minimum heap 4096 MB -Xms4096m
Maximum heap 4096 MB -Xmx4096m
*Warning: Make sure you have enough physical memory allocated / available on
servers and then use the above settings as a starting point, and after load testing,
adjust as needed. For a stable / even performance over time, you should set the
initial heap size (-Xms) to the same value as the maximum heap size (-Xmx).
Tip: How to increase the Oracle JVM heap memory value for BI managed servers
(bi_serverN and AdminServer):
1. bi_serverN heap size:
Browse to <Oracle_Home>/user_projects/domains/bi/bin and backup the file
setStartupEnv.sh .
Edit setStartupEnv.sh and update to the following lines highlighted in bold
inside "${STARTUP_GROUP}" = "BISUITE-MAN-SVR“ section:
# 64 bit JVM memory settings
SERVER_MEM_ARGS_64="-Xms4096m -Xmx4096m"
export SERVER_MEM_ARGS_64
SERVER_MEM_ARGS_64HotSpot="-Xms4096m -Xmx4096m"
export SERVER_MEM_ARGS_64HotSpot
SERVER_MEM_ARGS_64JRockit="-Xms4096m -Xmx4096m"
export SERVER_MEM_ARGS_64JRockit
19
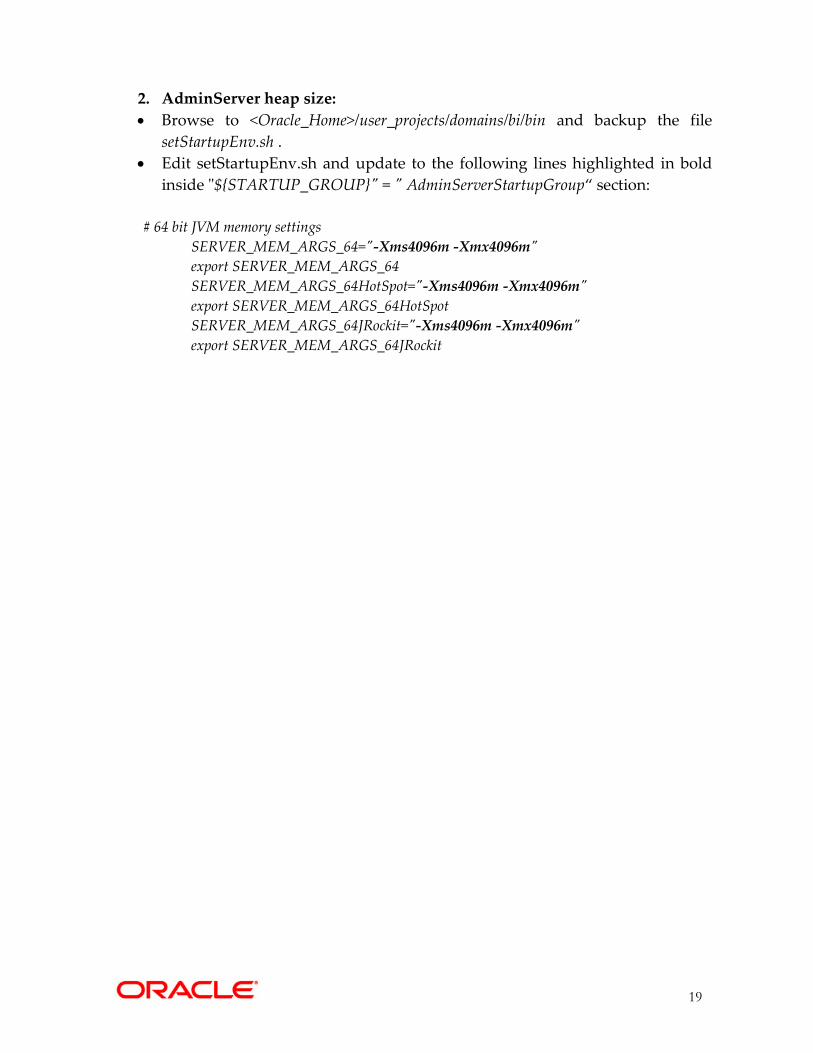
2. AdminServer heap size:
Browse to <Oracle_Home>/user_projects/domains/bi/bin and backup the file
setStartupEnv.sh .
Edit setStartupEnv.sh and update to the following lines highlighted in bold
inside "${STARTUP_GROUP}" = " AdminServerStartupGroup“ section:
# 64 bit JVM memory settings
SERVER_MEM_ARGS_64="-Xms4096m -Xmx4096m"
export SERVER_MEM_ARGS_64
SERVER_MEM_ARGS_64HotSpot="-Xms4096m -Xmx4096m"
export SERVER_MEM_ARGS_64HotSpot
SERVER_MEM_ARGS_64JRockit="-Xms4096m -Xmx4096m"
export SERVER_MEM_ARGS_64JRockit
20
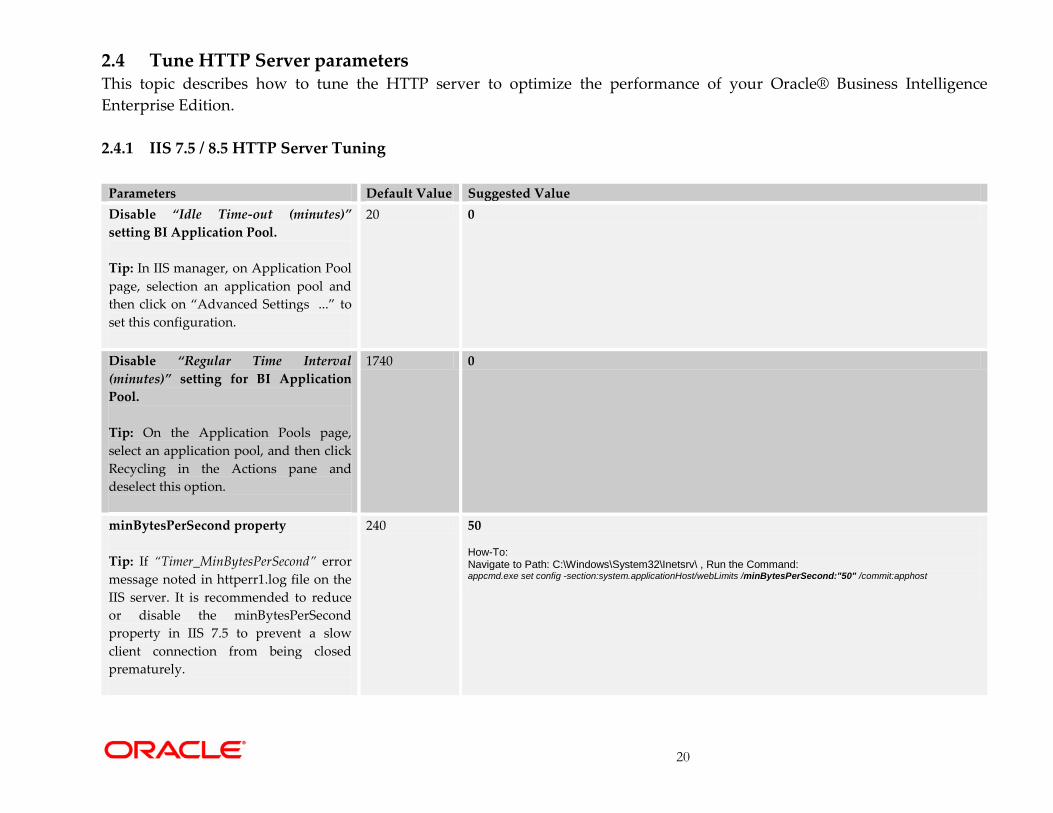
2.4 Tune HTTP Server parameters This topic describes how to tune the HTTP server to optimize the performance of your Oracle® Business Intelligence
Enterprise Edition.
2.4.1 IIS 7.5 / 8.5 HTTP Server Tuning
Parameters Default Value Suggested Value
Disable “Idle Time-out (minutes)”
setting BI Application Pool.
Tip: In IIS manager, on Application Pool
page, selection an application pool and
then click on “Advanced Settings ...” to
set this configuration.
20 0
Disable “Regular Time Interval
(minutes)” setting for BI Application
Pool.
Tip: On the Application Pools page,
select an application pool, and then click
Recycling in the Actions pane and
deselect this option.
1740 0
minBytesPerSecond property
Tip: If “Timer_MinBytesPerSecond” error
message noted in httperr1.log file on the
IIS server. It is recommended to reduce
or disable the minBytesPerSecond
property in IIS 7.5 to prevent a slow
client connection from being closed
prematurely.
240 50 How-To: Navigate to Path: C:\Windows\System32\Inetsrv\ , Run the Command: appcmd.exe set config -section:system.applicationHost/webLimits /minBytesPerSecond:"50" /commit:apphost
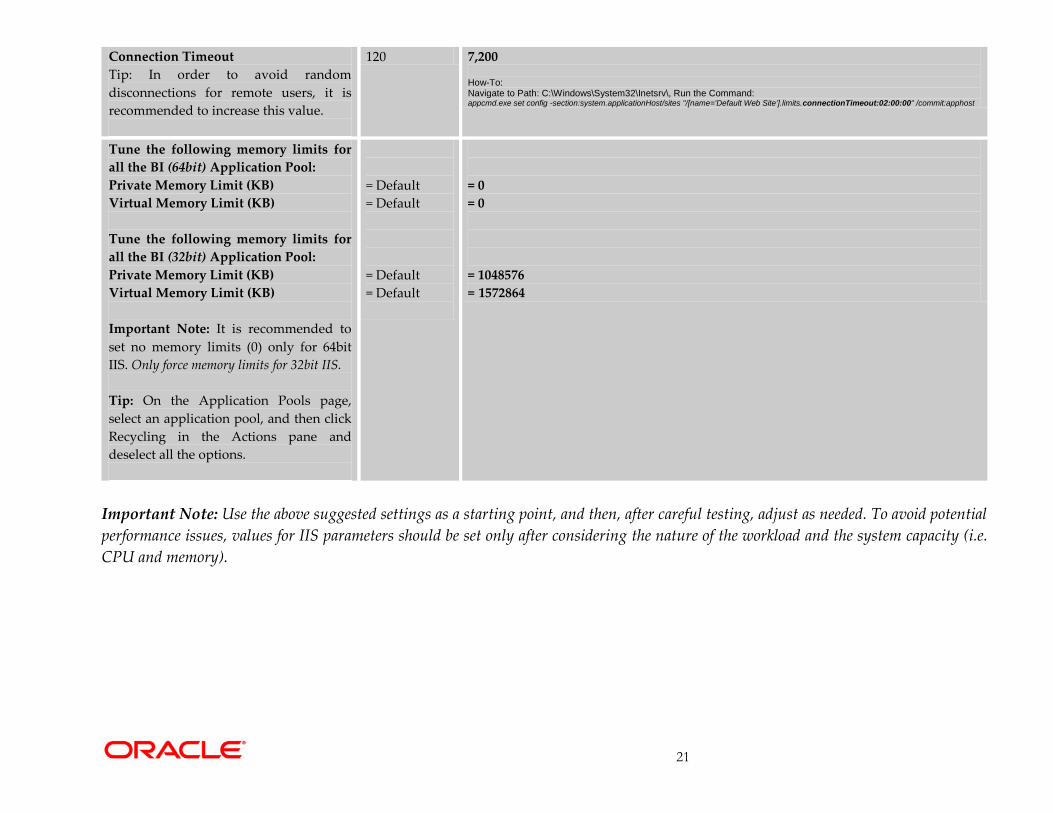
21
Connection Timeout
Tip: In order to avoid random
disconnections for remote users, it is
recommended to increase this value.
120 7,200
How-To: Navigate to Path: C:\Windows\System32\Inetsrv\, Run the Command: appcmd.exe set config -section:system.applicationHost/sites "/[name='Default Web Site'].limits.connectionTimeout:02:00:00" /commit:apphost
Tune the following memory limits for
all the BI (64bit) Application Pool:
Private Memory Limit (KB)
Virtual Memory Limit (KB)
Tune the following memory limits for
all the BI (32bit) Application Pool:
Private Memory Limit (KB)
Virtual Memory Limit (KB)
Important Note: It is recommended to
set no memory limits (0) only for 64bit
IIS. Only force memory limits for 32bit IIS.
Tip: On the Application Pools page,
select an application pool, and then click
Recycling in the Actions pane and
deselect all the options.
= Default
= Default
= Default
= Default
= 0
= 0
= 1048576
= 1572864
Important Note: Use the above suggested settings as a starting point, and then, after careful testing, adjust as needed. To avoid potential
performance issues, values for IIS parameters should be set only after considering the nature of the workload and the system capacity (i.e.
CPU and memory).
22
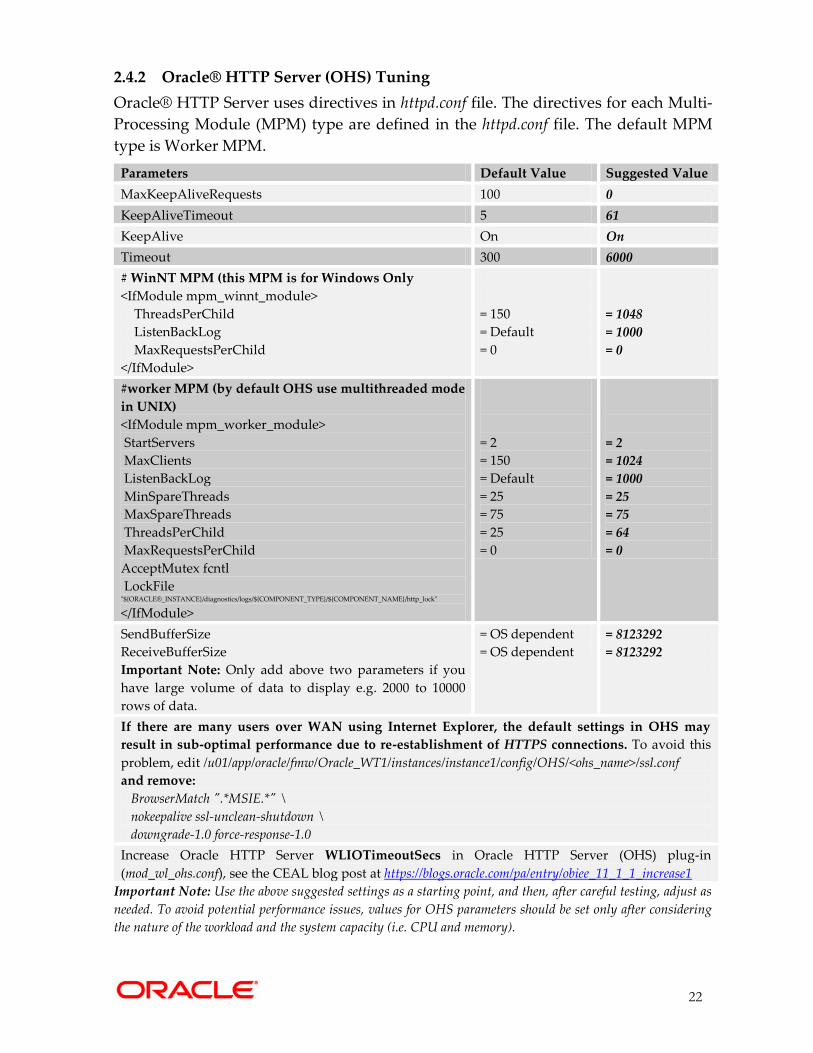
2.4.2 Oracle® HTTP Server (OHS) Tuning
Oracle® HTTP Server uses directives in httpd.conf file. The directives for each Multi-
Processing Module (MPM) type are defined in the httpd.conf file. The default MPM
type is Worker MPM.
Parameters Default Value Suggested Value
MaxKeepAliveRequests 100 0
KeepAliveTimeout 5 61
KeepAlive On On
Timeout 300 6000
# WinNT MPM (this MPM is for Windows Only
<IfModule mpm_winnt_module>
ThreadsPerChild
ListenBackLog
MaxRequestsPerChild
</IfModule>
= 150
= Default
= 0
= 1048
= 1000
= 0
#worker MPM (by default OHS use multithreaded mode
in UNIX)
<IfModule mpm_worker_module>
StartServers
MaxClients
ListenBackLog
MinSpareThreads
MaxSpareThreads
ThreadsPerChild
MaxRequestsPerChild
AcceptMutex fcntl
LockFile "${ORACLE®_INSTANCE}/diagnostics/logs/${COMPONENT_TYPE}/${COMPONENT_NAME}/http_lock" </IfModule>
= 2
= 150
= Default
= 25
= 75
= 25
= 0
= 2
= 1024
= 1000
= 25
= 75
= 64
= 0
SendBufferSize
ReceiveBufferSize
Important Note: Only add above two parameters if you
have large volume of data to display e.g. 2000 to 10000
rows of data.
= OS dependent
= OS dependent
= 8123292
= 8123292
If there are many users over WAN using Internet Explorer, the default settings in OHS may
result in sub-optimal performance due to re-establishment of HTTPS connections. To avoid this
problem, edit /u01/app/oracle/fmw/Oracle_WT1/instances/instance1/config/OHS/<ohs_name>/ssl.conf
and remove:
BrowserMatch ".*MSIE.*" \
nokeepalive ssl-unclean-shutdown \
downgrade-1.0 force-response-1.0
Increase Oracle HTTP Server WLIOTimeoutSecs in Oracle HTTP Server (OHS) plug-in
(mod_wl_ohs.conf), see the CEAL blog post at https://blogs.oracle.com/pa/entry/obiee_11_1_1_increase1
Important Note: Use the above suggested settings as a starting point, and then, after careful testing, adjust as
needed. To avoid potential performance issues, values for OHS parameters should be set only after considering
the nature of the workload and the system capacity (i.e. CPU and memory).
23
2.5 Tune HTTP Server Compression / Caching Why use Web Server Compression / Caching for Oracle® Business Intelligence?
1. Bandwidth Savings: Enabling HTTP compression can have a dramatic
improvement on the latency of responses. By compressing static files and
dynamic application responses, it will significantly reduce the remote (high
latency) user response time.
2. Improves request/response latency: Caching makes it possible to suppress the
payload of the HTTP reply using the 304 status code. Minimizing round trips over
the Web to revalidate cached items can make a huge difference in browser page load times.
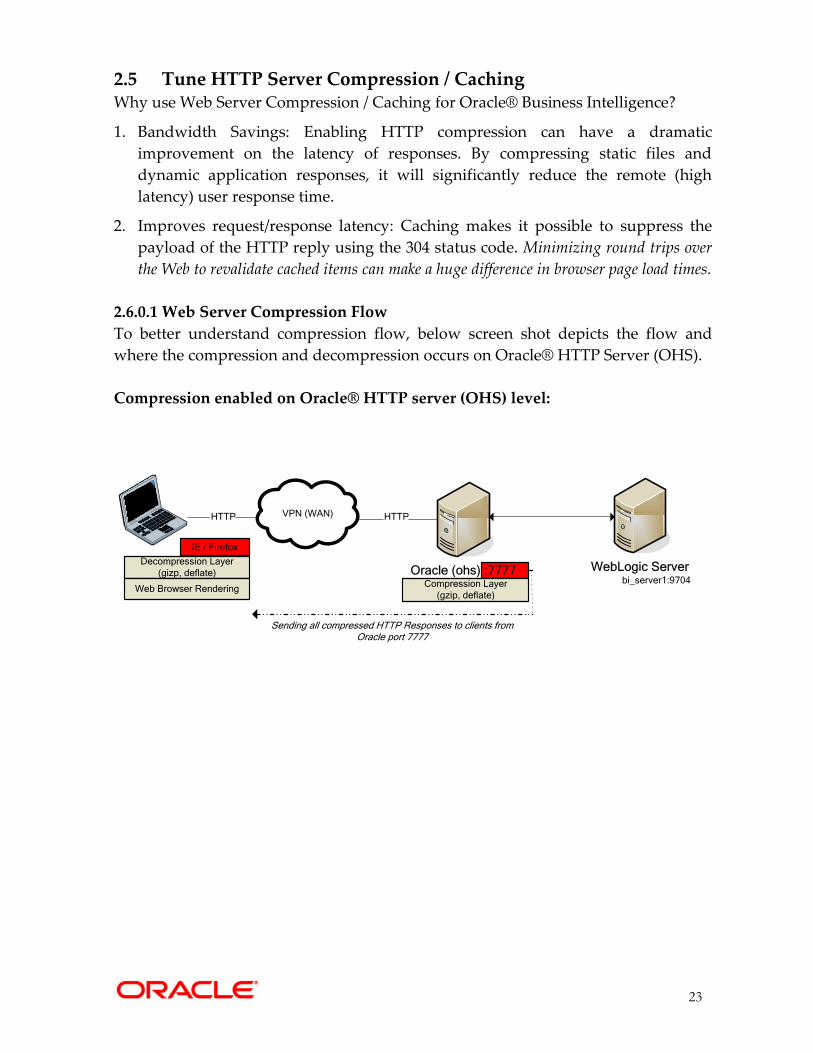
2.6.0.1 Web Server Compression Flow
To better understand compression flow, below screen shot depicts the flow and
where the compression and decompression occurs on Oracle® HTTP Server (OHS).
Compression enabled on Oracle® HTTP server (OHS) level:
HTTPVPN (WAN)HTTP
Oracle (ohs) :7777 WebLogic Server bi_server1:9704Compression Layer
(gzip, deflate)
IE / Firefox
Decompression Layer
(gizp, deflate)
Web Browser Rendering
Sending all compressed HTTP Responses to clients from Oracle port 7777

24
2.5.1 Oracle® HTTP Server (OHS)
This topic describes how to enable caching / compression in Oracle® HTTP Server of
your Oracle® Business Intelligence Enterprise Edition. Important Note: High load of
HTTP replies with 304 status code causes the Oracle Business Intelligence 12c UI to
work slow in Internet Explorer browser over high latency networks. To resolve this
issue, it is highly recommended to implement HTTP caching and compression that
will help to minimize the round trips over the Web to revalidate cached items, can
make a huge difference in browser page load times.
a. How to Enable Compression and Caching:
1. To implement HTTP compression / caching, install and configure Oracle HTTP
Server (OHS) 12c (12.2.1.0.0) for the bi_serverN Managed Servers (refer to "OBIEE
Enterprise Deployment Guide for Oracle Business Intelligence" document for details).
2. On the OHS machine, open the file HTTP Server configuration file (httpd.conf) for
editing. This file is located in the OHS installation directory. For example:
../user_projects/domains/base_domain/config/fmwconfig/components/OHS/instances/ohs1
3. In httpd.conf file, verify that the following directives are included and not
commented out:
LoadModule expires_module "${ORACLE_HOME}/ohs/modules/mod_expires.so
LoadModule deflate_module "${ORACLE_HOME}/ohs/modules/mod_deflate.so
4. Add the following lines in httpd.conf file below the directive LoadModule section to
compression / caching and restart the OHS:
#HTTP Compression
<IfModule mod_deflate.c>
SetOutputFilter DEFLATE
SetEnvIfNoCase Request_URI \.(?:gif|jpe?g|png)$ no-gzip dont-vary
SetEnvIfNoCase Request_URI \.(?:exe|t?gz|zip|bz2|sit|rar)$ no-gzip dont-vary
SetEnvIfNoCase Request_URI \.(?:pdf|doc?x|ppt?x|xls?x)$ no-gzip dont-vary
SetEnvIfNoCase Request_URI \.avi$ no-gzip dont-vary
SetEnvIfNoCase Request_URI \.mov$ no-gzip dont-vary
SetEnvIfNoCase Request_URI \.mp3$ no-gzip dont-vary
SetEnvIfNoCase Request_URI \.mp4$ no-gzip dont-vary
</IfModule>
#Caching of static files
ExpiresActive On
<IfModule mod_expires.c>
ExpiresByType image/gif "access plus 3 months"
ExpiresByType image/jpeg "access plus 3 months"
ExpiresByType application/x-javascript "access plus 3 months"
ExpiresByType text/css "access plus 3 months"
ExpiresByType text/javascript "access plus 3 months"
ExpiresByType image/png "access plus 3 months"
ExpiresByType application/x-shockwave-flash "access plus 3 months"
</IfModule>
#This stops the HTTP 304 replies in IE browser
<IfModule mod_headers.c>
<FilesMatch "\.(gif|jpeg|png|x-javascript|javascript|css|swf)$">
Header set Cache-Control "max-age=7889231"
</FilesMatch>
</IfModule>

25
b. Performance Gain Test (Oracle® HTTP Server)
The test with/without HTTP compression enabled was conducted in internal lab to
measure the transactions response time / throughput for Oracle® Business
Intelligence Enterprise Edition.
Below table summarizes the performance improvement for OBIEE Visual Analyzer
transactions over a slow network of 3 Mbps bandwidth link for one remote user.
Below table summarizes the performance improvement for OBIEE classic
transactions over a slow network 1 Mbps bandwidth link for one remote user.
Transaction Name Average time
(in sec)
Average time
(in sec)
%
Improvement
Before (Non-
Compressed/Caching)
After (Compressed/Caching)
OBIEE Visual Analyzer
Home page(/va/home.jsp)
(First time login)
24 11 54%
Total Throughput (MB)
(Total generated network
traffic for one user)
8.2 MB 1.9 MB -
Average Network Delay
(ms)
159 160
Transaction Name Average time
(in sec)
Average time
(in sec)
% Improvement
Before (Non-Compressed)
After (Compressed)
Total transactions response
time:
OBIEE Main page > Display
report (with 1000 rows) > Click &
Navigate to next 1000 rows page
up to 5 times.
300 seconds 20 seconds 93%
Total Throughput (bytes)
(Total generated network traffic for
one user)
18,534,557 1,123,646 -
Average Network Delay (ms)
350 355 -
Packet Loss %
0 0 -
26
2.5.2 IIS 7.5 / 8.5 HTTP Server
This topic describes how to enable compression and caching of your Oracle® Business
Intelligence Enterprise Edition.
Important Note: High load of HTTP replies with 304 status code causes the Oracle Business
Intelligence 12c UI to work slow in Internet Explorer browser over high latency networks.
To resolve this issue, it is highly recommended to implement HTTP caching and
compression that will help to minimize the round trips over the Web to revalidate cached
items, can make a huge difference in browser page load times.
Tip: Refer to WebLogic Server documentation on how to install and configure the Microsoft
Internet Information Server Plug-In for IIS 7.5 / 8.5.
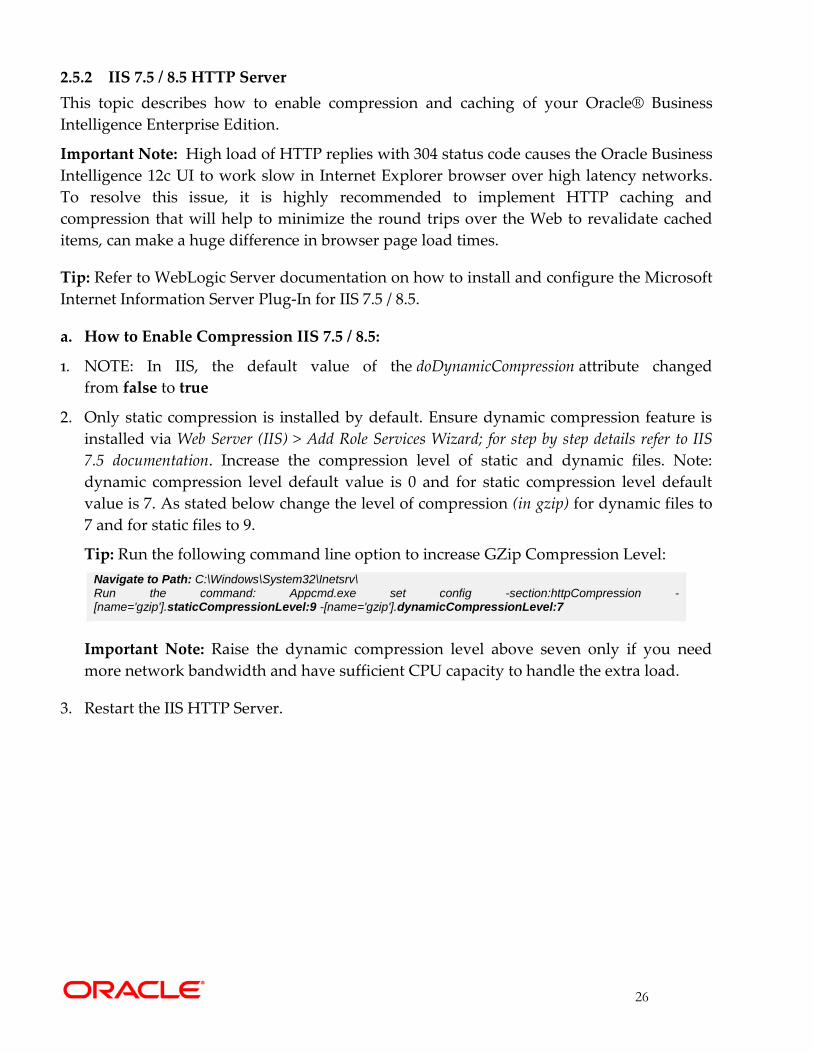
a. How to Enable Compression IIS 7.5 / 8.5:
1. NOTE: In IIS, the default value of the doDynamicCompression attribute changed
from false to true
2. Only static compression is installed by default. Ensure dynamic compression feature is
installed via Web Server (IIS) > Add Role Services Wizard; for step by step details refer to IIS
7.5 documentation. Increase the compression level of static and dynamic files. Note:
dynamic compression level default value is 0 and for static compression level default
value is 7. As stated below change the level of compression (in gzip) for dynamic files to
7 and for static files to 9.
Tip: Run the following command line option to increase GZip Compression Level:
Navigate to Path: C:\Windows\System32\Inetsrv\ Run the command: Appcmd.exe set config -section:httpCompression -[name='gzip'].staticCompressionLevel:9 -[name='gzip'].dynamicCompressionLevel:7
Important Note: Raise the dynamic compression level above seven only if you need
more network bandwidth and have sufficient CPU capacity to handle the extra load.
3. Restart the IIS HTTP Server.
27
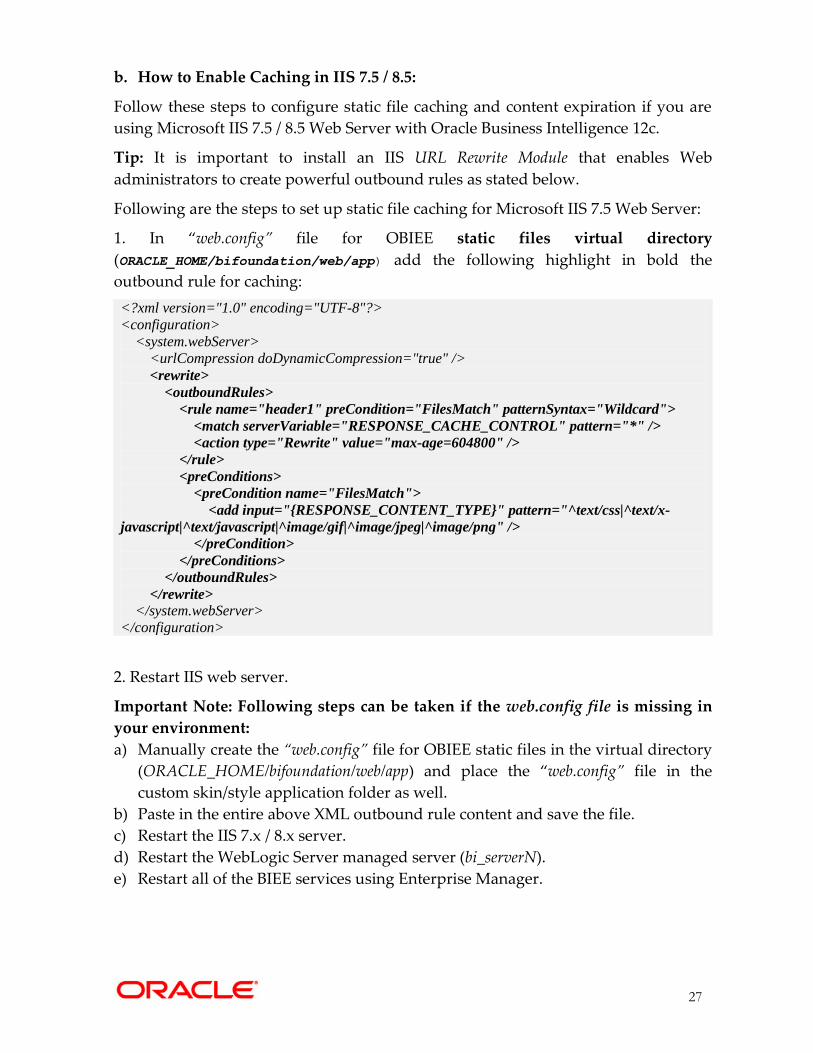
b. How to Enable Caching in IIS 7.5 / 8.5:
Follow these steps to configure static file caching and content expiration if you are
using Microsoft IIS 7.5 / 8.5 Web Server with Oracle Business Intelligence 12c.
Tip: It is important to install an IIS URL Rewrite Module that enables Web
administrators to create powerful outbound rules as stated below.
Following are the steps to set up static file caching for Microsoft IIS 7.5 Web Server:
1. In “web.config” file for OBIEE static files virtual directory
(ORACLE_HOME/bifoundation/web/app) add the following highlight in bold the
outbound rule for caching:
<?xml version="1.0" encoding="UTF-8"?>
<configuration>
<system.webServer>
<urlCompression doDynamicCompression="true" />
<rewrite>
<outboundRules>
<rule name="header1" preCondition="FilesMatch" patternSyntax="Wildcard">
<match serverVariable="RESPONSE_CACHE_CONTROL" pattern="*" />
<action type="Rewrite" value="max-age=604800" />
</rule>
<preConditions>
<preCondition name="FilesMatch">
<add input="{RESPONSE_CONTENT_TYPE}" pattern="^text/css|^text/x-
javascript|^text/javascript|^image/gif|^image/jpeg|^image/png" />
</preCondition>
</preConditions>
</outboundRules>
</rewrite>
</system.webServer>
</configuration>
2. Restart IIS web server.
Important Note: Following steps can be taken if the web.config file is missing in
your environment:
a) Manually create the “web.config” file for OBIEE static files in the virtual directory
(ORACLE_HOME/bifoundation/web/app) and place the “web.config” file in the
custom skin/style application folder as well.
b) Paste in the entire above XML outbound rule content and save the file.
c) Restart the IIS 7.x / 8.x server.
d) Restart the WebLogic Server managed server (bi_serverN).
e) Restart all of the BIEE services using Enterprise Manager.
28
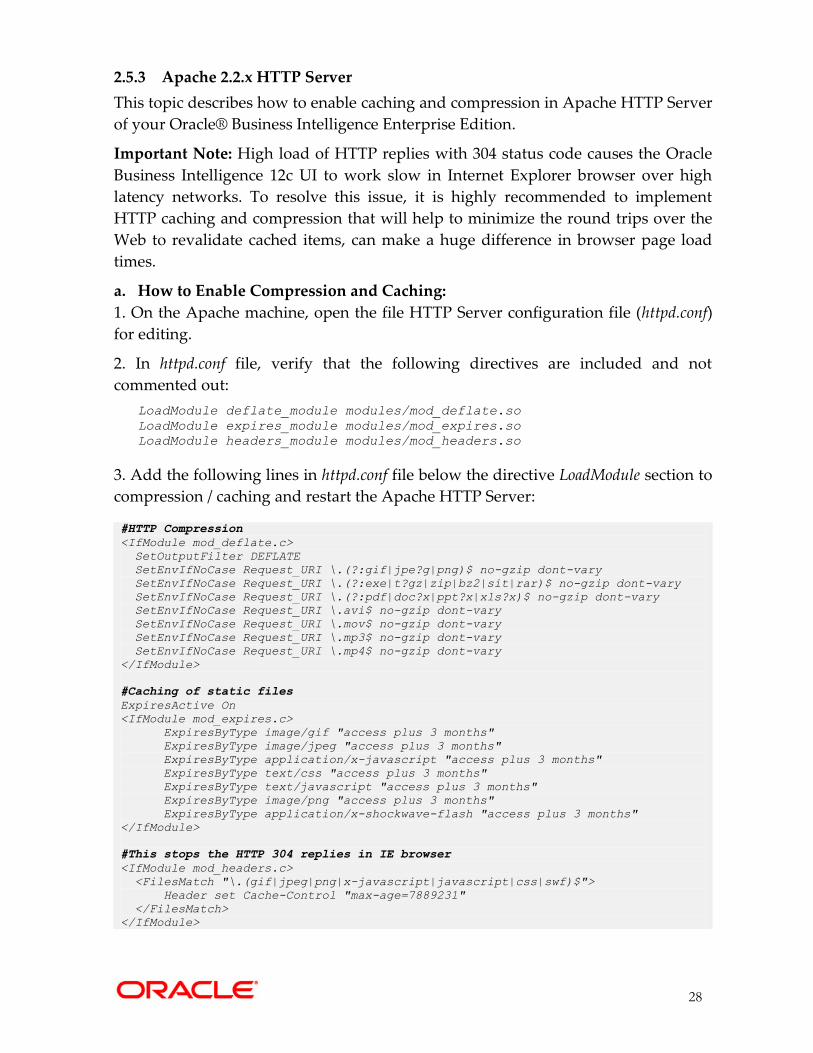
2.5.3 Apache 2.2.x HTTP Server
This topic describes how to enable caching and compression in Apache HTTP Server
of your Oracle® Business Intelligence Enterprise Edition.
Important Note: High load of HTTP replies with 304 status code causes the Oracle
Business Intelligence 12c UI to work slow in Internet Explorer browser over high
latency networks. To resolve this issue, it is highly recommended to implement
HTTP caching and compression that will help to minimize the round trips over the
Web to revalidate cached items, can make a huge difference in browser page load
times.
a. How to Enable Compression and Caching:
1. On the Apache machine, open the file HTTP Server configuration file (httpd.conf)
for editing.
2. In httpd.conf file, verify that the following directives are included and not
commented out:
LoadModule deflate_module modules/mod_deflate.so
LoadModule expires_module modules/mod_expires.so
LoadModule headers_module modules/mod_headers.so
3. Add the following lines in httpd.conf file below the directive LoadModule section to
compression / caching and restart the Apache HTTP Server:
#HTTP Compression
<IfModule mod_deflate.c>
SetOutputFilter DEFLATE
SetEnvIfNoCase Request_URI \.(?:gif|jpe?g|png)$ no-gzip dont-vary
SetEnvIfNoCase Request_URI \.(?:exe|t?gz|zip|bz2|sit|rar)$ no-gzip dont-vary
SetEnvIfNoCase Request_URI \.(?:pdf|doc?x|ppt?x|xls?x)$ no-gzip dont-vary
SetEnvIfNoCase Request_URI \.avi$ no-gzip dont-vary
SetEnvIfNoCase Request_URI \.mov$ no-gzip dont-vary
SetEnvIfNoCase Request_URI \.mp3$ no-gzip dont-vary
SetEnvIfNoCase Request_URI \.mp4$ no-gzip dont-vary
</IfModule>
#Caching of static files
ExpiresActive On
<IfModule mod_expires.c>
ExpiresByType image/gif "access plus 3 months"
ExpiresByType image/jpeg "access plus 3 months"
ExpiresByType application/x-javascript "access plus 3 months"
ExpiresByType text/css "access plus 3 months"
ExpiresByType text/javascript "access plus 3 months"
ExpiresByType image/png "access plus 3 months"
ExpiresByType application/x-shockwave-flash "access plus 3 months"
</IfModule>
#This stops the HTTP 304 replies in IE browser
<IfModule mod_headers.c>
<FilesMatch "\.(gif|jpeg|png|x-javascript|javascript|css|swf)$">
Header set Cache-Control "max-age=7889231"
</FilesMatch>
</IfModule>
29
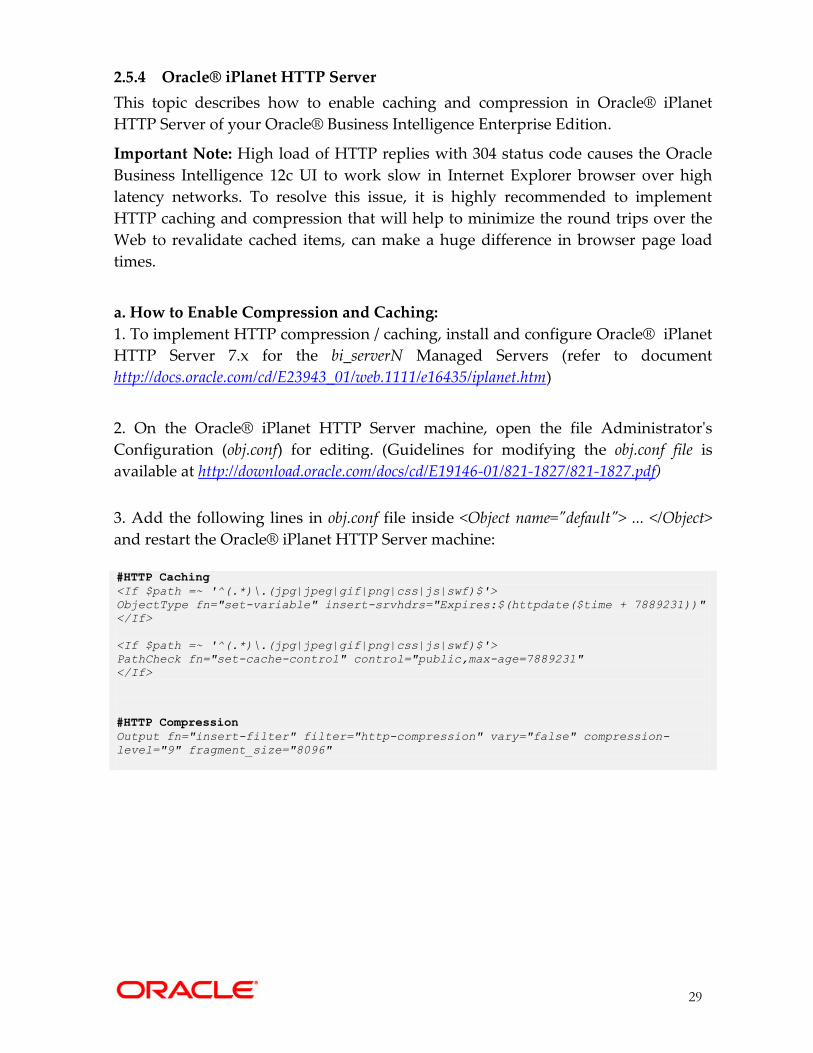
2.5.4 Oracle® iPlanet HTTP Server
This topic describes how to enable caching and compression in Oracle® iPlanet
HTTP Server of your Oracle® Business Intelligence Enterprise Edition.
Important Note: High load of HTTP replies with 304 status code causes the Oracle
Business Intelligence 12c UI to work slow in Internet Explorer browser over high
latency networks. To resolve this issue, it is highly recommended to implement
HTTP caching and compression that will help to minimize the round trips over the
Web to revalidate cached items, can make a huge difference in browser page load
times.
a. How to Enable Compression and Caching:
1. To implement HTTP compression / caching, install and configure Oracle® iPlanet
HTTP Server 7.x for the bi_serverN Managed Servers (refer to document
http://docs.oracle.com/cd/E23943_01/web.1111/e16435/iplanet.htm)
2. On the Oracle® iPlanet HTTP Server machine, open the file Administrator's
Configuration (obj.conf) for editing. (Guidelines for modifying the obj.conf file is
available at http://download.oracle.com/docs/cd/E19146-01/821-1827/821-1827.pdf)
3. Add the following lines in obj.conf file inside <Object name="default"> ... </Object>
and restart the Oracle® iPlanet HTTP Server machine:
#HTTP Caching
<If $path =~ '^(.*)\.(jpg|jpeg|gif|png|css|js|swf)$'>
ObjectType fn="set-variable" insert-srvhdrs="Expires:$(httpdate($time + 7889231))"
</If>
<If $path =~ '^(.*)\.(jpg|jpeg|gif|png|css|js|swf)$'>
PathCheck fn="set-cache-control" control="public,max-age=7889231"
</If>
#HTTP Compression
Output fn="insert-filter" filter="http-compression" vary="false" compression-
level="9" fragment_size="8096"
30
2.6 Tune Web Browser Settings This topic describes how to tune Internet web browser to optimize the performance
of your Oracle® Business Intelligence Enterprise Edition.
Do not clear the cache when exiting the browser
o Firefox: Uncheck “Clear history when Firefox closes” when using custom
settings for history.
o IE: Uncheck “Delete browsing history on exit”
Increase the cache size to 1024 MB
o Firefox: Enter “about:config” as the url and change:
browser.cache.disk.capacity to 1024000
browser.cache.disk.max_entry_size to -1
o IE: Set “Disk space to use” to 1024 under Internet Options -> Browsing
history -> Settings
2.7 Tune Database Parameters Tuning and indexing underlying databases: For Oracle BI Server database queries to
return quickly, the underlying databases must be configured, tuned, and indexed
correctly. Note that different database products have different tuning
considerations.
Tip: If there are queries that return slowly from the underlying databases, then you
can capture the SQL statements for the queries in the query log and provide them to
the database administrator (DBA) for analysis. See "Managing the Query Log" in
Oracle Fusion Middleware System Administrator's Guide for Oracle Business
Intelligence Enterprise Edition for more information about configuring query
logging on the system.
31
3.0 PERFORMANCE MONITORING AND TESTING OBIEE This topic outlines the processes that have to be monitored for the Oracle® Business
Intelligence using built-in BI metrics and default Operating System performance
utilities. In addition to the BI performance monitoring, it also outlines on how to
create load / performance test scripts against Oracle Business Intelligence Enterprise
Edition (OBIEE) using Oracle Load Testing tool.
3.1 Built-in BI Metrics for Performance Monitoring You can use following built-in BI metrics to monitor System Components (BI
processes) and WebLogic Server processes.
Tips:
Using WLST Commands for BI Metrics, for more details refer to http://docs.oracle.com/middleware/1221/biee/BIESG/querycaching.htm#BIESG105
Use Oracle Enterprise Manager (EM) URL to monitor end to end OBIEE real time
performance: http://<server>:7001/em . To proactively monitor your Oracle BI
environment from both systems & end-user perspectives, it is recommended to
use Oracle Enterprise Manager (OEM) 12c BI Management Pack, for more details
refer to http://www.oracle.com/technetwork/oem/pdf/511863.pdf .
In Oracle Business Intelligence 12c, the perfmon URL is still valid to use i.e.
http://<server:port>/analytics/saw.dll?Perfmon
3.1.1 How to Analyze Oracle Business Intelligence Server Metrics
If you encounter a problem, such as Presentation Services and BI Server components
are running slowly or are hanging, you can view more detailed performance
information, including performance metrics for a particular target, to diagnose
further about the problem.
Note that Fusion Middleware Control provides real-time data. If you are interested
in viewing historical data, consider using Oracle Enterprise Manager Grid Control.
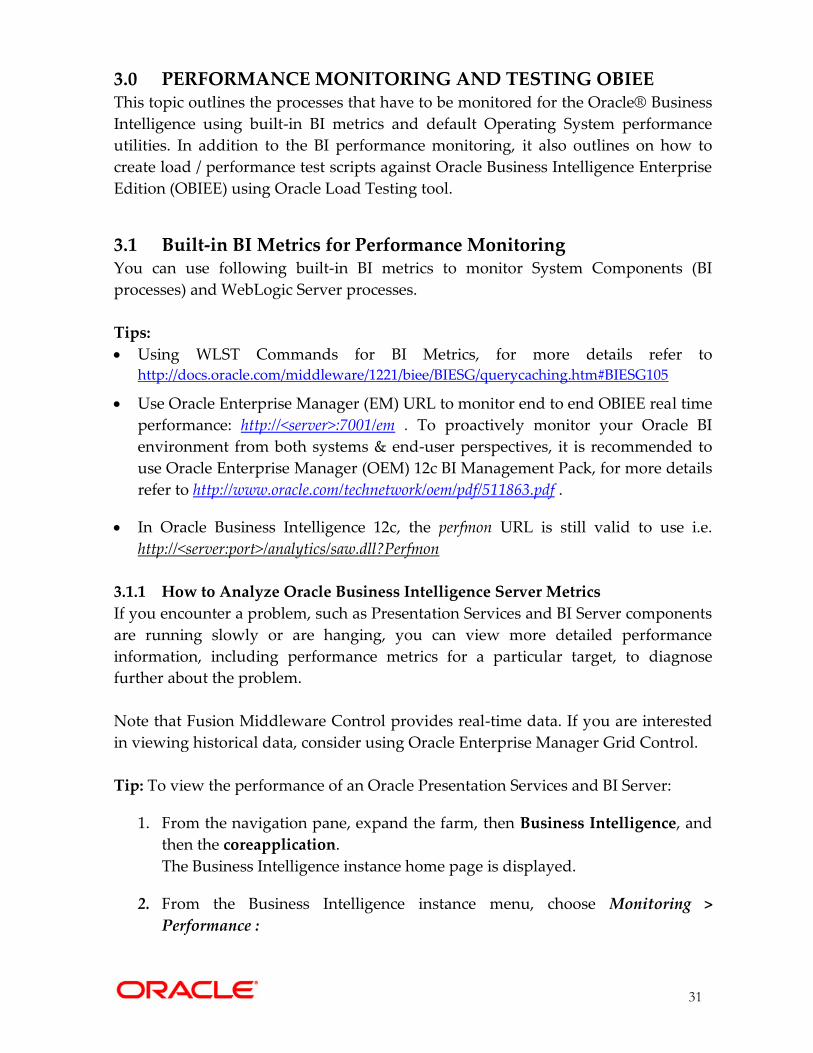
Tip: To view the performance of an Oracle Presentation Services and BI Server:
1. From the navigation pane, expand the farm, then Business Intelligence, and
then the coreapplication.
The Business Intelligence instance home page is displayed.
2. From the Business Intelligence instance menu, choose Monitoring >
Performance :
32
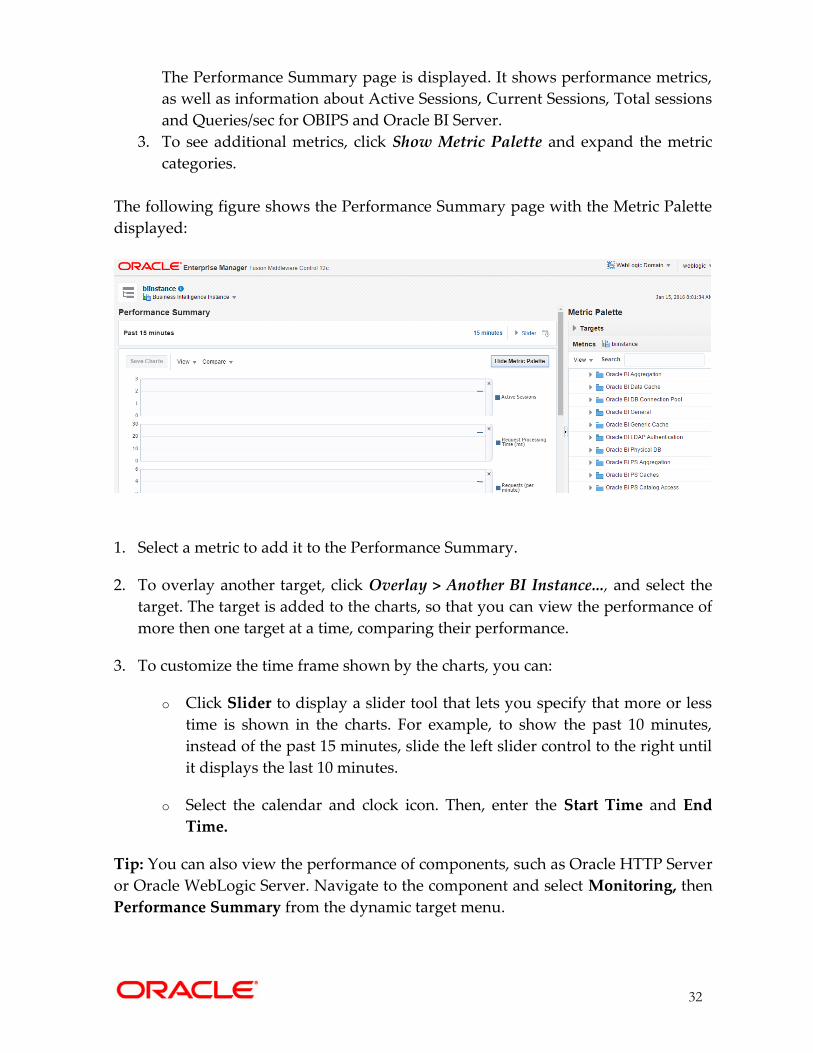
The Performance Summary page is displayed. It shows performance metrics,
as well as information about Active Sessions, Current Sessions, Total sessions
and Queries/sec for OBIPS and Oracle BI Server.
3. To see additional metrics, click Show Metric Palette and expand the metric
categories.
The following figure shows the Performance Summary page with the Metric Palette
displayed:
1. Select a metric to add it to the Performance Summary.
2. To overlay another target, click Overlay > Another BI Instance..., and select the
target. The target is added to the charts, so that you can view the performance of
more then one target at a time, comparing their performance.
3. To customize the time frame shown by the charts, you can:
o Click Slider to display a slider tool that lets you specify that more or less
time is shown in the charts. For example, to show the past 10 minutes,
instead of the past 15 minutes, slide the left slider control to the right until
it displays the last 10 minutes.
o Select the calendar and clock icon. Then, enter the Start Time and End
Time.
Tip: You can also view the performance of components, such as Oracle HTTP Server
or Oracle WebLogic Server. Navigate to the component and select Monitoring, then
Performance Summary from the dynamic target menu.
33
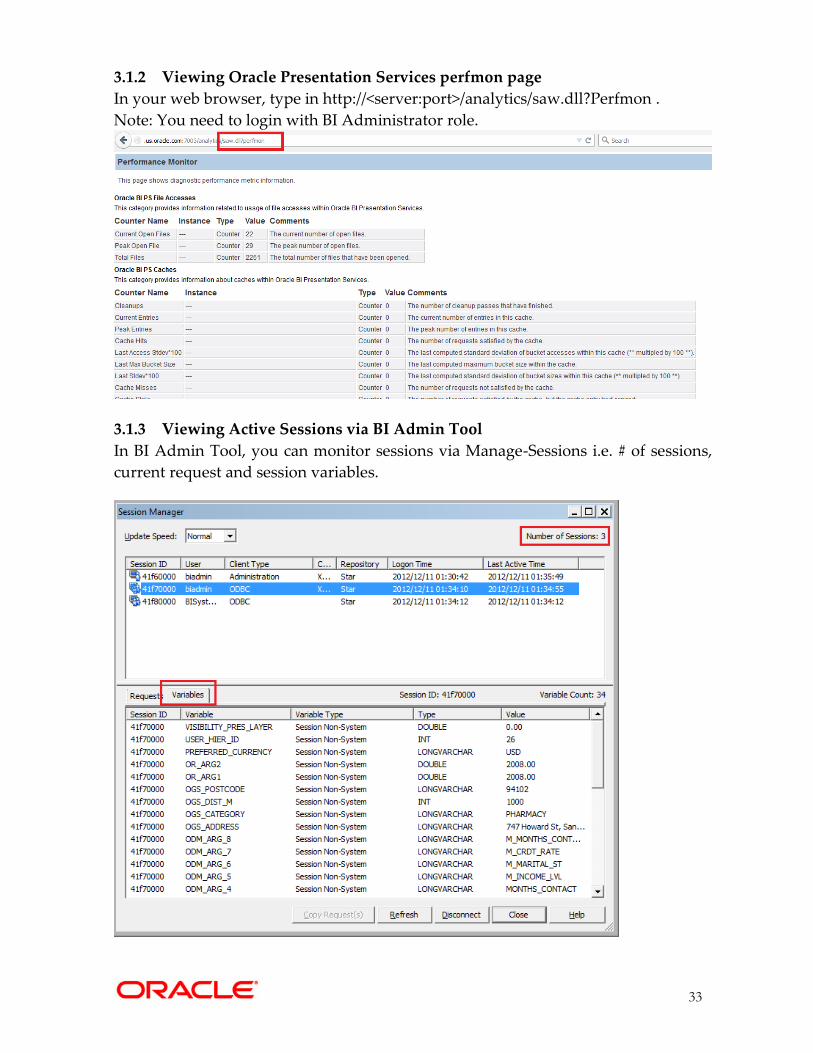
3.1.2 Viewing Oracle Presentation Services perfmon page
In your web browser, type in http://<server:port>/analytics/saw.dll?Perfmon .
Note: You need to login with BI Administrator role.
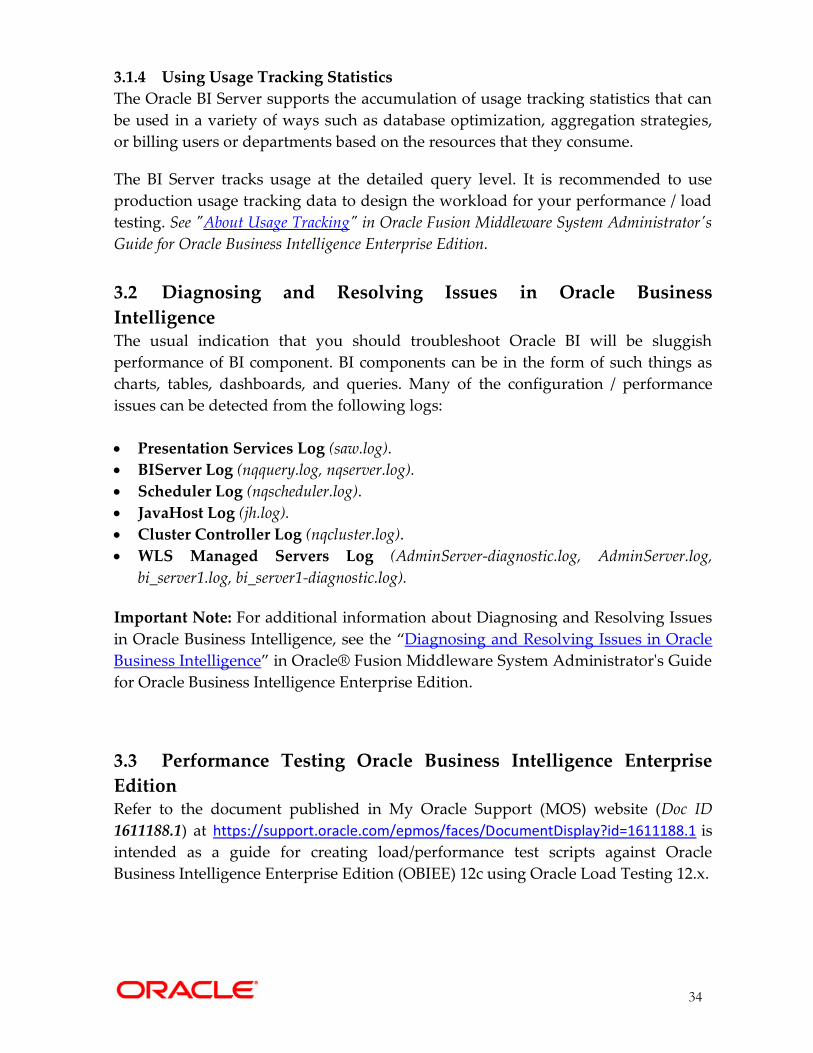
3.1.3 Viewing Active Sessions via BI Admin Tool
In BI Admin Tool, you can monitor sessions via Manage-Sessions i.e. # of sessions,
current request and session variables.
34
3.1.4 Using Usage Tracking Statistics
The Oracle BI Server supports the accumulation of usage tracking statistics that can
be used in a variety of ways such as database optimization, aggregation strategies,
or billing users or departments based on the resources that they consume.
The BI Server tracks usage at the detailed query level. It is recommended to use
production usage tracking data to design the workload for your performance / load
testing. See "About Usage Tracking" in Oracle Fusion Middleware System Administrator's
Guide for Oracle Business Intelligence Enterprise Edition.
3.2 Diagnosing and Resolving Issues in Oracle Business
Intelligence The usual indication that you should troubleshoot Oracle BI will be sluggish
performance of BI component. BI components can be in the form of such things as
charts, tables, dashboards, and queries. Many of the configuration / performance
issues can be detected from the following logs:
Presentation Services Log (saw.log).
BIServer Log (nqquery.log, nqserver.log).
Scheduler Log (nqscheduler.log).
JavaHost Log (jh.log).
Cluster Controller Log (nqcluster.log).
WLS Managed Servers Log (AdminServer-diagnostic.log, AdminServer.log,
bi_server1.log, bi_server1-diagnostic.log).
Important Note: For additional information about Diagnosing and Resolving Issues
in Oracle Business Intelligence, see the “Diagnosing and Resolving Issues in Oracle
Business Intelligence” in Oracle® Fusion Middleware System Administrator's Guide
for Oracle Business Intelligence Enterprise Edition.
3.3 Performance Testing Oracle Business Intelligence Enterprise
Edition Refer to the document published in My Oracle Support (MOS) website (Doc ID
1611188.1) at https://support.oracle.com/epmos/faces/DocumentDisplay?id=1611188.1 is
intended as a guide for creating load/performance test scripts against Oracle
Business Intelligence Enterprise Edition (OBIEE) 12c using Oracle Load Testing 12.x.
35
This guide will assist during the script creation process and enable the OBIEE tester
to create scripts faster and more reliably. It assumes that the person using this
document has experience working with Oracle Application Testing Suite.
Note: This support document (Doc ID 1611188.1) does not necessarily cover all
OBIEE transactions that have to be tested, nor does it guarantee that the parameters
mentioned in this document will perfectly match your particular environment.
3.4 How to Analyze Host Metrics Administrators will find it useful to study these suggestions on further analysis to
undertake when a metric value exceeds threshold. The commands provided are for
the Linux and Windows operating system. For Oracle Solaris and AIX, consult the
documentation for more information.
When logical free memory/swap activity or paging activity is beyond threshold
i.e. the combined value of Pages (Paged-in and Pages Paged-out) should be
<=1000:
This usually happens when memory is not sufficient to handle demands from all the
running processes.
Linux: Check “cat /proc/meminfo” and confirm total RAM is expected.
Windows: Open the Task Manager, click the Performance tab and check the
Physical Memory section.
Check if there is unallocated huge pages. If there are and the WebLogic
Server / Oracle BI instances (OBIPS, JH, OBIS) are not expected to use them,
reduce the huge page pool size.
Linux: Run top and sort by resident memory (type OQ). Look for processes
using the most resident memory and investigate those processes.
Windows: Open the Task Manager, click the Processes tab and click the Mem
Usage column to sort the processes by memory usage
When Network Interface Error Rates Is Beyond Threshold
The normal cause is mis-configuration between the host and the network switch. A
bad network card or cabling also can cause this error. You can run /sbin/ifconfig to
identify which interface is having packet errors. Contact network administrator to
ensure the host and the switch are using same data rate and duplex mode.
Otherwise, check if cabling or the network card is faulty and replace as appropriate.
36
When Packet Loss Rate Is Beyond Threshold
The normal cause of this error is network saturation of bad network hardware.
Run lsof -Pni | grep ESTAM to determine which network paths are
generating the problem. Then run mtr <target host> or ping <target host>
and look for packet lost on that segment.
20 packets transmitted, 20 received, 0% packet loss, time 18997ms
rtt min/avg/max/mdev = 0.168/0.177/0.200/0.010 ms
The packet loss should be 0% and rtt should be less than .5 ms.
Ask the network monitoring staff to look for saturation or network packet
loss from their side.
When Network Utilization Is Beyond Threshold i.e. All Network Interfaces
Combined Utilization > 95%
The normal cause is very heavy application load.
Run top or lsof to determine which processes are moving a lot of data.
Use tcpdump to sample the network for usage patterns.
Use atop, iftop, ntop or pkstat to see which processes are moving data.
When CPU Usage or Run Queue Length Is Beyond Threshold i.e. Run Queue (5
min average) > 4 (The run queue is normalized by the number of CPU cores):
The normal cause is runaway demand, a poorly performing application, or poor
capacity planning.
Linux: Run top to identify which application/process is using time.
Windows: Open the Task Manager, click the Processes tab and click the CPU
column to sort the processes based on CPU usage.
If top processes are WebLogic Server JVM processes, conduct a basic
WebLogic Server health check. That is, review logs to see if there are
configuration errors causing excessive exceptions, and review metrics to see if
the load has increased.
If top processes are Oracle BI processes, use Oracle Enterprise Manager
Control to look for BI components level statistics.
When System CPU Usage Is Beyond Threshold i.e. CPU Utilization > 95%
High system CPU use could be due to kernel processes looking for pages to
swap out during a memory shortage.
37
High system CPU use is also frequently related to various device failures.
Run {{dmesg | less}} and look for repeated messages about errors on some
particular device, and also have hardware support personnel check the
hardware console to see if there are any errors reported.
When Filesystem Usage Is Beyond Threshold i.e. Filesystem Space Available <5%
The normal cause is an application that is logging excessively or leaving behind
temporary files.
Run lsof -d 1-99999 | grep REG | sort -nrk 7 | less to see currently open
files sorted by size from largest to smallest. Investigate the large files.
Run du -k /mount_point_running_out_of_space > /tmp/sizes to get space
used for directories under the mount point. This may take a long time. While it is
running, run sort -nr /tmp/sizes and find the directories using most space and
investigate those first.
When Total Processes Is Beyond Threshold > 25000
The normal cause is runaway code or a stuck NFS filesystem.
Linux: Run ps aux. If many processes are in status D, run df to check for stuck
mounts.
Windows: Run Task Manager, click the Processes tab, and check the list of
running processes. If there are hundreds or thousands of processes of a
particular program, determine why.
Run ps o pid,nlwp,cmd | sort -nrk 2 | head to look for processes with many
threads.
When Disk Device Busy Is Beyond Threshold > 95%
Check for disk drive failure.
Linux: As root, check /var/log/messages* and /var/log/mcelog to see if there are
any error messages indicating disk failure. For a RAID array, the disk controller
needs to be checked. The commands will be specific to the controller manufacturer.
Windows: Run perfmon and look at the Alert logs. Run chkdsk to check for disk
failure.
Look for processes that are using the disk. From a shell window, execute ps aux
| grep ' D. ' several consecutive times to look for processes with "stat" D.
38
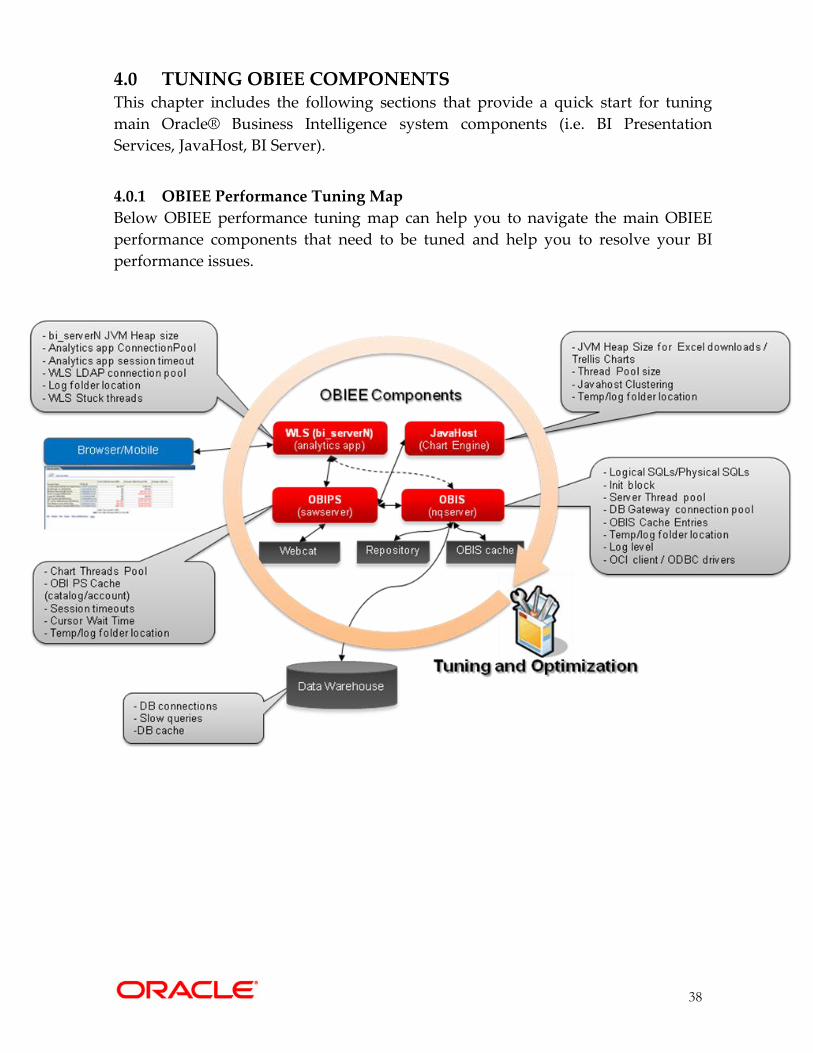
4.0 TUNING OBIEE COMPONENTS This chapter includes the following sections that provide a quick start for tuning
main Oracle® Business Intelligence system components (i.e. BI Presentation
Services, JavaHost, BI Server).
4.0.1 OBIEE Performance Tuning Map
Below OBIEE performance tuning map can help you to navigate the main OBIEE
performance components that need to be tuned and help you to resolve your BI
performance issues.
39
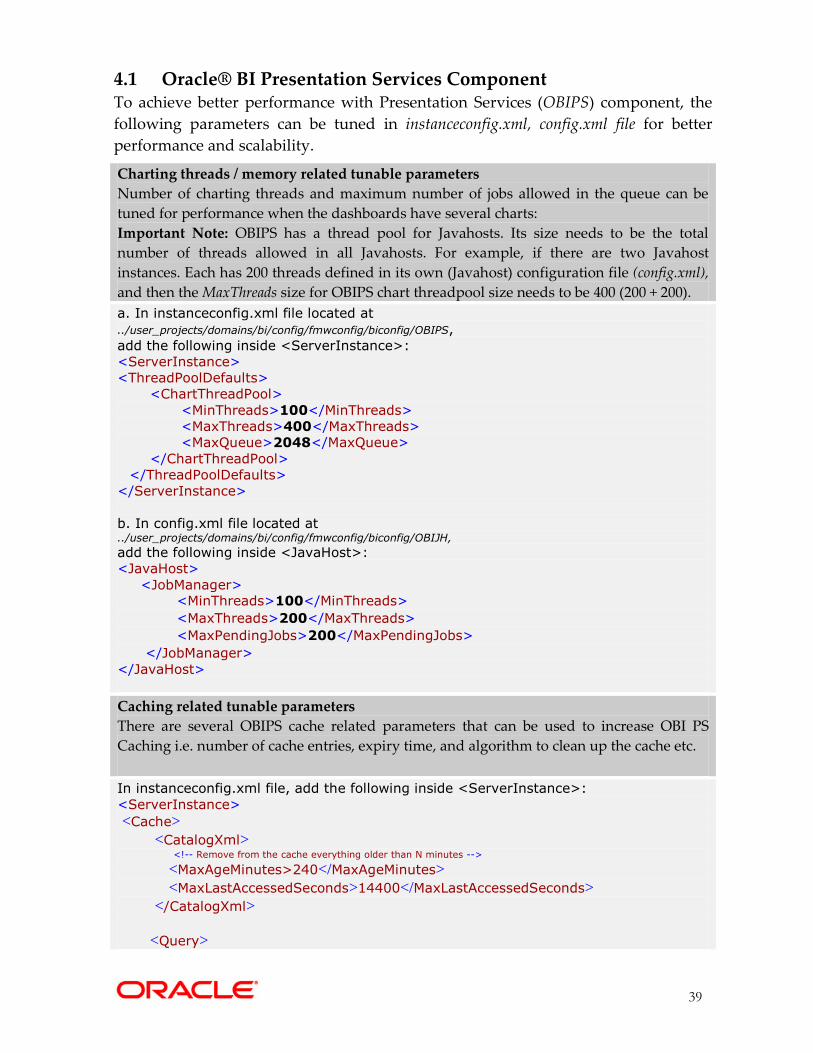
4.1 Oracle® BI Presentation Services Component To achieve better performance with Presentation Services (OBIPS) component, the
following parameters can be tuned in instanceconfig.xml, config.xml file for better
performance and scalability.
Charting threads / memory related tunable parameters
Number of charting threads and maximum number of jobs allowed in the queue can be
tuned for performance when the dashboards have several charts:
Important Note: OBIPS has a thread pool for Javahosts. Its size needs to be the total
number of threads allowed in all Javahosts. For example, if there are two Javahost
instances. Each has 200 threads defined in its own (Javahost) configuration file (config.xml),
and then the MaxThreads size for OBIPS chart threadpool size needs to be 400 (200 + 200).
a. In instanceconfig.xml file located at
../user_projects/domains/bi/config/fmwconfig/biconfig/OBIPS,
add the following inside <ServerInstance>:
<ServerInstance>
<ThreadPoolDefaults>
<ChartThreadPool>
<MinThreads>100</MinThreads>
<MaxThreads>400</MaxThreads>
<MaxQueue>2048</MaxQueue>
</ChartThreadPool>
</ThreadPoolDefaults>
</ServerInstance>
b. In config.xml file located at ../user_projects/domains/bi/config/fmwconfig/biconfig/OBIJH,
add the following inside <JavaHost>:
<JavaHost>
<JobManager> <MinThreads>100</MinThreads>
<MaxThreads>200</MaxThreads>
<MaxPendingJobs>200</MaxPendingJobs>
</JobManager>
</JavaHost>
Caching related tunable parameters
There are several OBIPS cache related parameters that can be used to increase OBI PS
Caching i.e. number of cache entries, expiry time, and algorithm to clean up the cache etc.
In instanceconfig.xml file, add the following inside <ServerInstance>:
<ServerInstance>
<Cache>
<CatalogXml> <!-- Remove from the cache everything older than N minutes -->
<MaxAgeMinutes>240</MaxAgeMinutes>
<MaxLastAccessedSeconds>14400</MaxLastAccessedSeconds>
</CatalogXml>
<Query>

40
<MaxEntries>5000</MaxEntries> <!-- AbsoluteMaxEntries is the enforced maximum number of entries. When this maximum is reached -->
<!-- subsequent queries will fail until the maximum is no longer exceeded. -->
<AbsoluteMaxEntries>20000</AbsoluteMaxEntries> <!-- CruiseEntries is amount of entries the OracleBI Presentation server tries to maintain in its cache. -->
<CruiseEntries>3000</CruiseEntries> <!-- Forces the cache to attempt to remove an old entry when MaxEntries is exceeded. -->
<ForceLRU>true</ForceLRU>
</Query>
</Cache>
</ServerInstance>
Waiting time for results
Controls how long the server waits for results after the initial request before returning the
Searching page to the browser. It may be useful to set this value higher (such as 10
seconds) to avoid page refreshes if the majority of queries are not returning in 1 second. If
running performance tests some test implementations behave properly only if this setting
is set very high (such as 1000 seconds).
In instanceconfig.xml file add the following inside <ServerInstance>:
<ServerInstance>
<Cursors>
<NewCursorWaitSeconds>10</NewCursorWaitSeconds>
</Cursors>
</ServerInstance>
OBIPS Session Timeout parameter
In Fusion Middleware Control following value (see in screenshot below) can be decreased
from 3.5 hours to free up resources: Important Note: By default in Analytics plug-in in
WLS, the Session timeout (in seconds) is set to 3600 seconds (60 minutes) to control the
timeout of the sessions. By setting OBIPS timeout to 60 minutes, it will be in sync with the
session timeout in Analytics plug-in in WLS.
Updating Catalog Objects
Scan the catalog and update any objects that were saved with earlier versions of Oracle
Business Intelligence. These updates might improve the performance of these objects. In a
multiple node cluster, update objects only after all nodes have been upgraded to the
41
appropriate version of Oracle Business Intelligence. For details on how to Use Scan and
Update Web Catalog feature documented in “Updating Catalog Objects” in System
Administrator's Guide for Oracle Business Intelligence Enterprise Edition.
Performance / Capacity Considerations for Large BI Web Catalog
Specifies the hashing of directories. If you have more than 4000 catalog users, then
you must turn on the hashing of users' home directories to address a file system
limitation. To do so, set the HashUserHomeDirectories element to 2 from its default
value of 0, see section “Manually Changing Additional Configuration Settings for the
Catalog” in System Administrator's Guide for Oracle Business Intelligence Enterprise Edition.
Important Note: Oracle recommends that you hash a catalog at creation time; however, there
are circumstances that require hashing the catalog after it is in use. Take a backup and run the
following command for more information:
- On UNIX:
runcat.sh -cmd rehash –help
- On Windows:
runcat.cmd -cmd rehash -help
It is recommended to use latest disk File System such as ZFS or EXT4.
Use fast storage system i.e. Fast NAS filer with high throughput dedicated network
link or SAN or Solid State Drive (SSD).
42
4.2 Oracle® BI Server Component Following are the important parameters to tune in NQSConfig.INI file and will
increase the performance of the BI system under high users load:
Initialization blocks
Repository init-blocks: Called once during server startup and refreshed after the
refresh interval as needed.
Session init-blocks: called for each new session; slow SQL can slow down login.
Use Allow deferred execution option. If you select this option, execution of the
initialization block is deferred until an associated session variable is accessed for
the first time during the session. This option prevents execution of all session
variable initialization blocks during the session logon stage, giving a shorter
logon time. Session variables that are not needed during the session do not have
their initialization blocks executed. This saves the resources which would have
been used to execute these unnecessary initialization blocks.
o Session init-blocks should be minimized and lazily loaded (deferred).
See “When Execution of Session Variable Initialization Blocks Cannot Be
Deferred” in Oracle® Fusion Middleware Metadata Repository Builder's
Guide for Oracle Business Intelligence Enterprise Edition.
Number of Init Blocks
For a given session, Init Block queries are executed serially and represent the per session
memory costs. Be judicious in creating Init Blocks. Verify that the same Init Block query is
not already being used in some other Init Block. Verify that cache is enabled for the Init
Block and is being utilized
Init block connection pool and location of data source
As a practice, allocate a separate DB connection pool for Init Blocks [ensure enough
connections are available] in the OBIS repository. Init Block query response time will be
high if the connection pool points to a remote database.
Init Blocks Cache
The number of Init Block result sets that are cached with respect to row-wise
initialization, can be tuned.
NQSConfig.INI parameter:
[SERVER]
INIT_BLOCK_CACHE_ENTRIES = 5000

43
BI Database Connection Pool Settings - If you anticipate a higher load on a system, you
can change the number of Maximum connections for various data sources to make
resource use more efficient. The maximum connection size needs to be set in the
repository (RPD) for each DB connection pool. The size of the connection pool determines
the number of available BI Server connections and the number of available threads for
processing physical queries. A logical query may generate multiple physical queries, each
of which could go to different connections.
Use OBIS performance counters in EM to determine if more or fewer DB connections are
required. For a simple sizing calculation, let’s assume there are peak N users concurrently
downloading dashboard pages. On average, each dashboard page executes L logical queries. On
average, each logical query executes P physical queries. Then the number of DB connections
required for this load would be N * L * P.
Important Note: If fewer connections are specified, then physical query response times will
increase.
Tuning of OBI Server session and threads
NQSConfig.INI parameters to be tuned:
[SERVER]
MAX_SESSION_LIMIT = 2000;
#Above parameters specifies the number of sessions that can be connected to BI Server
#even if inactive. The sessions and the corresponding queries are queued to the
#threads for processing as they become available. Typically, the number of sessions
#specified by MAX_SESSION_LIMIT is higher than the number of available threads
#specified by SERVER_THREAD_RANGE. Set the MAX_SESSION_LIMIT to a value
#that reflects the maximum number of users per node + 10% for sessions yet to be
#timed-out.
SERVER_THREAD_RANGE = 80-1000;
#Above parameter specifies the number of threads that process the logical queries—
#the number of queries that can be active in the BI Server at any time. When the
#number of required threads goes beyond 80, threads will be created and destroyed
#as on a demand basis. For a typical OBIEE implementation a setting of 80-1000 is
#sufficient. This value may be increased if load and stress tests prove more threads
#are beneficial for the throughput and response time of the BI Server.
DB_GATEWAY_THREAD_RANGE = 80-1000;
#The parameter DB_GATEWAY_THREAD_RANGE in the Server section of
#NQSConfig.INI establishes when Oracle BI Server terminates idle threads. The
#lower number in the range is the number of threads that are kept open before Oracle
#BI Server takes action. If the number of open threads exceeds the low point in the
#range, Oracle BI Server terminates idle threads. For example, if
#DB_GATEWAY_THREAD_RANGE is set to 80-100and 175 threads are open, Oracle
44
#BI Server terminates any idle threads back down to the 80 minimum thread limit.
See "A NQSConfig.INI File Configuration Settings" in Oracle Fusion Middleware System
Administrator's Guide for Oracle Business Intelligence Enterprise Edition.
Aggregate tables: It is extremely important to use aggregate tables to improve query
performance. Aggregate tables contain pre-calculated summarizations of data. It is much
faster to retrieve an answer from an aggregate table than to re-compute the answer from
thousands of rows of detail.
The Oracle BI Server uses aggregate tables automatically, if they have been properly
specified in the repository. See Oracle Fusion Middleware Metadata Repository Builder's Guide
for Oracle Business Intelligence Enterprise Edition for examples of setting up aggregate
navigation.
Query Plan Caching - The query plan cache is an internal performance feature that
increases the speed of the query compilation process by caching plans for the most
recently used queries.
When the Query Plan cache is hit :
o It eliminates query parsing time.
o It increases scalability due to less lock contention.
Never set the query plan cache size to 0. Doing so may cause Result Cache misses.
NQSConfig.INI parameters to be tuned:
[SERVER]
MAX_QUERY_PLAN_CACHE_ENTRIES = 1024; # default is 1024
MAX_QUERY_PLAN_CACHE_ENTRY_SIZE = 0; # 0 for default , recommended 1 MB
Check available RAM on the server and adjust above two parameters for your
workload
Note: Based on testing you need to put in the right value for your system, for more details
see "A NQSConfig.INI File Configuration Settings" in Oracle Fusion Middleware System
Administrator's Guide for Oracle Business Intelligence Enterprise Edition for more
information about query caching concepts and setup.
Query Results Caching
One of the main advantages of query caching is to improve apparent query
performance. It might be valuable to seed the cache during off hours by running
queries and hence causing the server to cache their results.
The number of cache entries and disk size limit for the cache can be configured.
These configuration parameters can be set through by Oracle Business Intelligence
Enterprise Manager.
NQSConfig.INI parameters to be tuned :
[CACHE]
ENABLE = YES;
45
MAX_ROWS_PER_CACHE_ENTRY = 100000; #Too many rows in cache can slow down performance #This Configuration setting is managed by Oracle Business Intelligence Enterprise Manager
MAX_CACHE_ENTRY_SIZE = 40 MB; #This Configuration setting is managed by Oracle Business Intelligence Enterprise Manager
MAX_CACHE_ENTRIES = 5000;
POPULATE_AGGREGATE_ROLLUP_HITS = YES;
#Above parameter specifies whether to aggregate data from earlier cached query
#results set and create a new entry in the query cache for rollup cache hits. The
#default value is NO. When this parameter is set to YES, then when a query gets an
#aggregate rollup hit, the result is put into the cache. Setting this parameter to YES might
#result in better performance, but results in more entries being added to the cache.
You can configure the Oracle BI Server to maintain a local, disk-based cache of query
result sets (query cache). The query cache allows the Oracle BI Server to satisfy many
subsequent query requests without having to access back-end data sources (such as
Oracle Database). This reduction in communication costs can dramatically decrease query
response time. See "About the Oracle BI Server Query Cache" in Oracle Fusion
Middleware System Administrator's Guide for Oracle Business Intelligence Enterprise
Edition.
Read-Only Mode - Permits or forbids changing Oracle BI repository files when the
Administration Tool is in either online or offline mode. The default is NO, meaning that
repositories can be edited.
Makes the repository read-only so that online updates cannot be made.
Increased scalability due to less lock contention
NQSConfig.INI parameters to be tuned:
[SERVER] # This Configuration setting is managed by Oracle Business Intelligence Enterprise Manager
READ_ONLY_MODE = YES;
See "A NQSConfig.INI File Configuration Settings" in Oracle Fusion Middleware System
Administrator's Guide for Oracle Business Intelligence Enterprise Edition.
Improve sort efficiency by increasing sort buffer
It helps to have the sort directory on a fast disk (e.g. a RAMDisk)
NQSConfig.INI parameters to be tuned:
[GENERAL]
WORK_DIRECTORY_PATHS = "C:\Temp"; /* /dev/shm on Linux */
#If a Memory Resident File System is not available, for optimum performance,
#temporary directories should reside on local high performance storage devices (i.e.
#SSD, SAN).
SORT_MEMORY_SIZE = 4 MB;
SORT_BUFFER_INCREMENT_SIZE = 256 KB;
46
Cluster aware Cache seeding (using nqcmd or Agent a.k.a ibot)
Seeding one node propagates across cluster
Data from shared location is pulled into local cache location during every poll
NQSConfig.INI parameters to be tuned:
[CACHE] # This Configuration setting is managed by Oracle Business Intelligence Enterprise Manager
GLOBAL_CACHE_STORAGE_PATH = "<shared directory name>" SIZE; # This Configuration setting is managed by Oracle Business Intelligence Enterprise Manager
MAX_GLOBAL_CACHE_ENTRIES = 5000;
CACHE_POLL_SECONDS = 300;
See "A NQSConfig.INI File Configuration Settings" in Oracle Fusion Middleware System
Administrator's Guide for Oracle Business Intelligence Enterprise Edition.
Increase VIRTUAL_TABLE_PAGE_SIZE
When VIRTUAL_TABLE_PAGE_SIZE is increased, I/O operations are reduced. Complex
queries may use 20 to 30 virtual tables, while simple queries may not even require virtual
tables. This parameter can be tuned depending on the number of concurrent users and
the average query complexity. NQSConfig.INI parameters to be tuned:
[GENERAL]
VIRTUAL_TABLE_PAGE_SIZE = 256 KB;
Important Note: You need to determine the optimal value for the parameter stated in
above table as part of your pre-production performance / load testing.
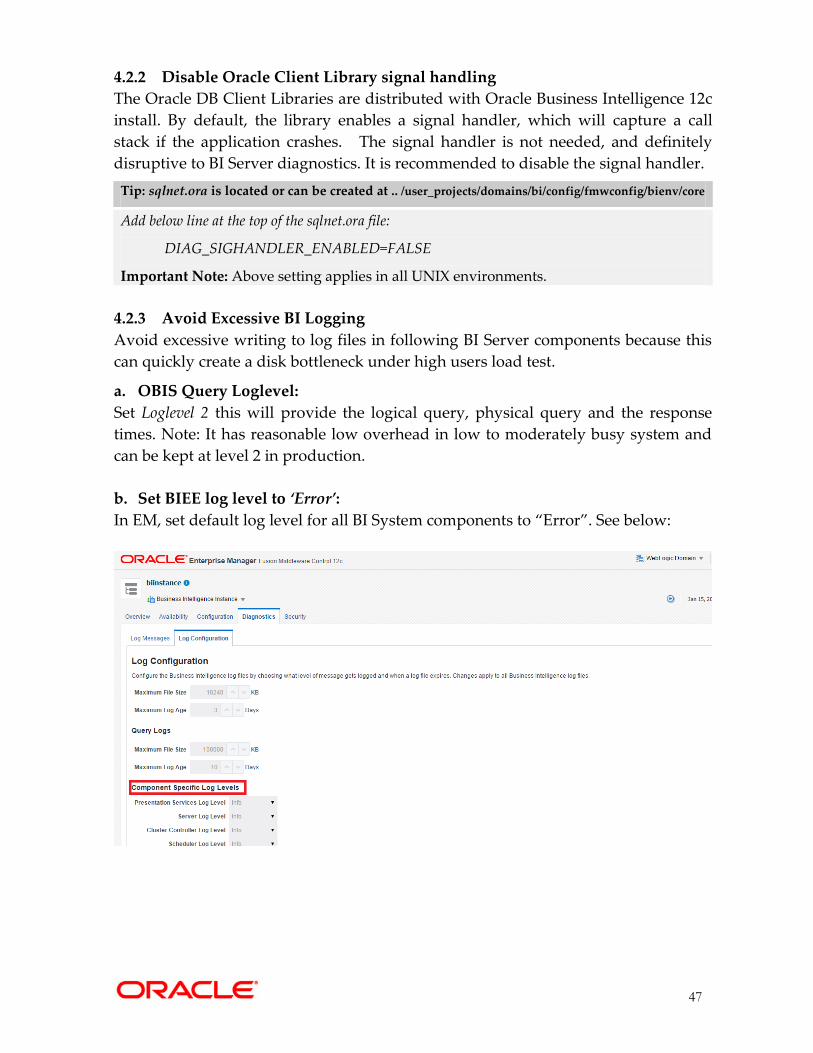
47
4.2.2 Disable Oracle Client Library signal handling
The Oracle DB Client Libraries are distributed with Oracle Business Intelligence 12c
install. By default, the library enables a signal handler, which will capture a call
stack if the application crashes. The signal handler is not needed, and definitely
disruptive to BI Server diagnostics. It is recommended to disable the signal handler.
Tip: sqlnet.ora is located or can be created at .. /user_projects/domains/bi/config/fmwconfig/bienv/core
Add below line at the top of the sqlnet.ora file:
DIAG_SIGHANDLER_ENABLED=FALSE
Important Note: Above setting applies in all UNIX environments.
4.2.3 Avoid Excessive BI Logging
Avoid excessive writing to log files in following BI Server components because this
can quickly create a disk bottleneck under high users load test.
a. OBIS Query Loglevel:
Set Loglevel 2 this will provide the logical query, physical query and the response
times. Note: It has reasonable low overhead in low to moderately busy system and
can be kept at level 2 in production.
b. Set BIEE log level to ‘Error’:
In EM, set default log level for all BI System components to “Error”. See below:
48
4.3 Oracle® JavaHost Component Following are the important parameters to tune in JavaHost config.xml and
obijh.properties files and will increase the performance for scenarios with Trellis
charts rendering and export to excel downloads.
4.3.1 Tuning Exporting Large Data Sets to Microsoft Excel
To improve export to excel download time, it is recommended to perform following
fine tuning for the JavaHost process.
Important Note: To avoid potential system performance issues, below tuning values for
JavaHost parameters should be set only after considering the nature of the Excel download
workload along with available system memory capacity.
Java Virtual Machine Settings
In obijh.properties file located at ORACLE_HOME/bi/modules/oracle.bi.cam.obijh/env/, for
Javahost (64bit) set heap size to -server –Xmx8g. In following section of obijh.properties file,
increase the heap size to 8GB for 64bit JavaHost process:
OBIJH_ARGS=-server -Xms8g -Xmx8g -XX:PermSize=512m -
XX:MaxPermSize=512m -XX:+UseG1GC -XX:MaxGCPauseMillis=500 …
Set 0 for XMLP tag in JavaHost configuration file to handle large data
Navigate to the ../user_projects/domains/bi/config/fmwconfig/biconfig/OBIJH folder.
In the config.xml file, configure the XMLP tag for large data as follows: <XMLP>
<InputStreamLimitInKB>0</InputStreamLimitInKB>
<ReadRequestBeforeProcessing>false</ReadRequestBeforeProcessing>
</XMLP>
Important Note: Setting InputStreamLimitInKB parameter value to zero (0), which is
unlimited, should only be used for testing. Set the value to something reasonable that
works with your large data sets. The default is 8192 (8MB), but you may need to increase it
to 16384 (16MB), 32768 (32MB) etc.
Move temporary files locations for JavaHost / OBIPS to fast storage
At least 4.5GB of free temporary space is required for single user export (126821 rows and
90 columns), multiplied by the number of concurrent users who will export such large
reports at the same time. Note: the temp file size will be improved in future BI patch sets.
For JavaHost the default location for temporary files location is in /tmp and for OBIPS the
default location for temporary folder is in
../user_projects/domains/bi/system_components/OBIJH/obijh1/tmp sub-folders.
Important Note: As temporary files locations are highly used by JavaHost / OBIPS
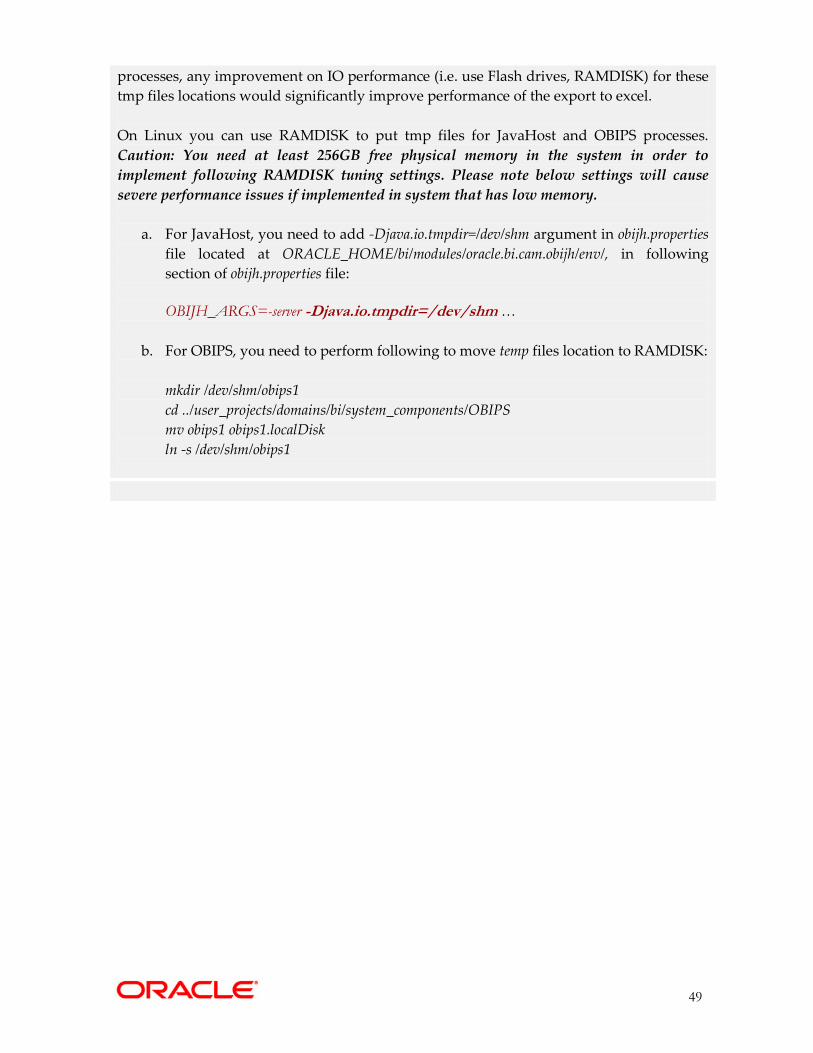
49
processes, any improvement on IO performance (i.e. use Flash drives, RAMDISK) for these
tmp files locations would significantly improve performance of the export to excel.
On Linux you can use RAMDISK to put tmp files for JavaHost and OBIPS processes.
Caution: You need at least 256GB free physical memory in the system in order to
implement following RAMDISK tuning settings. Please note below settings will cause
severe performance issues if implemented in system that has low memory.
a. For JavaHost, you need to add -Djava.io.tmpdir=/dev/shm argument in obijh.properties
file located at ORACLE_HOME/bi/modules/oracle.bi.cam.obijh/env/, in following
section of obijh.properties file:
OBIJH_ARGS=-server -Djava.io.tmpdir=/dev/shm …
b. For OBIPS, you need to perform following to move temp files location to RAMDISK:
mkdir /dev/shm/obips1
cd ../user_projects/domains/bi/system_components/OBIPS
mv obips1 obips1.localDisk
ln -s /dev/shm/obips1
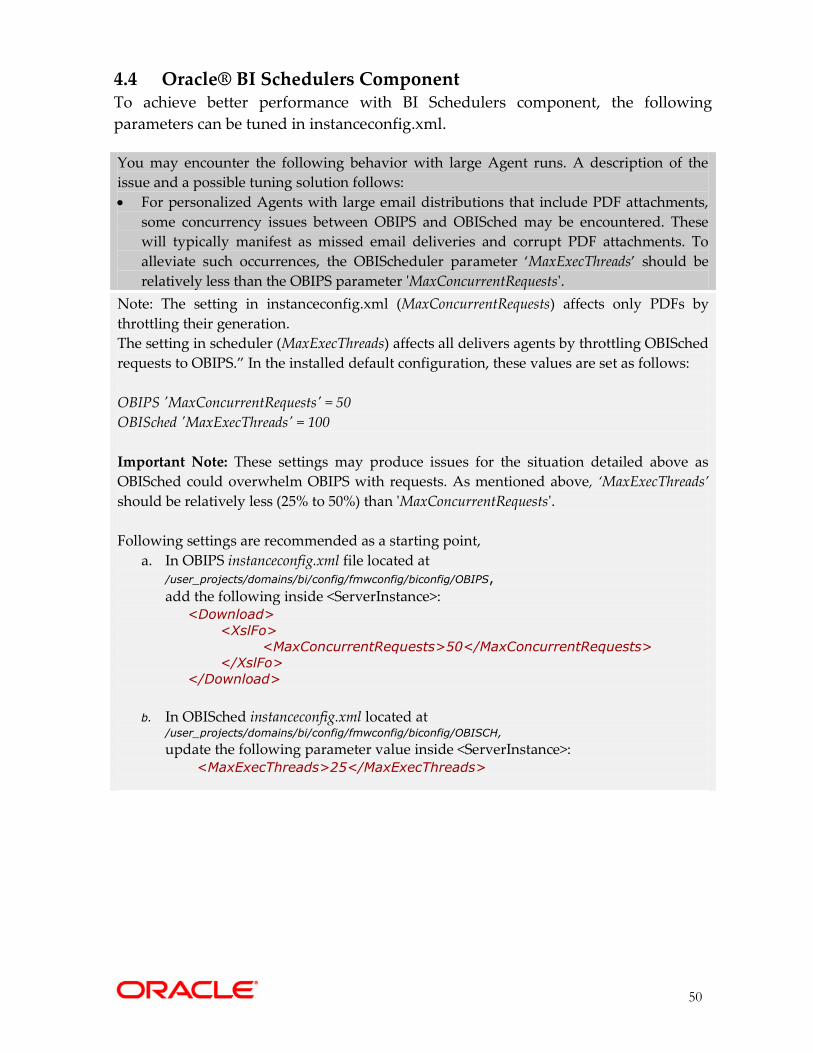
50
4.4 Oracle® BI Schedulers Component To achieve better performance with BI Schedulers component, the following
parameters can be tuned in instanceconfig.xml.
You may encounter the following behavior with large Agent runs. A description of the
issue and a possible tuning solution follows:
For personalized Agents with large email distributions that include PDF attachments,
some concurrency issues between OBIPS and OBISched may be encountered. These
will typically manifest as missed email deliveries and corrupt PDF attachments. To
alleviate such occurrences, the OBIScheduler parameter ‘MaxExecThreads’ should be
relatively less than the OBIPS parameter 'MaxConcurrentRequests'.
Note: The setting in instanceconfig.xml (MaxConcurrentRequests) affects only PDFs by
throttling their generation.
The setting in scheduler (MaxExecThreads) affects all delivers agents by throttling OBISched
requests to OBIPS.” In the installed default configuration, these values are set as follows:
OBIPS 'MaxConcurrentRequests' = 50
OBISched 'MaxExecThreads' = 100
Important Note: These settings may produce issues for the situation detailed above as
OBISched could overwhelm OBIPS with requests. As mentioned above, ‘MaxExecThreads’
should be relatively less (25% to 50%) than 'MaxConcurrentRequests'.
Following settings are recommended as a starting point,
a. In OBIPS instanceconfig.xml file located at /user_projects/domains/bi/config/fmwconfig/biconfig/OBIPS, add the following inside <ServerInstance>:
<Download>
<XslFo>
<MaxConcurrentRequests>50</MaxConcurrentRequests>
</XslFo>
</Download>
b. In OBISched instanceconfig.xml located at /user_projects/domains/bi/config/fmwconfig/biconfig/OBISCH,
update the following parameter value inside <ServerInstance>: <MaxExecThreads>25</MaxExecThreads>

51
4.5 Vertically Scale Presentation Services / JavaHost / BIServer
Components Before increasing the number of Presentation Services, Javahost and BI Server per
server, make sure you have enough system resources available on servers and
during performance / load testing exercise, adjust as needed. To achieve stable BI
system under load, better scalability and an even BI performance over time, you
should at least set two Presentation Services per server, two Javahost per server and
two BI Server per server.
Tip: For complete details on how to vertically scale components in Oracle Business
Intelligence 12c, refer to documentation link 3.3 Managing Capacity in Oracle
Business Intelligence (Vertically Scaling)
4.6 Configure The External Subject Area (XSA) Cache For Data
Blending| Mashup Data Blending is a new Concept in OBIEE 12c where you can blend your own data
with corporate data External Subject Area Cache aka XSA Cache: New Mechanism
for caching Excel Files for Data Mash ups in Databases. Enabling XSA Cache will
help improving the performance of uploaded content.
Refer to support note at
https://support.oracle.com/epmos/faces/DocumentDisplay?id=2087801.1 for steps required
for configuring External Subject Area Cache for Data Blending
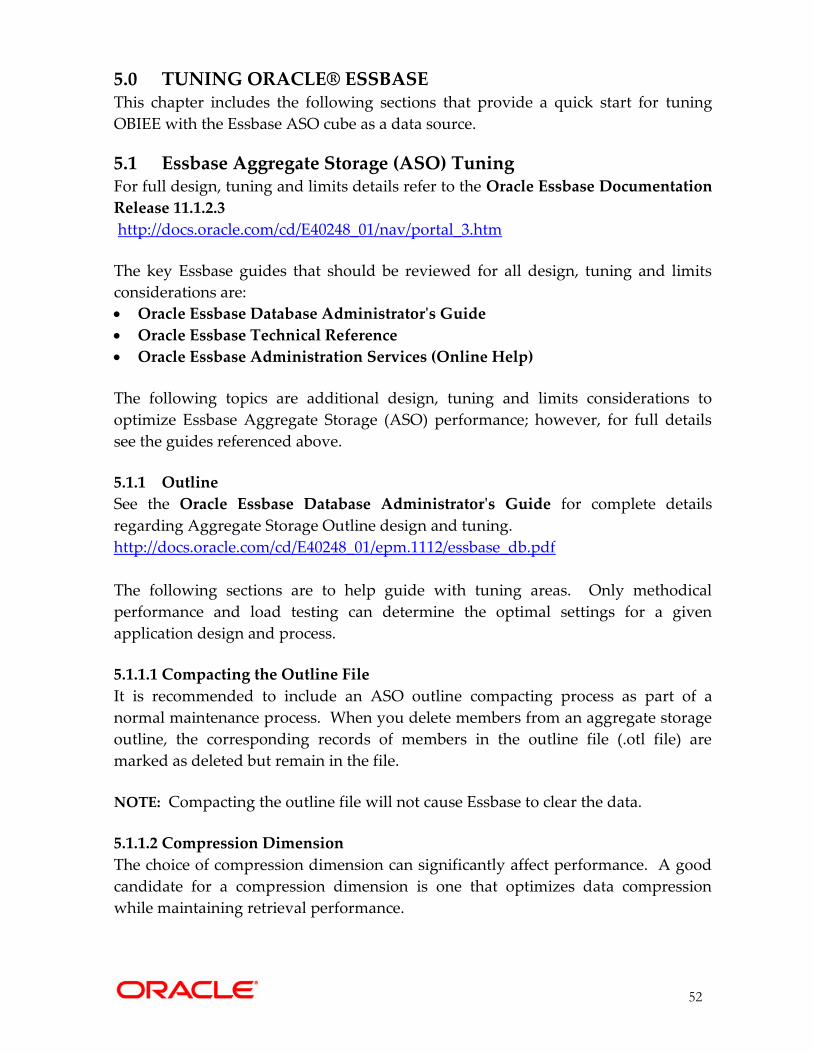
52
5.0 TUNING ORACLE® ESSBASE This chapter includes the following sections that provide a quick start for tuning
OBIEE with the Essbase ASO cube as a data source.
5.1 Essbase Aggregate Storage (ASO) Tuning For full design, tuning and limits details refer to the Oracle Essbase Documentation
Release 11.1.2.3
http://docs.oracle.com/cd/E40248_01/nav/portal_3.htm
The key Essbase guides that should be reviewed for all design, tuning and limits
considerations are:
Oracle Essbase Database Administrator's Guide
Oracle Essbase Technical Reference
Oracle Essbase Administration Services (Online Help)
The following topics are additional design, tuning and limits considerations to
optimize Essbase Aggregate Storage (ASO) performance; however, for full details
see the guides referenced above.
5.1.1 Outline
See the Oracle Essbase Database Administrator's Guide for complete details
regarding Aggregate Storage Outline design and tuning.
http://docs.oracle.com/cd/E40248_01/epm.1112/essbase_db.pdf
The following sections are to help guide with tuning areas. Only methodical
performance and load testing can determine the optimal settings for a given
application design and process.
5.1.1.1 Compacting the Outline File
It is recommended to include an ASO outline compacting process as part of a
normal maintenance process. When you delete members from an aggregate storage
outline, the corresponding records of members in the outline file (.otl file) are
marked as deleted but remain in the file.
NOTE: Compacting the outline file will not cause Essbase to clear the data.
5.1.1.2 Compression Dimension
The choice of compression dimension can significantly affect performance. A good
candidate for a compression dimension is one that optimizes data compression
while maintaining retrieval performance.

53
Another consideration when choosing a compression dimension is how well it is
expected to compress the database. The size of the compressed database changes
depending on which dimension is tagged as compression.
Selecting the best compression dimension requires methodical testing to ensure the
appropriate setting is selected for a given design, process and data distribution.
NOTE: Changing the compression dimension triggers a full restructure of the
database.
5.1.1.3 Dynamic Calculations Log Messages
The Essbase ASO application log has some informative messages related to dynamic
calculations that can be helpful with tuning.
The following message indicates that the ASO optimization member needs more
memory to process the MDX member formulas. In this case, consider adding
MAXFORMULACACHESIZE configuration setting to the Essbase.cfg file.
Not enough memory for formula execution. Set MAXFORMULACACHESIZE
configuration parameter to [xxxx] KB and try again.
For additional information on ASO dynamic calculation log messages, see the CEAL
blog post https://blogs.oracle.com/pa/entry/epm_11_1_2_understanding
5.1.1.4 MDX Outline Formulas See the Oracle Essbase Technical Reference for complete details regarding Aggregate
Storage MDX Outline Formulas.
http://docs.oracle.com/cd/E40248_01/epm.1112/essbase_tech_ref.pdf
The NONEMPTYMEMBER and NONEMPTYTUPLE properties enable MDX in
Essbase to query on large sets of members or tuples while skipping formula
execution on non-contributing values that contain only #MISSING data. Because
large sets tend to be very sparse, only a few members contribute to the input
member (have non #MISSING values) and are returned. As a result, the use of
NONEMPTYMEMBER and NONEMPTYTUPLE in calculated members and
formulas conserves memory resources, allowing for better scalability, especially in
concurrent user environments.
Example: Tuning MDX formula using a NON EMPTY directive:
1. The measure member [Units] is a loaded value
2. The measure member [Avg. Units/Transaction] is calculated using formula
[Avg. Units/Transaction] = [Units]/[Transactions]
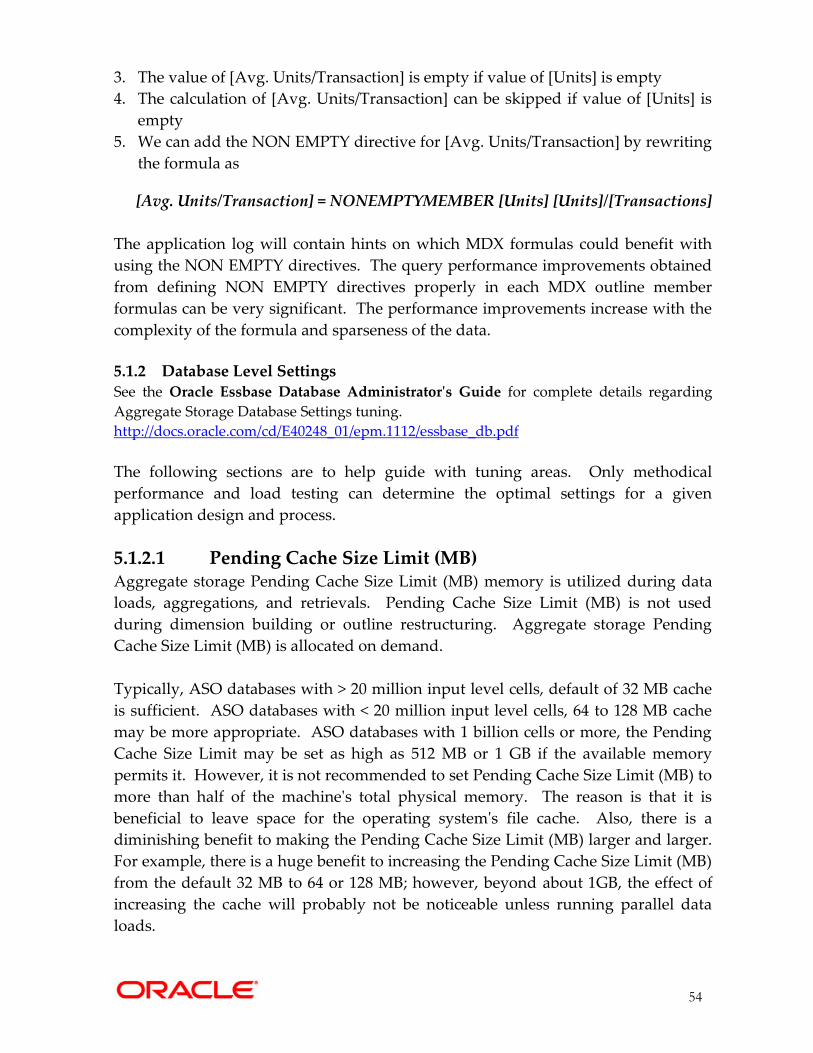
54
3. The value of [Avg. Units/Transaction] is empty if value of [Units] is empty
4. The calculation of [Avg. Units/Transaction] can be skipped if value of [Units] is
empty
5. We can add the NON EMPTY directive for [Avg. Units/Transaction] by rewriting
the formula as
[Avg. Units/Transaction] = NONEMPTYMEMBER [Units] [Units]/[Transactions]
The application log will contain hints on which MDX formulas could benefit with
using the NON EMPTY directives. The query performance improvements obtained
from defining NON EMPTY directives properly in each MDX outline member
formulas can be very significant. The performance improvements increase with the
complexity of the formula and sparseness of the data.
5.1.2 Database Level Settings See the Oracle Essbase Database Administrator's Guide for complete details regarding
Aggregate Storage Database Settings tuning.
http://docs.oracle.com/cd/E40248_01/epm.1112/essbase_db.pdf
The following sections are to help guide with tuning areas. Only methodical
performance and load testing can determine the optimal settings for a given
application design and process.
5.1.2.1 Pending Cache Size Limit (MB) Aggregate storage Pending Cache Size Limit (MB) memory is utilized during data
loads, aggregations, and retrievals. Pending Cache Size Limit (MB) is not used
during dimension building or outline restructuring. Aggregate storage Pending
Cache Size Limit (MB) is allocated on demand.
Typically, ASO databases with > 20 million input level cells, default of 32 MB cache
is sufficient. ASO databases with < 20 million input level cells, 64 to 128 MB cache
may be more appropriate. ASO databases with 1 billion cells or more, the Pending
Cache Size Limit may be set as high as 512 MB or 1 GB if the available memory
permits it. However, it is not recommended to set Pending Cache Size Limit (MB) to
more than half of the machine's total physical memory. The reason is that it is
beneficial to leave space for the operating system's file cache. Also, there is a
diminishing benefit to making the Pending Cache Size Limit (MB) larger and larger.
For example, there is a huge benefit to increasing the Pending Cache Size Limit (MB)
from the default 32 MB to 64 or 128 MB; however, beyond about 1GB, the effect of
increasing the cache will probably not be noticeable unless running parallel data
loads.
55
Tuning Pending Cache Size Limit (MB) requires methodical testing to ensure the
appropriate setting is selected for a given design, process and data distribution.
5.1.2.2 Retrieval Buffer Size
The retrieval buffers are a server buffer per database that holds extracted row data
cells per user query. When the retrieval buffer is full, the rows are processed and
the buffer is reused. If these buffers are too small, frequent reuse of the area can
increase retrieval times. If these buffers are too large, too much memory may be
used when concurrent users perform queries while also increasing retrieval times.
Important Note: It is recommended to start with default values and incrementally
increase during load testing using the largest user reports. Since this setting is per
user report request, it may lead to wasted memory so only set to what is needed.
Also note the retrieval buffers are allocated per thread. Oracle recommends that you
do not exceed 100 KB, although the size limit is set at 100,000 KB.
5.1.3 Data Load
See the Oracle Essbase Database Administrator's Guide for complete details
regarding Aggregate Storage Data Load tuning.
http://docs.oracle.com/cd/E40248_01/epm.1112/essbase_db.pdf
The following sections are to help guide with tuning areas. Only methodical
performance and load testing can determine the optimal settings for a given
application design and process.
5.1.3.1 Incremental Data Updates
When performing incremental updates to an Essbase Aggregate Storage (ASO)
outline, depending on the nature of the incremental updates, could trigger either a
full or light outline restructure.
For additional information on ASO incremental data updates, see the CEAL blog
post https://blogs.oracle.com/pa/entry/essbase_aggregate_storage_aso_incremental
5.1.3.2 Merge Data Slices
When performing an Aggregate Storage (ASO) application copy, it is necessary to
merge all data slices first so that all data in the ASO application will be copied
properly. For additional information on ASO merging data slices before copying an
ASO application, see the CEAL blog post
https://blogs.oracle.com/pa/entry/merge_data_slices_before_copying
56
5.1.3.3 Table Space
The ASO kernel stores data in two different table spaces, “default” and “temp.” The
“default” table space is used to store cube cells, both level zero input cells and
aggregated cells. The “temp” table space is used for intermediate storage of cells
during data load, aggregation, and large queries. There could be data load
improvement by separating the two table spaces into two difference physical drives.
5.1.4 Aggregation
See the Oracle Essbase Database Administrator's Guide for complete details
regarding Aggregate Storage Aggregate Views tuning.
http://docs.oracle.com/cd/E40248_01/epm.1112/essbase_db.pdf
The following sections are to help guide with tuning areas. Only methodical
performance and load testing can determine the optimal settings for a given
application design and process.
5.1.4.1 Aggregation Methods
The default selection of aggregate views proposed by Essbase provides excellent
performance for most ASO applications. To optimize aggregations for different
database retrieval situations, such as for generating reports or user queries, you may
need to repeat the tuning process, creating an aggregation script for each situation.
There are several aggregate view options in EAS Console and MaxL that should be
methodically tested to ensure the appropriate aggregation view option is selected
for a given design, process and data distribution.
Refer to the Oracle Essbase Database Administrator's Guide and Oracle Essbase
Technical Reference to review these areas:
Default Aggregation Option
Stopping When Total_Size Exceeds a Certain Size Option
Enable Alternate_Rollups Option
Query Tracker Enabled Option
ASOSAMPLESIZEPERCENT Essbase.cfg setting to control the views generated
more efficiently
5.1.5 Essbase.cfg Settings See the Oracle Essbase Technical Reference for a complete list of configuration
settings that apply to Aggregate Storage applications.
http://docs.oracle.com/cd/E40248_01/epm.1112/essbase_tech_ref.pdf
57
The following sections are to help guide with tuning areas. Only methodical
performance and load testing can determine the optimal settings for a given
application design and process.
5.1.5.1 Suggested ASO CFG Settings to Review:
CFG Setting
SERVERTHREADS 200
AGENTTHREADS 50
AGTSVRCONNECTIONS 10
Important Note: It is not recommended to set above parameters too high unless necessary.
Should increase above parameters values for BI SmartView to support high users load.
For additional information on these settings, see the blog post
https://blogs.oracle.com/pa/entry/essbase_11_1_2_agtsvrconnections
;NETDELAY ;It is recommended to use default value (200)*
;NETRETRYCOUNT ;It is recommended to use default value (600)*
For additional information on these settings, see the blog post
https://blogs.oracle.com/pa/entry/epm_11_1_2_in2
NO_HOSTNAME_LISTCONNECT TRUE
For additional information on this setting, see the blog post
https://blogs.oracle.com/pa/entry/epm_11_1_2_add
ASOSAMPLESIZEPERCENT For additional information on this settings, see the blog
post
https://blogs.oracle.com/pa/entry/epm_11_1_2_aasosamplesizepe
rcent
MAXFORMULACACHESIZE http://docs.oracle.com/cd/E40248_01/epm.1112/essbase_tech_ref/
maxformulacachesize.html
It is recommended that the default value be used than incrementally increase the value
during methodical performance and load testing to find the best setting. It is strongly
recommended to not randomly set Essbase configuration setting values high
without understanding what the setting does and how it works. Also, methodical
testing will uncover issues with higher then needed settings. For instances, it is
recommended to set the NETDELAY / NETRETRYCOUNT timeout settings to
default values, which is 2 minutes. If need be, the max amount of timeout that is
recommended should not be above 5 minutes. The reason is because there have been
customers reporting Essbase “hangs”; However, technically there is no “hang” until
this “hang” exceeds the NETDELAY / NETRETRYCOUNT settings. Meaning, if
timeout is set to 17 minutes and the “hang” resolved in 10 minutes, this would not
be considered a “hang” until the hang was longer than 17 minutes. At this point, an
investigation into what processes are taking that long should be done.
58
Best Practices Guide for Tuning Oracle® Business Intelligence Enterprise Edition
Applies To: Oracle Business Intelligence 12c (12.2.1)
First edition: February 2016
Author: Ahmed Awan
Oracle® Customer Engineering & Advocacy Lab - CEAL Team @ http://blogs.oracle.com/pa
Change Record
Oracle® Corporation
World Headquarters
500 Oracle® Parkway
Redwood Shores, CA 94065
U.S.A.
Worldwide Inquiries:
Phone: +1.650.506.7000
Fax: +1.650.506.7200
www.Oracle®.com
Oracle® is a registered trademark of Oracle® Corporation. Various
product and service names referenced herein may be trademarks
of Oracle® Corporation. All other product and service names
mentioned may be trademarks of their respective owners.
Copyright © 2016 Oracle® Corporation
All rights reserved.
Date Primary Author Version Change Reference
02/2016 Ahmed Awan 1.0 First edition