oracle · 1configure performance reporting for projects 1 ... run the generate kpi values process...
TRANSCRIPT
OracleProject Portfolio Management CloudUsing Project Performance Reporting
Release 13 (update 18B)
Oracle Project Portfolio Management CloudUsing Project Performance Reporting
Release 13 (update 18B)Part Number E94696-05Copyright © 2011-2018, Oracle and/or its affiliates. All rights reserved.
Authors: Sandeep Pillai, Soham Chakraborty
This software and related documentation are provided under a license agreement containing restrictions on use and disclosure and are protected byintellectual property laws. Except as expressly permitted in your license agreement or allowed by law, you may not use, copy, reproduce, translate, broadcast,modify, license, transmit, distribute, exhibit, perform, publish, or display any part, in any form, or by any means. Reverse engineering, disassembly, ordecompilation of this software, unless required by law for interoperability, is prohibited.
The information contained herein is subject to change without notice and is not warranted to be error-free. If you find any errors, please report them tous in writing.
If this is software or related documentation that is delivered to the U.S. Government or anyone licensing it on behalf of the U.S. Government, then thefollowing notice is applicable:
U.S. GOVERNMENT END USERS: Oracle programs, including any operating system, integrated software, any programs installed on the hardware, and/or documentation, delivered to U.S. Government end users are "commercial computer software" pursuant to the applicable Federal Acquisition Regulationand agency-specific supplemental regulations. As such, use, duplication, disclosure, modification, and adaptation of the programs, including any operatingsystem, integrated software, any programs installed on the hardware, and/or documentation, shall be subject to license terms and license restrictionsapplicable to the programs. No other rights are granted to the U.S. Government.
This software or hardware is developed for general use in a variety of information management applications. It is not developed or intended for use inany inherently dangerous applications, including applications that may create a risk of personal injury. If you use this software or hardware in dangerousapplications, then you shall be responsible to take all appropriate fail-safe, backup, redundancy, and other measures to ensure its safe use. OracleCorporation and its affiliates disclaim any liability for any damages caused by use of this software or hardware in dangerous applications.
Oracle and Java are registered trademarks of Oracle and/or its affiliates. Other names may be trademarks of their respective owners.
Intel and Intel Xeon are trademarks or registered trademarks of Intel Corporation. All SPARC trademarks are used under license and are trademarks orregistered trademarks of SPARC International, Inc. AMD, Opteron, the AMD logo, and the AMD Opteron logo are trademarks or registered trademarks ofAdvanced Micro Devices. UNIX is a registered trademark of The Open Group.
This software or hardware and documentation may provide access to or information about content, products, and services from third parties. OracleCorporation and its affiliates are not responsible for and expressly disclaim all warranties of any kind with respect to third-party content, products, andservices unless otherwise set forth in an applicable agreement between you and Oracle. Oracle Corporation and its affiliates will not be responsible for anyloss, costs, or damages incurred due to your access to or use of third-party content, products, or services, except as set forth in an applicable agreementbetween you and Oracle.
The business names used in this documentation are fictitious, and are not intended to identify any real companies currently or previously in existence.
Oracle Project Portfolio Management CloudUsing Project Performance Reporting
Contents
Preface i
1 Configure Performance Reporting for Projects 1Tolerance Percentage: Explained .............................................................................................................................. 1
Summarized Financial Plan Types: Explained ............................................................................................................ 1
Performance Trend Indicators: Explained .................................................................................................................. 2
KPI Threshold Levels with Different Currencies: Explained ........................................................................................ 3
FAQs for Configure Performance Reporting for Projects ........................................................................................... 3
2 Update Project Performance Data and Generate KPIs 5Performance Data Summarization: How It's Processed ............................................................................................ 5
KPI Components: How They Work Together ............................................................................................................ 7
KPI Values: How They're Generated ......................................................................................................................... 9
KPI Trends: How They're Calculated ...................................................................................................................... 11
Calculating Current, Prior Period, and Prior Quarter KPI Values: Examples .............................................................. 14
FAQs for Update Project Performance Data and Generate KPIs ............................................................................. 17
3 Analyze Project Performance 21Analyzing Project Performance Using the Project Management Dashboard: Points to Consider ............................... 21
Analyze Project Management .................................................................................................................................. 24
Performance Status for Tasks and Resources: How It's Calculated ........................................................................ 27
FAQs for Analyze Project Performance ................................................................................................................... 29
FAQs for Review Project Comparison Graphs ......................................................................................................... 30
FAQs for Review KPI Watchlist Analysis ................................................................................................................. 31
FAQs for Review KPI Historical Trending ................................................................................................................ 32
FAQs for Review Project Financial Performance ...................................................................................................... 33
FAQs for Perform Task and Resource Level Analysis .............................................................................................. 34

Oracle Project Portfolio Management CloudUsing Project Performance Reporting
Oracle Project Portfolio Management CloudUsing Project Performance Reporting
Preface
i
PrefaceThis preface introduces information sources that can help you use the application.
Using Oracle Applications
Using Applications HelpUse help icons to access help in the application. If you don't see any help icons on your page, click your user imageor name in the global header and select Show Help Icons. Not all pages have help icons. You can also access OracleApplications Help.
Watch: This video tutorial shows you how to find help and use help features.
You can also read Using Applications Help.
Additional Resources
• Community: Use Oracle Cloud Customer Connect to get information from experts at Oracle, the partnercommunity, and other users.
• Guides and Videos: Go to the Oracle Help Center to find guides and videos.
• Training: Take courses on Oracle Cloud from Oracle University.
ConventionsThe following table explains the text conventions used in this guide.
Convention Meaning
boldface Boldface type indicates user interface elements, navigation paths, or values you enter or select.
monospace Monospace type indicates file, folder, and directory names, code examples, commands, and URLs.
> Greater than symbol separates elements in a navigation path.
Documentation AccessibilityFor information about Oracle's commitment to accessibility, visit the Oracle Accessibility Program website.
Videos included in this guide are provided as a media alternative for text-based help topics also available in this guide.
Oracle Project Portfolio Management CloudUsing Project Performance Reporting
Preface
ii
Contacting Oracle
Access to Oracle SupportOracle customers that have purchased support have access to electronic support through My Oracle Support. Forinformation, visit My Oracle Support or visit Accessible Oracle Support if you are hearing impaired.
Comments and SuggestionsPlease give us feedback about Oracle Applications Help and guides! You can send an e-mail to:[email protected].
Oracle Project Portfolio Management CloudUsing Project Performance Reporting
Chapter 1Configure Performance Reporting for Projects
1
1 Configure Performance Reporting forProjects
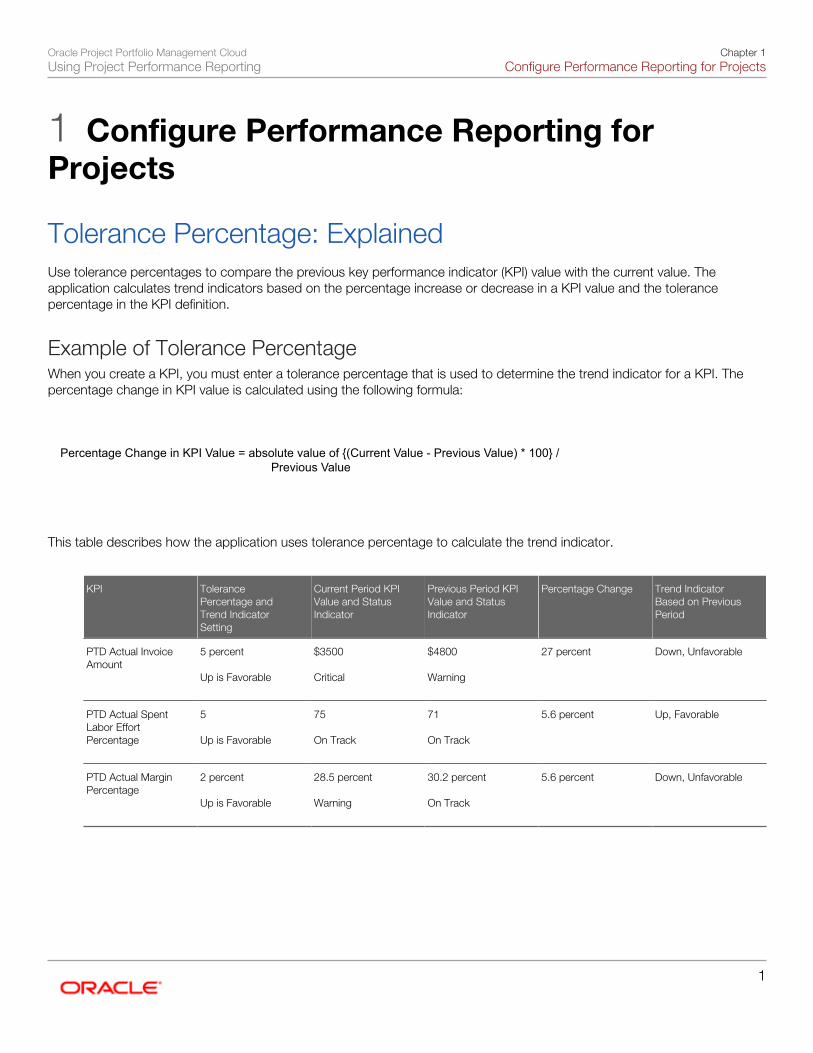
Tolerance Percentage: ExplainedUse tolerance percentages to compare the previous key performance indicator (KPI) value with the current value. Theapplication calculates trend indicators based on the percentage increase or decrease in a KPI value and the tolerancepercentage in the KPI definition.
Example of Tolerance PercentageWhen you create a KPI, you must enter a tolerance percentage that is used to determine the trend indicator for a KPI. Thepercentage change in KPI value is calculated using the following formula:
Percentage Change in KPI Value = absolute value of {(Current Value - Previous Value) * 100} / Previous Value
This table describes how the application uses tolerance percentage to calculate the trend indicator.
KPI TolerancePercentage andTrend IndicatorSetting
Current Period KPIValue and StatusIndicator
Previous Period KPIValue and StatusIndicator
Percentage Change Trend IndicatorBased on PreviousPeriod
PTD Actual InvoiceAmount
5 percent Up is Favorable
$3500 Critical
$4800 Warning
27 percent
Down, Unfavorable
PTD Actual SpentLabor EffortPercentage
5 Up is Favorable
75 On Track
71 On Track
5.6 percent
Up, Favorable
PTD Actual MarginPercentage
2 percent Up is Favorable
28.5 percent Warning
30.2 percent On Track
5.6 percent
Down, Unfavorable

Oracle Project Portfolio Management CloudUsing Project Performance Reporting
Chapter 1Configure Performance Reporting for Projects
2
Summarized Financial Plan Types: ExplainedSummarized financial plan types are financial plan types whose previous and current approved versions (for forecasts) ororiginal and current baseline versions (for budgets) are used in summarization of project performance data.
Particular financial plan types are included in summarization by default, while you must manually select others.
Default Financial Plan TypesApproved forecast and baseline budget versions of the following financial plan types are automatically included insummarization of project performance data:
• Approved Revenue Budget
• Approved Cost Budget
• Primary Revenue Forecast
• Primary Cost Forecast
A budget or forecast financial plan type may support both cost and revenue in one version.
User-Selected Financial Plan TypesApart from the default financial plan types, you can include up to four others in summarization of project performance data.
Tip: You can include a financial plan type before it's used on a project for creating a version.
You can replace a user-selected financial plan type until project performance data is summarized for reporting. After that, youcan only disable the financial plan type to exclude it from further summarization.
Related Topics• Performance Data Summarization: How It's Processed
Performance Trend Indicators: ExplainedProject performance trend indicators show whether project performance is favorable or unfavorable. You can view thefollowing types of trends:
• Up, favorable: Indicates that an increasing KPI value is favorable to the project.
• Up, unfavorable: Indicates that an increasing KPI value is unfavorable to the project.
• Down, favorable: Indicates that a decreasing KPI value is favorable to the project.
• Down, unfavorable: Indicates that a decreasing KPI value is unfavorable to the project.
• Unchanged: Indicates that there is no change to the KPI value.
You can change the default sort order of the trend indicators using the Manage Trend Indicators setup task. You can set upKPIs with the most unfavorable trend to appear first on the list in the KPI Watchlist on the Project Performance dashboard.
Oracle Project Portfolio Management CloudUsing Project Performance Reporting
Chapter 1Configure Performance Reporting for Projects
3
Run the Generate KPI Values process after updating project performance data to see the latest information in the ProjectPerformance dashboard.
Tip: Enable the reporting option in the Manage Project Units page to generate KPI values automatically afterupdating project performance data.
KPI Threshold Levels with Different Currencies: ExplainedYou can set up different threshold ranges for each currency for currency-based KPIs to ensure that the thresholds apply for aparticular currency amount.
Example of Threshold Levels with Different CurrenciesThe following example describes setting up of different threshold levels for each currency.
Vision Corporation sells and installs human resource software. A standard KPI used for installation projects is Period-to-Date(PTD) Invoice Amount. Projects are executed in different countries having different project and ledger currencies, such asUnited States dollars (USD), Japanese yen (JPY), and Indian rupees (INR).
The PTD invoice amount for projects with a ledger currency of USD is critical if the value is between 0 and 3,000 USD.The PTD invoice amount for projects with a ledger currency of INR is critical if the value is between 0 and 50,000 INR. Thecurrency thresholds are independent of currency conversion.
FAQs for Configure Performance Reporting for Projects
Can I specify the budgets and forecasts to include in summarization?Certain financial plan types are included in summarization by default, while you must manually select others. Approvedforecast and baseline budget versions of the following financial plan types are automatically included in summarization ofproject performance data:
• Approved Revenue Budget
• Approved Cost Budget
• Primary Revenue Forecast
• Primary Cost Forecast
Apart from the default financial plan types, you can include up to four others in summarization of project performance data.
Can I replace a financial plan type that is enabled for summarizationon a project?Yes. You can change the financial plan type before project performance data is summarized for reporting.
Oracle Project Portfolio Management CloudUsing Project Performance Reporting
Chapter 1Configure Performance Reporting for Projects
4
Can I choose the regions to appear on Project PerformanceReporting dashboard?Yes. Select the Edit Current Page link in the Personalization menu to show or hide regions. You can also modify thearrangement of the region layouts using the Change Layout option.
Can I select the columns to appear in the Project PerformanceReporting dashboard tables?Yes. The View menu in the region gives you options to add or remove columns in a region.
Oracle Project Portfolio Management CloudUsing Project Performance Reporting
Chapter 2Update Project Performance Data and Generate KPIs
5
2 Update Project Performance Data andGenerate KPIs
Performance Data Summarization: How It's ProcessedProject managers and project application administrators can run the Update Project Performance Data process fromthe Scheduled Processes page, the Project Performance Dashboard, or the Project Financial Management work area tosummarize project data.
You can use summarized data to analyze the health of projects and drill down to the causes of any deviation from setthresholds. Complete the following tasks using summarized data:
• Analyze project performance data
• Analyze KPI categories and KPIs
• Track project progress
• View summaries for revenues, invoices, actual costs, budgets, forecasts, and commitments.
You can run the Update Project Performance Data process for different situations. For example, you can run the processwhen:
• Your summarized data is out of date and you want to update it. For example, you don't see the latest summarizeddata in the Project Management infolets or in the Project Performance dashboard regions.
• Your summarized data is damaged and you want to delete the existing data and resummarize.
• You have a large volume of data that is not summarized yet, and want to summarize the entire bulk of data in onerun.
Tip: If you have large volumes of data, run the Update Project Performance Data Without ProducingReport process when the workload on systems is low. For example, you can run the process on a nightlybasis.
Running Update Project Performance Data renders the KPI related information out of date with respect to the latestsummarized information. Therefore, it is important that you generate KPI values after the summarization process completes.To automatically generate KPI values after you summarize project data, select the Generate key performance indicatorsafter summarizing project data option in the Performance Reporting Options tab of the Manage Project Units: ReportingSetup page.
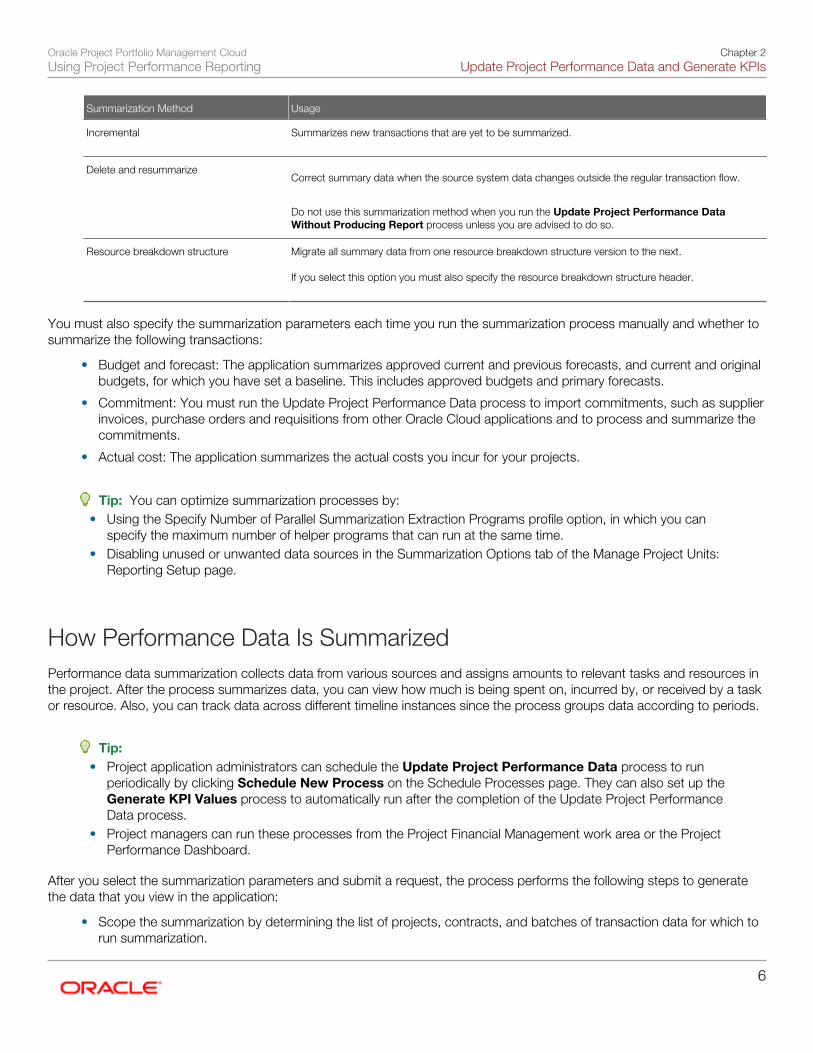
Settings That Affect Performance Data SummarizationYou can summarize performance data for a project unit, business unit, a range of projects, or projects managed by a projectmanager. When you run the Update Project Performance Data process from the Scheduled Processes page, select oneof the summarization methods from the following table:
Oracle Project Portfolio Management CloudUsing Project Performance Reporting
Chapter 2Update Project Performance Data and Generate KPIs
6
Summarization Method Usage
Incremental
Summarizes new transactions that are yet to be summarized.
Delete and resummarize Correct summary data when the source system data changes outside the regular transaction flow.
Do not use this summarization method when you run the Update Project Performance DataWithout Producing Report process unless you are advised to do so.
Resource breakdown structure
Migrate all summary data from one resource breakdown structure version to the next. If you select this option you must also specify the resource breakdown structure header.
You must also specify the summarization parameters each time you run the summarization process manually and whether tosummarize the following transactions:
• Budget and forecast: The application summarizes approved current and previous forecasts, and current and originalbudgets, for which you have set a baseline. This includes approved budgets and primary forecasts.
• Commitment: You must run the Update Project Performance Data process to import commitments, such as supplierinvoices, purchase orders and requisitions from other Oracle Cloud applications and to process and summarize thecommitments.
• Actual cost: The application summarizes the actual costs you incur for your projects.
Tip: You can optimize summarization processes by:• Using the Specify Number of Parallel Summarization Extraction Programs profile option, in which you can
specify the maximum number of helper programs that can run at the same time.• Disabling unused or unwanted data sources in the Summarization Options tab of the Manage Project Units:
Reporting Setup page.
How Performance Data Is SummarizedPerformance data summarization collects data from various sources and assigns amounts to relevant tasks and resources inthe project. After the process summarizes data, you can view how much is being spent on, incurred by, or received by a taskor resource. Also, you can track data across different timeline instances since the process groups data according to periods.
Tip:• Project application administrators can schedule the Update Project Performance Data process to run
periodically by clicking Schedule New Process on the Schedule Processes page. They can also set up theGenerate KPI Values process to automatically run after the completion of the Update Project PerformanceData process.
• Project managers can run these processes from the Project Financial Management work area or the ProjectPerformance Dashboard.
After you select the summarization parameters and submit a request, the process performs the following steps to generatethe data that you view in the application:
• Scope the summarization by determining the list of projects, contracts, and batches of transaction data for which torun summarization.
Oracle Project Portfolio Management CloudUsing Project Performance Reporting
Chapter 2Update Project Performance Data and Generate KPIs
7
Note: When you summarize a project, the application summarizes all the contracts that are associatedwith the project. Similarly, when you summarize a contract, the application summarizes all the projects thatare associated with the contract.
• Extract data to summarize from data sources, group it by periods, and prepare the data for resource mapping.
• Populate summary data into designated tables before resource breakdown structure mapping.
• Populate performance reporting dimension data including time, task breakdown structure, and resource breakdownstructure.
• Look up resource breakdown structure mappings, scenario dimension members, period IDs, and prepare data forloading into Oracle Essbase.
• Load data into Oracle Essbase and merge data into the summary tables.
You can track the progress of the Update Project Performance Data process on the Scheduled Processes page afteryou submit a process. If the process fails to complete, it continues from the point of failure when you resubmit it.
To summarize data across different sources such as actual costs, commitments, revenue, invoice amounts, budgets, controlbudgets, forecasts, awards, and so on, submit the Update Project Performance Data Without Producing Reportprocess. You don't have to run other processes such as Update Project Contract Performance Data or Update AwardPerformance Data to summarize data across all these sources. You must have access to data for the objects for which youwant to summarize data.
KPI Components: How They Work TogetherA key performance indicator (KPI) enables you to define thresholds of possible values for a performance measure for anyproject in a project unit. During KPI definition, you associate a performance status indicator with each threshold level. Whenyou generate KPI values, the application compares the value against the thresholds defined for the KPI. If the value falls withinany of the defined threshold levels, then the application associates the status indicator of that threshold with the performancemeasure. The following are the KPI components we will discuss:
• Performance Measure
• Performance Status Indicator
• Threshold Level
• Trend Indicator
• Tolerance Percentage
• Project Performance Data
• Project Unit
Performance MeasureOracle Fusion Project Performance Reporting provides both fundamental and derived measures that present an objectiveinsight into the performance of the project. In addition, you can create custom measures to meet the unique needs of yourorganization. Use any delivered or custom performance measure to create a KPI.
Oracle Project Portfolio Management CloudUsing Project Performance Reporting
Chapter 2Update Project Performance Data and Generate KPIs
8
Performance measures are available in the areas of budgets and forecasts, billing and revenue, costs, effort, margin,capitalization, and more. Following are examples of predefined performance measures:
• EAC Budget Cost (the estimate at completion burdened cost from the current baseline budget)
• ITD Forecast Revenue Variance (the inception-to-date current baseline budget revenue - current approved forecastrevenue)
• Prior Period Margin Percentage Variance (the prior period current baseline budget margin percentage - actual marginpercentage)
A performance measure is associated with a time dimension. The following time dimensions are available:
• Estimate-at-completion (EAC)
• Inception-to-date (ITD)
• Prior Period
• Period-to-date (PTD)
• Quarter-to-date (QTD)
• Year-to-date (YTD)
A particular performance measure set, such as Budget Cost, can have as many as six performance measures: one for eachtime dimension.
A performance measure can be expressed as a currency amount, as a percentage, or in time units such as hours when effortis measured. If the KPI is used on projects that use different currencies, you can enter different thresholds levels for eachcurrency you need.
Performance Status IndicatorPerformance status indicators give an immediate picture of the status of a project, such as critical, at risk, and on track. Eachdistinct icon indicates the status and severity of performance. During KPI definition, you first associate status indicators withperformance statuses:
• Critical
• Severe
• At risk
• On track
• Ahead
You then associate these statuses with threshold levels. When KPI values are generated for a project, each value is comparedto the defined thresholds and the corresponding status indicator for the KPI appears on project performance reports.
A status can identify negative performance so that you can take the appropriate actions to prevent or quickly resolveproblems. Conversely, a status can identify positive performance to help you track expected or excellent performance.
Threshold LevelDuring KPI definition, you define threshold levels to cover all possible values for a KPI. If a KPI value exceeds the range ofvalues defined for the KPI threshold levels, the closest threshold is used to determine the KPI status. For example, if a KPIvalue falls below the lowest threshold level, the application assigns the status of the lowest threshold level to the KPI.
A status indicator can be associated with more than one threshold level. For example, both underutilization and overutilizationof resources can indicate a critical performance status.
Oracle Project Portfolio Management CloudUsing Project Performance Reporting
Chapter 2Update Project Performance Data and Generate KPIs
9
Trend IndicatorPerformance trend indicators give an immediate picture of improving or worsening KPI value trends on the project. Eachdistinct icon indicates whether an increasing performance trend has a positive or negative impact. For example, an increasein nonbillable costs is considered unfavorable to organizations that are able to bill costs to their clients. In this example, theperformance trend indicator will show a negative impact.
Tolerance PercentageA tolerance percentage is used to compare the previous KPI value to the current value to show if the performance trendis increasing, decreasing, or staying the same. For example, if the tolerance percentage is 10 percent for a KPI, and thedifference between the previous KPI value and current value is greater than 10 percent, then the trend is increasing. If thedifference is greater than -10 percent, then the trend is decreasing. If the difference is between -10 percent and 10 percent,then the trend shows no change. A single tolerance percentage value, such as 10 percent in this example, represents bothnegative and positive tolerances.
Project Performance DataThe application provides programs that extract and update transaction data and maintain project performance data. Theprocess of generating KPI values uses this project performance data. Before you generate new KPI values, check the datethat the project performance data was last generated to make sure that the data includes all transactions that may impactproject performance results. Then decide if you must update project performance data before you generate KPI values. Afteryou run these programs you will have a true picture of project performance.
When you generate KPI values, the period for which KPI values are being generated is determined by the KPI PeriodDetermination Date. The data from that period is used to generate project performance data that will be populated on theproject performance dashboard.
Note: KPIs that are enabled for use in the KPI definition are included when KPI values are generated.
Project UnitKPIs are created for specific project units. During project unit implementation you specify whether KPIs are tracked for theproject unit.
Related Topics
• What's a KPI period determination date?
KPI Values: How They're GeneratedGenerate KPI values after updating project performance data to analyze the project performance. You can assign a thresholdfor the KPI values. The application first generates the KPI values and then assigns a status indicator to the KPI based on thethreshold you define.

Oracle Project Portfolio Management CloudUsing Project Performance Reporting
Chapter 2Update Project Performance Data and Generate KPIs
10
Settings That Affect KPI ValuesYou can specify the values for the parameters as listed in the following table when running the Generate KPI Valuesprocess from the Scheduled Processes page.
Parameters Description
KPI Period Determination Date
Set the date used to derive the project calendar and accounting calendar periods for performancemeasure calculations when KPI values are generated.
Replace Current KPI Values
Replace the existing KPI values with the values that you are generating now.
Delete Previous KPI Values Delete the KPI values that were generated by prior runs of the Generate KPI Values process.
Number of Days to Retain KPI Values
Retain KPI values for the specified number of days starting from the current date before deletingprevious KPI values.
This table provides examples of KPI period determination date and generation date.
KPI Period Determination Date Generation Date
October 29, 2010
November 12, 2010
September 30, 2010
October 15, 2010
If you generate KPI values on November 18, 2010 and select to replace the current KPI values, the application deletes theKPI values generated on November 12, 2010 and replaces the data with KPI values generated on November 18, 2010. Youmust select to replace the current KPI values for a given period if you want to retain one set of KPI values and review KPIvalues during the period.
You can also delete KPI values that are not required for reporting. The options, Delete Previous KPI Values and Numberof Days to Retain KPI Values, enable you to delete KPI values that were generated prior to a specific number of days. Forexample, if today is November 18, 2010 and you want to remove all KPI values generated in the previous year, you mustselect to delete previous KPI values, and set Number of Days to Retain KPI Values to 322. All KPI values created sinceJanuary 1, 2010 are retained and KPI values generated before that period are deleted.
Note: Don't delete previous KPI values when you're generating KPI values for the first time in a period, or if youwant to see trending information for the KPIs over the life of the project.
Oracle Project Portfolio Management CloudUsing Project Performance Reporting
Chapter 2Update Project Performance Data and Generate KPIs
11
How KPI Values are GeneratedKPI values are calculated based on the value of the performance measure associated with the project. When you generateKPI values, the KPI period determination date is used to determine the period. KPI values are generated for the period basedon the options in the KPI definition. Only one set of KPIs are kept for a single KPI period determination date.
For example, KPI values are generated for a KPI period determination date of August 24 at 8:15 a.m. for Projects A and B.Then KPI values are generated for a KPI period determination date of August 24 at 10:45 a.m. just for Project B. The KPIvalues for Project B generated at 8:15 a.m. are deleted, but KPIs belonging to Project A are retained.
Note: To keep historical information, use a unique KPI period determination date.
Generating KPI NotificationsEnable the Notify project manager option in the KPI Notifications section on the Reporting tab of the Manage FinancialProject Settings page to automatically notify project managers after you generate KPI values.
Related Topics
• What's a KPI period determination date?
KPI Trends: How They're CalculatedTrend indicators show whether the trend of a key performance indicator (KPI) is favorable or unfavorable for a project. Whenyou define KPIs you specify a value for tolerance percentage. The tolerance percentage is taken into account while calculatingtrend indicators for a KPI.
Note: KPI trends may not be useful if KPI values are generated often. The reason is, if the tolerance percentageis 10 percent and KPI values are generated every day, the values decrease by 1 percent each day. In thisscenario, no change is observed in the trend as the decrease is well within the tolerance. However, if yougenerate KPI values at the start and end of the month, a significant change is observed in the trend.
Settings That Affect KPI TrendsThe trend indicator that appears for a KPI is based on the default set in the performance trend indicator setup. The differenttrend indicators available are:
• Up, favorable: The project performance trend is increasing in value and is desirable.
• Up, unfavorable: The project performance trend is increasing in value and is undesirable.
• Down, favorable: The project performance trend is decreasing in value and is desirable.
• Down, unfavorable: The project performance trend is decreasing in value and is undesirable.
• Unchanged: The project performance trend is unchanged.
Oracle Project Portfolio Management CloudUsing Project Performance Reporting
Chapter 2Update Project Performance Data and Generate KPIs
12
You can change the sort order of the trend indicators based on how you want to sequence KPIs in a table based on theperformance of KPIs in a project.
How KPI Trends Are CalculatedTrend Indicators are calculated based on the percentage increase or decrease in a KPI value, while taking into considerationthe tolerance percentage specified while creating the KPI. The following example illustrates how trend indicators arecalculated for a KPI.
Consider a scenario where KPI values are generated for the first time on January 15, 2011, and again on February 15 andApril 15. KPI trends are calculated when there are at least two values that exist for a KPI.
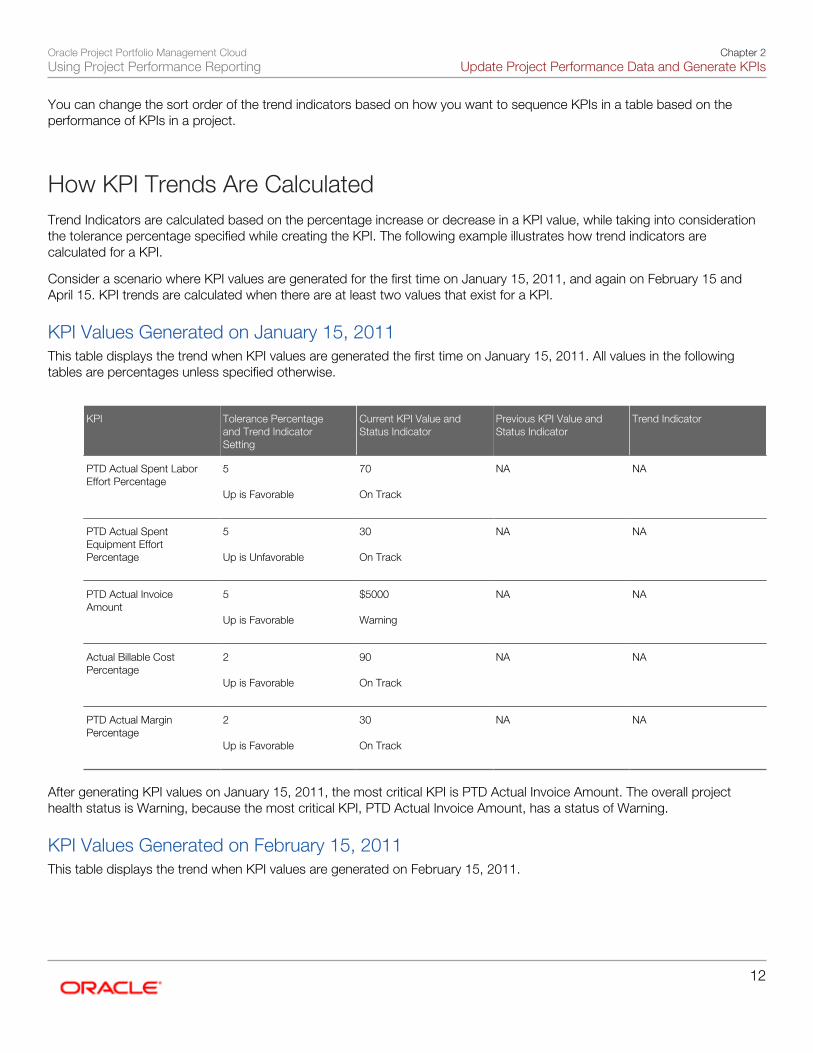
KPI Values Generated on January 15, 2011This table displays the trend when KPI values are generated the first time on January 15, 2011. All values in the followingtables are percentages unless specified otherwise.
KPI Tolerance Percentageand Trend IndicatorSetting
Current KPI Value andStatus Indicator
Previous KPI Value andStatus Indicator
Trend Indicator
PTD Actual Spent LaborEffort Percentage
5 Up is Favorable
70 On Track
NA
NA
PTD Actual SpentEquipment EffortPercentage
5 Up is Unfavorable
30 On Track
NA
NA
PTD Actual InvoiceAmount
5 Up is Favorable
$5000 Warning
NA
NA
Actual Billable CostPercentage
2 Up is Favorable
90 On Track
NA
NA
PTD Actual MarginPercentage
2 Up is Favorable
30 On Track
NA
NA
After generating KPI values on January 15, 2011, the most critical KPI is PTD Actual Invoice Amount. The overall projecthealth status is Warning, because the most critical KPI, PTD Actual Invoice Amount, has a status of Warning.
KPI Values Generated on February 15, 2011This table displays the trend when KPI values are generated on February 15, 2011.
Oracle Project Portfolio Management CloudUsing Project Performance Reporting
Chapter 2Update Project Performance Data and Generate KPIs
13
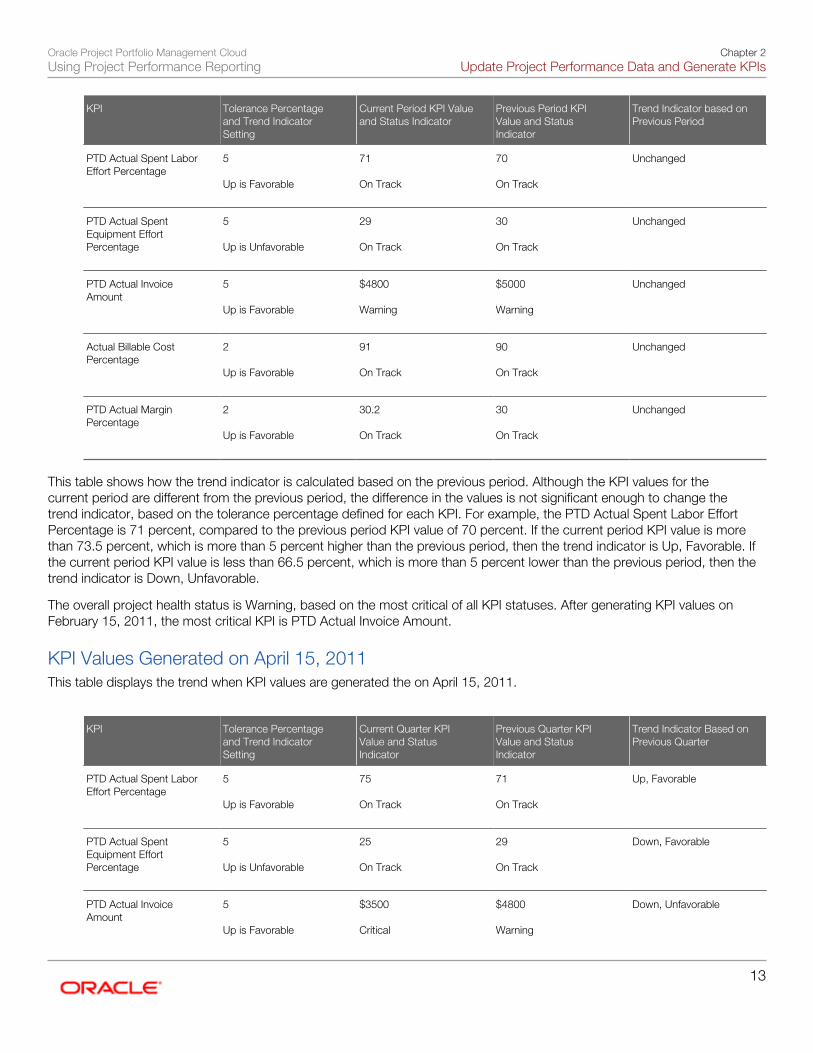
KPI Tolerance Percentageand Trend IndicatorSetting
Current Period KPI Valueand Status Indicator
Previous Period KPIValue and StatusIndicator
Trend Indicator based onPrevious Period
PTD Actual Spent LaborEffort Percentage
5 Up is Favorable
71 On Track
70 On Track
Unchanged
PTD Actual SpentEquipment EffortPercentage
5 Up is Unfavorable
29 On Track
30 On Track
Unchanged
PTD Actual InvoiceAmount
5 Up is Favorable
$4800 Warning
$5000 Warning
Unchanged
Actual Billable CostPercentage
2 Up is Favorable
91 On Track
90 On Track
Unchanged
PTD Actual MarginPercentage
2 Up is Favorable
30.2 On Track
30 On Track
Unchanged
This table shows how the trend indicator is calculated based on the previous period. Although the KPI values for thecurrent period are different from the previous period, the difference in the values is not significant enough to change thetrend indicator, based on the tolerance percentage defined for each KPI. For example, the PTD Actual Spent Labor EffortPercentage is 71 percent, compared to the previous period KPI value of 70 percent. If the current period KPI value is morethan 73.5 percent, which is more than 5 percent higher than the previous period, then the trend indicator is Up, Favorable. Ifthe current period KPI value is less than 66.5 percent, which is more than 5 percent lower than the previous period, then thetrend indicator is Down, Unfavorable.
The overall project health status is Warning, based on the most critical of all KPI statuses. After generating KPI values onFebruary 15, 2011, the most critical KPI is PTD Actual Invoice Amount.
KPI Values Generated on April 15, 2011This table displays the trend when KPI values are generated the on April 15, 2011.
KPI Tolerance Percentageand Trend IndicatorSetting
Current Quarter KPIValue and StatusIndicator
Previous Quarter KPIValue and StatusIndicator
Trend Indicator Based onPrevious Quarter
PTD Actual Spent LaborEffort Percentage
5 Up is Favorable
75 On Track
71 On Track
Up, Favorable
PTD Actual SpentEquipment EffortPercentage
5 Up is Unfavorable
25 On Track
29 On Track
Down, Favorable
PTD Actual InvoiceAmount
5 Up is Favorable
$3500 Critical
$4800 Warning
Down, Unfavorable

Oracle Project Portfolio Management CloudUsing Project Performance Reporting
Chapter 2Update Project Performance Data and Generate KPIs
14
KPI Tolerance Percentageand Trend IndicatorSetting
Current Quarter KPIValue and StatusIndicator
Previous Quarter KPIValue and StatusIndicator
Trend Indicator Based onPrevious Quarter
Actual Billable CostPercentage
2 Up is Favorable
91 On Track
91 On Track
Unchanged
PTD Actual MarginPercentage
2 Up is Favorable
28.5 Warning
30.2 On Track
Down, Unfavorable
This table shows how the trend indicator is calculated based on the previous quarter. The current KPI values are compared tothe latest generation date of KPIs for the previous quarter.
It is possible that the previous period trend and the previous quarter trend are calculated based on KPI values from thesame generation date. This occurs when the previous period generation date is the same as the latest generation date in theprevious quarter.
The first three KPI values changed enough since the previous quarter to change the trend calculator. For example, the currentquarter value of PTD Actual Invoice Amount is $3,500, which exceeds the threshold tolerance of 5 percent from the previousquarter KPI value of $4,800. Therefore the KPI is in a Critical status, and the trend indicator is Down, Unfavorable. If thecurrent quarter value is greater than $5,040, which is more than 5 percent higher than the previous quarter, then the trendindicator is Up, Favorable.
A project manager might review the KPI values, statuses, and trends shown in this table and determine that a transaction wasnot billed, because the KPIs that are based on revenue and invoice amounts have both dropped.
The overall project health is critical because of the status of the PTD Actual Invoice Amount.
Related Topics
• Performance Trend Indicators: Explained
• Tolerance Percentage: Explained
Calculating Current, Prior Period, and Prior Quarter KPIValues: ExamplesA key performance indicator (KPI), if enabled for use, can be defined against one of two calendars: accounting calendar orproject accounting calendar.
To generate KPI values, you enter a KPI period determination date for the application to determine the accounting calendarperiod and project accounting calendar period. This example shows you how current period, prior period, and prior quarterKPI values are calculated.

Oracle Project Portfolio Management CloudUsing Project Performance Reporting
Chapter 2Update Project Performance Data and Generate KPIs
15
ScenarioVision Corporation designs and implements heavy engineering projects for government and private customers. The Financedepartment is interested in measuring revenue and margin on the accounting calendar, and budget to actual variance oflabor effort on the project accounting calendar. The KPIs defined for this purpose are Period-to-Date (PTD) Revenue VariancePercentage on the accounting calendar and PTD Labor Effort Variance Percentage on the project accounting calendar.
The following table shows the accounting calendar used by InFusion Corporation.
Period Name Period Start Date Period End Date Quarter Name Quarter Start Date Quarter End Date
Jun-09
1-Jun-09
30-Jun-09
Q2
1-Apr-09
30-Jun-09
Jul-09
1-Jul-09
31-Jul-09
Q3
1-Jul-09
30-Sep-09
Aug-09
1-Aug-09
31-Aug-09
Q3
1-Jul-09
30-Sep-09
Sep-09
1-Sep-09
30-Sep-09
Q3
1-Jul-09
30-Sep-09
Oct-09
1-Oct-09
31-Oct-09
Q4
1-Oct-09
31-Dec-09
Nov-09
1-Nov-09
30-Nov-09
Q4
1-Oct-09
31-Dec-09
The following table shows the project accounting calendar used by InFusion Corporation.
Period Name Period Start Date Period End Date Quarter Name Quarter Start Date Quarter End Date
W1-Apr-09
4-Apr-09
10-Apr-09
Q2
4-April-09
3-Jul-09
W1-Sep-09
2-Sep-09
9-Sep-09
Q3
4-Jul-09
3-Oct-09
W2-Sep-09
10-Sep-09
17-Sep-09
Q3
4-Jul-09
3-Oct-09
W3-Sep-09
18-Sep-09
25-Sep-09
Q3
4-Jul-09
3-Oct-09
W4-Sep-09
26-Sep-09
3-Oct-09
Q3
4-Jul-09
3-Oct-09
W1-Oct-09
4-Oct-09
10-Oct-09
Q4
4-Oct-09
3-Jan-10
W2-Oct-09
11-Oct-09
18-Oct-09
Q4
4-Oct-09
3-Jan-10
W3-Oct-09
19-Oct-09
26-Oct-09
Q4
4-Oct-09
3-Jan-10
W4-Oct-09
27-Oct-09
3-Nov-09
Q4
4-Oct-09
3-Jan-10
Oracle Project Portfolio Management CloudUsing Project Performance Reporting
Chapter 2Update Project Performance Data and Generate KPIs
16
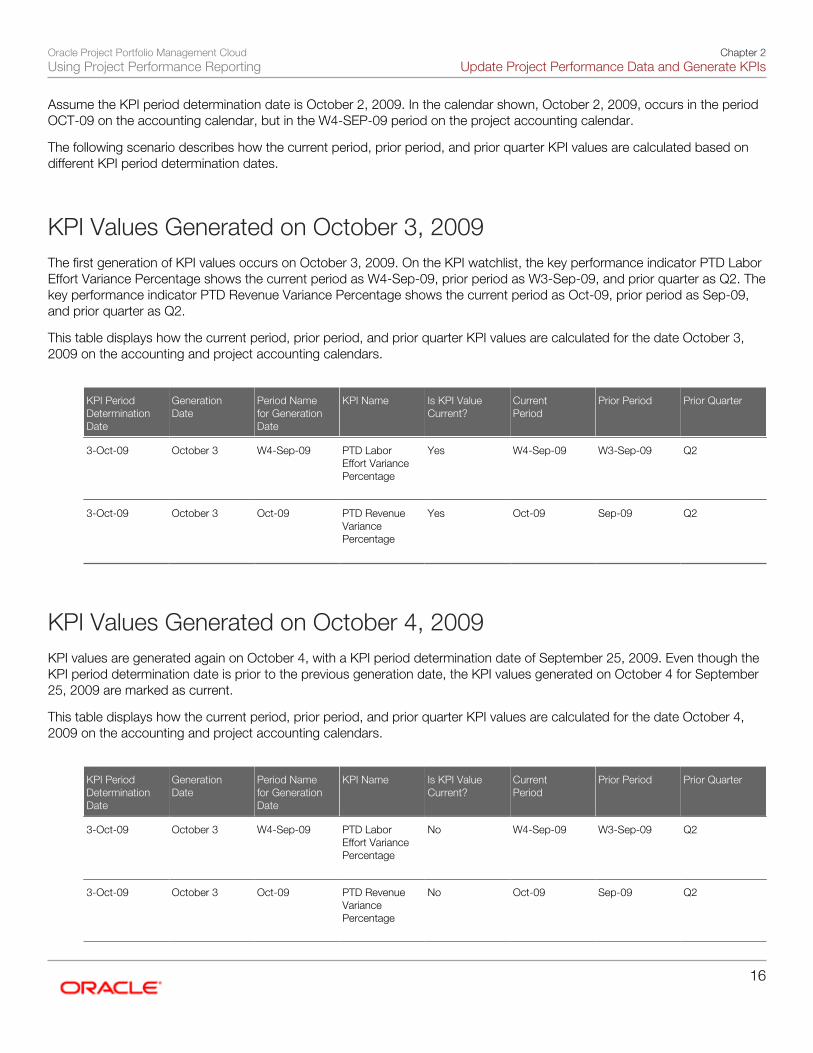
Assume the KPI period determination date is October 2, 2009. In the calendar shown, October 2, 2009, occurs in the periodOCT-09 on the accounting calendar, but in the W4-SEP-09 period on the project accounting calendar.
The following scenario describes how the current period, prior period, and prior quarter KPI values are calculated based ondifferent KPI period determination dates.
KPI Values Generated on October 3, 2009The first generation of KPI values occurs on October 3, 2009. On the KPI watchlist, the key performance indicator PTD LaborEffort Variance Percentage shows the current period as W4-Sep-09, prior period as W3-Sep-09, and prior quarter as Q2. Thekey performance indicator PTD Revenue Variance Percentage shows the current period as Oct-09, prior period as Sep-09,and prior quarter as Q2.
This table displays how the current period, prior period, and prior quarter KPI values are calculated for the date October 3,2009 on the accounting and project accounting calendars.
KPI PeriodDeterminationDate
GenerationDate
Period Namefor GenerationDate
KPI Name Is KPI ValueCurrent?
CurrentPeriod
Prior Period Prior Quarter
3-Oct-09
October 3
W4-Sep-09
PTD LaborEffort VariancePercentage
Yes
W4-Sep-09
W3-Sep-09
Q2
3-Oct-09
October 3
Oct-09
PTD RevenueVariancePercentage
Yes
Oct-09
Sep-09
Q2
KPI Values Generated on October 4, 2009KPI values are generated again on October 4, with a KPI period determination date of September 25, 2009. Even though theKPI period determination date is prior to the previous generation date, the KPI values generated on October 4 for September25, 2009 are marked as current.
This table displays how the current period, prior period, and prior quarter KPI values are calculated for the date October 4,2009 on the accounting and project accounting calendars.
KPI PeriodDeterminationDate
GenerationDate
Period Namefor GenerationDate
KPI Name Is KPI ValueCurrent?
CurrentPeriod
Prior Period Prior Quarter
3-Oct-09
October 3
W4-Sep-09
PTD LaborEffort VariancePercentage
No
W4-Sep-09
W3-Sep-09
Q2
3-Oct-09
October 3
Oct-09
PTD RevenueVariancePercentage
No
Oct-09
Sep-09
Q2

Oracle Project Portfolio Management CloudUsing Project Performance Reporting
Chapter 2Update Project Performance Data and Generate KPIs
17
KPI PeriodDeterminationDate
GenerationDate
Period Namefor GenerationDate
KPI Name Is KPI ValueCurrent?
CurrentPeriod
Prior Period Prior Quarter
25-Sep-09
October 4
W3-Sep-09
PTD LaborEffort VariancePercentage
Yes
W3-Sep-09
W2-Sep-09
Q2
25-Sep-09
October 4
Sep-09
PTD RevenueVariancePercentage
Yes
Sep-09
Aug-09
Q2
KPI Values Generated on October 10, 2009KPI values are again generated on October 10, 2009 with a KPI period determination date of October 10, 2009. These KPIvalues are now used for the current period, prior period, and prior quarter.
This table displays how the current period, prior period, and prior quarter KPI values are calculated for the period October 10,2009 on the accounting and project accounting calendars.
KPI PeriodDeterminationDate
GenerationDate
Period Namefor GenerationDate
KPI Name Is KPI ValueCurrent?
CurrentPeriod
Prior Period Prior Quarter
3-Oct-09
October 3
W4-Sep-09
PTD LaborEffort VariancePercentage
No
W4-Sep-09
W3-Sep-09
Q2
3-Oct-09
October 3
Oct-09
PTD RevenueVariancePercentage
No
Oct-09
Sep-09
Q2
25-Sep-09
October 4
W3-Sep-09
PTD LaborEffort VariancePercentage
No
W3-Sep-09
W2-Sep-09
Q2
25-Sep-09
October 4
Sep-09
PTD RevenueVariancePercentage
No
Sep-09
Aug-09
Q2
10-Oct-09
October 10
W1-Oct-09
PTD LaborEffort VariancePercentage
Yes
W1-Oct-09
W4-Sep-09
Q3
10-Oct-09
October 10
Oct-09
PTD RevenueVariancePercentage
Yes
Oct-09
Sep-09
Q3
Oracle Project Portfolio Management CloudUsing Project Performance Reporting
Chapter 2Update Project Performance Data and Generate KPIs
18
FAQs for Update Project Performance Data and GenerateKPIs
What's a key performance indicator?The result of a business measure, for example product sales or operational costs, evaluated against a target for that measure.You use KPIs to assess the performance of the strategic objectives and initiatives that are part of your organizational strategy.When you define KPIs you should ensure they have these characteristics:
• Have measurable objectives that may vary over time.
• Can be evaluated using targets to determine performance status.
• Can be compared over time for trending purposes.
What's the difference between key performance indicator and KPIcategory?Key performance indicators (KPIs) measure how well an organization or individual performs an operational, tactical, orstrategic activity that is critical for the current and future success of the organization. Examples are: Period-to-Date (PTD)Actual Spent Labor Effort Percentage, PTD Actual Spent Equipment Effort Percentage, and PTD Actual Margin Percentage.
A KPI category is a group of KPIs that belong to a specific performance area. Examples are: cost, profitability, financial, andschedule.
As the examples suggest, PTD Actual Margin Percentage must be in the KPI category of profitability.
What actions trigger performance data summarization?The following actions can trigger performance data summarization:
• Running the Update Project Performance Data process from the Project Performance Dashboard or the ProjectFinancial Management work area.
• Running or scheduling the Update Project Performance Data process from the process scheduler.
• Enabling the reporting option on the project unit to summarize project data before generating key performanceindicators.
• Creating revenue and invoice transactions.
• Creating actual cost transactions.
• Setting a baseline for an approved cost budget.

Oracle Project Portfolio Management CloudUsing Project Performance Reporting
Chapter 2Update Project Performance Data and Generate KPIs
19
How can I update project performance data and generate KPIvalues?Project managers, project application administrators, and project administrators can run the Update Project PerformanceData and Generate KPI Values processes from the Project Performance Dashboard. Alternatively, they can run bothprocesses for the projects that they manage from the Scheduled Processes page. To update performance data for allprojects in a project owning organization or business unit, project administrators must run the Update Project PerformanceData process from the Scheduled Processes page.
Project managers must ensure that they run the Update Project Performance Data process so that all the infolets on theProject Management dashboard are up-to-date.
Tip: Enable the option to generate KPI values automatically after updating project performance data.
Related Topics
• Analyzing Project Performance Using the Project Management Dashboard: Points to Consider

Oracle Project Portfolio Management CloudUsing Project Performance Reporting
Chapter 2Update Project Performance Data and Generate KPIs
20

Oracle Project Portfolio Management CloudUsing Project Performance Reporting
Chapter 3Analyze Project Performance
21
3 Analyze Project Performance
Analyzing Project Performance Using the ProjectManagement Dashboard: Points to ConsiderProject managers can use the Project Management dashboard to review the overall health, progress, and financial statusof projects, and resolve issues. The dashboard consists of a group of infolets that displays critical information about yourprojects. Project managers can use this information for planning work and managing financial projects.
Project managers and project application administrators must run the Update Project Performance Data process fromthe Scheduled Processes page to refresh the data on the Project Management dashboard. To view information in the Healthinfolet, they must also run the Generate KPI Values process.
If you don't see updated information on certain or all infolets, it could be because:
• You haven't implemented either Project Execution Management or Project Financial Management.
• You don't have transactions yet.
• You haven't run the Update Project Performance Data and the Generate KPI Values processes if you are usingProject Financial Management.
Infolet Data SourcesDepending on the offering that you implemented, Project Financial Management or Project Execution Management, onlythe corresponding infolets display data on the Project Management dashboard. You can also implement both offeringssimultaneously. You can hide the infolets that display no data. Use the Infolet Repository to enable or disable infolets on theProject Management dashboard.
The Project Management dashboard comprises the following infolets that project managers can use to review projectperformance:
Infolet Data Source Description
My Projects
All the projects that you manage
Get a total count of the projects that youmanage. Quickly navigate to the My Projectspage to analyze details about each project.Analyze the overall progress of projects andtake appropriate action.
Health
Project health based on KPI thresholds View information about project health in the
order of severity. The project that is mostsevere appears first. Run the Generate KPIsprocess so that this infolet displays up-to-date information. You can perform thefollowing actions:
• View the health of your projects thatare enabled for financial managementin the order of health status. Forexample, Critical projects are listed

Oracle Project Portfolio Management CloudUsing Project Performance Reporting
Chapter 3Analyze Project Performance
22
Infolet Data Source Description
at the top, At Risk projects follownext, and On Track projects followthereafter.
• Post messages on the project wallfrom the infolet to draw attention tothe project health status.
• Manage project costs and budgets,and analyze KPIs that contribute tothe current project health status.
• Run the Generate KPIs processso that the infolet displays latestinformation.
Time Cards
Missing or partially reported time cards View missing or partial time cards for the
previous five weeks, including the currentreporting period week. Time cards arereported based on the setup in the projectunit reporting options. After you review thetime cards, you can post messages:
• On the project wall for time cards thataren't accurately submitted.
• To the project team members whohaven't submitted accurate timecards.
Invoices
Invoices pending approval
Review invoices to determine which invoicesare pending approval. After you review them,approve or reject the invoices.
Uninvoiced Cost
Billable cost transactions that are uninvoicedor partially invoiced
Review the projects that have the highestnumber of uninvoiced costs. Drill downto view the project cost transactions thatcontribute to the uninvoiced amount.
Cost Budget
Comparison of project cost to project budget Compare project cost to project budget.
Create a budget or navigate to the ManageProject Budgets and Manage Project Costspage to review budget and cost information.
You can perform the following actions usingthis infolet:
• Review the cost budget for theproject. The infolet displays onlythe current baseline approved costbudget.
• Determine the variance betweenthe Spent and the Budget to Dateamounts for over budget projects asdisplayed in the donuts.
• Ensure that the Spent amountincludes both project costs andcommitments from start of the projectto the current reporting period.
• Drill down to the Manage ProjectCosts page. The default view displaysproject costs incurred within the last
Oracle Project Portfolio Management CloudUsing Project Performance Reporting
Chapter 3Analyze Project Performance
23
Infolet Data Source Description
30 days. You must change the filter toview data further in the past.
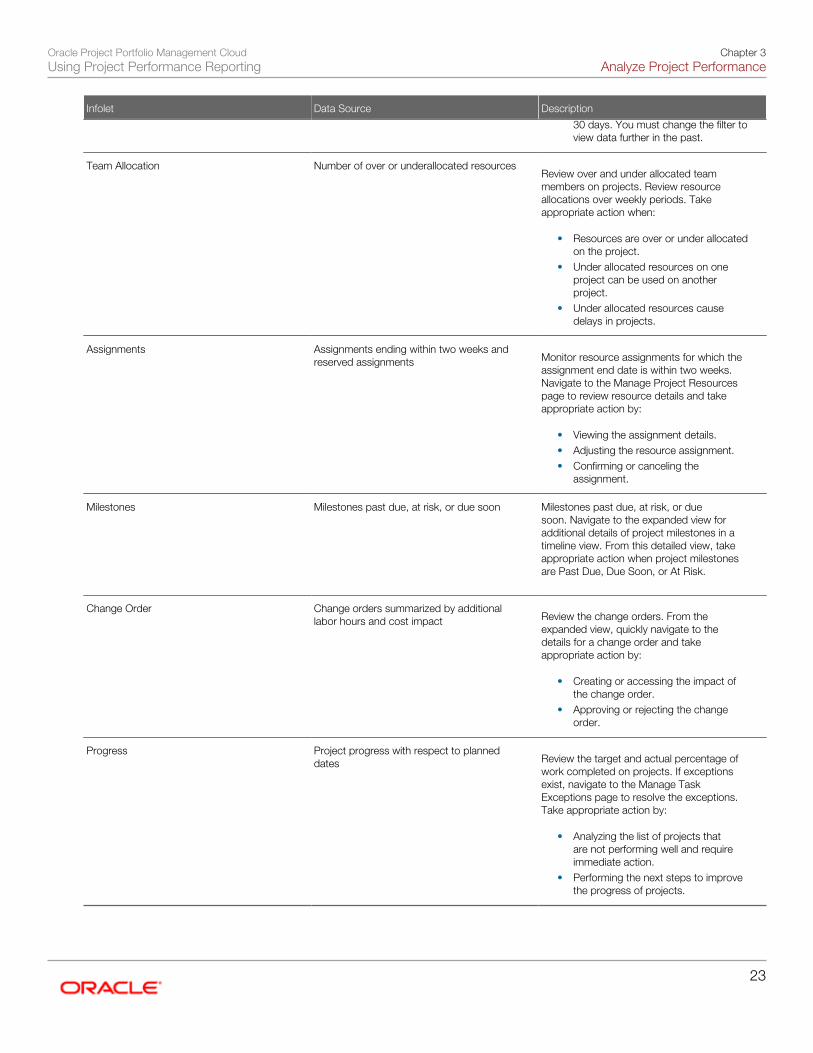
Team Allocation
Number of over or underallocated resources Review over and under allocated team
members on projects. Review resourceallocations over weekly periods. Takeappropriate action when:
• Resources are over or under allocatedon the project.
• Under allocated resources on oneproject can be used on anotherproject.
• Under allocated resources causedelays in projects.
Assignments
Assignments ending within two weeks andreserved assignments
Monitor resource assignments for which theassignment end date is within two weeks.Navigate to the Manage Project Resourcespage to review resource details and takeappropriate action by:
• Viewing the assignment details.• Adjusting the resource assignment.• Confirming or canceling the
assignment.
Milestones
Milestones past due, at risk, or due soon
Milestones past due, at risk, or duesoon. Navigate to the expanded view foradditional details of project milestones in atimeline view. From this detailed view, takeappropriate action when project milestonesare Past Due, Due Soon, or At Risk.
Change Order
Change orders summarized by additionallabor hours and cost impact
Review the change orders. From theexpanded view, quickly navigate to thedetails for a change order and takeappropriate action by:
• Creating or accessing the impact ofthe change order.
• Approving or rejecting the changeorder.
Progress
Project progress with respect to planneddates
Review the target and actual percentage ofwork completed on projects. If exceptionsexist, navigate to the Manage TaskExceptions page to resolve the exceptions.Take appropriate action by:
• Analyzing the list of projects thatare not performing well and requireimmediate action.
• Performing the next steps to improvethe progress of projects.
Oracle Project Portfolio Management CloudUsing Project Performance Reporting
Chapter 3Analyze Project Performance
24
Related Topics
• Performance Data Summarization: How It's Processed
• How can I update project performance data and generate KPI values?
Analyze Project Management
Drawing Insight on Project Health and Progress
Watch: This video tutorial shows you how to use the Project Management Dashboard to monitor the overall health, progress,and status of your project finances so you can take action to resolve issues. The content of this video is also covered in texttopics.
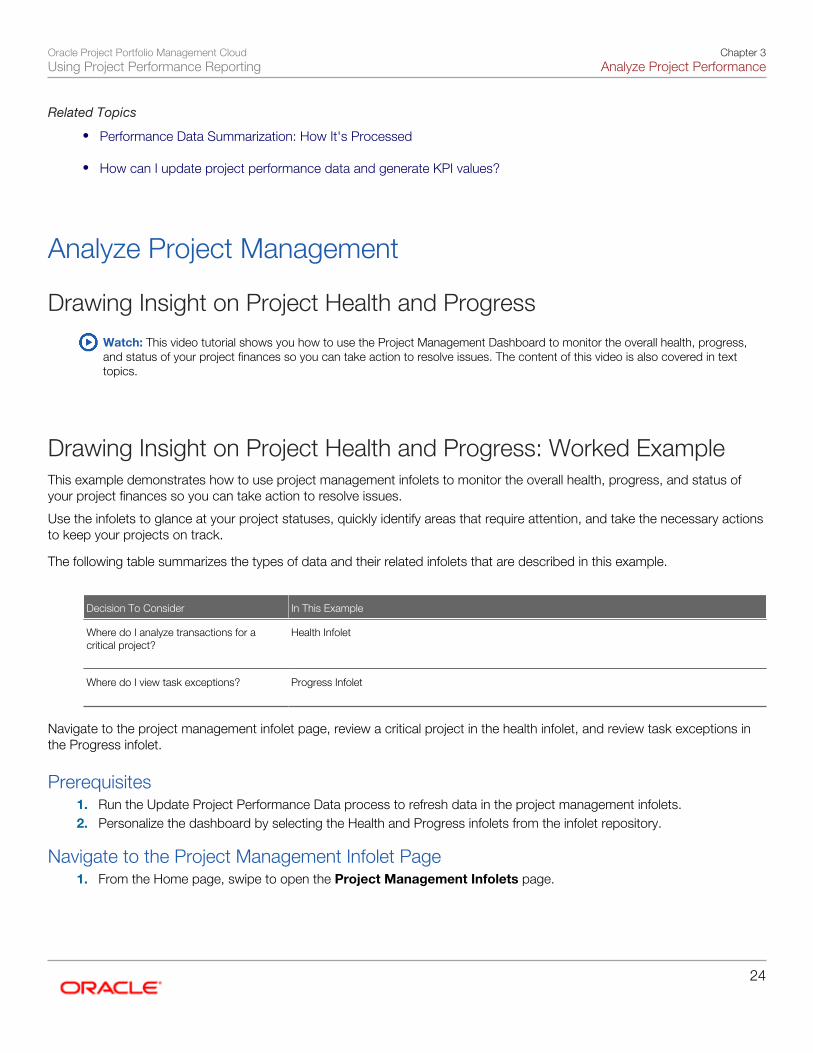
Drawing Insight on Project Health and Progress: Worked ExampleThis example demonstrates how to use project management infolets to monitor the overall health, progress, and status ofyour project finances so you can take action to resolve issues.
Use the infolets to glance at your project statuses, quickly identify areas that require attention, and take the necessary actionsto keep your projects on track.
The following table summarizes the types of data and their related infolets that are described in this example.
Decision To Consider In This Example
Where do I analyze transactions for acritical project?
Health Infolet
Where do I view task exceptions?
Progress Infolet
Navigate to the project management infolet page, review a critical project in the health infolet, and review task exceptions inthe Progress infolet.
Prerequisites1. Run the Update Project Performance Data process to refresh data in the project management infolets.2. Personalize the dashboard by selecting the Health and Progress infolets from the infolet repository.
Navigate to the Project Management Infolet Page1. From the Home page, swipe to open the Project Management Infolets page.
Oracle Project Portfolio Management CloudUsing Project Performance Reporting
Chapter 3Analyze Project Performance
25
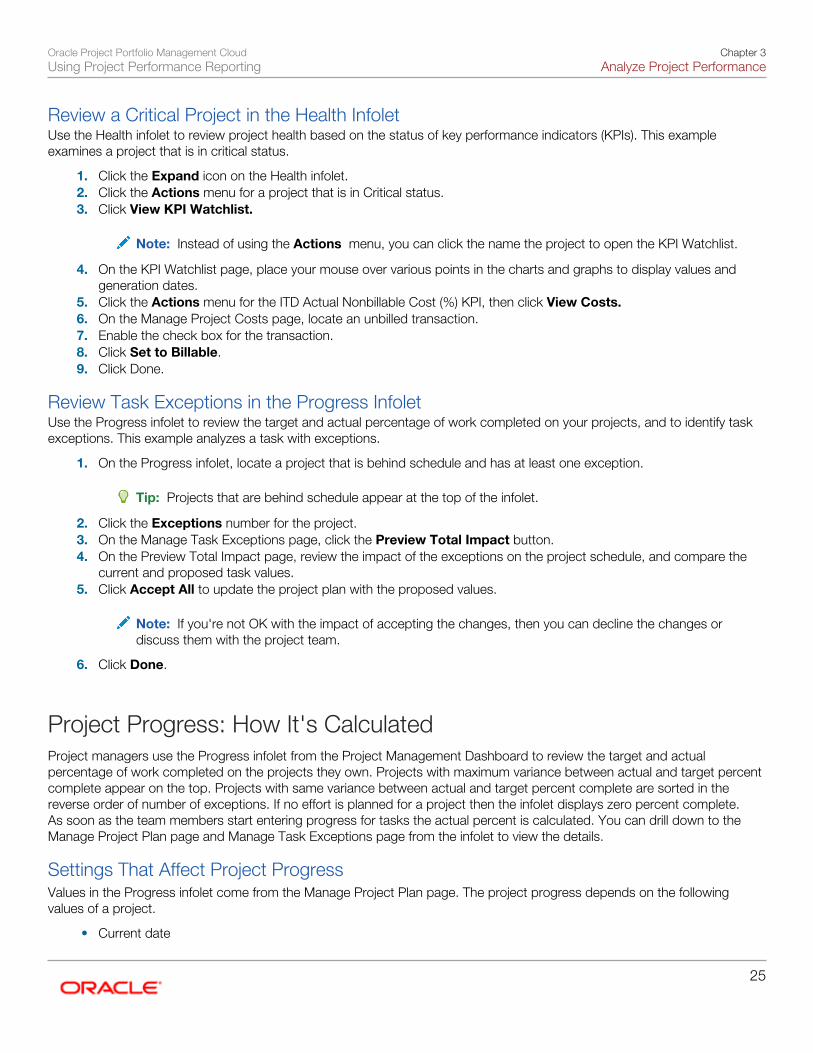
Review a Critical Project in the Health InfoletUse the Health infolet to review project health based on the status of key performance indicators (KPIs). This exampleexamines a project that is in critical status.
1. Click the Expand icon on the Health infolet.2. Click the Actions menu for a project that is in Critical status.3. Click View KPI Watchlist.
Note: Instead of using the Actions menu, you can click the name the project to open the KPI Watchlist.
4. On the KPI Watchlist page, place your mouse over various points in the charts and graphs to display values andgeneration dates.
5. Click the Actions menu for the ITD Actual Nonbillable Cost (%) KPI, then click View Costs.6. On the Manage Project Costs page, locate an unbilled transaction.7. Enable the check box for the transaction.8. Click Set to Billable.9. Click Done.
Review Task Exceptions in the Progress InfoletUse the Progress infolet to review the target and actual percentage of work completed on your projects, and to identify taskexceptions. This example analyzes a task with exceptions.
1. On the Progress infolet, locate a project that is behind schedule and has at least one exception.
Tip: Projects that are behind schedule appear at the top of the infolet.
2. Click the Exceptions number for the project.3. On the Manage Task Exceptions page, click the Preview Total Impact button.4. On the Preview Total Impact page, review the impact of the exceptions on the project schedule, and compare the
current and proposed task values.5. Click Accept All to update the project plan with the proposed values.
Note: If you're not OK with the impact of accepting the changes, then you can decline the changes ordiscuss them with the project team.
6. Click Done.
Project Progress: How It's CalculatedProject managers use the Progress infolet from the Project Management Dashboard to review the target and actualpercentage of work completed on the projects they own. Projects with maximum variance between actual and target percentcomplete appear on the top. Projects with same variance between actual and target percent complete are sorted in thereverse order of number of exceptions. If no effort is planned for a project then the infolet displays zero percent complete.As soon as the team members start entering progress for tasks the actual percent is calculated. You can drill down to theManage Project Plan page and Manage Task Exceptions page from the infolet to view the details.
Settings That Affect Project ProgressValues in the Progress infolet come from the Manage Project Plan page. The project progress depends on the followingvalues of a project.
• Current date

Oracle Project Portfolio Management CloudUsing Project Performance Reporting
Chapter 3Analyze Project Performance
26
• Planned start date
• Planned finish date
• Planned effort in hours
• Current effort in hours
• Actual hours
How Project Progress Is CalculatedReview project progress by comparing the target and actual percent complete values of a project. The following formulascalculate the target and actual percent complete of a project.
• target percent complete = (expected hours / planned effort in hours) * 100
◦ expected hours = (expected duration * planned effort in hours) / planned duration
◦ expected duration = current date - planned start date + 1
◦ planned duration = planned finish date - planned start date + 1
• actual percent complete = (actual hours / current effort in hours) * 100. The actual percent complete is the rolled uppercent complete of the project.
The following example shows the values used to calculate target and actual percent complete for Project 1. Assume thecurrent date is 2-Jun-2017, the calendar is 5 days a week with no holidays, and a workday contains 8 hours.
Name PlannedEffort inDays
PlannedStart Date
PlannedFinish Date
PlannedEffort inHours
ActualHours
RemainingHours
CurrentEffort inHours
ExpectedHours
Project 1
57
22-May-2017
30-Jun-2017
456
120
336
456
160
Task 1
10
22-May-2017
02-Jun-2017
80
40
40
80
(10 * 80) /10 = 80
Task 2
7
01-Jun-2017
09-Jun-2017
56
16
40
56
(2 * 56) / 7= 16
Task 3
20
05-Jun-2017
30-Jun-2017
160
0
160
160
0
Task 4
20
24-May-2017
20-Jun-2017
160
64
96
160
(8 * 160) /20 = 64
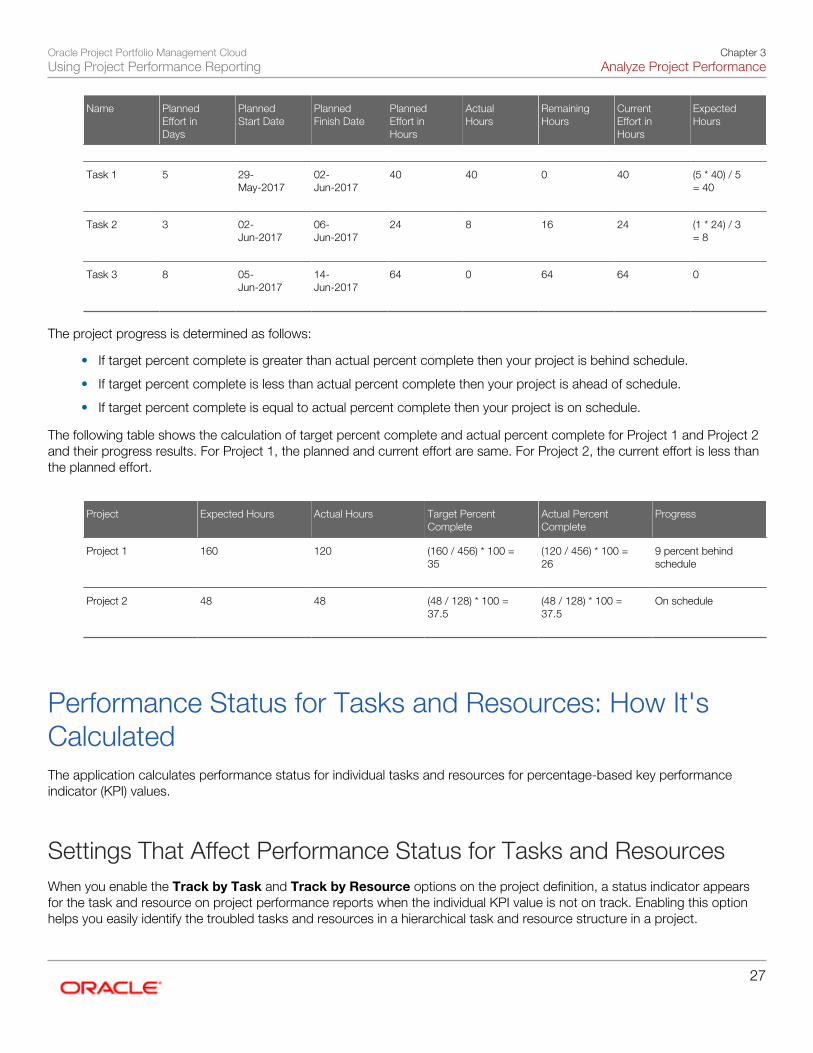
The following example shows the values used to calculate target and actual percent complete for Project 2. Assume thecurrent date is 2-Jun-2017, the calendar is 5 days a week with no holidays, and a workday contains 8 hours.
Name PlannedEffort inDays
PlannedStart Date
PlannedFinish Date
PlannedEffort inHours
ActualHours
RemainingHours
CurrentEffort inHours
ExpectedHours
Project 2
16
29-May-2017
14-Jun-2017
128
48
72
128
48
Oracle Project Portfolio Management CloudUsing Project Performance Reporting
Chapter 3Analyze Project Performance
27
Name PlannedEffort inDays
PlannedStart Date
PlannedFinish Date
PlannedEffort inHours
ActualHours
RemainingHours
CurrentEffort inHours
ExpectedHours
Task 1
5
29-May-2017
02-Jun-2017
40
40
0
40
(5 * 40) / 5= 40
Task 2
3
02-Jun-2017
06-Jun-2017
24
8
16
24
(1 * 24) / 3= 8
Task 3
8
05-Jun-2017
14-Jun-2017
64
0
64
64
0
The project progress is determined as follows:
• If target percent complete is greater than actual percent complete then your project is behind schedule.
• If target percent complete is less than actual percent complete then your project is ahead of schedule.
• If target percent complete is equal to actual percent complete then your project is on schedule.
The following table shows the calculation of target percent complete and actual percent complete for Project 1 and Project 2and their progress results. For Project 1, the planned and current effort are same. For Project 2, the current effort is less thanthe planned effort.
Project Expected Hours Actual Hours Target PercentComplete
Actual PercentComplete
Progress
Project 1
160
120
(160 / 456) * 100 =35
(120 / 456) * 100 =26
9 percent behindschedule
Project 2
48
48
(48 / 128) * 100 =37.5
(48 / 128) * 100 =37.5
On schedule
Performance Status for Tasks and Resources: How It'sCalculatedThe application calculates performance status for individual tasks and resources for percentage-based key performanceindicator (KPI) values.
Settings That Affect Performance Status for Tasks and ResourcesWhen you enable the Track by Task and Track by Resource options on the project definition, a status indicator appearsfor the task and resource on project performance reports when the individual KPI value is not on track. Enabling this optionhelps you easily identify the troubled tasks and resources in a hierarchical task and resource structure in a project.
Oracle Project Portfolio Management CloudUsing Project Performance Reporting
Chapter 3Analyze Project Performance
28
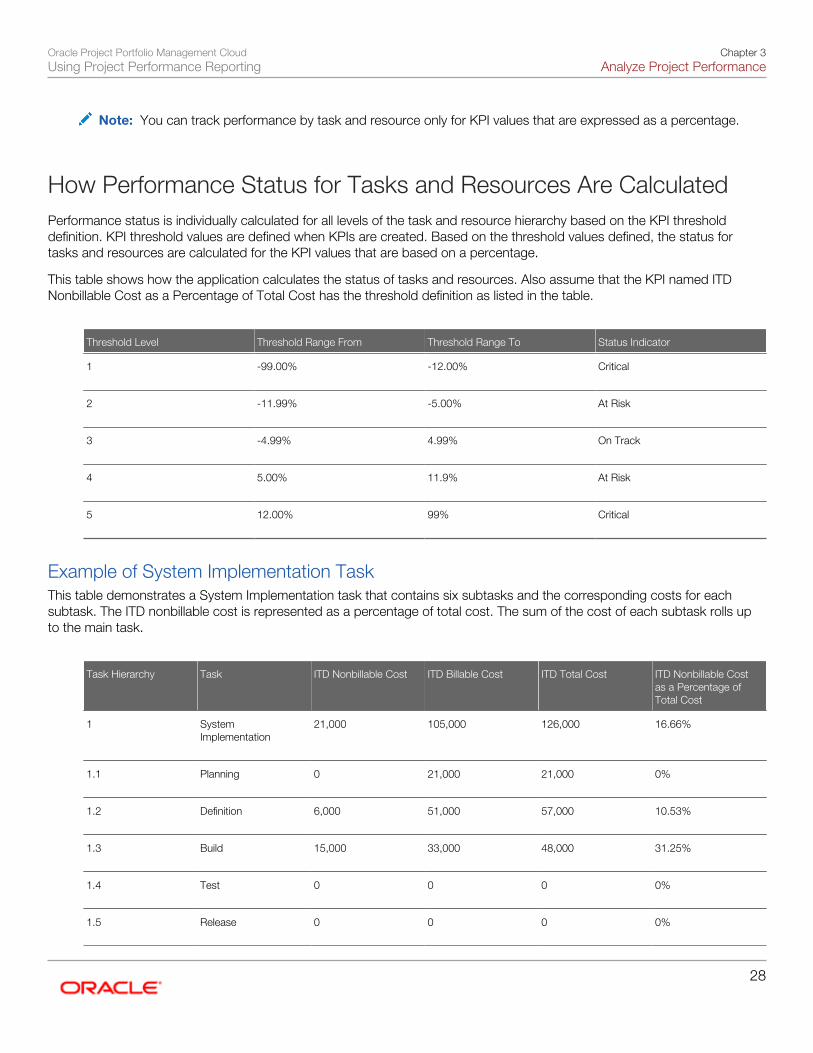
Note: You can track performance by task and resource only for KPI values that are expressed as a percentage.
How Performance Status for Tasks and Resources Are CalculatedPerformance status is individually calculated for all levels of the task and resource hierarchy based on the KPI thresholddefinition. KPI threshold values are defined when KPIs are created. Based on the threshold values defined, the status fortasks and resources are calculated for the KPI values that are based on a percentage.
This table shows how the application calculates the status of tasks and resources. Also assume that the KPI named ITDNonbillable Cost as a Percentage of Total Cost has the threshold definition as listed in the table.
Threshold Level Threshold Range From Threshold Range To Status Indicator
1
-99.00%
-12.00%
Critical
2
-11.99%
-5.00%
At Risk
3
-4.99%
4.99%
On Track
4
5.00%
11.9%
At Risk
5
12.00%
99%
Critical
Example of System Implementation TaskThis table demonstrates a System Implementation task that contains six subtasks and the corresponding costs for eachsubtask. The ITD nonbillable cost is represented as a percentage of total cost. The sum of the cost of each subtask rolls upto the main task.
Task Hierarchy Task ITD Nonbillable Cost ITD Billable Cost ITD Total Cost ITD Nonbillable Costas a Percentage ofTotal Cost
1
SystemImplementation
21,000
105,000
126,000
16.66%
1.1
Planning
0
21,000
21,000
0%
1.2
Definition
6,000
51,000
57,000
10.53%
1.3
Build
15,000
33,000
48,000
31.25%
1.4
Test
0
0
0
0%
1.5
Release
0
0
0
0%

Oracle Project Portfolio Management CloudUsing Project Performance Reporting
Chapter 3Analyze Project Performance
29
Task Hierarchy Task ITD Nonbillable Cost ITD Billable Cost ITD Total Cost ITD Nonbillable Costas a Percentage ofTotal Cost
1.6
Support
0
0
0
0%
The ITD Nonbillable Cost as a Percentage of Total Cost KPI value for the Definition task is 10.53% (6,000/57,000). Based onthe threshold levels defined for this KPI, the Definition task shows the At Risk status indicator.
Example of a Consulting Resource Breakdown StructureIn another example, the Consulting resource breakdown structure contains a Labor resource. Labor is a parent to the ProjectManager resource, which is a parent to resources Maxwell Martin, Robert Altima, and Fred Jones. The ITD NonbillableCost as a Percentage of Total Cost KPI value for Labor is 12.97% (15,700.00/121,015.00). The ITD Nonbillable Cost as aPercentage of Total Cost KPI value for Fred Jones is 0%. Because the KPI value for each row in the hierarchical structure iscalculated separately, Labor has a status indicator of Critical and Fred Jones does not have a status indicator.
This table lists the ITD nonbillable cost as a percentage of total cost for labor resources in the Consulting resource breakdownstructure.
Resource Hierarchy Resource ITD Nonbillable Cost ITD Billable Cost ITD Total Cost ITD Nonbillable Costas a Percentage ofTotal Cost
1
Consulting
19,776
105,315
125,091
15.81%
1.1
Labor
15,700
105,315
121,015
12.97%
1.1.1
Project Manager
15,700
50,000
65,700
23.90%
1.1.1.1
Maxwell Martin
2,800
14,000
16,800
16.67%
1.1.1.2
Robert Altima
8,400
0
8,400
100.00%
1.1.1.3
Fred Jones
0
36,000
36,000
0%
If you track tasks and resources for a project, each task and resource with a KPI value that is not on track is designated asan exception. The KPI value for the project does not impact the exception designation for individual tasks and resources.For example, if a task has a Critical status indicator based on the KPI value and threshold definition, it is designated as anexception even if the project has an On Track status indicator.
Note: Task and resource performance status is based on the latest summarized data, which may not be thesame as the summarized data used to generate the latest KPI values.
FAQs for Analyze Project Performance
Oracle Project Portfolio Management CloudUsing Project Performance Reporting
Chapter 3Analyze Project Performance
30
Why did the overall health indicator not appear for the project?The overall health indicator is visible after the overall health is calculated. The overall health is calculated for a project if keyperformance indicators (KPIs) are associated to the project and are enabled, and KPI values and summarized performancedata are generated for the project.
Why is the overall health for the project at risk when most of the KPIstatuses are on track?The key performance indicator (KPI) with the most severe status determines the overall health of the project. For example, ifthree out of four KPIs on a project are on track, and one is at risk, then the overall health of the project is at risk.
You can also configure the overall health calculation during implementation.
Can a time card be reported as missing and also be included as anunprocessed transaction?No, both these situations cannot coexist. Time cards that have not been entered are considered missing. A time card is anunprocessed transaction after it is entered into the application and before it is included in the Update Project PerformanceData process.
How can I evaluate project performance if KPIs are not tracked?You must use the Review Project Performance page to perform more detailed financial performance analysis for a projectthan is possible on the Project Performance Dashboard. You can review amounts at the task or resource level, and drilldown to individual expenditure items.
What happens if KPIs are not tracked?You can view your projects in the project list and evaluate the financial performance of your projects. All project comparisongraphs are available except for the KPI analysis graph. However, you cannot generate KPI values and analyze KPI categoriesand hence the overall project health status indicator is not available. The KPI watchlist and notes are also unavailable.
Why can't I view the KPI category analysis?You cannot view the key performance indicator (KPI) category analysis due to the following reasons:
• The project unit does not track KPIs.
• No KPIs are associated with the project.
• KPI values are not generated.

Oracle Project Portfolio Management CloudUsing Project Performance Reporting
Chapter 3Analyze Project Performance
31
FAQs for Review Project Comparison Graphs
Which currency is used on a project comparison graph?The ledger currency is used if all projects in the project list have the same ledger currency. However, if the projects in theproject list are represented in more than one ledger currency, the user-preferred currency is used to bring all projects into thesame currency.
Why can't I see all the KPIs for my project on the project comparisongraph?KPI values that are generated for the project appear on the KPI analysis project comparison graphs. The remaining KPIs areexcluded.
When does a project appear in the Time Card Exceptions graph?A time card has an error, is pending, or is missing for a project.
What's the difference between time card exceptions that are missing,pending, or in error on the Time Card Exceptions graph?Time transactions that are in error were received from the transaction source but failed the posting process.
Pending time transactions were received from the transaction source but have not completed the posting process.
Time transactions are missing if an expenditure item for a team member does not exist for the transaction source, document,and time period specified in the reporting options for the project unit.
How many periods can be viewed on the Percent Complete Analysisgraph?The Percent Complete Analysis graph displays data for the last 90 days with a maximum of 13 periods.
FAQs for Review KPI Watchlist Analysis

Oracle Project Portfolio Management CloudUsing Project Performance Reporting
Chapter 3Analyze Project Performance
32
What happens if I use period-to-date amount-based measures forlarge projects?Period-to-date amount-based measures use the same threshold values for all phases of the project. This may result in aspike in the key performance indicator (KPI) values if the amounts used to calculate the KPI values vary widely throughout theproject. To avoid this problem, consider using different sets of threshold values for amount-based KPIs defined in small andlarge projects.
Why did a performance measure that compares the current and priorapproved forecast show an unfavorable result when there is only oneapproved forecast?If you generate key performance indicator (KPI) values when no previous approved forecast exists, a zero value is used togenerate KPI values. Therefore, the trend appears unfavorable because the difference between the current and prior forecastis the same as the current forecast. The results will be accurate once a new forecast is approved, project performance data issummarized, and KPI values are generated.
Can I change the default sort order of KPIs listed in the KPI watchlist?Yes. You can change the default sort order in the KPI watchlist by modifying the sort order of performance status indicators.By default, KPIs are sorted based on the current period status, with the least favorable status appearing at the top of the list,and the most favorable status appearing at the bottom of the list. If there is no current period status, the KPIs are sorted byname.
Related Topics
• Performance Trend Indicators: Explained
Why are the KPIs visible on the Analyze KPI Categories page after Idisable them?Inactive KPIs, disabled KPIs, or KPIs for which future references are deleted continue to appear until you regenerate KPIvalues. Determine if a KPI is enabled or active in the Reporting tab of the project definition.
Why can't I see my KPI in regions on the Analyze KPI Categoriespage?Inactive KPIs, disabled KPIs, or KPIs for which future references are deleted continue to appear until you regenerate KPIvalues. Determine if a KPI is enabled or active in the Reporting tab of the project definition.

Oracle Project Portfolio Management CloudUsing Project Performance Reporting
Chapter 3Analyze Project Performance
33
FAQs for Review KPI Historical Trending
What happens if a KPI value exceeds the threshold limits defined forthe KPI?An up or down arrow appears in the Exceeds Threshold column of the KPI History table, and the closest threshold is usedto determine the key performance indicators (KPIs) status. If KPI values fall outside the threshold ranges, consider extendingthe upper and lower threshold ranges.
Why did the trend indicator show a downward trend when KPIperformance is improving?While defining key performance indicators (KPIs), you can determine if a positive increase between the current and previousKPI value is a favorable or unfavorable trend. Therefore, an upward trend may not necessarily indicate that KPI performance isimproving.
For example, for a KPI based on a non-billable percentage of total costs, a low value for non-billable costs is preferred.Hence, a downward trend is favorable.
FAQs for Review Project Financial Performance
Why does the Financial Performance region show only the costbudget and forecast effort?When the cost and revenue budgets are contained in different budget versions, the effort represented in project performancereporting is only for the cost budget. The same principle applies to cost and revenue forecasts. When the cost and revenueforecasts are contained in different forecast versions, the effort represented in project performance reporting is only for thecost forecast.
Which budget and forecast are the numbers in the FinancialPerformance region based on?The Financial Performance region displays summarized financial data. The summarization process always includes the originaland current baseline budget, and current and previous forecasts for the financial plan types that are designated as approvedcost or revenue budgets and forecasts.
Additionally, any other financial plan types enabled for use on the project on the Summarization tab, and KPIs based oncustom measures, are included when the summarization process is run.
Oracle Project Portfolio Management CloudUsing Project Performance Reporting
Chapter 3Analyze Project Performance
34
Why can't I see all the revenue for my project on the FinancialPerformance region?The revenue amount in the Financial Performance region includes only external and interproject contracts. It does not includeany intercompany revenue associated with the project.
FAQs for Perform Task and Resource Level Analysis
What happens if I update project performance without generating KPIvalues?The KPI values don't reflect the latest summarized data. You can view the last time each process was submitted in theImportant Dates window.
You can update project performance and generate KPI values independently to satisfy your business needs. For example,you may update project performance frequently to ensure you have the latest information available. You may also generateKPIs periodically after confirming that all transactions are entered and processed to ensure the KPIs are complete, consistent,and comparable over time.
Tip: You can enable a setting in the project unit options to generate KPI values automatically after updating theproject performance data.
What's the relationship between task structure and resourcestructure?The task and resource structure regions share a master-detail relationship. The Analyze KPI page lets you select whichstructure appears in the master and detail regions. Depending on your selection the detail structure region automaticallydisplays the other structure. For example, if you select the task structure to appear in the master region, the detail regiondisplays the resource structure. Selecting a row in the Task Structure region displays the assigned resource for that task inthe Resource Structure region.
Oracle Project Portfolio Management CloudUsing Project Performance Reporting
Glossary
35
Glossary
financial plan type
Category or collection of either project budgets or project forecasts.
KPI
Abbreviation for key performance indicator. Key performance indicators (KPIs) measure how well an organization orindividual project meets an operational, tactical, or strategic objective that is critical for the current and future success of theorganization. Examples are: Period-to-Date (PTD) Actual Spent Labor Effort Percentage, PTD Actual Spent Equipment EffortPercentage, and PTD Actual Margin Percentage.
KPI category
A group of key performance indicators that belong to a specific performance area. Examples are: cost, profitability, financial,and schedule.
KPI period determination date
Date used to determine the accounting calendar and project accounting calendar periods for performance measurecalculations during key performance indicator (KPI) value generation.
scenario dimension members
A scenario dimension is used to differentiate actual cost, current budget, original budget, prior forecast, current forecast, andvariances between different plan types within summarization.
summarization
The summarization or update project performance data process extracts data related to actual cost, commitment, budget,forecast, revenue, and invoice transactions and prepares the data for reporting purposes.

Oracle Project Portfolio Management CloudUsing Project Performance Reporting
Glossary
36