optometric manpower: characteristicsof optometric practice
TRANSCRIPT

DATA ON NATIONAL HEALTH RESOURCESSeries 14Number 13
Optometric Manpower:Characteristics ofOptometric PracticeUnitedStates-1968
From information collected in a national survey of optometrists con-ducted by the National Center for Health Statistics, statistics arepresented describing features of optometric practice in the UnitedStates in 1968. These features include the form and composition ofpractice arrangements, primary and secondary activities of the prac-titioners, the range of services that practitioners provided and thenumbers and types of supplementary personnel that the optome-trist used to assist him in his practice.
DHEW Publication No. (HRA) 74-1808
U.S. DEPARTMENT OF HEALTH, EDUCATION, AND WELFARE
Public Health Service
Health Resources Administration
National Center for Health Statistics
Rockville, Md. June 1974

Library of Congress Cataloging in Publication Data
Optometric manpower.
(Data on national health resources, ser. 14, no. 13) (DHEW publication no. (HFM) 74-1 808)Supt. of Dots. no.: HE 20.2210: 14/13.1. Optometrists–United States–Statistics.
I. Phillips, Hazel M., joint author. 11.Title. III. Series: United States. National Center fur Hc:llthStatistics. Vital and health statistics. Series 14: Data on national health resources: mw-ip(jfvurand facilities, no. 13. IV. Series: United States. Dept. of Health, Education, and Welfare. DI-IEWpublication no. (HRA) 74-1808. [DNLhI: 1. Optometry -Manpower-U.S. W2A N 14Snv nn. 131974]RE942.K6 331.1’26 74-2154ISBN 0–8406–0005–4
For sale by the Superintendent of Documeuts, U.S. Go’iernnmt Printing Ofiice, Washington, D.C. 20402- Mcc $1.2S
—

NATIONAL CENTER FOR HEALTH STATISTICS
EDWARD B. PERRIN, Ph.D., Director
PHILIP S. LAWRENCE, SC.D., Deputy DirectorDEAN E. KRUEGER, Acting Associate Director for Analysis
GAIL F. FISHER, Associate .Directorfor the Cooperative FZeukh Statistics SystemELIJAH L. WHITE, Associate Director for Jlzta Systems
IWAO M. MORIYAMA, Ph. D., Associate Director for International Statistical ProgramsEDWARD E. MINTY, Associate Director for Management
ROBERT A. ISR4EL, Associate Director for OperationsQUENTIN R. REMEIN, Associate Director for Program Development
PHILIP S. LAWRENCE, SC.D., Acting Associate Director for ResearchALICE HAYWOOD, Information Officer
DIVISION OF HEALTH MANPOWER AND FACILITIES STATISTICS
GLORIA HOLLIS, Acting DirectorSHELDON STARR, Acting Deputy Director
HENRY MOUNT, Chief Health Manpower Statistics Branch
GLORIA HOLLIS, Acting Chief Health Facilities Statistics BranchSHELDON STARR, Acting chief Technical Seruices Branch
Vital and Health Statistics-Series 14. No. 13
DHEW Publication No. (HRA) 74-1808Library of Congress Catalog Gzrd Number 74-2154

CONTENTS
Introduction . ----------------------- -------- --. -a--- ------------------
1968 Optometrists in Perspective -------- ---------------- ---------------
General Demographic and Professional Characteristics -----------------
Characteristics of Optometric Practice -------- ------------------------ --
Form and Composition of Independent Practice Arrangements ------- ----Primary and Secondary Activities --------------------------- ---------
Patient Services Rendered ----- ”------------------ -------------------Volume of Patient-Care Activity ---------------- ----- ”-- -------- ------
Utilization of Supplementary Personnel . ----- ”-------------------- -------GeneraI Characteristics of Users of Auxiliary personnel ---------------Number of Supplementary Personnel -.------ ------------------------ .
Conditions of Utilization------. ---------q ---------------------------Utilization of Secretaries and/or Receptionists ------------------------Utilization of General Optometric Assistants ------------------------ --
Utilization of Optometric Technicians --------------------------- ----.-
Utilization of Dispensing Opticians ------------------------ -----------Utilization of Contact Lens Technicims -------------------------------Utilization of Optical Technicians -- . ---. ---- .- ”------------- ---------
Summary . .-- .---” ------------------ ---------------------------- ---
List of Detailed Tables --------------------------- --. ----- ”------------
Appendix 1. Technical Notes ------------------------ ---------------- “
Background of Report ----- .---” ---------- --------------------------- -
Survey Coverage ---------------- ------------------------ -----------
Data Collection md Processing --------------------------------------Response to the Survey ------------------------ ----------------------
Item Response -------- ------a- ------------------------ “------- -----
Imputation for Unknowns --------------------------- -“------- --------
State and National Estimates ------------------------ -------- -------- -
Rounding ---------------- “------- ---------------- ---- ” -------------
Appendix II. Definitions . -------------------------- --------- -“------- -
Appendix III. Survey Questionnaire . . . . . . --------------------- ----------
Page
1
22
44455
99
101112131314141516
17
737373737374747575
77
78
. . .Ill

SYMBOLS
Data not available ----------------------- ---
Category not applicable ------------------ . . .
Quantity zero --------------------------- -
Quantity more than Obutless than O.05---- 0.0
Figure doesnot meet standardsofreliability or precision (more than30percent relative standard error)--------- *
iv
OPTOMETRIC MANPOWER:CHARACTERISTICS OF OPTOMETRIC PRACTICE
Hugo K. Koch, M. H. A., and Hazel M. PhillipsDivision of Health Manpower and Facilities Statistics
INTRODUCTION
This is the sixth in a series of reports fromthe findings of a national survey of manpower inthe eye-care occupations in 1968 and 1969. The
survey, conducted by the National Center forI Icalth Statistics with the active assistance of theBureau of the Census, had as its goal to elicitinformation about ophthalmologists, optometrists,w-id opticians and about the supplementary per-sonnel who assisted these primary functionaries
in the provision of eye-care services. The fivepreviously published reports based on the survey
findings are:
Opticians Employed in Health Services. Vitaland Health Stutktics. DHEW Publication No.(HSM) 72-1025, Series 14- No. 3. June 1972
Ophthalmology Manpower: A General Profile.Vital and Health Statistics. DHEW Publication
No. (HSM) 73-1800, Series 14 - No. 5. De-cember 1972
Ophthalmology Manpower: Characteristics ofClinical Practice. Vitaland Health Statistics.DIHEW Publication No. (HSM) 73-1802, Series14- No. 7, March 1973
Optometrists Employed in Health Services.I’itul and Health Statistics. DHEW Publica-
tion No, (HSM) 73-1803, Series 14 - No. 8.March 1973
Ophthalmology Manpower: Utilization of Sup-
plementary Personnel. Vital and Health Sta-
tistics. DHE W Publication No. (HSM) 73-1804,Series 14, No. 9. May 1973
The present report is the second report whichdescribes personnel who provided optometric
services in this Nation in 1968. A previous reporton optometric manpower outlined the generaldemographic and professional characteristics ofoptometrists who were active and inactive in their
profession at the time of the survey; selectedstatistics from this report are presented on pages2 and 3. The present report, which contains 27
detailed statistical tables, presents statistics on
several of the more specific features of optome-tric practice. These features include the form andcomposition of practice arrangements, primaryand secondary activities of the optometric prac-
titioner, and the range of optometric servicesthat the practitioner provided. A substantial por-tion of the report is devoted to the numbers andtypes of supplementary personnel that the optome-trist used to assist him in his practice. The 27detailed tables that are found in this report areoptometrists by number of patient visits per week(tables 1-3), number of patients seen per week(tables 4-6), number of supplementary personnelof all types used to assist the optometrist in
practice, such as secretaries and/or recep-
tionists, general optometric assistants, optomet-ric technicians, dispensing opticians, contactlens technicians, and optical technicians (tables
7-27).Statistics used in the two reports on optomet-
ric manpower ref Iect the application of a stat is -
tical adjustment designed to compensate for total
or partial nonresponse to the survey question-
1

naire. The adjustment yielded an estimate of18,427 for the number of optometrists active intheir profession at the time of the 1968 survey;this figure supplied the statistical base for mostof the tables and textual discussion that appearedin the first report. Very few members of thisactive universe occupied themselves solely withactivities such as teaching, research, or adminis-tration—activities which excluded patient care.About 99 percent of the active universe reportedthat they devoted at least some part of theirweekly professional effort to the care of optomet-ric patients. This 99 percent, numbering 18,299practitioners, make up the report universe for thepresent report; they are the chief subjects of itstabular data and textual commentary.
In the pages that follow, comparison willsometimes be made between the practice char-acteristics of optometrists and those of the oph-thalmologists surveyed in 1968 (Series 14, No. 7),
especially when the two professional groups ap-pear to overlap in the patient services that theyoffered and in their respective utilizations of theavailable manpower resource in supplementaryeye-care personnel.
The text is supported by the 27 detailed sta-tistical tables and three appendixes, Appendix Iexplains the methodology that was used in the col-lection and processing. of data obtained from the1968 survey of optometrists. Appendix II definescertain terms used in the report and Appendix IIIis a facsimile of the questionnaire used to surveyoptometrists in 1968.
1968 OPTOMETRISTSIN PERSPECTIVE
General Demographic and
Professional Characteristics
The following statistics were selected fromthe earlier report, Optometrists Employed inHealth Services: United States- 1968 (Series 14,Number 8), the first report on optometric man-power from the findings of the 1968 survey.
There were an estimated 20,301 civilian op-tometrists in the United States in 1968. Of these,1,873 optometrists, or about 9 percent of the total,were inactive in their profession, 922 by reasonof retirement and 951 for other reasons. About91 percent of the total, 18,427 optometrists, wereactively engaged in professional optometric ac-tivities, a ratio of 9.3 active optometrists to every100,000 persons in the general population.
The geographic distribution of optometristsdid not always mirror the distribution of thegeneral population, as is revealed in table A. Theratio of optometrists to population was lowest inthe South Region although the largest regionalproportion of the Nation’s population was to befound in the South. The North Central Region wasfavored over other regions both in the percent ofall active optometrists located there and in thefact that it boasted the second highest ratio ofoptometrists to general population. The WestRegion had the highest ratio— 11.2 optometristsper 100,000 population. For a more localized
Table A, Percent distribution of 1968 civilian population, active optometrists, and ratesper 100,000 population, according to geographic region: United States, 1968
1968 OptometristsGeographic region civilian Act i.ve
optometrists per 100,000population population
United States -------- ------ -------- ----
Northeast -------- ------- ”-------- ------------North Central ---------------- -------- --------South -------- -------- -------- . . . . . . . . --------West -------------- ------- ------- ------- ------
Percent di.stribut ion I100,0 100.0 9.3
24.4 25.828.0 31.9 J::31.0 22.416.6 19.9 1;: :
I I
2

analysis of optometrist concentration, refer to 2 percent of active optometrists devoted somefigure 1 where the ratio of active optometrists part of their working time to teaching in schoolsto general population is pictured by State. of optometry; about 6 percent were engaged to
The median age of all active optometrists some degree in optometric research; and aboutwas 47.5 years, with about 55 percent of theirnurnlwr located in the age interva140-54 years./ibout ~8 percent of all active optometrists were
male. About 76 percent were licensed in only oneState. The typical optometrist reported aworking
ycwr that exceeded4S weeks anda working weekof m.tghly 40 hours. A substantial 16 percent ofall active optometrists spent fewer than 35 hourspc r week in optometric activities.
Participation in professional activities otherthan direct patient care was limited. Only about
12 percent were at least partially active in ad-ministrative duties other than those connectedwith the care of patients, e.g., optometricasso-
ciations.
More than 99 percent of all active optome-trists were engaged to some extent in the direct
care of optometric patients. It is these patient-seeing optometrists--18 ,299 in number—who makeup the report universe of the present report andsupply the statistical base for most of the tablesand textual commentary.
Figure I, Number of active optometrists per 100,000 population: United States, 1808.
3

CHARACTERISTICS OFOPTOMETRIC PRACTICE
Form and Composition of
Independent Practice Arrangements
Of the 18,299 optometrists comprising thisreport universe, 16,218, or about 89 percent, wereengaged in self-employed practice arrangementsas follows:
Form of practice
All arrangements --
Solo practice ---------parfmership -----------Group practice --------
Numberof
pract i-t ioners
16 ,21[
13,5102,178
530
Percentof
reportuniv&rse
88.6
notably stronger tenden~y to make use of supple-mentary eye-care personnel in partnerships andgroup practice arrangements. About 94 percentof the optometrists in mu~tiple-member formsof practice reported t~e.use. of supplementaryhelpers as compared with 74 percent for solopractitioners.
Survey findings did not permit a direct and
complete evaluation of the composition of multi-ple-member forms of practice. There was evi-dence, however, that the most utilized form wasa two-member practice. arrangement in whichboth members were optometrists. This derives
from the finding that of the optometrists who re-ported sharing supplementary personnel withassociates, about 69 percent reported that theyshared these personnel with two associates, andof these optometrist~ who reported sharing per-sonnel with two associates, about 77 percent re-ported that their associates were fellow optom-
etrists. The number of optometrists in multiple-member forms of practice was more exactlyevaluated by responses to the ‘survey question
73.811.9
2.9
“If in partnership or group practice, how manySO1O practice was clearly the form of inde-
pendent practice most favored by respondents.Using medians, the typical solo practitioner wasa male Doctor of Optometry between 47 and 48
years of age and licensed to practice in only oneState. He maintained only one office, worked more
than 48 weeks per year, and devoted roughly 40
hours per week to all his professional activities.About 74 percent of solo practitioners made useof supplementary personnel to assist them inpractice.
About 15 percent of the report universe (2,708optometrists) practiced optometry in multiple-
member arrangements. The partnership was themost frequently reported form of multiple- mem-ber practice—an estimated 2,178 optometrists(about 12 percent of the report universe) partic-ipated in this form of practice—and only about
3 percent of the respondents were to be found ingroup practice. Again reporting median tend-
encies, the typical member of a multiple-memberpractice differed from his colleague in solo prac-tice in certain, perhaps significant, respects; forexample, he tended to be about 2 years youngerthan the solo practitioner and to work at least 2hours more per working week. There was also a
optometrists are there in the partnership or
group (counting yourself)?” To this question,2,105 respondents report~d two optometrists intheir multiple-member arrangement; 421 re-spondents reported three ,optometrists; and 182reported four optometrists or more.
Primary and Secondary Activities
An examination of. the primary and second-ary activities reported by patient-serving optom-
etrists is shown in table B. Clearly, practicingoptometrists did not show any marked tendencyto specialize since about 97 percent of them en-gaged in general practice as their primary
activity and 13 percent reported no secondaryactivity at all. Of the secondary activities, con-tact lens fitting was by far the most favored
by respondents. In order of preference the three
most popular secondary activities were contactlens fitting, general practice activities, and visiontraining. The typical practice obviously centeredaround general practice activities plus some con-tact lens work with a tendency, not very sharplypronounced, to be engaged in some vision train-
ing.
4

.
. ..,
Table B, Primary -and secondary activities of optometrists: United States, 1968
. .
Activity
..
Primarv
Total -----.-- ------- ------- ------- ------- ------- ------- --.
General practice --- - -- -- ---- --- - -- - -- - ---- --- - - - -- -- --- --- - - - -Contact lens fitting ------------------------------------------Visual training (orthoptics)----------------------------------Developmental vi?iion ------- ------- ------- ------- ------- -------Prescribing low vision aids -----------------------------------Industrial vision ------ ------- ------- ------- ------- ------- ----Other ------- ------- -.------ ------- -------- ------- ------.- ------
. .
Secondary
Total ---------------------------------------------------
No secondary activity -.----- ------- ------- ------- ------- ------General practice - --- --- - - --- - - - --- --- -- - - -- --- - -- - -- - -- -- -- - --Contact lens fittiUg ------------------------------------------Visual training (orthoptics)----------------------------------Developmental visicm ------------------------------------------Prescribing low vision aids -------- --.----- -------- -------- ---Industrial vision--=------------------------------------------Other ---------------- ---------------- -------- -------- -------- -
—
Numberengaged
inactivity
18,299
17,657368
:?6
;:
18,299
2,3732,709
10,5881,104483218611213
Percentdistribution
100.0
96.52.00.30.50.00.20.5
100.0
13.014.857.96.0
::;3.31:2
&
.
‘
Patient Services Rendeked.
Fourteen specific pa~ientservices werelisted
on the survey questjo&aire andrespondentswereasked to check those rerideced by them or undertheir direction. The 14 services in descending
order from the most’frequently rendered to theleast are ranked intable C. Judging from mediantendencies, the typical practitioner rendered at
least eight or nine of these services, in mostinstances the services Iistedabovethedotted line.Services below the fin5 were less commonlypro-vided; substantially fewer than one-half of theNation’s practitioners rendered anyone ofthese
six services. .
A substantial overlapoccurredbetweenserv-
ices rendered by optometrists and those ren-dered by the Nat~on’s oph~halmologists duringthe same reporting period. Examples of overlap
include: 8,282 ophthalmologists engaged indiag-nostic examination (including tonometry), 7,802performed visual field examinations, 4,834 re-ported the fitting of contact lenses, 4,571 pre-
scribed low-vision aids, 2,710 provided orthoptictraining or directed its provision, and 786 re-
ported aniseikonic testing among their activities(Series 14, No. 7).
Volume of Patient-Care Activity
Volume of patient-care activity was directlyassessed by two items on the survey question-naire. Respondents were asked: “In your opto-metric practice, approximately how many patientvisits for all purposes do you have during atypical week?” and further: “A@proximately howmany patients does .this represent? (Patients with
multiple visits should be counted only once). ”
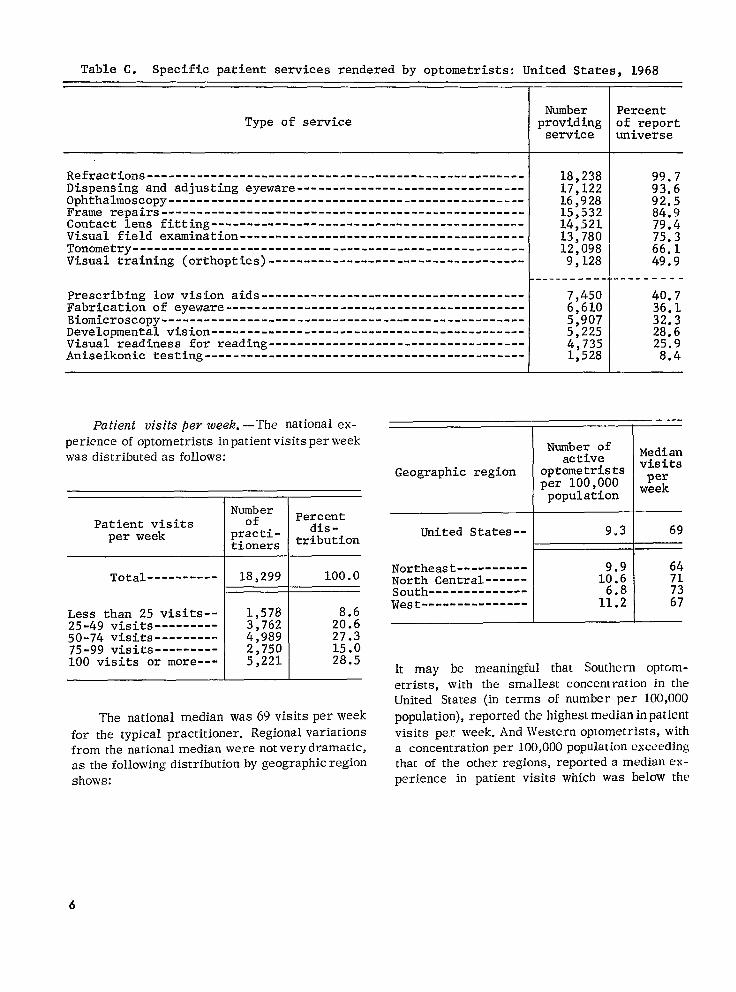
Table C. Specific patient servicesrendered by optometrists:United States, 1968
I
Type of serviceNumber Percentproviding of reportservice universe
Refractions-----------------------------------------------------Dispensing and adjustingeyeware--------------------------------Ophthallnoscopy--------------------------------------------------Frame repairs---------------------------------------------------Contact lens fitting--------------------------------------------Visual field examination----------------------------------------Tonometry-------------------------------------------------------Visual training (orthoptics)------------------------------------
Prescribinglow vision aids-------------------------------------Fabricationof eyeware------------------------------------------Biomicroscopy---------------------------------------------------Developmentalvision---------------------------------------------Visual readiness for reading------------------------------------Aniseikoni.ctesting---------------------------------------------
18,23817,12216,92815,53214,52113,78012,098
9,128—---- ----
7,4506,6105,9075,225;,;;:
J
99.793.692.584.979*475.366.149.9
.+---------
40.736,132.328.625.9
8.4
Patient visits pe~week.—The national ex-perienceofoptometristsinpatientvisitsperweekwas distributedas follows:
Geographicregion
1 I
NumberPatient visits of Percent
practi- dis-per week
tioners tribution
Total----------
wLess than 25 visits-- 1,578 8.625-49 visi.ts---------50-74 visi&3---------
3,762 20.64,989 27.3
75-99 visits--------- 2,750 15.0100 visits or more--- 5,221 28.5
The nationalmedian was 69 visitsperweekforthetypicalpractitioner.RegionalVariationsfrom thenationalmedianwere notverydramatic,as thefollowingdistributionbygeographicregionshows:
I Number ofactive
optometristsper 100,000population
United States--
Northeast----------North Central------South--------------West---------------
I 9.3
9.910.6
1$5
Medianvisitsperweek
69
64717367
It may be meaningfulthat Southernoptom-etrists,with the smallestconcentrationintheUnitedStates(interms ofnumber per 100,000
population),reportedthehighestmedianinpatientvisitsper week.And W’esternoptometrists,witha concentrationper 100,000populationexceedingthatoftheotherregions,reporteda medianex-periencein patientvisitswhichwas belowthe
6

nar,ional median. Assuminga need for optometricservices which was fairly uniform regardless ofgeographic area, this might indicate thatthetypi-
cal Southern optometrist was, at least partially,
attempting to compensate for his comparativescarcity in that area by extending the volume ofhis patient-care activity. It is clear, however,that factors other than simple geographic con-cunt ration were at work to influence the volumeof patient-care activity. Thus optometrists of theNorth Central Region, with a concentration ex-ccwded only by Western optometrists, still re-ported a median in patient visits which exceededthe national median and in fact was second only
ro the median reported by the Southern optom-etrist.
Figure 2 plots the relationship between pa-
tient visits per week and the age of the practi-
tioner. Patient-care activity in terms of visitsper week is seen to peak at a median of about 75visits for optometrists in the age interval from35 to 44 years and to decrease with each age in-
terval until among optometrists over 65years themedian experience was about 40 visits per week.
With a median experience of about 51 visitspcr week, female optometrists reported a rate ofpatient-care activity that was substantially small-~,r than the 69 visits per week reported by therypical male practitioner.
‘rile tabulation that follows reveals the re-Iat ionship between patient visits and the form ofpractic, that the optometrist engaged in.
r-
u--iUnder 35 3544 45.54
.,,,,,.
.’. .
.
55.64
nL._/
65 and over
AGE IN YEARS
1 ,w(t. ) MtYitM, p,{lwnt wws pcr v,cck according to age of optometric practmonec Umted States
1968
MedianDat ient
Solo practice --------- 13,510 65Partnership ----------- 2,178 87Group practice -------- 530 93
Clearly, within the typical multiple-member prac-tice arrangement, the workload in patient visitswas higher than that experienced by the typicalsolo practitioner. It was further noted that, with-
in the partnership or group practice, the medianexperience in patient visits increased in positiveproportion to the number of optometrists prac-ticing in any particular multiple-member ar-
rangement. For example, where two optometristswere engaged, the median was about 87 visits perweek; where three optometrists were involved,the median was 97 visits; and in practice arrange-
ments that involved four or more, the medianexceeded 100 visits per week.
However, in the national perspective of opto-
metric care it must be remembered that prac-titioners in the multiple-member practice formswere in the decided minority, with only 2,178 ofthem practicing in partnerships and 530 engagedin group practice. It was the estimated 13,510
solo practitioners, constituting about 74 percentof the national manpower resource, who withtheir median experience of 65 visits per weekprovided by far the greatest bulk of professionalservice to optometric patients in the United Statesat che time of the survey.
A reference to tables 2 and 3 will suggest the
positive relationship that prevailed between num-ber of patient visits and the following variables:hours worked per week, number of office locations,number of States-licensed in, and number of opto-metric services rendered by the practitioner. Asone increased, so did the other, though not always
in a manner that was exactly proportionaL Forexample, an analysis of the number of optometricservices rendered yielded the following:
7

MedianNumber of optometric services patient
rendered visits
I per week
1-3 services ------------------- 474-6 services ------------------- 647-9 services ------------------- 7010 services or more ------------ 74
Patients seenpev zueek.—The tendencies—noted in the discussion of patient visits per weekalso apply generallyto the number of optometric
patients seen per week.The national experience of optometric pa-
tients seen per week was as follows:
I INumber
Patients seen of Percentdis -
per week practi-tioners tribution
Total ----------
WLess than 25
patients ------------ 4,086 22.325-49 patients ------- 6,886 37.650-74 patients ------- 3,719 20.375-99 patients ------- 1,726100 patients or more- 1,881 1:::
I I
The national median was 43 optometric patientsseen per weekby the typicalpractitioner.Atom-
parison to the median of 69 patient visits perweek roughly suggests the extent to which multi-ple visits were made by the same patient withina single week. Regional distribution of the median
patients seen per week is as follows:
Median Median
Geographic region patients patientseen visits
I per I perweek week
United States--- 43 69,
Northeast ------------- 41 ;:North Central --------- 45South ----------------- 44West ------------------ 43 :;
o 1 II ....il J I JUnder 35 3544 4554 5564 65 and o.m
AGE IN YEARS
Fugure3. Med!an pat!ents seen per week acccidmg m w of ap:ometrrc praclmcmer Um!ed S1dtP519s8
Figure 3 plots the relationship between
patients seen per week and the ageoftheprac-titioner. The median of patients seen per weekis seen to peak at about 47 patients for optom-etrists in the age interval 35-44 years andde-crease with advancing age until among opto-metrists over 65 years themedian experiencewasonly about25 patients per week.
With a median experience ofabout34patients
seen per week, female optometrists reportedpatient-care activity that was substantially small-er than the 44 patients per week reported by thetypical male practitioner.
Tabulated below are figures revealing the
relationship between patients seen per week andthe form of practice that the optometrist engagedin.
Solo practice --------- 1;,:;; 40Partnership ----------- 55Group pract_lce -------- ’530 60
Clearly, withinthe typicalmultiple-member prac-tice arrangement the number of patients seenwas higher than that experienced by the typicalsolo practitioner. It was further noted that, with-
in the partnership or group practice, the median
in patientsnumber of
seen increased in proportion to theoptometrists practicing in any par-
8
t icular multiple- member arrangement. For ex-ample, where two optometrists were engaged,
the median was about 53 patients per week;
wh~’re three optometrists were involved, themedian was 63 patients; and, in practice arrange-ments that involved four optometrists or more,th~ median was 70 patients per week.
However, in the national perspective of opto-
metric care, it must be remembered that prac -tit icmers in the multiple-member practice formswere in the decided minority, with only 2,178 oftheir numbers practicing in partnerships andonly 530 engaged in group practice. It was theestimated 13,510 solo practitioners, constituting
about 74 percent of the report universe who, withtheir median experience of 40 patients per week,provided by far the greatest bulk of professionalsemrice to optometric patients in the United States
at rhu time of the survey.A reference to tables 5 and 6 will suggest
the positive relationship that prevailed betweennumber of patients seen per week and the follow-
ing variables: hours worked per week, number of
office locations, number of States licensed in,and number of optometric services rendered by
the practitioner. As one increased, so did theother.
UTILIZATION OFSUPPLEMENTARY PERSONNEL
General Characteristics of Users
of Auxiliary Personnel
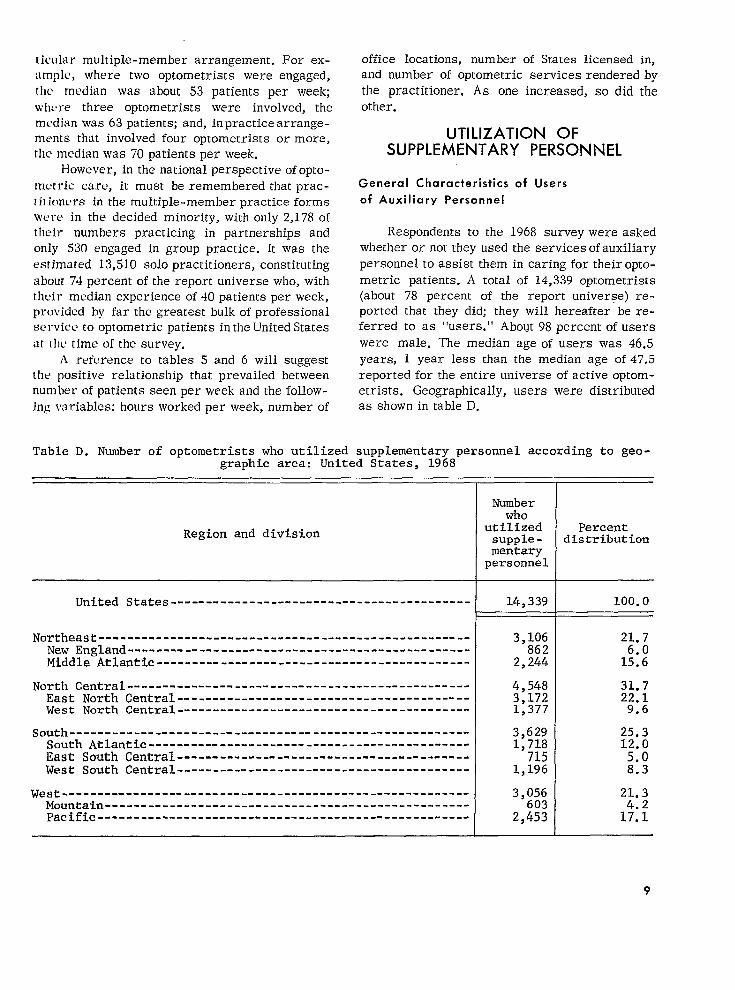
Respondents to the 1968 survey were askedwhether or not they used the services of auxiliary
personnel to assist them in caring for their opto-metric patients. A total of 14,339 optometrists(about 78 percent of the report universe) re-ported that they did; they wilI hereafter be re-ferred to as “users.” About 98 percent of users
were male. The median age of users was 46.5
years, 1 year less than the median age of 47.5reported for the entire universe of active optom-etrists. Geographically, users were distributedas shown in table D.
Table D. Number of optometrists who utilized supplementary personnel according to geo-graphic area: United States, 1968
Region and division
United States ------------------------------------------
Northeast ----------------------------------------------------New England -------- -------- -------- -------- -------- --------Middle Atlantic --------------------------------------------
North Central ------------------------------------------------East North Central -----------------------------------------West North Central -----------------------------------------
South --------------------------------------------------------South Atlantic ---------------------- -----------------------East South Central --- --- --- -- - -- -- - - . -- - - ,. - --- - - -- -- --- -- - .West South Central -----------------------------------------
West --------- -------- -------- -------- -------- -------- ---.----Mountain ---------------------------------------------------Pac~fic ----.,--- -------- -----------”---- -------- -------- -----
Numberwho
utilizedsupple -mentary
personnel
14,339
3,106862
2,244
4,5483,1721,377
3,6291,718
7151,196
3,056603
2,453
Percentdistribution
100.0
21.7
1:::
31.722.1
9.6
25.312.05.08.3
9

The tendency to use supplementary personnelwas strongest among optometrists of the SouthRegion, where about 88 percent of the patient-serving optometrists reported the use of assist-
ants. This was well above the 78 percent calcu-lated for the Nation as a whole, and, when oneremembers that the concentration of optometristsin the South (6.8 per 100,000 population) was sub-stantially lower than the ratio for any other regionin the United States, this rate may suggest thatthe Southern optometrist was at least partiallycompensating for his relative scarcity by usingassistants in an effort to extend his range ofservices.
There was a direct relationship between formof practice and the reported usage of supple-mentary assistants. Whereas about 74 percent ofthe Nation’s solo practitioners relied on supple-mentary personnel, the figure was 93 percentfor optometrists in partnerships and about 96percent for those engaged in group practice.However, since users in solo practice outnum-bered users in the other practice forms by almost4 to 1, it is clear that most supplementary per-
sonnel performed their services for solo prac-titioners.
The questionnaire requested information onthe utilization of six specific types of supplemen-tary assistants. Of the Nation~s 14,339 users ofauxiliary personnel, about 84 percent utilized
the services of secretaries and/or receptionistsand 30 percent utilized general optometric as-sistants (supplementary personnel who spent lessthan 75 percent of their time in any of the assist-
ant categories were counted as general opto-metric assistants). Sixteen percent utilized dis-pensing opticians, 10 percent utilized optical tech-
nicians (shopmen), 5 percent utilized optometrictechnicians, and 4 percent utilized contact lenstechnicians.
Certain professional characteristics of the
user are brought into sharper focus when theyare directly contrasted with corresponding char-acteristics of the 3,960 members of the reportuniverse who reported that they did not utilize
supplementary persomel. For example, the typi-cal user reported about 76 visits by eye patientsper week; the typical nonuser, about 45. Thetypical user saw about 48 patients in the course
of a week; the typical nonuser saw only about 28.
The following tabulation contrasts the rangeof professional activity of the user of supple-mentary personnel and the nonuser by the extentto which each provided 14 selected patient serv-
ices or directed the provision of these services.
Patient service
Refractions --------------Visual field examLnation-Tonometry ----------------Ani.seikonic testing ------Biomicroscopy ------------ophthalmoscopy -----------Contact lens fitting -----Visual training
(orthoptics) ------------Developmental vLsion -----Prescribing low vision
aids --------------------Visual readiness for
reading -----------------Dispensing and adjusting
eyeware -----------------Frame repai.rs ------------Fabrication of eyeware---
!4!2!.5Percent
99654;
i:61
4219
29
18
90
E
Note the direct relationship between use of sup-
plementary personnel andthe tendency to rendc,rany of the services except refractions. For
several of the services (e.g., tonometry, bio-microscopy, and fitting contact lenses), the rc,-Iiance on supplementary assistance is especiallyevident.
Judging bythe number of the 14servicesthat
optometrists provided, without regard for the
frequency of rendition or for the time ordegrecof sophistication involved in the performance ofeach service, about 78 percent of all users re-ported that they provided more than seven of the14 services, as opposed to about 54 percent of
all nonusers.
Number of Supplementary Personnel
The typical patient-serving optometrist who
used supplementary personnel inthe United States
in 1968 utilized the services of 2.1 assistants
10
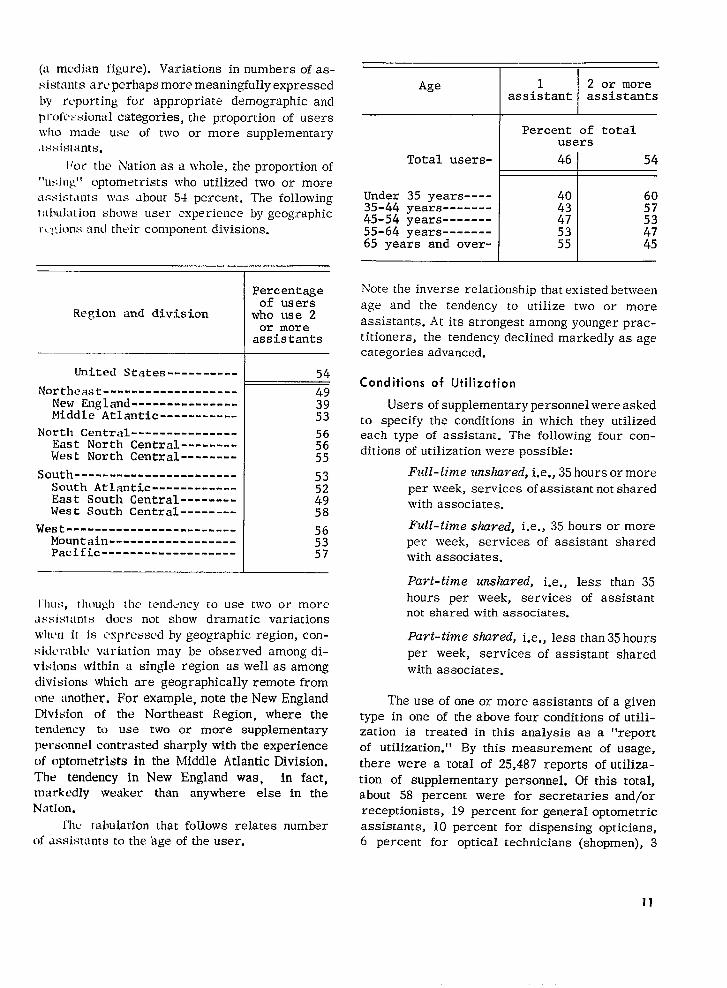
(a median figure). Variations in numbers of as-sist:mts are perhaps more meaningfully expressed
hy r~porting for appropriate demographic andp rofcssional categories, the proportion of userswho made use of two or more supplementary.lssjstants.
1+’ot- the Nation as a whole, the proportion of
“using” optometrists who utilized two or more~~ssist;lnts was about 54 percent. The followingtt~hulut ion shows user experience by geographicl“Lj\iOnS ~td th~k COITIpOtEIN divisions.
Percentageof users
Region and division who use 2
I or moreassistants
Uni,ted States ----------
F
54
Northeast ------------------- 49New I&land ---------------Middle Atlan&Lc ----------- ::
North Central ---------------East North Central -------- ;:West North Central-------- 55
South ----------------------- 53South Atlantic ------------ 52East South Central -------- 49West South Central -------- 58
West ------------------------Mountain.----------------- 3Pacific------------------- 57
I’bus, rh(mgh the tendency to use two or moreassistants dots noc show dramatic variationswhcm it is expressed by geographic region, con-Sid~lrJbk’ variation may be observed among di-visions within a single region as well as among
divisions which are geographically remote fromme mtother. For example, note the New England
Division of the Northeast Region, where thetendency to use two or more supplementarypersonnel contrasted sharply with the experience
of optometrists in the Middle Atlantic Division.
The tendency in New England was, in fact,markedly weaker than anywhere else in theNat-ion.
The tabulation that follows relates numberof assistants to the hge of the user.
[ I
Age 1 2 or moreassistant assistants
Percent of totalusers
Total users- 46 I 54
Under 35 years---- 4035-44 years ------- 43 :;45-54 years ------- 5355-64 years ------- :; 4765 years and over- 55 45
Note the inverse relationship thatexisted between
age and the tendency to utilize two or more
assistants. At its strongest among younger prac-titioners, the tendency declined markedly asagecategories advanced.
Conditions of IJtilization
Users ofsupplementary personnelwere askedto specify the conditions in which they utilizedeach type of assistant. The following four con-ditions of utilization were possible:
Full-timeunshwed, i.e., 35hoursor more
per week, services ofassistantnot sharedwith associates.
Full-times hyed, i.e., 3jhours or more
per week, services of assistant sharedwith associates.
Part-time unshared, i.e.,less [ban 35
hours per week, services of assistantnot shared with associates.
Pavt-timeshwed, i.e., less than35hours
per week, services of assistant sharedwith associates.
Theuseof oneor more assistants of agiventype in one of the above four conditions of utili-zation is treated in this analysis as a “reportof utilization. ” By this measurement of usage,there were a total of 25,487 reports of utiliza-
tion of supplementary personnel. Of this total,about 58 percent were for secretaries and/orreceptionists, 19 percent for general optometricassistants, 10 percent for dispensing opticians,6 percent for optical technicians (shopmen), 3

percent fur optometric technicians, 2 percentfor contact lens technicians, and 3 percent were
for other types of supplementary personnel (e.g.,
orthoptists). Members of this “other” categorywere not reported with sufficient frequency towarrant separate treatment in this report.
An overall analysis of the conditions in which
assistants were used showed that, in order ofpreference, about 70 percent of all reports speci-
fied fill- time utilization, about 30 percent speci-fied pavt-tim~; 64 percent of all reports specifiedunshared utilization, and 36 percent specified the
shwing of assistants with associates.
When these two fundamental bases of usage
were combined, it was apparent that:
.43 percent of all reports of utilization speci-fied assistance on ajidl- time unshared basis.
027 percent specified assistance on a full-time shared basis.
.22 percent specified assistance on a pavt-time unshaved basis.
● 9 percent specified assistance on a pvt-
time shaved basis.
In the discussion that follows, the basis of
utilization will be seen to vary with the specifictype of assistant under consideration. The pref-
erence was generally for the full-time unsharedutilization of secretaries and/or receptionists.General optometric assistants were likewisegenerally used on a full-time unshared basis.
For optometric technicians, dispensing opticians,
contact lens technicians, and optical technicians,however, the preference was for full-time sharedpersonnel. Only with the undifferentiated “other”types of assistants did the reports of utilizationfavor assistance on a part-time basis.
Utilization of Secretaries
andlor Receptionists
There were 14,661 reports of utilization ofsecretaries and/or receptionists. Assistants of
this type were distributed according to the follow-
ing conditions of usage. About 45 percent of thereports of utilization specified utilization on a
fill-time unshared basis, 21 percent specifiedfill-time shayed, 25 percent specified part-timeunshaved, and 9 percent specified utilization ona pwt-time shared basis. Thus full-time unshared
utilization was the most popular condition ofusage and part-time shared utilization the least
popular.Of the 12,044 optometrists who utilized sec-
retaries and/or receptionists, about 66 percentused one; about 23 percent used two; and 11 per-cent used three or more. When an optometristreported the use of only one assistant of any
type, in almost eight cases out of 10 this assist-ant was a secretary or receptionist. Of thosewho reported that they used two assistants ofany type, about 85 percent reported that the as-sistants included at least one secretary or re-
ceptionist. And, of those who reported the useof three or more assistants of any type, about92 percent reported that their assistants in-cluded one or more secretaries and/or recep-tionists.
The following tabulation shows the extent to
which the utilization of secretaries and recep-tionists was reflected in the tendency to renderspecific patient services.
Patient service Users Nonusers
Refractions --------------Visual field examination-Tonometry ----------------Aniseikonic testing ------Biomicroscopy ------------Ophthalmoscopy -----------Ophthalmoscopy----------Contactlens fitting -----Visual training
(orthoptics) ------------Developmental vision -----Prescribing low vision
aids --------------------Visual readiness for
reading -----------------Dispensing and adjusting
ey,eware -----------------Frame repairs ------------Fabrication of eyeware---
Percent
99;:72 ;;
9
;: ;;84 70
51 4730 26
44 35
27 24
94 9286 8338 33
I I
Note that the addition of administrative personnel
increased the tendency to perform all patientservices except routine refractions. The influence
was a general one. It probably operated by freeingthe optometrist from the performance of routineclerical and administrative tasks, thus allowinghim more time for his strictly clinical functions.
12

Utilization of General Optometric Assistants
There were 4,8:32 reports of utilization for
gt’neral optometric assistants; this included per-sons who spent less than 75 percent of their time
in any of the assistant categories. They weredistributed according to the following conditionsof usage, About 48 percent of the reports of
ut i Ilzation specified use on a jidl- time unsharedhfisis, 22 percent on a full-time shuved basis,23 percent on a pm+- time unshaved basis, and 7pe twnt specified use on apart-time shaved basis.Thus, as with secretaries and receptionists, full-
time unshared utilization was the most popularcondition of usage and pal t-time shared utili-
zation the least popular.Llf the 4,230 optometrists who utilized gen-
eral optometric assistants, about 71 percent usedone, about 20 percent used twa, and about 9 percent
Liscd three or more. of thc,se who reported that
they used two assistants, about 35 percent re-ported that the two includeG at least one generaloptometric assistant. And, of those who reported
the use of three or more assistants of any type,about 45 percent reported that the number includedone or more general optometric assistants.
The following tabulation shows the extent to
which the utilization of general optometric assist-ants was reflected in the tendency to render specif-ic patient services.
Patient service
l=+=
Refractions --------------Visual field examination-Tonometry ----------------An&seikonic testing ------Biomicroscopy ------------Ophthalmoscopy -----------Contact lens fitting -----Visual training
(orthoptics)------------Developmental visionPrescribing low vision
aids --------------------Visual readiness for
reading----------------”Dispensing and adjusting
eyeware -----------------Frame repa&rs ------------l?abrication of eyeware---
Percent
96 I 9189 77
36.
968939
4725
38
23
938435
Note that the addition of general optometricassistants generally increased the tendency toperform all the clinical functions except routinerefractions. It was most dramatically manifest
in the tendency toperformthediagnosticfunctionsof biomicroscopy andtonometry.
Utilization of Optometric
Technicians
There were 707 reports of utilization ofoptometric technicians. Assistants of this type
were distributed according to the following con-ditions of usage. About 36 percent of the reports
of utilization specified utilization on ajidl-tirneunslzaved basis, 44 percent specified aji.dl-timeshared basis, 11 percent specified a pwt-timeunshared basis, and 9 percent specified utili-
zation on a pavt-time shaved basis. Thus in con-trast with the utilization of administrative per-sonnel and general optometric assistants, full-time shared utilization was the most popular
condition of usage for optometric techniciansalthough part-time shared utilization remainedthe least popular.
Of the relatively fewoptometrists (650) whoutilized optometric technicians, about 75 percentused one, about 16 percent used two, and about10 percent used three or more. Of optometrists
who reported using only one assistant of anytype, fewer than 1 percent reported that this oneassistant was an optometric technician. Of thosewho reported that they used two assistants, about
4 percent repofted that the two included at least
one optometric technician. And, of those whoreported the use of three or more assistants ofany type, about 13 percent reported that the number
included one or more optometric technicians,The following tabulation shows the extent to
which the utilization of optometric technicianswas reflected in the tendency to render specificpatient services. Except for a slightly negativeeffect on the function of dispeming and adjust-
ing, the addition of optometric technicians gen-
erally increased the tendency of optometriststo render all of the clinical functions. Mostpronounced was the increased tendency to per-form the diagnostic functions of biomicroscopy
and aniseikonic testing.
/

Patient service
Refraction---------------Visual field examination-Tonometry----------------Aniseikonictesting------Biomicroscopy------------Ophthalmoscopy-----------Contact lens fitting-----Visual training(orthoptics)------------
Developmentalvision-----Prescribinglow visionaids--------------------Visual readiness forreading-----------------Dispensing and adjustingeyeware-----------------Frame repairs------------Fabricationof eyeware---
Users Nonusers
Percent
1007772
::9384
5333
50
33
::45
Utilization of Dispensing Opticians
99
:2
3;9279
5028
40
26
948536
There were 2,455reportsof utilizationofdispensingopticians.They were distributedac-
cording to the followingconditionsof usage.About 37 percentof the reportsof utilizationspecifiedutilizationon a ji.dl-timeunshwedbasis,48 percem on a&n-time shavedbasis,8percentspecified pwt-timeunshwed utdization,and 7 percentspecifiedpart-time shaved utili-zation.Thus,as withtheutilizationofoptometrictechnicians,full-timesharedutilizationwas themost popularconditionofusage.
Of the2,231optometristswho utilizeddis-pensingopticians,about62 percentused one,
about20 percentused two,andabout18percent
used threeor more. Of optometristswho re-portedusingonlyoneassistantofanytype,onlyabout2 percentreportedthatthisoneassistantwas a dispensingoptician.Ofthosewho reportedthattheyused two assistants of anY tYPe,againonly a small proportion (about 12 percent) re-
ported that the two includedatleast onedispensingoptician. However, among optometrists who re-portedtheuseofthreeormore assistantsofanytype,a moresubstantialnurnber,about44percent,tendedto use one or more dispensingopticians.
The followingtabulationshowstheextenttowhichtheutilizationofdispensingopticianswas
reflected in the tendency to render specificpatientservices.
Patient service
Refractions--------------Visual field examination-Tonometry----------------Aniseikonic testing------Biomicroscopy------------Ophthalmoscopy-----------Contact lens fitting-----Visual training(orthoptics)------------
Developmentalvisi_on-----Prescribinglow visionaids--------------------Visual readiness forreading-----------------Dispensingand adjustingeyeware-----------------
Frame repairs------------Fabricationof eyeware---
EPercent
99
:;8
;:
5230
41
27
948635
Note thatthetrendrecordedforusersofadmin-istrativepersonnel,generaloptometricassist-
ants,and optometrictechnicianswas generallyreversedamong usersofdispensingopticians.That is,optometristswho were assistedbydis-pensingopticiansshowed a reducedtendcncytoperform most patientservicesotherthanthefabricationofeyeware.The presenceofa dis-pensingopticianappearedtocreateanincreasedtendencytoward specializationamong optome-tristswho usedthem.
Utilizationof Contact Lens Technicians
There were 539 reports of utilization forcontact lens technicians. Assistants ofthis typewere distributedaccordingtothefollowingcon-ditionsof usage.About26percentofthereportsof utilizationspecifiedutilizationon afill-timeunsl.zwed basis,49 percentona~11-time sharedbasis, 18 percent specified pwt-timeunshuwdutilization,and 7 percentspecifiedpad-timeshared utilization.Again,aswithoptometrictech-niciansanddispensingopticians,full-timesharedutilizationwas thepreferredconditionofusage,
Of therelativelyfewoptometrists(516) whoutilized contact lenstechnicians,about81percent
14

used one, about 12 percent used two, and about7 percent used three or more. Of the 6,655 optom-etrists who reported using only one assistant
of any type, only 8 practitioners (O.1 percent)reported that this one assistant was a contactlens technician. Of optometrists who reported
that they used two assistants of any type, only1-2 percent reported that the two included atleast one contact lens technician. When the optom-etrist used three or more assistants of any
type, there was a somewhat stronger tendencyto include contact lens technicians--about 11percent of these optometrists reported using oneor more contact lens technicians.
The following tabulation shows the extent towhich the utilization of contact lens technicianswas reflected in the tendency to render specificputient services.
Patient service
Refractions --------------Visual field examination-Tonometry ----------------AnLseikonic testing ------Biomi.croscopy ------------Ophthalmoscopy -----------Contact lens fitting -----Visual training
(orthoptics)------------Developmental vision -----P:::ri.bing low vision
-------- -------- ----Visual readiness for
reading -----------------Dispensing and adjusting
eyeware-----------+-----Frame repairs ------------Fabrication of eyeware---
+
Percent
%66
8
;:79
5029
41
26
948536
rhe use of contact lens technicians understand-
ably increased the tendency to perform the serv-
ice of contact lens fitting, evidently at the ex-pense of most other patientserviceswithanis-uilwnictestingand biomicroscopy being inter-
estingexceptions.
Utilization of Optical Technicians
There were 1,596 reportsoptical technicians (shopmen).
of utilization forThey were dis-
-.
tributedaccordingto the followingconditionsof
usage. About 28 percent of the reportsofutili-
zationspecifiedutilizationona~ll-time unshaved
basis,51 percent on afi11-timesha~ed basis, 12percent of the reports specified part-time un-
shared utilization, and 9 percent specified part-
time sh~ed utilization. As it waswith optometrictechnicians, dispensing opticians, andcontact lenstechnicians, there is aclearpreference for full-time shared utilization of this type of assistant.
Gf the 1,474 optometrists whoutilized opti-cal technicians (shopmen), about 67 percent usedone, about 17 percent used two, and about 17percent used three or more. Of optometrists whoreported using only one assistant of any type,fewer than 1 percent reported that this oneassistant was an optics-l technician. Of those whoreported that they used two assistants of any
type, again only a small proportion (about 7 per-cent) reported that the two included at least oneoptical technician. However, among optometristswho reported the use of three of more assistants
of any type, a more substantial proportion (about30 percent) tended to use one or more opticaltechnicians.
The following tabulation shows the extent towhich the utilization of optical technicians wasreflected in the tendency to render specificpatientservices.
Patient servi,ce
Refractions---------------Visual field examination--Tonometry-----------------Aniseikonic testing-------Biomicroscopy -------------Ophthalmoscopy ------------Contact lens fitting------Visual training(orthoptics)-------------
Developmental vision-----P-rescribing low visionaids-------:-------------
Visual readiness forreading------------------
Dispensing and adjustingeyeware---------------.--
Frame repairs -------------Fabrication of eyeware----
Users Nonusers
Percent
9969627
;:78
3922
38
20
93
::——
99
::8
:;79
5129
41
26
948534
15

Predictably, users of optical technicians showedan increased tendency towards the fabrication ofeyeware. As a possible consequence of this in-
creased emphasis, the tendency was to reducethe provision of most of the other patient serv-ices.
The optometrist’s utilization of supplemen-tary personnel is summarized in the table thatfollows:
Type of assistant
Numberof
reportsof
utili-zat ion
Secretaries/receptionists------General optometric assistants-O-ptometric technicians ---------Dispensing opticians -----------Contact lens technicians-------Optical technicians (shopmen)--Other type personnel (e.g.,orthoptists)------------------
14,6614,832
7072,455
5351,586
707
Optometrists were notthe onlyprofessionalgroup with a need for supplementary eye-carepersonnel. Ophthalmologists used them too. Thefindings of the 1968 survey of ophthalmologists
suggest a substantial overlap between optome-trists and ophthalmologists in their need for anduse of certain types of eye-care personnel. Forexample, among ophthalmologists surveyed, therewere 1,794 reports of utilization of optical fitters(including opticians). There were also l,263re-ports of utilization of laboratory, ophthalmic,and contact lens technicians, 646 reports ofutilization of orthoptists,222 reports of utilization
of optometrists, and 439 reports of utilizationof other clinical (eye-care) assistants (Series 14,Number9).
000
16

LIST OF DETAILED TABLES
Table 1.
2.
3.
4.
5.
6.
7.
8.
9.
10.
11.
12.
13.
14.
15.
Number and percentweek, according to
Number and percentweek. accordin~ to
distribution of optometrists by number of patient visits perState: United States, 1968-----------------------------------
distribution of optometrists. by number of patient visits pergeographic area and selected characteristics of the optome-
tris~: United ;tates, l968------------------------------------------------------
Number and pe~cent distribution of optometrists by number of patient visits perweek, according to selected professional characteristics of theUnited States, l968----------------------------------.------.---.---~!;~~~~~~
Number and percent distribution of optometrists by number of patients seen perweek, according to State: United states, 1968-----------------------------------
Number and percent distribution of optometrists by number of patients seen perweek, according to geographic area and selected characteristics of the optome-trist: United States, l968------------------------------------------------------
Number and percent distribution of optometrists by number of patients seen perweek, according to selected professionalLlnitedStates, 1968
characteristics of the optometrist:-------------------------------------------------------------
Number and percent distribution of optometrists by number of supplementary per-sonnel of all types used to assist in practice, accordingStates, 1968
to State: United--------------------------------------------------------------------
Number and percent distribution of optometrists by number of supplementary per-sonnel used to assist in practice, according to geographic area and selectedcharacteristics of the optometrist: United states, 1968-------------------------
Number and percent distribution of optometrists by number of supplementary per-sonnel used to assist in practice, according to selected professional charac-teristics of the optometrist: United states, 1968-------------------------------
Number and percent distribution of optometrists by number of secretaries +nd/orreceptionists used to assist1968
in practice, according to State: United States,----------------------------------------------------------------------------
Number and percent distribution of optometrists by number of secretaries andjorreceptionists used to assist in practice, according to geographic area and se-lected characteristics of the optometrist: United States, ~968--------.---------
Number and percent distribution of optometrists by the number of secretariesand/or receptionists they used to assist in practice, according to selected pro.fessional characteristics of the optometrist: United States, 1968---------------
Number and percent distribution of optometrists by number of general optometricassistants they used1968
to assist in practice, according to State: UMted States,-.--------------------------------------------------------------------------
Number and percent distribution of optometrists by number of general optometricassistants they used to assist in practice, according to geographic area andselected characteristics of the optometrist: United States, ~968----------------
Number and percent distribution of optometrists by number of general optometricassistants they used to assiat in practice, according to selected professionalcharacteristics of the optometrist: United states, ~968-------------------------
Page
19
21
23
25
27
29
31
33
35
37
39
41
43
45
47
17
LIST OF DETAILED TABLES-Con.
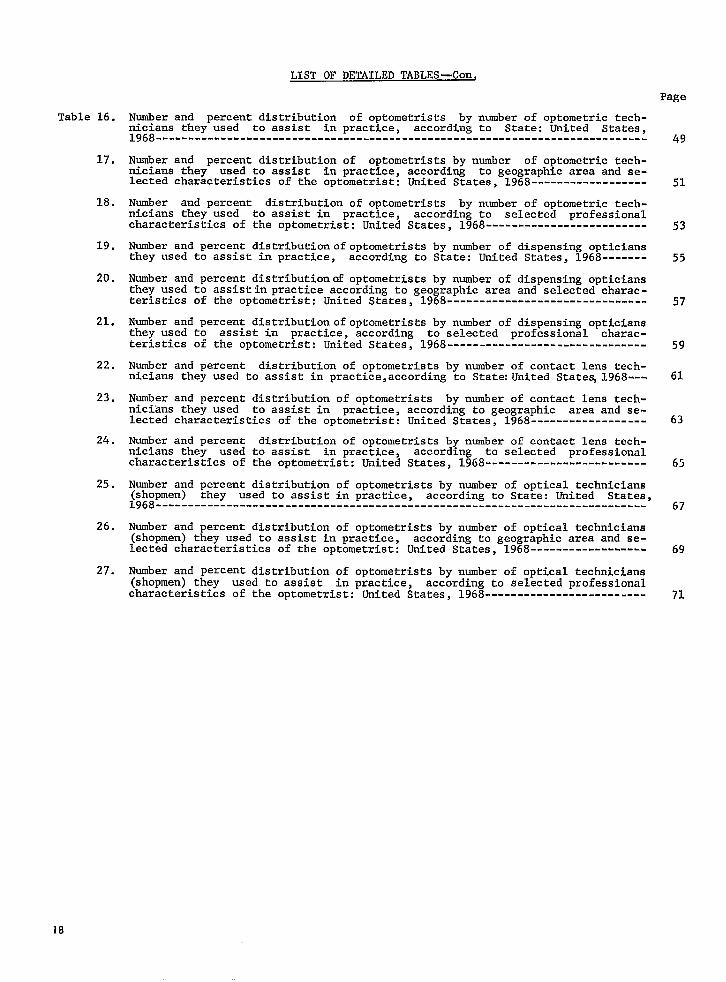
Table 16.
17.
18.
19.
20.
21.
22.
23.
24.
25.
26.
27.
Number and percent distribution of optometrists by number of optometric tech-nicians they used to assist in practice, according to State: United States,l968----------------------------------------------------------------------------
Number and percent distribution of optometrists by number of optometric tech-nicians they used to assist in practice, according to geographic area and se-lected characteristics of the optometrist: United States, 1968------------------
Number and percent distribution of optometrists by number of optometric tech-nicians they used to assist in practice, according to selected professionalcharacteristics of the optometrist: United States, 1968-------------------------
Number and percent distribution of optometrists by number of dispensing opticiansthey used to assist in practice, according to State: United States, 1968-------
Number and percent distributionof optometrists by number of dispensing opticiansthey used to assistin practice according to geographic area and selected charac-teristics of the optometrist: United States, 1968-------------------------------
Number and percent distribution of optometrists by number of dispensing opticiansthey used to assist in practice, according to selected professional charac-teristics of the optometrist: United States, 1968-------------------------------
Number and percent distribution of optometrists by number of contact lens tech-nicians they used to assist in practice,according to State:United States,1968---
Number and percent distribution of optometrists by number of contact lens tech-nicians they used to assist in practice, according to geographic area and se-lected characteristics of the optometrist: United States, 1968------------------
Number and percent distribution of optometrists by number of contact lens tech-nicians they used to assist in practice, according to selected professionalcharacteristics of the optometrist: United States, 1968-------------------------
Number and percent distribution of optometrists by number of optical technicians(shopmen) they used to asaist in practice, according to State: United States,l968----------------------------------------------------------------------------
Number and percent distribution of optometrists by number of optical technicians(shopmen) they used to assist in practice, according to geographic area and se-lected characteristics of the optometrist: United States, 1968------------------
Number and percent distribution of optometrists by number of optical technicians(shopmen) they used to assist in practice, according to selected professionalcharacteristics of the optometrist: United States, 1968-------------------------
Page
49
51
53
55
57
59
61
63
65
67
69
71
18

Table 1. Number and percent distribution of optometrists by number of patient visits per week, accord-ing to State: United States, 1968
State
United States----------------------------
Alabama----------------------------------------Alaska-----------------------------------------Arizona----------------------------------------Arkansas---------------------------------------California:------------------------------------Colorado---------------------------------------Connecticut------------------------------------Delaware---------------------------------------District of Columbia---------------------------Florida----------------------------------------
Georgia----------------------------------------Hawaii-----------------------------------------Idaho--------------------------------------------Illinois---------------------------------------Indiana----------------------------------------Iowa-------------------------------------------
Kansas-----------------------------------------Kentucky---------------------------------------Louisiana--------------------------------------Maine------------------------------------------
Maryland---------------------------------------Massachusetts----------------------------------Michigan---------------------------------------Minnesota--------------------------------------Mississippi------------------------------------Missouri---------------------------------------Montana----------------------------------------Nebraska---------------------------------------Nevada-----------------------------------------New Hampshire----------------------------------
New Jersey-------------------------------------New Mexico-------------------------------------New York---------------------------------------North Carolina---------------------------------North Dakota-----------------------------------Ohio-------------------------------------------Olclahoma---------------------------------------Oregon-----------------------------------------Pennsylvania-----------------------------------Rhode Island-----------------------------------
south Carolina---------------------------------south Dakota-----------------------------------Tennessee--------------------------------------Texas------------------------------------------Utah-------------------------------------------Vermont----------------------------------------Virginia---------------------------------------Washington-------------------------------------West Virginia----------------------------------Wisconsin--------------------------------------Wyoming----------------------------------------
Number of patient visits per week
Totaloptometrists
Les;5than 25-49 50-74 75-99 I::r:r
Number
18,29:
18(1:12:151
2,22:18(25835
4;:
26164
l,6~t503336229229222116
174714708353120431
1:?3670
67471
1,587320
9;?245265
1,133132
15594292740743827235614742841
1,578
6
4:
13147
203411618192813
ii3313
3:81213
792
12022
6+20
109
1182814283
3,762-
4,98S-
47536
6%60728
1;:
6014
4:;126
:;555634
1:;204106
1::
;;1025
191
4::85
2;;667128339
49
:;1792412
;;4113110
5,221
69
967
4;;153150
;:6033
123
5;;83
2:;826127030
50211082802611
1%
1::12
19

Table 1. Number and percent distribution of optometrists by number of patient visits per week, accord-ing to State: United States, 1968—Con.
State
United States----------------------------
Alabama----------------------------------------Alaska-----------------------------------------Arizona----------------------------------------Arkansas---------------------------------------California-------------------------------------Colorado---------------------------------------Connecticut------------------------------------Delaware---------------------------------------District of Columbia---------------------------Florida----------------------------------------
Georgia----------------------------------------Hawaii-----------------------------------------Idaho------------------------------------------Illinois---------------------------------------Indiana----------------------------------------Iowa-------------------------------------------Kansas-----------------------------------------Kentucky---------------------------------------Louisiana--------------------------------------Maine------------------------------------------
Maryland---------------------------------------Massachusetts----------------------------------Michigan---------------------------------------Minnesota--------------------------------------Mississippi------------------------------------Missouri---------------------------------------Montana----------------------------------------Nebraska---------------------------------------Nevada-----------------------------------------New Hampshire----------------------------------
New .Tersey -------------------------------------New Mexico-------------------------------------New York ---------------------------- ---------- -North Carolina---------------------------------North Dakota-----------------------------------Ohio-------------------------------------------Oklahoma---------------------------------------Oregon-----------------------------------------Pennsylvania-----------------------------------Rhode Island-----------------------------------
South Carolina---------------------------------South Dakota-----------------------------------Tennessee--------------------------------------Texas------------------------------------------Utah-------------------------------------------Vermont----------------------------------------Virginia---------------------------------------Washington-------------------------------------West Virginia----------------------------------Wisconsin--------------------------------------Wyoming----------------------------------------
Number of patient visits per week
Totaloptometrists
L=;5than 25-49 50-74 75-99 l::r:r
100.0
100.0100.0100.0100.0100.0100.0100.0100.0100.0100.0
100.0100.010000100.0100.0100.0100.0100.0100.0100.0
100.0100.0100.0100.0100.0100.0100.0100.0100.0100.0
100,0100.0100.0100.0100.0100.0100.0100.0100:0100.0
100.0100.0100.0100.0100.0100.0100.0100.0100.0100.0100.0
Percent distribution
8.6
12:4.73.6
;:;8.57.5
2:;
11.72.9
:::1.6
;::
1;::13.5
20.6
15.7
2;:;18.421.820.924.823.315.318.9
14.137.722.122.018.713.214.419.224.820.2
23.832.216.213.624.620.634+217.127.313.6
30.5
1::;24.723.816.715.726.423.125.2
20.021.616.716.117.522.921.117.316.616.725.0
27’.3
26.431.328.722.830.432.628.023.325.427.5
22.921.331.225.925.121.528.723.825.329.4
26.927.928.830.021.126.322.026.027.336.4
28.342.025.926.728.629.527.126.825.029.4
31.733.021.524.231.831.427.527.328.130.625.0
15.0
16.437.515.717.713.416.318.426.723.719.8
21.7
2:::12.117.615.815.716.410.111.0
23.111.917.717.018.414.312.221.212.121.2
11.220.313.215.917.515.715.316.415.69.2
1?::17.515.814.314.315.416.713.716.911.1
28.5
38.418.828.732.426.020.914.810.025.425.6
36.611.518.227.330.s44.733.332.227.328.4
20.015.132.635.829.030.123.228.130.324.2
18.326.135.026.028.630.833.623.223.822.7
32.422.737.137.934.928.629.630.932.429.330.6
20

Table 2. Number and percent distribution of optometrists by number of patient visits per week,accordingto geographic area and selected characteristics of the optometrist: United States, 1968
Geographic area and selected characteristics ooptometrist
United States----------------------------
Geographic region
Northeast--------------------------------------~~ Central----------------------------------
---------.--------------------------------West-------------------------------------------
Geographic divi?ion
New England------------------------------------Middle Atlantic--------------------------------East North Central-----------------------------West North Central-----------------------------South Atlantic---------------------------------East South Central-----------------------------West South Central-----------------------------pa~g~---------------------------------------
----------------.-------------------.---
Standard Federal Administrative Region
Region I---------------------------------------Region II--------------------------------------Region III-------------------------------------Region IV--------------------------------------Region V---------------------------------------Region VI--------------------------------------Region VII-------------------------------------Region VIII------------------------------------Region IX--------------------------------------Region X---------------------------------------
Age of optometrist
Under 25 years----------------------------------25-34 years------------------------------------35-44 years------------------------------------45-54 years------------------------------------55-64 years------------------------------------65-74 years------------------------------------75 years and over-------------------------------
Sex of optometrist
Male--------------------------------------------Female-----------------------------------------
Number of States licensed in
ps:~:es ------------------------------------------------------- ------------ -----------
2 States---------------------------------------3 States or more-------------------------------
Hours per week usually worked ,
1-34 hours-------------------------------------35-39 hours------------------------------------40 hours---------------------------------------41-44 hours------------------------------------45-48 hours------------------------------------49 hours or more-------------------------------
Number of patient -Tisitsper week
TotalOptometrists
=es;5than 25-49 50-74 75-99 I::r;
18,299
4,7215,8384,1073,633
1,3273,3944,1681,6701,929820
1,358709
2,924
1,3272,2611,8342,049:,:;;
1:151556
2,448725
2,0%;,40;
2;6011,205396
17,912387
13,9%3,3551,005
2,1532,8974,2182,3303,4313,269
l,57f
502475301296
16234C37310614C
1:?
22:
16219919713938610984
2%55
152252406243325191
1,49584
1>29$2;;
730178273108162126
Number
3,762
1,1291,065772795
369760788278382150240155641
369498404390836246192130545152
4%940
1,19966737390
1,656106
7!,915:5:
569747885475616470
4,989
1,2661,5991,0451,079
382885
1,149449519190336217862
3Q2601473520
1,255365292165735200
5;:1,5091,84374227056
4,90089
3,7::949271
414857
1,236638970874
2,750
639894691525
178$;;
269349140203113413
178284306360685218183
3%127
30:907
.,1063;;
25
!,71138
!,034551164
159458660385540547
5,221
1,1851,8011,297938
237948
1,233568540286472179759
237678$$
1,359490400140631191
5;!1,7912,079;:;
34
5,15070
3,91$990316
281656
1,165724
1,1431,252
21

Table 2. Number and percent distribution of optometrists by number of patient visits per week,accordingto geographic area and selectedcharacteristicsof the optometrist:UnitedStates,1968—Con.
Geographic area and selected characteristicsofoptometrist
UnitedStates-----------------------------
Geozrauhicregion
Northeast---------------------------------------gb;;;Central-----------------------------------
-------------------------------------------West--------------------------------------------
Geographic division
New England-------------------------------------Middle Atlantic---------------------------------East North Central------------------------------West North Central------------------------------South Atlantic----------------------------------East South Central------------------------------West SouthCentral------------------------------Mountain----------------------------------------Pacific-----------------------------------------
Standard Federal Administrative Region
RegionRegionRegionRegionRegionRegionRegionRegionRegionRegion
I ------------------------- -------- -------
11---------------------------------------111--------------------------------------Iv---------------------------------------v----------------------------------------w----------------------------------------VII--------------------------------------VIII--------------:----------------------IX---------------------------------------x----------------------------------------
Age of optometrist
Under 25 years----------------------------------25-34years-------------------------------------35-44years-------------------------------------45-54years-------------------------------------55-64years-------------------------------------65-74years-------------------------------------75 yearsand over-------------------------------
Sex of optometrist
Male--------------------------------------------Female------------------------------------------
Number of States licensed in
No States---------------------------------------1 State-----------------------------------------2 States----------------------------------------3 States or more--------------------------------
Hours per week usually worked
1-34hours--------------------------------------35-39hours-------------------------------------40 hours----------------------------------------41-44hours-------------------------------------45-48hours-------------------------------------49 hours or more--------------------------------
Number of patient visits per week
Total ,>tometristsII‘es;5than25-49 50-74 75-99 l;~r~r
I I
Percentdistribution
100.0
100.0100.0100.0100.0
100.0100.0100.0100.0100.0100.0100.0100.0100.0
100.0100.0100.0100.0100.0100.0100.0100.0100.0100.0
100.0100.0100.0100.0100.0100.0100.0
100.0100.0
100.0100.0100.0100.0
100.0100.0100.0100.0100.0100.0
8.6
10.68.27.38.1
12.210.0
R
H
::?8.5
12.2
1::!6.88,57.77.37.08.67.6
1;.:
4:76.19.427.048.3
8.321.6
11.4
::;6.5
33.96.2
::;4.73.9
20.6
23.918.318.821.9
27.822.418.916.619.818.317.721.821.9
27.822.022.019.018.517.216.723.422.320.9
26.723.817.418.125.731.022.7
20.427.4
33.320.919.518.7
26.425.821.020.418.014.4
27.3
26.827.425.429.7
28.826.127.626.926.923.224.730.529.5
28.826.625.825.427.825.625.429.830.027.7
17.327.828.027.828.522.514.1
27.422.9
49.927.028.327.0
19.229.629.327.428.326.7
15.0
13.515.3;:.!.
13.413.615.016.118.117.115.015.914.1
13.412.616.717.615.215.215.914.713.417.6
13.915.316.816.712.0
::;
15.19.9
14.616.416.3
7.415.815.616.515.716.7
28.5
25.130.831.625.8
17.827.929.634.028.034.834.825.326.0
17.830.024.831.330.1;’$;
25:225.826.3
28.325.533.231.324.51;.:.
28.818.2
5.428.129.531.5
13.022.727.631.133.338.3
22

Table 3. Number and percent distribution of optometrists by number of patient visits per week, accord-ing to selected Professional characteristics of the optometrist: United States. 1968
Selected professional characteristicsofoptometrist
United States----------------------------
Principal form of employment
Self employed:S010 practice--------------------------------Partnership----------------------------------Group practice-------------------------------
Employed by:Optometrists---------------------------------Ophthalmologistsor other physicians---------Profit-making firms--------------------------N;~$~fit organizations (includinggovern-
---------------------------------------Other------------------------------------------
Number of optometrists in partnership or g-rouppractice
2 optometrists ---------------------------------3 optometrists ---------------------------------4 optometrists or more-------------------------Not applicable---------------------------------
Number of office locations
1 office ---------------------------------------2 offices--------------------------------------3 offices or more------------------------------
Number of patients seen per week
Less than 25 patients--------------------------25-49 patients---------------------------------50-74 patients---------------------------------75-99 patients---------------------------------100 patients or more---------------------------
Number of supplementaryhelpers of all types
No assistant-----------------------------------1 assistant------------------------------------2 assistants-----------------------------------3 assistants or more---------------------------
Number of optometric services rendered
1-3 services-----------------------------------4-6 services-----------------------------------7-9 services-----------------------------------10 services or more----------------------------
Type of optometric service
Refractions------------------------------------Visual field examination-----------------------Tonometry--------------------------------------Aniseikonic testing----------------------------Biomicroscopy----------------------------------Ophthalmoscopy---------------------------------Contact lens fitting---------------------------Visual training (orthoptics)-------------------Developmental vision---------------------------Prescribing low vision aids--------------------Visual readiness for reading-------------------Dispensing and adjusting eyeware---------------Frame repairs----------------------------------Fabrication of eyeware-------------------------Other------------------------------------------
–,
Number of patient visits per week
Total I t 1 Ioptometrists II‘es;5than25-49 50-74 75-99 l&~r
18,299
13,5102,178530
951171636
183140
2,105421182
15,592
15,0832,806410
4,0866,8863,7191,7261,881
3,9606,6553,8833,801
9004,0757,3445,980
18,23813,78012,0981,5285,907
16,92814,5219,1285,2257,4504,73517,12215,5326,610718
Number
1,578
1,2548829
621050
5035
10113
1,46?
1,36818129
1,578
910408132129
261532495290
1,5611,002653127274
1,244817670352443328
1,3501,12835437
3,762
3,10430560
147
::
2619
306:;
3,396
3,09759075
L,549?,214
1,3521,511543356
216930
1,509L,107
3,752Z,787~,254299
1,0123,423?,821L,917L,056L,404963
3,5111,115L,243139
4,989
3>886526123
239
1::
2922
50510044
i,340
k,10378798
709!,723.,556
L,0002>1341,051803
1861,052?,070L,680
i,9733,8783,436376
1,662~,700t,080~ 561[;476?,040.,3511,712t,285.,746193
2,750
2,02434574
1223489
4120
3355827
2,330
2,27242157
117988975669
2781,132720620
4;:1,1521,047
2,7462,2192,043230
1,0382,6422,3431,496875
1,269778
2,5952,402L,057127
5,221
3,241913244
381
2;!
::
859205
4,0::
4,243826152
133961
1,1881,0581,881
4201,4701,4371,894
1591,0892,1181,856
5,2063,8943,;;;
1,9214,9184,4602,4851,4672,2941,3154,9534,6022,210222
23

Table 3. Number and percent distribution of optometrists by number of patient visits per week, accord.irm to selected professional characteristicsof the optometrist:United States, 1968—COn.
It
Selected professional characteristicsofoptometrist
United States----------------------------
Principal form of employment
Self employed:Solo practice--------------------------------Partnership----------------------------------Group practice-------------------------------
Employed by:Optometrists---------------------------------Ophthalmologists or other physicians---------Profit-making firms--------------------------N~~fit organizations (includinggovern-
---------------------------------------Other------------------------------------------
Number of optometrists in partnership or groupuractice
2 optometrists---------------------------------3 optometrists---------------------------------4 optometrists or more-------------------------Not applicable---------------------------------
Number of office locations
1 office---------------------------------------2 offices--------------------------------------3 offices or more------------------------------
Number of patients seen per week
Less than 25 patients--------------------------25-49 patients---------------------------------50-74 patients---------------------------------75-99 patients---------------------------------100 patients or more---------------------------
Number of supplementaryhelpers of all types
No assistant-----------------------------------.1assistant------------------------------------2 assistants-----------------------------------3 assistants or more---------------------------
Number of optometric services rendered
1-3 services-----------------------------------4-6 services-----------------------------------7-9 services-----------------------------------10 services or more----------------------------
Tvoe of optometric service
Refractions------------------------------------Visual field examination-----------------------Tonometry--------------------------------------Aniseikonic testing----------------------------Biomicroscopy----------------------------------Ophthalmoscopy---------------------------------Contact lens fitting---------------------------Visual training (orthoptics)-------------------Developmental vision---------------------------Prescribing low vision aids--------------------Visual readiness for reading-------------------Dispensing and adjusting eyeware---------------Frame repairs-------,---------------------------Fabrication of eyeware-------------------------Other------------------------------------------
Number of patient visits per week
Totaloptometrists
Les;5than 25-49 50-74 75-99 L;:r:r
Percent distribution
100.0
100.0100.0100.0
100.0100.0100.0
100.0100.0
100.0100.0100.0100.0
100.0100.0100.0
100.0100.0100.0100.0100.0
100.0100.0100.0100.0
100.0100.0100.0100.0
100.0100.0100.0100.0100.0100.0100.0100.0100.0100 ;o100.0100.0100.0100.0100.0
8.6
N5.5
::;7.8
27.425.4
4.83.11.89.4
:::7,0
38.6
23.06.13.43.4
29.013.1
::;
;:55.4
::27.45.67.3
H
::;7.35.45.2
20.6
23.014.011.4
15.510.313.0
14.013.3
14.510.8
2;:;
20.521.018.3
37.932.2
34.122.714.09.4
24.122.820.618.5
20.620.218.619.617.120.219.421.020.218,920.320.520.118.819.4
27.3
28.824.223.1
25.218.021.0
15.615.8
24.023.624.327.8
27.228.123.9
17.439.541.8
25.332.127.121.1
20.725.828.228.1
27.328.128.424.628.127.828.128.128.327.428.527.527.626.426.9
15.0
15.015.914.0
12.920.013.9
22.214.2
15.913.714.914.9
15.115,013.9
1:::26,238.7
1;:818.516.3
1;::15.717.5
15.116.116.915.117.615.616.116.416.817.016.415.215.516.017.6
28.5
24.041.946.0
40.045.844.3
20.831.4
40.848.751.026.1
28.129,437.0
1:::31.961.3100.0
10.622:137.049.8
17.626.728.831.0
28.528.330.732.432.5;:.+
27:228.130.827.828.929.633.431.0
24

Table 4. Number and percent distribution of optometrists by number of patients seen per week, accord-ing to State: United States. 1968
State
LlnitedStates----------------------------
Alabama----------------------------------------Alaska-----------------------------------------ArLzona----------------------------------------Arkansas---------------------------------------California-------------------------------------Colorado---------------------------------------Connecticut------------------------------------Delaware---------------------------------------::::&at d Colmbia ---------------------------
----------------------------------------
Georgia----------------------------------------Iiw&------------------------------”----------
----------------------------------------.-Illinois---------------------------------------Indiana----------------------------------------Iowa-------------------------------------------Kansas-----------------------------------------Kentucky---------------------------------------Louisiana--------------------------------------Malnc----------,---------------------------------
Maryland----------------------------------------Massachusetts----------------------------------Michigan---------------------------------------Minnesota--------------------------------------Mississippi------------------”-----------------Ffissouri---------------------------------------Montana----------------------------------------Nebraska-----------------------------------------Nevada-----------------------------------------New Hampshire----------------------------------
New Setsey -------------------------------------NewMexico-------------------------------------NewYork ---------------------------------------North Carolina---------------------------------North Dakota-----------------------------------~hio-------------------------------------------Qklahoma---------------------------------------Oregon-----------------------------------------.Pennsylvania-----------------------------------Rhode Island -----------------------------------
South Carolina---------------------------------South Dakota-----------------------------------Tennessee--------------------------------------Wx&--.-------.-----------------------”-------
-------------------..----........-----------Ver,nont----------------------------------------Virginia------------------------------------------Washington-------------------------------------West Virginia------------------------------------Wisconsin--------------------------------------Wyoming----------------------------------------
Number of patients seen per week
Total 1 I I IoptometristsII‘es~5than25:49 50-74 75-99 l~~r-
11 I I I I
Number
18,299
180
1$;151
2,222186258
2616486
1,602503336229229222116
174714708353120431
l%3670
67471
1,587320
9%245265
1,133132
155
2%74074
2%35614742841
4,086
23
2:
5Z;4171
1;123
3925
4::9853
;
27
35230
;:339218319
11
2105
249
?:17254
3X42
3327
lx17
5:8239828
6,886
71
5;
7%
J:1824195
8728285771941149987
::
3;:285137391:;
511437
28338601129
3::
%42147
64
%23421
&1305516520
50
3:
4;
605
10;
575
3;:
31105186
;;911238
1:
103
3::5914
21245
&27
31
::15419
5:
g
7
152
::2321314
1
::
373
12:515027241013
234176331333
1?17
33
16:21
10?36
&10
14
;:85
:1931
:22
1,881
21
1:
2%16
82
31
422
17;48
i;21156
12297554
4!
1;44
449
21514
12;1627827
133
1::123
;;11453
25

Table 4. Number and percent distribution of optometristsby number of patients seen per week, accord-ing to State: United States, 1968-Con.
State
United States----------------------------
Alabama----------------------------------------Alaska-----------------------------------------Arizona----------------------------------------Arkansas---------------------------------------California-------------------------------------Colorado---------------------------------------Connecticut------------------------------------Delaware---------------------------------------;;~)~t of Columbia---------------------------
----------------------------------------
Georgia ----------------------------------------Hawaii-----------------------------------------Idaho------------------------------------------Illinois---------------------------------------Indiana----------------------------------------Iowa-------------------------------------------Kansas-----------------------------------------Kentucky---------------------------------------Louisiana--------------------------------------Maine------------------------------------------
Maryland---------------------------------------Massachusetts----------------------------------Michigan---------------------------------------Minnesota--------------------------------------Mississippi------------------------------------Missouri---------------------------------------Montana----------------------------------------Nebraska---------------------------------------Nevada-----------------------------------------New Hampshire----------------------------------
New Jersey-------------------------------------New Mexico -------------------------------------New York---------------------------------------North Carolina---------------------------------North Dakota-----------------------------------Ohio-------------------------------------------Oklahoma---------------------------------------Oregon-----------.---------------.-------------Pennsylvania-----------------------------------Rhode Island-----------------------------------
South Carolina---------------------------------South Dakota-----------------------------------Tennessee--------------------------------------Texas------------------------------------------Utah-------------------------------------------Vermont----------------------------------------Virginia---------------------------------------Washington-------------------------------------West Virginia----------------------------------Wisconsin--------------------------------------Wyoming----------------------------------------
=lFi=EFNumber of patienta seen per week
100.0
100.0100.0100.0100.0100.0100.0100.0100.0100.0100.0
100.0100.0100.0100.0100.0100.0100.0100.0100.0100.0
100.0100.0100.0100.0100.0100.0100.0100.0100.0100.0
100.0100.0100.0100.0100.0100.0100.0100.0100.0100.0
100.0100.0100.0100.0100.0100,0100.0100.0100.0100.0100.0
Percent distribution
22.3
12.612.516.520.624.822.127.626.720.325.0
14.939.327.326.119.515.814.820.628.322.9
20.032.212.415.827.221.320.719.924.215.2
3;.:
15;730.417.518.621.825.628.731.9
21.428.420.017.422.220.020.723.026.619.219.4
37.6
39.643.840.935.334.537.840.450.033.939.6
33.3::.;
36:038.634.143.137.940.941.3
42.543.240.238.832.539.446.332.939.453.0
42.053.637.940.244.434.038.436.437.235.3
;:.:
34:231.728.645.744.536.437.438.650.0
20.3
27.725.023.519.920.124.423.213,310.221.1
21.7
2;::19.122.319.618.122.019.719.3
17.514.726.220.922.821.113.424.721.215.2
15.315.922.818.619.122.918.319.617.620.2
20.023.922.620.825.414.320.2;:.:
20:716.7
9.4
1::;7.8
1::!7.05.6
2;:;.
14.1
1:::
1::?14.811.610.3
1:::
13.1
$:
10:5
;::10.3
1:::
4.910.110.1
1::$11,114.98.4;.:.
1:::
1;:;
1/::6.98.8
1%:5.6
10.3
12.0
1!:!14.710.18.73.2
1::;6.2
16.13.37.810.9
12:112.59.46.65.5
6.9
1::315.2
1;::
12:312.16.1
1:::13.64.4
1!:!
1:::7.25.0
8.3
1:::18.71;.:
.
1::;
1;::8.3

Table 5. Number and percent distribution of optometrists by number of patients seen per week, accordingto geographic area and selected characteristics of the optometrist: United States. 1968
Geographic areaandselected characteristics ofoptometrist
United States----------------------------
Geographic region
Northeast--------------------------------------lJJg~ Central----------------------------------
------------------------------------------west-------------------------------------------
Geographic division
New England------------------------------------Middle Atlantic--------------------------------East North Central-----------------------------West North Central-----------------------------South Atlantic---------------------------------East South Central-----------------------------West South Central-----------------------------Mountain---------------------------------------Pacific----------------------------------------
Standard Federal Administrative Region
Region I---------------------------------------Region II--------------------------------------Region III-------------------------------------Region IV--------------------------------------Region V---------------------------------------Region VI--------------------------------------Region VII-------------------------------------Region VIII ------------------------------------Region IX--------------------------------------Region X---------------------------------------
Age of optometrist
Under 25 years---------------------------------25-34 years------------------------------------35-44 years------------------------------------45-54 years------------------------------------55-64 years------------------------------------65-74 years------------------------------------75 years and over------------------------------
Sex of optometrist ‘
Male-------------------------------------------Female -----------------------------------------
Number of States licensed in
No States--------------------------------------1 State----------------------------------------2 States---------------------------------------3 States or more-------------------------------
Hours per week usually worked
1-34 hours-------------------------------------35-39 hours------------------------------------40 hours---------------------------------------41-44 hours------------------------------------45-48 hours------------------------------------49 hours or more-------------------------------
~
Number of patients seen per week
Number
18,299
4,7215,8384,1073,633
1,3273,3944,1681,6701,929820
1,358709
2,924
1,3272,2611,8342,0494,5211,4291,151556
2,448725
622,0045,4006,6322,6011,205396
17,912387
13,9;83,3551,005
2,1532,8974,2182,3303,4313,269
4,086
1,1711,162883870
388783858304446161276142728
388458479453913281209123606176
4:2879
1,236702569251
3,!33:
3,21;683179
1,082649878440579457
6,886
1,8662,1711,5361,313
5611,3051,536635767296473285
1,029
561884713771
1,673511434217861261
25731
2,0242,5881,03938396
5,753133
85,2141,284381
6271,1991,651884
1,337L,188
3,719
8941,251844730
229665905346378193272151580
229466327444979284236119490147
4i;1,2431,40247114131
3,66653
41,804699212
264566882493751764
1,726
390580409348
90299402178185
li:
2;;
90193180190435153126
2::65
7208599663190556
L,70224
1,27;326128
2::::;
342380
1,881
400675436371
58342468207153
1;;
2;2
2%135191521201146
2$:76
22126557432005712
1,85031
1,41:363103
87220405266423480
27

Table 5. Number and percent distribution of optometrists by number of patients seen per week, accordingto geographic area and selected characteristics of the optometrist: United States, 1968—Con.
Geographic area snd selected characteristics ofoptometrist
United States----------------------------
Geozrauhic re!zion
Northeast--------------------------------------:igg Central----------------------------------
------------------------------------------West-------------------------------------------
Geographic division
New England------------------------------------Middle Atlantic--------------------------------East North Central-----------------------------West North Central-----------------------------South Atlantic---------------------------------East South Central-----------------------------West South Central-----------------------------Mountain---------------------------------------Pacific----------------------------------------
Standard Federal Administrative Region
Region I---------------------------------------Region II--------------------------------------Region III-------------------------------------Region IV--------------------------------------Region V---------------------------------------Region VI--------------------------------------Region VII-------------------------------------Region VIII------------------------------------Region IX--------------------------------------Re~ion X---------------------------------------
Age of optometrist
Under 25 years---------------------------------25-34 years------------------------------------35-44 years------------------------------------45-54 bears------------------------------------55-64 years------------------------------------65-74 years------------------------------------75 years and over------------------------------
Sex of optometrist
Male-------------------------------------------Female-----------------------------------------
Number of States licensed in
No States--------------------------------------1 State----------------------------------------2 States---------------------------------------3 States or more-------------------------------
Hours per week usually worked
1-34 hours-------------------------------------35-39 hours------------------------------------40 hours---------------------------------------41-44 hours------------------------------------45-48 hours------------------------------------49 hours or more-------------------------------
Number of patients seen per week
Totaloptometrists
Les;5than 25-49 50-74 75-99 I::rgr
100.0
100.0100.0100.0100.0
100.0100.0100.0100.0100.0100.0100.0100.0100.0
100.0100.0100.0100.0100.0100.0100.0100.0100.0100.0
100.0100.0100.0100.0100.0100,0100.0
100.0100.0
100.0100.0100.0100.0
100.0100.0100.0100.0100.0100.0
Percent distribution
22.3
24.819.921.524.G
29.223.120.618.223.119.620.320.024.9
29.220.326.122.020.219.718.222.224.724.2
24.421.716.318.627.047.263.5
22.037.7
33.223.120.417.9
50.322.420.818.916.914.0
37.6
39.537.237.436.2
42.338.536.938.039.836.234.840.235.2
42.339.138.937.637.035.737.739.135.236.1
40.636.537.539.039.931.8.24.3
37.734.4
39.237.538.337.9
29.141.439.137.939.036.3
20.3
19.021.420.520.1
17.319.621.720.719.623.520.121.219.8
17.320.617.821.721.619.920.521.420.020.2
20.920.923.021.218.111.77.7
20.513.6
22.220.120.821.1
12.319.520.921.221.923.4
9.4
8.3
1:::9.6
6.8;.:
10:6
;::10.8
1:::
6.88.59.89.3
1%$10.9
1::;8.9
10.510.411.110.0
i::1.4
:::
9.;
1::;
4.39.1
1::210.011.6
10.3
1!::10.610.2
1:::11.212.4
11:;14,110.510.1
1;:27.49.311.514.012.7
1%:10.5
1:::12.111.2
M3.1
10.38.0
li~10.810.3
4.17.69.611.412.314.7
28

Table 6. Number and percent distribution of optometrists by number of patients seen per week, accord-ing to selected professional characteristics of the optometrist: United States, 1968
Selected professional characteristics ofoptometrist
United States----------------------------
Principal form of employment
Self employed:SOlcIpractice--------------------------------Partnership--------------- ------------------Group Ilractice-------------------------------
Employed by:optometrists---------------------------------Ophthalmologistsor other physicians---------Profit-making fires --------------------------Nonprofit organizations (includinggoverment) --------------------------------
Other------------------------------------------
Number of optometrists in partnership or grouppract~ce
2 optometrists---------------------------------3 optometrists--------------------------------..4 optometrists or more-------------------------Not applicable---------------------------------
Number of office locations
1 office---------------------------------------2 offices--------------------------------------3 offices or more------------------------------
Number of patient visits per week
Less than 25 visits----------------------------25-49 visits-----------------------------------50-74 Wisits----------.------.-----------------75-99 visits-----------------------------------100 visits or more-----------------------------
Number of supplementaryhelpers of all types
None-------------------------.-----------------1 assistant------------------------------------2 assistants-----------------------------------3 assistants or more---------------------------
Number of optometric services rendered
1-3 services-----------------------------------4-6 services-----------------------------------7-9 services-----------------------------------10 services or more----------------------------
Type of optometric service
Refractions------------------------------------Visual field examination-----------------------Tonometry--------------------------------------Aniseikonic testing----------------------------Bfomicroscopy----------------------------------Ophthalmoscopy---------------------------------Contact lens fitting---------------------------Visual training (orthoptics)-------------------Developmentalvision---------.,-----------------Prescribing low vision aids--------------------Visual readiness for reading-------------------Dispensing and adjusting eyeware---------------Frame repairs----------------------------------Fabrication of eyeware-------------------------Other------.-----------------------------------
Totaloptometrists
Number of patients seen per week
‘es;5than 25-49 50-74 75-99 l’&~r
18,29$
13,51C2,17E530
951171636
183140
2,105421182
15,592
15,0832,806410
1,5783,7624,9892,7505,221
3,9606,6553,8833,801
9004,0757,3445,980
18,23813,78012,0981,5285,90716,9281$,;;;
5;2257,4504,73517,1221;,:;;
‘718
4,086
3,40425961
152
;:
::
27936
3,762
3,;;;
68
1,5781,549709117133
1,8121,459$;;
3561,1311,5321,068
4,0622,9032,187311978
3,5752,7551,9841,0461,395941
3,7693,3231,239145
Number
6,886
5,478729151
278
1:;
3423
714U?
6,O;;
5,6781,069140
2,2112,723988961
1,4472,9121,4983.,028
2451,4632,8922,285
5,8705,312L,724532
~,178),448$25563,5232,0482,8151,8316,5415,9212,439257
3,719
2,571533127
236
1%
Z
505111
3,02:
3,04859081
1,556975
L,188
4591,368942952
148727
L,534L,31O
3,710!,827!,610315
L,326},521),125!,8521,1181,6311,0323,5093,2371,492149
1,726
1,08227160
1214388
3625
25758
1,3;2
1,4072;;
6661,058
142525464596
3;;695632
L,7231,357L,252171680
.,638-,;;;
493777442
L,571L,46666766
1,881
975384132
16346138
2419
350100
1,32:
1,48831776
l,88i
101392489900
4;;691685
1,8741,3811,325199744
1,7471,596890521831489
1,7311,585773101
29
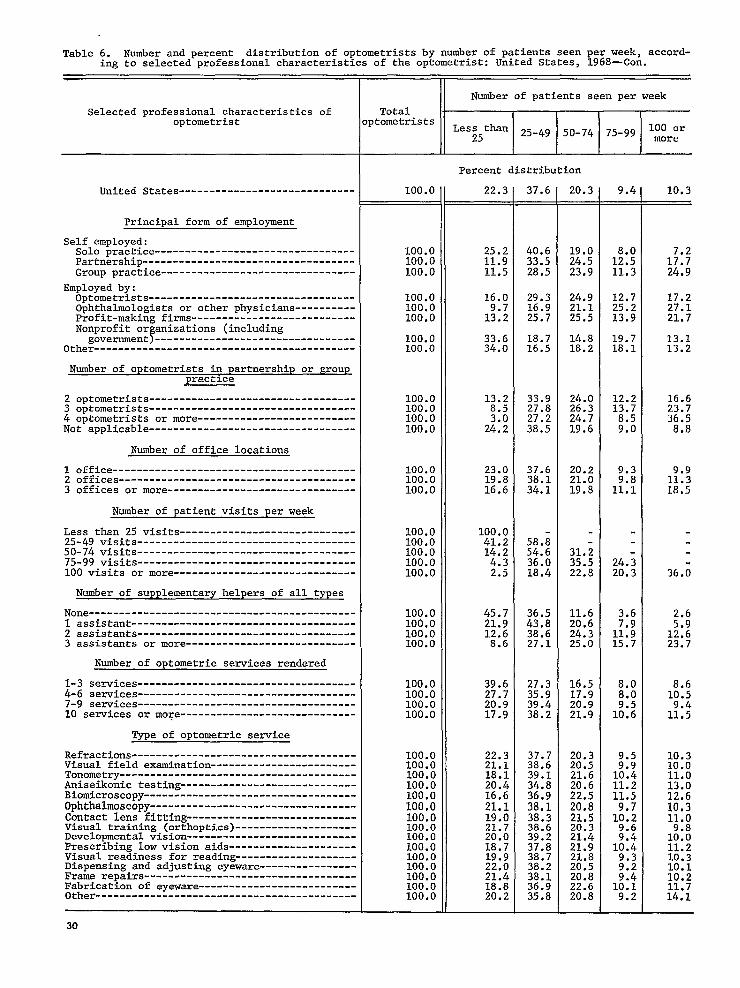
Table 6. Number and percent distribution of optometrists by number of patients seen per week, accord-ing to selected professional characteristicsof the optometrist: United States, 1968—Con.
Selected professional characteristicsofoptometrist
United States-----------------------------
Principal form of employment
Self employed:Solo practice---------------------------------Partnership-----------------------------------Group practice--------------------------------
Employed by:Optometrists----------------------------------Ophthalmologists or other physicians----------Profit-making firms---------------------------Nonprofit organizations (including
government)---------------------------------Other-------------------------------------------
Number of optometrists in partnership or grouppractice
2 optometrists----------------------------------3 optometrists----------------------------------4 optometrists or more--------------------------Not applicable----------------------------------
Number of office locations
1 office----------------------------------------2 offices---------------------------------------3 offices or more-------------------------------
Number of patient visits per week
Less than 25 visits-----------------------------25-49 visits------------------------------------50-74 visits------------------------------------75-99 visits------------------------------------100 visits or more------------------------------
Number of supplementaryhelpers of all types
None--------------------------------------------1 assistant-------------------------------------2 assistants------------------------------------3 assistants or more----------------------------
Number of optometric services rendered
1-3 services------------------------------------4-6 services------------------------------------7-9 services------------------------------------10 services or mo~e-----------------------------
Type of optometric service
Refractions-------------------------------------Visual field examination------------------------Tonometry---------------------------------------Aniseikonic testing-----------------------------Biomicroscopy-----------------------------------Ophthalmoscopy----------------------------------Contact lens fitting----------------------------Visual training (orthoptics)--------------------Developmentalvision----------------------------Prescribing Iow vision aids---------------------Visual readiness for reading--------------------Dispensing and adjusting eyeware----------------Frame repairs-----------------------------------Fabrication of eyeware--------------------------Other-------------------------------------------
30
IIII Number ofpatients seenper week
Totalptometrists
Les;5than 25-49 50-74 75-99 l::r:r
100.0
100.0100.0100.0
100.0100.0100.0
100.0100.0
100.0100.0100.0100.0
100.0100.0100.0
100.0100.0100.0100.0100.0
100.0100.0100.0100.0
100.0100.0100.0100.0
100.0100.0100.0100.0100.010000100.0100.0100.0100.0100.0100.0100.0100.0100.0
Percent distribution
22.3
25.211.911.5
16.0
1%;
33.634.0
13.28.5
2::;
23.019.816.6
100.041.214.24.32.5
45.721.912.68.6
39.627.720.917.9
22.321.118.120.416.621.119.021.720.018.719.922.021.418.820.2
37.6
40.633.528.5
29.316.925.7
18.716.5
33.927.827.238.5
37.638.134.1
58.;54.636.018.4
36.543.838.627.1
27.335.939.438.2
37.738.639.134.836.938.138.338.639.237.838.738.238.136.935.8
20.3
19.024.523.9
24.921.125.5
14.818.2
24.026.324.719.6
20.221.019.8
-
31.;35.522.8
11.620.624.325.0
16.517.920.921.9
20.320.521.620.622.520.821.520.321.421.921.820.520.822.620.8
9.4
1!::11.3
12.725.213.9
19.718.1
12.213.7
:::
9.3
1?:!
24.320.3
3.67.911.915.7
8.0
R10.6
;:210.411.211.5
1::;9.6,
J:;9.39.2
1::!9.2
10.3
1;:;24.9
17.227.121.7
13.113.2
16.623.736.58.8
1?:;18.5
36.;
$:12.623.7
1::!
1?::
10.310.011.013.012.610.311.0
1:::11.210.310.110.211.714.1
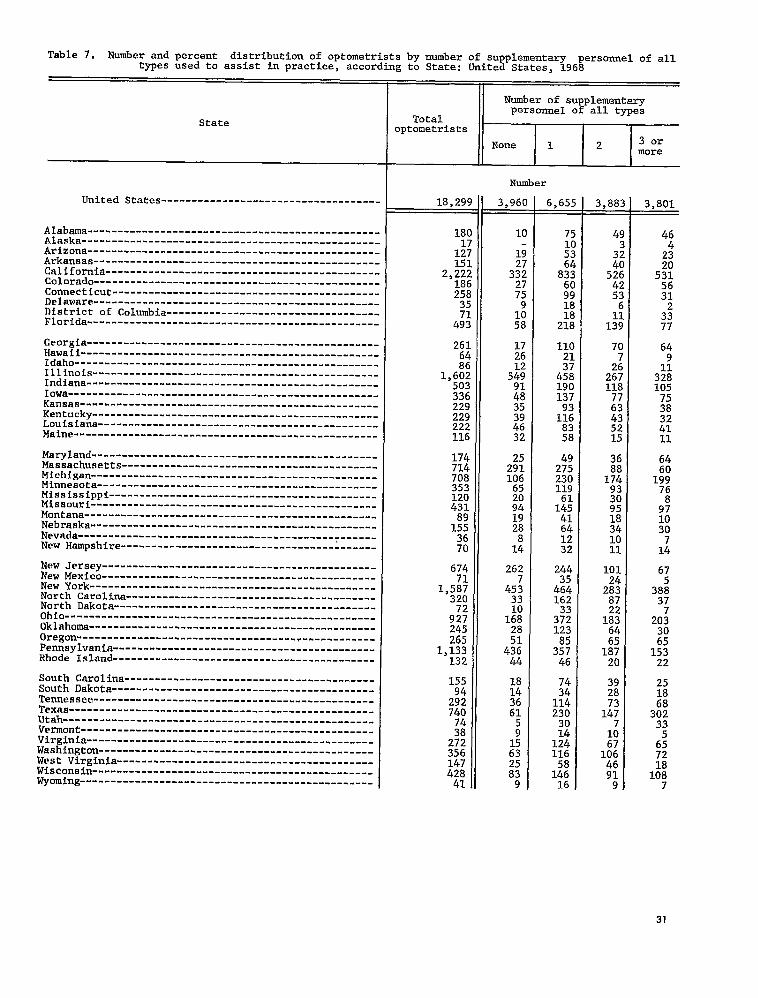
Table 7. Number and percent distribution of optometrists by number of supplementary personnel of alltypes used to assist in practice, according to State: United states, 1968
State
United States------------------------------------
fala:s -------- ---------- -------- --.----- .-------- ------------ ------- -.---------- ------- -----.---- ------
Arizona------------------------.-----------------------Arkansas-----------------------------------------------California---------------------------------------------Colorado-----------------------------------------------Connecticut--------------------------------------------Delaware-----------------------------------------------District of Columbia-----------------------------------Florida------------------------------------------------
Georgia------------------------------------------------$::i -------------------------------------------------
---.-----------------------------------.----------Illinois-----------------------------------------------Indiana------------------------------------------------Iowa---------------------.---------.---i---------------Kansas-------------------------------------------------Kentucky-----------.-----.-----------------------------Louisiana----------------------------------------------Maine------------------------.-------------------------
Maryland.-------------..--------------------------------Massachusetts------------------------------------------Michigan-----------------------------------------------Minnesota----------------------------------------------Mississippi--------------------------------------------Missouri-----------------------------------------------Hontana------------------------------------------------Nebraska-----------------------------------------------Nevada-------------------------------------------------New Hampshire------------------------------------------
New Jersey ---------------------------------------------New Mexico---------------------------------------------New York-----------------------------------------------North Carolina-----------------------------------------North Dakota-------------------------------------------Ohio..--...--------------.-----------------------------Oklahoma-----------------------------------------------Oregon-----------------------------.---.--r-”...-.-----Pennsylvania-------------------------------------------Rhode Island-------------------------------------------
South Carolina-----------------------------------------South Dakota-------------------------------------------Tennessee----------------------------------------------Texas--------------------------------------------------Utah---------------------------------------------------VemonC ------------------------------------------------Virginia-----------------------------------------------Washington---------------------------------------------West Virginia------------------------------------------Wisconsin----------------------------------------------Wyoming------------------------------------------------
Totaloptometrists
Number of supplementarypersonnel of all types
I I I
None II1 2 3 ormore
II I I I
Number
18,299
180
1;;151
2,22218625835
4;:
26164
1,6;2;;:
229229222116
174714708353120431
1%3670
1,133132
15594292740
;;27235614742841
6.655
75
;:
8%609918
2;:
110
:+458190137
1?2
%
492752301196114541641232
2:$
464162
3X123
3%’46
;:11423030
lx116
1:;
31

Table 7. Number and percent distribution of optometrists by number of supplementary personnel of alltypes used to assist in practice, according to State: United States, 1968—Con.
State
United States -------- -------- -------- -------- ----
Alabam ------------------------------------------------Alaska ----------------- -------- -------- -------- -----.-- -Arizona ------------------------------------------------Arkansas -----------------------------------------------California -------- -------- -------- -------- -------- -----Colorado -----------------------------------------------Connecticut --------------------------------------------DeLaware -----------------------------------------------District of Columbia -----------------------------------Florida --------- ----.--------m--.------.---.-----.--- --
Georgia-------------------------------------------------Hawaii -------- -------- -------- -------= --------- --------Idaho -------------- ------- ------- ------- ------- --------Illinois -------- -------- ----------------- -.------ -------
Indiana -------- ---------------- -------- ----------------
Iowa---------------------------------------------------Kansas........-.........--”-----------------------------Kentucky -----------------------------------------------Louisiana ----------------------------------------------Maine -------------- -------------- ------- ---------------
Maryland -------- -------- -------- -------- -------- -------Massachusetts -------- -------- -------- ---------------- --Michigan -------- ---------------- ---------------- .......Minnesota----------------------------------------------Mississippi--------------------------------------------Missouri------------------------------------------------Montana------------------------------------------------Nebraska-----------------------------------------------Nevada-------------------------------------------------New Hampshire.........-...........---------------------
New .Jerfey---------- -------------------- ---------------New MexLco---------------------------------------------New York----------------------------.------------------North Carolina-----------------------------------------North Dakota-------------------------------------------Ohio---------------------------------------------------Oklahoma-----------------------------------------------Oregon-------------------------------------------------Pennsylvania-------------------------------------------Rhode Island------------------------.------------------
South Carolina-----------------------------------------South Dakota-------------------------------------------Tennessee.............................................-Texas--------------------------------------------------Utah---------------------------------------------------Vermont------------------------------------------.-----Virginia-----------------------------------------------Washington---------------------------------------------West Virginia------------------------------------------Wisconsin----------------..........------......--------Wyoting....................................m..........-
Number of supplementarypersonnel of all types
Totaloptometrists
~
100.0
Percent distribution
100.0100.0100.0100.0100.0I.oo.o100.0100.0100.0100.0
100.0100.0100.0100.0100.0100.0100.0100.0100.0100.0
100.0100.0100.0100.0100.0100.0100.0100.0100.0100.0
100.0100.0100.0100.0100.0100.0100.0100.0100.0100.0
100.0100.0100.0100.0100.0100.0100.0100.0100:0100.0100.0
21.6
5.7
14.817.714.914.529.226.713.611.8
;::!
34:318.014.215.316.820.727.5
14.440.814.918.516.721.822.017.821.219.7
38.910.128.510.514.318.111.419,238.433.6
11.714.812.48.3
2;:;
17:617.319.422.2
36.4
41.556.341.742.737.532.638.450,025.444.3
42.232.842.928.637.840.840.750.537.450.5
28.138.532.533.650.933.646.341.133.345.5
36.249.329.250.746.040.250.232.031.534.5
47.636.439.331.139.737.145.832.439.634.138.9
21.2
27.018.825.226.523.722.720.416.715.328.2
26.911.529.916.723.422.827.318.723.212.8
20.612.424.526.425.422.120.721.927.315.2
15.033.317.827.430.219.826.224.416.515.1
24.829.625.119.9
2;:;24.729.730.921.222.2
20.8
25.825.018.313.223.930.212.0
4;:;15.7
24.514.813.020.520.822.216.714.018.79.2
36.98.428.121.5
2;::11.019.218.219.7
9.9
2::;11.5
2?::12.224.413.516.8
15.919.323.340.844.414.323.920.312.225.316.7
32

Table 8. Number and percent distribution of optometrists by number of supplementary personnel used toassist in practice, accordingto geographic area and selected characteristicsof the optometrist:ed States, 1968
Unit-
Geographic area and selected characteristicsofoptometrist
United states------------------------------------
Geographic region
Northeast----------------------------------------------North Central------------------------------------------South--------------------------------------------------West------------------------.---------------------------
Geographic division
New England--------------------------------------------Middle Atlantic----------------------------------------East North Central-------------------------------------West North Central-------------------------------------South Atlantic-----------------------------------------East South Central--------------------------------------West South Central-------------------------------------:::;g~--------------------- --------------------------
-----------------..-----------..-----s------------
Standard Federal Administrative Region
Region 1-----------------------------------------------Region 11----------------------------------------------Region 111---------------------------------------------Region IV----------------------------------------------Region V-----------------------------------------------Region VI----------------------------------------------Region VII---------------------------------------------Region VIII -------- -------- -------- ----------- -------- -Region IX----------------------------------------------Region X-----------------------------------------------
Age of optometrist
Under 25 years-----------------------------------------25-34 years--------------------------------------------35-44 years--------------------------------------------45-54 years --------------------------------------------55-64 years --------------------------------------------65-74 years --------------------------------------------75 years and over--------------------------------------
Sex of optometrist
Male---------------------------------------------------Female-------------------------------------------------
Number of States licensed in
ps;:::es -------- -------- -------- -------- -------- -------------- -------- ---------------- -------- --------
2 States -----------------------------------------------3 States or more ---------------------------------------
Hours per week usually worked
1-34 hours ---------------------------------------------35-39 hours --------------------------------------------40 hours -------- --..:---- -------- --------------------- --41-44 hours --------------------------------------------45-48 ho[lrs --------------------------------------------49 hours or more ---------------------------------------
Number of supplementarypersonnel of all types
Totaloptometrists
None 1 2 3 ormore
18,299
1,3273,3944,1681,6701,929820
1,358709
2,924
1,3272,2611,8342,049;,:;;
1:151556
2,;;;
622,0045,4006,6322,6011,205396
17,912387
2013,920
3,3551,005
2,1532,8974,2182,3303,4313,269
Number
3,960
1,6151,290
478577
4651,150
996294212105161106471
465715521231
1,062169204
3::126
2:?838
1,395751481210
3, W:
3,202587164
849586837457660571
6,655
1,5892,0221,6981,347
5231,0651,396
625832366500284
1,064
523708625930
1,515535439214918247
6;:1,9842,472
985399104
6,542114
5,16;1,;;;
7271,3221,562
8311,2121,001
3,883
7671,243
998875
196571832411501195303168707
196384352530925327268126575199
49:1,3331,416
440159
37
3,82063
2,80:814258
317592910508754802
3,801
7501,284
933834
143608943341385155393152682
143:;:
3571,019
398240131570152
5::1,2451 ,,;3;
16645
3,72675
42,749
763285
260397909534805895
33
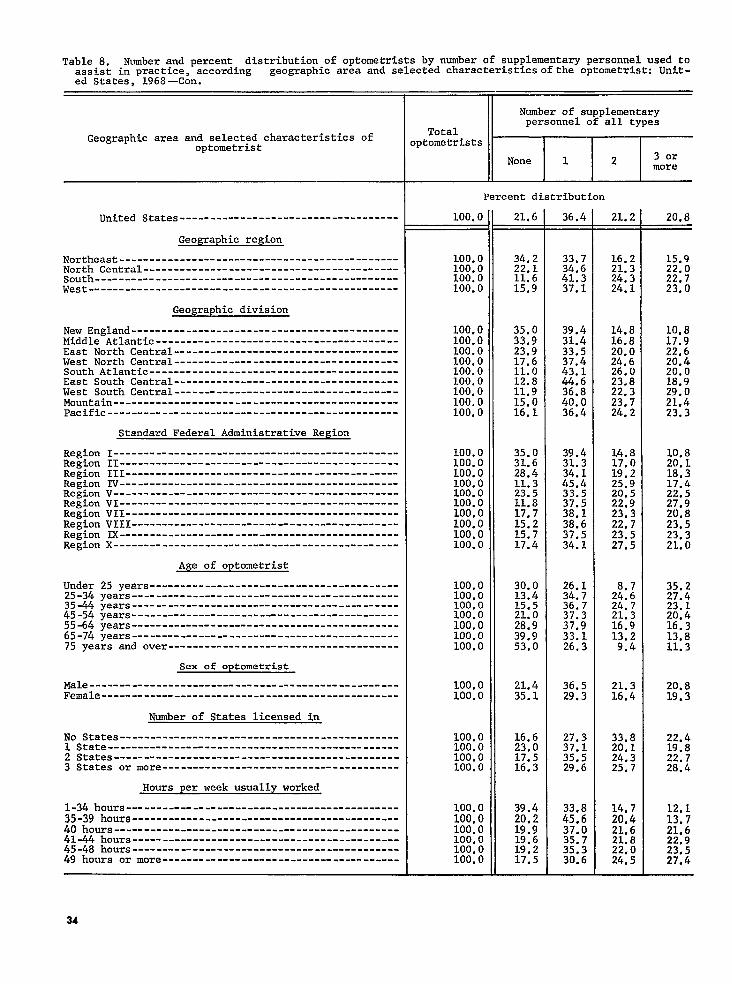
Table 8. Number and percent distribution of optometrists by number of supplementarypersonnel used toassist in practice, according geographic area and selected characteristicsof the optometrist:Unit-ed States,-1968—Con.
Geographic area and selected characteristicsofoptometrist
United States------------------------------------
Geographic region
Northeast----------------------------------------------~u;~ Central------------------------------------------
--------------------------------------------------West---------------------------------------------------
Geographic division
New England--------------------------------------------Middle Atlantic----------------------------------------East North Central-------------------------------------West North Central-------------------------------------South Atlantic-----------------------------------------East South Central-------------------------------------West South Central-------------------------------------Mountain-----------------------------------------------Pacific------------------------------------------------
Standard Federal Administrative Region
RegionRegionRegionRegionRegionRegionRegionRegionRegionRegion
I ------- ------------------------- ------- ------- -II----------------------------------------------III---------------------------------------------Iv----------------------------------------------v ------------------------- ---------- ------- -----VI----------------------------------------------VII---------------------------------------------VIII --------------------------------------------Ix ------- ------- ------------------------ ------- -x --------- ----------------- ------- ------- -------
Under 25 years-----------------------------------------25-34 years--------------------------------------------35-44 years--------------------------------------------45-54 years--------------------------------------------55-64 years--------------------------------------------65-74 years--------------------------------------------75 years and over--------------------------------------
Sex of optometrist
~le---------------------------------------------------Female-------------------------------------------------
Number of States licensed in
NQ States----------------------------------------------1 State------------------------------------------------2 States-----------------------------------------------3 States or more---------------------------------------
Hours per week usually worked
1-34 hours---------------------------------------------35-39 hours--------------------------------------------40 hours-----------------------------------------------41-44 hours--------------------------------------------45-48 hours--------------------------------------------49 hours or more---------------------------------------
Totaloptometrists
m
100.0
Percent distribution
100.0100.0100.0100.0
100.0100.0100.0100.0100.0100.0100.0100.0100.0100.0
100.0100.0100.0100.0100.0100.0100.0
100.0100.0
100.0100.0100.0100.0
21.6
34.222.111.615.9
35.033.923.917.611.012.811.915.016.1
35.031.628.411.323.511.817.715.215.717.4
30.013.415,521.028.939.953.0
21.435.1
16.6;;.:
16:3
39.420.219.919.619.217.5
36.4
33.734.641.337.1
39.431.433.537.443.144.636.840.036.4
39.431.334.145.433.537.538.138.637.534.1
26.134.736.737.337.933.126.3
36.529.3
27.337.135.529.6
33.845.637.035.735.330.6
21.2
16.221.324.324.1
14.816.820.024.626.023.822.323.724.2
14.817.019.225.920.522.923.322.723.527.5
2;::24.7;;.;
13:29.4
21.316.4
33.820.124.325.7
14.720.421,621.822.024.5
20.8
15.922.022.723.0
10.817.922.620.420.018.929.021.423.3
10.820.118.317.422.527.920,823.523.321.0
35.227.423.1g.;
13:811.3
20,819.3
:;.:
22:728.4
12.113.721.622.923,527.4
34
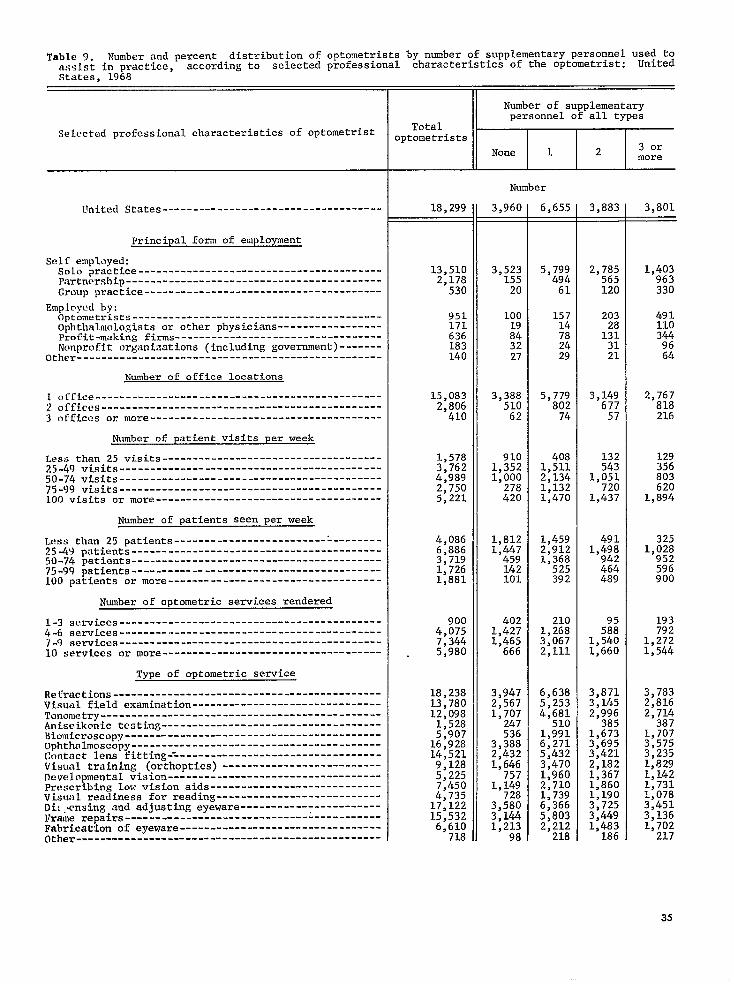
Table 9. Number and percent distribution of optometrists by number of supplementary personnel used toassist in Dractice. according to selected professional characteristics of the optometrist: UnitedStates, 19b8 “
Selected professional characteristicsof optometrist
LInitedStates------------------------------------
Principal form of employment
Self emplayed:Solo practice----------------------------------------Partnership------------------------------------------Group practice---------------------------------------
Employed by:Optometrists-----------------------------------------Ophthalmologistsor other physicians-----------------Profit-making firms----------------------------------Nonprofit organizations (including government)-------
Other--------------------------------------------------
Number of office locations
1 Office-----------------------------------------------2 offices----------------------------------------------3 offices or more--------------------------------------
Number of patient visits per week
Less than 25 visits------------------------------------25-49 visits-------------------------------------------50-74 visits-------------------------------------------75-99 visits-------------------------------------------100 visits or more -------------------------------------
Number of patients seen per week
Less than 25 patients-------------------------:--------25-49 patients-----------------------------------------50-74 patients-----------------------------------------75-99 patients-----------------------------------------100 patients or mare-----------------------------------
Number OE optometric services rendered
1-3 senices -------------------------------------------4-6 senices -------------------------------------------7-9 sewices -------------------------------------------10 services or more------------------------------------
Type of optometric service
Refractions--------------------------------------------visual field examination-------------------------------Tononletry----------------------------------------------Aniseikonic testing------------------------------------Biomicrascopy------------------------------------------Ophthalmoscopy-----------------------------------------Contact lens fitting-=---------------------------------Visual training (orthoptics)--------------------------Developmental vision-----------------------------------Prescribing low vision aids----------------------------Visual readiness for reading---------------------------Di:.,ensingand adjusting eyeware-----------------------Frame repairs------------------------------------------Fabrication of eyeware---------------------------------Other--------------------------------------------------
18,299
13,5102,178530
951171636183140
15,0832,806410
1,5783,7624,9892,7505,221
4,0866,8863,7191,7261,881
9004,0757,3445,980
18,23813,78012,0981,5285,90716,92814,5219,1285,2257,4504,73517,12215,5326,610718
Number
3,960
3,52315520
100
::3227
3,38851062
9101,3521,000278420
1,8121,:$;
142101
4021,4271,465666
3,9472,5671,707247536
3,3882,4321,646757
1,149728
3,5803,1441,213
98
6,655
5,79949461
15714782429
5,77980274
4081,5112,1341,1321,470
1,4592,9121,368525392
2101,2683,0672,111
6,6385,2534,;::
1,9916,2715,432:,$;:
2:7101,7396,3665,8032,212218
3,883
2,785565120
203281313121
3,14967757
132543
1,051720
1,437
4911,498942464489
5X1,5401,660
;,y;;
2:996385
1,6733,6953,4212,1821,3671,8601,1903,7253,4491,483186
3,801
1,403963330
4911103449664
2,767818216
129356803620
1,894
3251,028;;;
900
193792
L,2721,544
3,7832,8162,714387
1,7073,5753,2351,8291,1421,7311>0783,4513,1361,702217
35

Table 9. Number and percent distribution of optometrists by number of supplementary personnelassist in practice, according to selected professional characteristicsof the optometrist:States, 1968—Con.
Selected professional characteristics of optometrist
United States------------------------------------
Principal form of employment
Self employed:Solo practice----------------------------------------Partnership------------------------------------------Group practice---------------------------------------
Employed by:Optmetrists -----------------------------------------Ophthalmologists or other physicians-----------------Profit-making firms----------------------------------Nonprofit organizations (including government)-------
Other--------------------------------------------------
Number of office locations
1 office-----------------------------------------------2 offices----------------------------------------------3 offices Or more--------------------------------------
Number of vatient visits r.erweek
Less than 25 visits------------------------------------25-49 visits-------------------------------------------50-74 visits-------------------------------------------75-99 visits-------------------------------------------100 visits or more-------------------------------------
Number of patients seen per week
Less than 25 patients----------------------------------25-49 patients-----------------------------------------50-74 patients-----------------------------------------75-99 patients-----------------------------------------100 patients or more-----------------------------------
Number of optometric services rendered
1-3 senices -------------------------------------------4-6 semices -------------------------------------------7-9 semices -------------------------------------------10 services or more------------------------------------
Type of optometric service
Refractions--------------------------------------------Visual field examination-------------------------------Tonometry----------------------------------------------Aniseikonic testing------------------------------------Biomicroscopy------------------------------------------Ophthalmoscopy-----------------------------------------Contact lens fitting-----------------------------------Visual training (orthoptics)---------------------------Developmental vision-----------------------------------Prescribing low vision aids----------------------------Visual readiness for reading---------------------------Dispensing and adjusting eyeware-----------------------Frame repairs------------------------------------------Fabrication of eyeware---------------------------------Other--------------------------------------------------
used toUnited
Totaloptometricts
Number of supplementarypersonnel of all types
None 1~
2 3 ormore
Percent distribution
100. c
100.c100.c100.c
100.0100.0100.0100.0100.0
100.0100.0100.0
100.0100.0100.0100.0100.0
100.0100.0100.0100.0100.0
100.0100.0100.0100.0
100.0100.0100.0100.0100.0100;o100.0100.0100.0100,0100.0100.0100.0100.0100.0
21.6
26.17.13.7
10.611.113.117.519.0
22.518.215.2
57.635.920.110.18.1
44.321.012.38.25.4
44.735.020.011.1
21.618.614.116.2
2:::16.818.014.515.415.420.920.318.413.6
36.4
42.922.711.4
16.5
1!:$13.120.5
38.328.618.0
25.840.242.8:;.;
.
35.742.336.830.420.8
23.331.141.835.3
36.438.138.733.433.737.037.438.037.536.436.737.237.433.530.3
21.2
20.625,922.6
21.416.120.616.814.8
20.924.114.0
1:::21.126.227.5
12.021.825.326.926.0
10.614.421.027.8
21.222.824.825.228.321.823.623.926.225.025.121.822.222.4 I25.8
20.8
10.444.262.3
51.664.354.052.645.7
18.329.152.8
::;16.122.536.3
1::;25.634.547.8
21.419.417.325.8
20.720.422.425.328.921.122.320.021.923.222.820.220.225.830.3
36

Table 10. Number and percent distribution of optometrists by number of secretaries and/or receptionistsused to assist in practice, according to State: United States, 1968
State
United States------------------------------------.
Alabma ------------------------------------------------Alaska-------------------------------------------------Arizona------------------------------------------------Arkansas-----------------------------------------------California---------------------------------------------Colorado-----------------------------------------------Connecticut--------------------------------------------Delaware-----------------------------------------------District of Columbia-----------------------------------Florida------------------------------------------------
Georgia------------------------------------------------Hawaii-------------------------------------------------Idaho--------------------------------------------------::jyn:s -----------------------------------------------
------------------------------------------------Iowa---------------------------------------------------Kansas-------------------------------------------------Kentucky-----------------------------------------------Louisiana----------------------------------------------Maine--------------------------------------------------
Maryland-----------------------------------------------Massachusetts------------------------------------------Michigan-----------------------------------------------Minnesota----------------------------------------------Mississippi--------------------------------------------Missouri----------------------------------------------Montana------------------------------------------------Nebraska-----------------------------------------------Nevada-------------------------------------------------New Hmpshire ------------------------------------------
New Jersey---------------------------------------------New Mexico---------------------------------------------New York-----------------------------------------------North Car~lina-----------------------------------------North Dakota-------------------------------------------Ohio---------------------------------------------------Oklahoma-----------------------------------------------Oregon-------------------------------------------------Pennsylvania-------------------------------------------Rhode Island-------------------------------------------
South Carolina-----------------------------------------South Dakota-------------------------------------------Tennessee----------------------------------------------~::s --------------------------------------------------
---------------------------------------------------Vemont ------------------------------------------------Virginia-----------------------------------------------Washington---------------------------------------------West Virginia------------------------------------------Wisconsin----------------------------------------------Wyaing ------------------------------------------------
Number
18,299
1512,22218625835
26164
1,6%503336229229222116
174714708353120431
1!;3670
674
1,5:+320
9;+245265
1,133132
255_?_—
333
5135
6%163106
%7439
7,93(
9:
::7:932
l!i
i:28C
14:1$
5;:246157~z:11710261
2%288134
1;:43692035
255
6$:189
4;;12411140550
83
1%3673316142136
1;:21
2,797
341
;:4012937
1:75
5:
2;;
::31342513
43
12:641764
2?111
7310
19844
13:41
l!
2521
1%13
5;7624605
1,318
17
1;
22:1910
1;15
174
12;282866
212
24267128
4:27
;
22
12~
7;10
::9
7
2;8114
1;24
4:2

Table 10. Number and percent distribution of optometrists by number of secretaries end/or receptionistsused to assist in practice, according to State: United States, 196&—Con, ~
State
United States------------------------------------
Alabma ------------------------------------------------Alaska-------------------------------------------------Arizona------------------------------------------------Arkmsas -----------------------------------------------CalifOmia ---------------------------------------------Colorado-----------------------------------------------Connecticut--------------------------------------------Delaware-----------------------------------------------District of Columbia-----------------------------------Florida------------------------------------------------
Georgia ------------------------------------------------Hawaii-------------------------------------------------Idaho--------------------------------------------------Illinois-----------------------------------------------Indiana------------------------------------------------Iowa---------------------------------------------------Kansas-------------------------------------------------Kentucky-----------------------------------------------Louisiana----------------------------------------------Maine--------------------------------------------------
Maryland-----------------------------------------------Massachusetts------------------------------------------Michigan-----------------------------------------------Minnesota----------------------------------------------Mississippi--------------------------------------------Missouri-----------------------------------------------Montana------------------------------------------------Nebraska-----------------------------------------------Nevada-------------------------------------------------New Hmpshire ------------------------------------------
New Jersey---------------------------------------------New Iiexico---------------------------------------------New York-----------------------------------------------North .Carolina-----------------------------------------North Dakota-------------------------------------------Ohio---------------------------------------------------Okl&ma -----------------------------------------------Oregon-------------------------------------------------Pennsylvania-------------------------------------------Rhode Island-------------------------------------------
South Carolina-----------------------------------------South Dakota-------------------------------------------Tennessee----------------------------------------------Texas--------------------------------------------------Utah---------------------------------------------------Vermont------------------------------------------------Virginia-----------------------------------------------Washington---------------------------------------------k.estVirginia------------------------------------------Wisconsin----------------------------------------------Wyoming------------------------------------------------
~
Number of secretaries snd/or
Totaloptometrists
100.0
100,0100.0100.0100.0100.0100.0100.0100.0100.0100.0
100.0100.0100.0100.0100.0100.0100.0100.0100.0100.0
100.0100.0100.0100.0100.0100.0100.0100.0100.0100.0
100.0100.0100.0100.0100.0100.0100.0100.0100,0100.0
100.0100.0100.0100.0100.0100.0100.0100.0100.0100.0100.0
receptionists
None 1 2 3 ormore
Percent distribution
34.2
18.218.825.228.730.130.237.240.027.125.0
19.754.135.143.632.431.529.231.333.333.9
26.351.228.736.133.333.642.733.636.424.2
;;.;
39:025.022,231.428.831,247.043.7
25.528.427.b18.619.134.319.833.928.835.930.6
43.3
53.568.851.350.042.043.644.446.739.056.8
54.629.544.234.648.946.654.650.946.053.2
35.637.740.737.950.942,448.844.554.650.0
37.955.440.759.158.745.550.742.035.837.8
53.840,946.249.6;t.;
52:238.250.439.952.8
15,3
18.9
1::;16.918.015.714.413.317.015.3
19.3
2::;14.213.113,513.415.011.111.0
24.4
2;:218.214.014.8
1?::
1::;
10.814.512.513.911.115.016.617.612.511.8
15.922,717.820.917.511.421.921.216.614.111.1
7.2
9.46.37.84.4
1;:;4.0
17.03.0
13.8
1:::7.91.89.32.44.8
1:::
3.3
M7.98.13.9
:::6.7
4.88,0
1::$19.111.46.16.7
l&:5.6
38

Table 11. Number and percent distribution of optometrists by number of secretaries andlor receptionistsused to assist in practice, according to geographic area and selectedtrist: United States, 1968
characteristics of the optome.
Geographic area and selected characteristics ofoptometrist
United States------------------------------------
Geographic region
Northeast----------------------------------------------North Central------------------------------------------South--------------------------------------------------West---------------------------------------------------
Geographic division
New England--------------------------------------------Middle Atlantic----------------------------------------East North Central-------------------------------------West North Central-------------------------------------South Atlantic-----------------------------------------East South Central-------------------------------------West South Central-------------------------------------Mountain-----------------------------------------------PaciEic------------------------------------------------
Standard Federal ~
RegionRegionRegionRegionRegionRegionRegionRegionRegionRegion
I----------------.--.---------------------------11----------------------------------------------IT.I---------------------------------------------IY----------------------------------------------V-----------------------------------------------VI----------------------------------------------VII---------------------------------------------vl-lr---------------------------------------------Ix----------------------------------------------x-----------------------------------------------
Age of optometrist
Under 25 years-----------------------------------------25-Y+ years--------------------------------------------35-44 years--------------------------------------------45-54 years--------------------------------------------55-64 years--------------------------------------------65-74 years--------------------------------------------75 years and over--------------------------------------
Sex of optometrist
Male---------------------------------------------------Female-------------------------------------------------
Number of States licensed in
No States----------------------------------------------1 StaEe------------------------------------------------2 States-----------------------------------------------3 States or more---------------------------------------
Hours per week usually worked
1.34 hours ---------------------------------------------35-39 hours--------------------------------------------40 hours-----------------------------------------------41-44 hours--------------------------------------------45-48 hours--------------------------------------------49 hours or more---------------------------------------
Totaloptometrists
Number of secretaries and/orreceptionists
I I I
I None I 1I
2 I 3 ormore
18,299
4,7215,8384,1073,633
1,3273,3944,1681,6701,929820
1,358709
2,924
1,3272,2611,8342,049~,:;;
1;151556
2,448725
2,0%5,4006,6322,6011,;::
17,912387
13,9::3,3551,005
2,1532,8974,2182,3303,4313,269
Number
6,255
2,0632,0481,0201,124
5881,4751,509539;;:
325214910
588942709519
1,636344369163748237
5%1,6422,182988;::
6,064191
3%,8881,076288
1,051934
1,342777
1,1111,041
7,930
1,8522,4292,0951,554
5461,3061,681748
1,018408669344
1,210
546901728
1,1031,815711533260
1,035297
8;;2,4152,9601,149448104
7,805125
6,O;;1,442423
808l,43i1,8911,0071,4841,309
2,797
546899720631
134413639260338137246101530
134272284331703256166
4%141
37:931
1,01933410327
2,75640
2,02:581189
199401646381563606
1,318
259462273324
2%339123105
1:;50274
1;;113
3%11882
2::
22:4124711306116
1,28731
1957256104
1::339165274314
39

Table Il.. Number and percent distribution of optometrists by number Of secretaries andlor receptionistsused to assist in practice, according to geographic area and selectedtrist: United States, 1968—Con.
characteristicsof the o~tome-
Geographic area and selected characteristicsofoptometrist
United States------------------------------------
Geographic region
Northeast----------------------------------------------North Central------------------------------------------South--------------------------------------------------West------------.--------------------------.------------
Geographic division
New England--------------------------------------------Middle Atlantic----------------------------------------East North Central-------------------------------------West’North Central-------------------------------------South Atlantic-----------------------------------------East South Central-------------------------------------West South Central-------------------------------------Mountain-----------------------------------------------Pacific------------------------------------------------
Standard Federal Administrative Region
RegionRegionRegionRegionRegionRegionRegionRegionRegionRegion
I-----------------------------------------------11----------------------------------------------111---------------------------------------------Iv----------------------------------------------v --------- --------- -------------- ---------------VI----------------------------------------------VII---------------------------------------------VIII--------------------------------------------Ix----------------------------------------------x --------- ---------- ---------------- -------- -----
Age of optometrist
Under 25 years-----------------------------------------25-34 years--------------------------------------------35-44 years--------------------------------------------45-54 years--------------------------------------------55-64 years--------------------------------------------65-74 years--------------------------------------------75 years and over--------------------------------------
Sex of optometrist
Male---------------------------------------------------Female-------------------------------------------------
Number of States licensed in
No States----------------------------------------------1 State------------------------------------------------2 States-----------------------------------------------3 States or more---------------------------------------
Hours per week usually worked
1-34 hours---------------------------------------------35-39 hours--------------------------------------------40 hours-----------------------------------------------41-44 hours--------------------------------------------45-48 hours--------------------------------------------49 hours or more---------------------------------------
IINumber of secretaries andfor
receptionistsTotal
optometrists
None 1 2 3 Ormore
100.0
100.0100.0100.0100.0
100.0100.0100.0100.0100.0100.0100.0100.0100.0
100.0100.0100.0100.0100.0100.0100.0100.0100.0100.0
100.010000100.0100.0100.0100.0100.0
100.0100.0
100.0100.0100.0100.0
100.0100.0100.0100.0100.0100.0
Percent distribution
34,2
43.735.124.831.0
:;.;
36:232.324.327.424.030.231.1
44.341.738.725.336.224.132.129.430.632.7
45.628.730.432.938.049.162.8
33.949.4
16.635.132.128.7
48.832.231.833.332.431.8
43.3
39.241.651.042.8
41.238.5:;.;
52:849.849.348.541.4
41.239.839.753.840.249.846.346.742.341.0
31.441.6& ;
44:237.226.2
43.632.3
60.943.543.042.1
37.6:;.:
43:243.240.0
15.3
11.615.417.517.4
10.112.215.315.617.516.718.114.318.1
10.112.015.516.215.617.914.514.717.519.5
1.2.318.717.215.412.98.66.9
15.410.4
17.114.517.318.8
1?:;15.316.4;:.:
.
7.2
2:6.68.9
4.56.5
::;8.18.3
;:;9.76.8
10.711.07.6
;::
::;
7.27.9
4.44.58.1
;:;9.6
40

Table 12. Number and percent distributionof optometrists by the number of secretaries and/or reception-ists thev used to assist in practice, accordingto selected professional characteristics of the optom-etrist: ~lnitedStates, 1968 -
selected professional characteristics of optometrist
United States------------------------------------
Principal form of employment
Self employed:Solo practice----------------------------------------Partnership------------------------------------------Group practice---------------------------------------
Employed by:Optometrists-----------------------------------------Ophthalmologistsor other physicians-----------------Profit-making firms----------------------------------Nonprofit organizations (including government)-------
Other--------------------------------------------------
Number of office locations
1 Office-----------------------------------------------2 offices----------------------------------------------3 offices or more--------------------------------------
Number of patient visits per week
Less than 25 visits------------------------------------25-49 visits-------------------------------------------50-74 vieits-------------------------------------------75-99 visits-------------------------------------------100 visits or more-------------------------------------
Number of patients seen per week
Less than 25 patients----------------------------------25-49 patients-----------------------------------------50-74 patients-----------------------------------------75-99 patients-----------------------------------------100 patients or more-----------------------------------
Number of supplementaryhelpers of all types
None---------------------------------------------------1 assistant--------------------------------------------2 assistants-------------------------------------------3 assistants or more-----------------------------------
Number of optometric services rendered
1-3 services-------------------------------------------4-6 services-------------------------------------------7-9 seuicee -------------------------------------------10 services or more------------------------------------
Type of optometric service
Refractions--------------------------------------------Visual field examination-------------------------------Tonometry----------------------------------------------Aniseikonic testing------------------------------------BLomicroscopy------------------------------------------Ophthalmoscopy-----------------------------------------Contact lens fitting-----------------------------------Visual training (orthoptics)---------------------------Developmentalvision-----------------------------------Prescribing low vision aids----------------------------Visual readiness for reading---------------------------Dispensing and adjusting eyeware-----------------------Frame repairs------------------------------------------Fabrication of eyeware---------------------------------Other--------------------------------------------------
Totaloptometrists
18,299
13,5102,178530
951171636183140
15,0832,806
410
1,5783,7624,9892,7505,221
4,0866,8863,7191,7261,881
3,9606,6553,8833,801
9004,0757,3445,980
18,23813,78012,0981,5285,90716,92814,5219,1285,2257,4504,73517,12215,5326,;;;
Number of secretaries and/orreceptionists
None 1 2 3 ormore
Number
6,255
5,::;
78
195
1::
:!
5,286856113
1,0321,7761,672649
1,127
2,2332,338976348359
3,9601,;:;
324
4771,8092,3101,659
6,2264,3903,::;
1,4445,5714,3532,9641,6122,1681,4805,7815,1972,075219
7,930
6,245825149
353
2X
:;
6,827991111
4061,5002,3811,3362,306
1,4053,2611,753754756
5,26;1,;;;
2681,5093,4952,658
7,9126,2095,625664
2,6727,4646,5724,0292,354;,:3:
7;5466,8602,849317
2,797
1,674;:;
225411303321
2,1605::
3::664537
1,140
325;::
393439
1,58;1,210
4;:1,0771,179
2,7922,2072,164297
1,2122,6592,4551,519905
1,338832
2,6392,4431,116113
1,318
308403161
178
1!:4434
810368140
$271228649
123312325231327
1,31;
3::463485
1,308974918119579
1,2331,141616354592327
1,1561,03256969
41

Table 12. Number and percent distributionofoptometrists by the n~ber of secretaries andlor reception-ists thev used to assist in mactice. accordinzto selected professional characteristics of the optom-etrist: finitedStates, 1968~Con. -
Selected professional characteristicsof optometrist
United States------------------------------------
Principal form of emDlovment
Self employed:Solo practice----------------------------------------Partnership------------------------------------------Group practice---------------------------------------
Employed by:Optometrists-----------------------------------------Ophthalmologistsor other physicians-----------------Profit-making firms----------------------------------Nonprofit organizations (including government)-------
Other--------------------------------------------------
Number of office locations
1 office-----------------------------------------------2 offices----------------------------------------------3 offices----------------------------------------------
Number of patient visits per week
Less than 25 visits------------------------------------25-49 visits-------------------------------------------50-74 visits-------------------------------------------75-99 visits-------------------------------------------100 visits or more-------------------------------------
Number of patients seen per week
Less than 25 visits------------------------------------25-49 visits-------------------------------------------50-74 visits-------------------------------------------75-99 visits-------------------------------------------100 visits or more-------------------------------------
Number of supplementaryhelpers of all types
None---------------------------------------------------1 assistant--------------------------------------------2 assistants-------------------------------------------3 assistants or more-----------------------------------
Number of optometric services rendered
1-3 se~ices -------------------------------------------4-6 semices -------------------------------------------7-9 se=ices -------------------------------------------10 services or more------------------------------------
Type of optometric service
Refractions--------------------------------------------Visual field examination-------------------------------Tonometry----------------------------------------------Aniseikonic testing------------------------------------Bionicroscopy------------------------------------------Ophthalmoscopy-----------------------------------------Contact lens fitting-----------------------------------Visual training (orthoptics)---------------------------Developmental vision-----------------------------------Prescribing low vision aids----------------------------Visual readiness for reading---------------------------Dispensing and adjusting eyeware-----------------------Frame repairs------------------------------------------Fabrication of eyeware---------------------------------Other--------------------------------------------------
II
Totaloptometrists
Number of secretariesreceptionists
andior
3 or
100.0
Percent distribution
100.0100.0100.0
100.0100.0100.0100.0100.0
100.0100.0100.0
100.0100.0100.0100.0100.0
100.O100.0100.0100.0100.0
100.0100.0100.0100.0
100.0100.0100.0100.0
100.0100.0100.0100.0100.0100.0100.0100.0100.0100:0100.0100.0100.0100.0100.0
34.2
39.119.214.7
20.514.325.827.229.9
35.130.527.6
65.447.233.523.621.6
54.734.026.320,219.1
100.020.914.98.5
53.044.431.527.7
34.131.928.029.324.532.930.032.530.929.131.333.833.531.430,5
43.3
46.237.928.1
37.118.735.630.930.8
45.335.327.1
25.839.947.748.644.2
34.447.447.143.740.2
79.i44.225.0
29.837.047.644.4
43.445.146.543.545.244.145.344.145.145.044.344.144.243.144.1
15.3
12.424.427.0
23.723.920.417.914.9
14.321.111.2
8::13.319,521.8
1::;17.922.823.3
40.631,8
1?:i14.719.7
15.316.017.919.420,515.716.916.617.318.017.615.415.716.915,8
7.2
1;::30.3
18.843,118.224.024.5
1:::34.2
2,9
R
1%:
:::
1!::17.4
34.;
7.5
H8.1
;::7.6
u7.3
;:;6.8
w
H8,69.6
42

Table 13. Number and percent distribution of optometrists by number of general optometric assistantsthey used to assist in practice, according to State: United States, 1968
State
United States------------------------------------
Alabama------------------------------------------------Alaska -------------------------------------------------Arizona ------------------------------------------------Arkansas -----------------------------------------------California---------------------------------------------Colorado-----------------------------------------------Connecticut--------------------------------------------Dela!~are -----------------------------------------------District of Columbia-----------------------------------Florida ------------------------------------------------
Georgia------------------------------------------------l{awaii-------------------------------------------------Idaho--------------------------------------------------IllinOls-----------------------------------------------Indiana------------------------------------------------IOwa---------------------------------------------------Kansas -------------------------------------------------Kentucky-----------------------------------------------J.ouisiana----------------------------------------------Maine--------------------------------------------------
Maryland-----------------------------------------------Massachusetts------------------------------------------Michigan-----------------------------------------------Minnesota----------------------------------------------Mississippi--------------------------------------------Missouri-----------------------------------------------Montana------------------------------------------------Nebraska-----------------------------------------------Nevada-------------------------------------------------New Hampshire------------------------------------------
New Jersey ---------------------------------------------New Mexico ---------------------------------------------New York -----------------------------------------------North Carolina -----------------------------------------North Dakota -------------------------------------------Ohio---------------------------------------------------Oklahoma-----------------------------------------------OregOn-------------------------------------------------Pennsylvania-------------------------------------------Rhode Island-------------------------------------------
South Carolina -----------------------------------------South Dakota-------------------------------------------Tennessee----------------------------------------------Texas---------------------------------------------------Utah---------------------------------------------------Vermont------------------------------------------------Virginia-----------------------------------------------Washington---------------------------------------------West Virginia------------------------------------------Wisconsin----------------------------------------------Wyoming-------------------------------------------------
Number
18,299
18017
127151
2,222186258
35
4;$
2616486
1,602503336229229222116
174714708353120431
1%3670
674
1,5;;320
9;;245265
1,133132
155
2;:7+;
2%356147428
41
L4,070
1388
1?:1,596135218
30
3::
190
X1,291
359229160181168103
149635522271
3!;
1;;
::
583
1,3;:219
54710175204952115
118
2::480
58
1;;258114309
29
3,011-
207
::458
3334
5
&
56
2;212104
H333610
:;136
57
::143510
5
71
1::7810
159
X124
13
25
H165
93
2:24799
826
12
:
11:115
2;
11
i57311415
122
;2818
2:10
632
12
4;21
4:18
413
125
H4
1;22
2:2
393
9
5
i421017
1:
,?
4
8
1
43

Table 13. Number a=d percent distribution of optometristsby number of general optometric assistantsthey used to assist in practice, according t> State: United States, 1968—Con.
State
United States------------------------------------
Alabama------------------------------------------------Alaska-------------------------------------------------Arizona------------------------------------------------Arkansas-----------------------------------------------California---------------------------------------------Colorado-----------------------------------------------Connecticut--------------------------------------------Delaware-----------------------------------------------District of Columbia-----------------------------------Florida------------------------------------------------
Georgia------------------------------------------------Hawaii-------------------------------------------------Idaho--------------------------------------------------Illinois-----------------------------------------------Indiana------------------------------------------------Iowa---------------------------------------------------Kansas-------------------------------------------------Kentucky-----------------------------------------------Louisiana----------------------------------------------Maine--------------------------------------------------
Maryland-----------------------------------------------Massachusetts------------------------------------------Michigan-----------------------------------------------Minnesota----------------------------------------------Mississippi--------------------------------------------Missouri-----------------------------------------------Montana------------------------------------------------Nebraska-----------------------------------------------Nevada-------------------------------------------------New Hampshire------------------------------------------
New Jersey---------------------------------------------New Mexico---------------------------------------------New York-----------------------------------------------North Carolina-----------------------------------------North Dakota-------------------------------------------Ohio---------------------------------------------------Oklahoma-----------------------------------------------Oregon-------------------------------------------------Pennsylvania-------------------------------------------Rhode Island-------------------------------------------
South Carolina-----------------------------------------South Dakota-------------------------------------------Tennessee----------------------------------------------Texas--------------------------------------------------Utah---------------------------------------------------Vemont ------------------------------------------------Virginia-----------------------------------------------Washington---------------------------------------------West Virginia------------------------------------------Wisconsin---------------------------------------------Wyoming------------------------------------------------
II Number of general optometricassistants
Totaloptometrists
~
100.0—
100.0100.0100.0100.0100.0100.0100.0100.0100.0100.0
100.0100.0100.0100.0100.0100.0100.0100.0100.0100.0
Percent distribution
100:0100.0100.0100.0100.0
100:0
76.9
76.750.075.774.371.972.784.883.3;;.;
.
72.782.067.580.671.2::.;
79:075.889.0
85.6/33.:
76:772.875.972.071.263.689.4
86.578.383.968.674.676.771.676.884.087.4
75.978.468.764.877.882.972.572.477.772.272.2
16.5
11.343.820.022.820.618.013.213.315.319.4
21.311.523.413.320.622.522.214.516.28.3
10.0
1;::16.121.915.815.922.627.37.6
10.515.911.424.314.317.220.518.011.010.1
15.914.819.622.21;.;
18:617.916.618.422.2
4.5
6.9
:::2.95.25.82.0
;::
$:
3:9
i:;4.26.52.3~.j.
i::4.05.2
;::L:.!
S3:10
1.85.8
:::
::27.42.83.72.5
;:!7.3
:::
;:;6.1
;::5.6
2.2
5.0
2.;3.5
3.;
O.i
:::5.22.6
;:;
::;
w
::;3.22.1
i::1.22.1-
1.2
1.;
::;
::;2.41.4.
0.7
‘i::4.64.82.9;.;
2;23.5

Table 14. Number and percent distribution of optometrists by number of general optometric assistantsthey used to assist in practice, according to geographic area and selected characteristics of the op-tometrist: United States, 1968
Geographic area and selected characteristicsofoptometrist
United States------------------------------------
Geographic region
Northeast----------------------------------------------NoTO;~Central------------------------------------------
--------------------------------------------------West---------------------------------------------------
Geographic division
New England--------------------------------------------Middle Atlantic----------------------------------------East North Central-------------------------------------West North Central-------------------------------------South Atlantic-----------------------------------------East South Central-------------------------------------West South Central-------------------------------------Mountain-----------------------------------------------Facific------------------------------------------------
Region I-----------------------------------------------Region 11----------------------------------------------Region 111..--------------------------------------.....RexzionIV----------------------------------------------Re~ion V-----------------------------------------------Region VI----------------------------------------------Region VII---------------------------------------------Region VIII--------------------------------------------Region IX----------------------------------------------Region X--...------------------------”-----------------
A!aeof optometrist
Under 25 years-----------------------------------------25-34 years--------------------------------------------35-44 years--------------------------------------------45-54 years--------------------------------------------55-64 years--------------------------------------------65-74 years --------------------------------------------75 years and over--------------------------------------
Sex of optometrist
Male ---------------------------------------------------Female -------------------------------------------------
Number of States licensed in
NO states----------------------------------------------1 State------------------------------------------------2 States--------------------......---------------------3 States or more---------------------------------------
Hours per week usually worked
1-34 hours---------------------------------------------35-39 hours--------------------------------------------40 hours--------------------........-------------------41-44 hours--------------------------------------------45-48 hours--------------------------------------------49 houcs or more---------------------------------------
Number of general optometricassistants
“P=’istst=rm=18,299
4,7215,8384,1073,633
1,3273,3944,1681,6701,929820
1,358709
2,924
1,3272,2611,$3342,049;,:$;
1:”;;:
2,448725
2,0;:5,4006,6322,6011,205396
2013,9203,3551,005
2,1532,8974.2182;3303,4313,269
Number
14,070
4,0324,4162,9842,637
1,1662,8663,1911,2251,;;;
935518
2,119
1,1661,9141,5001,5013,461;;;
4141,767528
1,3::3,878;,;;;
1:042347
13,761308
10,8;;2,464739
1,8212,3083,2671,7362,5902,347
3,011
5101,001784717
134375690310361137285133584
134251232;;;
296230
5::139
4;:1,0721,03931211936
2,95753
2,202635170
252458698;::
612
826
124272241188
1::1829098
1::
1%
2459
1!?20010562
1;;33
12:30929059288
81214
5871:;
59
1%131158210
393
1::
91
3
l%442733371675
32
%1133732
;:24
3’
1:?134;;
4
38211
28;8232
:;8459
1:;
45
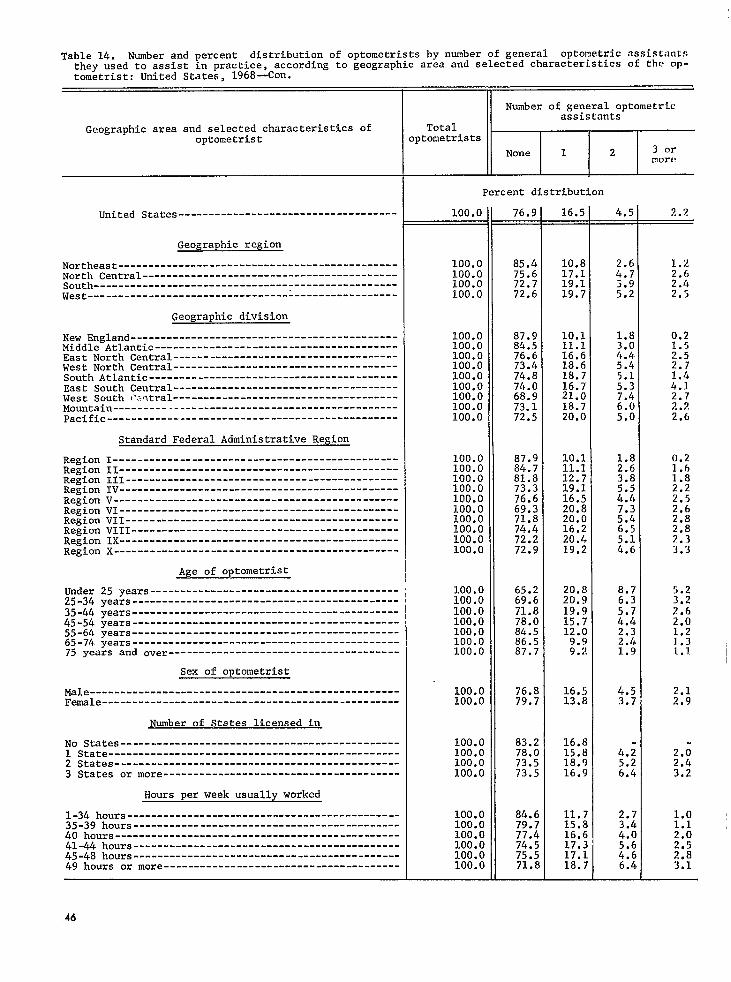
Table 14. Number and percent distribution of optometrists by number of general optometric assistantsthey used to assist in practice, according to geographic area and selected characteristics of the op-tometrist: United States, 1968—con.
Geographic area and selected characteristics ofoptometrist
United States------------------------------------
Geographic region
Northeast----------------------------------------------North Central------------------------------------------South--------------------------------------------------West---------------------------------------------------
Geographic division
New England--------------------------------------------Middle Atlantic----------------------------------------East North Central-------------------------------------West North Central-------------------------------------South Atlantic-----------------------------------------East South Central-------------------------------------West South Cmtral -------------------------------------Mountain-----------------------------------------------Pacific------------------------------------------------
Standard Federal Administrative Region
RegionRegionRegionRegionRegionRegionRegionRegionRegionRegion
I-----------------------------------------------11----------------------------------------------111---------------------------------------------Iv----------------------------------------------v-----------------------------------------------VI----------------------------------------------VII---------------------------------------------VIII--------------------------------------------Ix ------------------------ --------- -------- -----x ------- ------- “------- ------- ------------ ------
Age of optometrist
Under 25 years-----------------------------------------25-34 years--------------------------------------------35-44 years--------------------------------------------45-54 years--------------------------------------------55-64 years--------------------------------------------65-74 years --------------------------------------------75 years and over--------------------------------------
Sex of optometrist
Male---------------------------------------------------Female-------------------------------------------------
Number of States licensed in
No States----------------------------------------------1 State------------------------------------------------2 States-----------------------------------------------3 States or more---------------------------------------
Hours per week usually worked
1-34 hours---------------------------------------------35-39 hours--------------------------------------------40 hours-----------------------------------------------41-44 hours--------------------------------------------45-48 hours--------------------------------------------49 hours or more---------------------------------------
Totaloptometrists
Number of general optometricassistants
None I 1 I 2 I 3 or
more
100.0
100.0100.0100.0100.0
100.0100.0100.0100.0100.0100.0100.0100.0100.0
100.0100.0100.0100.0100.0100.0100.0100.0100.0100.0
100.0100.0100.0100.0100.0100.0100.0
100.0100.0
100.0100.0100.0100.0
100.0100.0100.0100.0100.0100.0
Percent distribution
76.9
85.475.672.772.6
87.984.576.673.474.874.068.9;;.:
.
87.984.781.873.376.669.371.874.472.272.9
65.269.671.878.084.586.587.7
76.879.7
83.278.C73.573.5
84.679.777.474.575.571.t
16.5
10.817.119.119.7
10.111.116.618.618.716.721.018.720.0
10.111.112.719.116.520.820.016.220.419.2
20.820.919.915.712.09.99,2
16.513.8
16.815.818.916.9
11.715.E16.617.217.118.;
4.5
::!
::;
1.8
;::
5:15.3
:::5.0
1.82.6
;:!?4.4
;::6.5
:::
8.7
::;4.42.32.41.9
4.53.7
4.;5.26.4
2.7
::?
i::6.4
2.2
1.22.6
::2
0.21.52.52.71.44.12.72:22.6
0.21.61.82.22.52.62.82.82:33.3
5.23.22.62.0
;::1.1
.2.02.43.2
1.1
N$.;
. I
I
.46

Table 15. Number and percent distribution of optometrists by number of general optometric assistantsthey used to assist in practice,according to selected professional characteristicsofthe optometrist:United States, 1968
Selected professional characteristics of optometrist
United States--------------------------------------
Principal form of employment
Self employed:Solo practice------------------------------------------Partnership--------------------------------------------Group practice-----------------------------------------
Employed by:Optometrists-------------------------------------------Ophthalmologists or other physicians-------------------Profit-making firms------------------------------------Nonprofit organizations (including government)---------
Other----------------------------------------------------
Number of office locations
1 office-------------------------------------------------2 offices------------------------------------------------3 offices or more----------------------------------------
Number of patient visits per week
Less than 25 visits--------------------------------------25-49 visits---------------------------------------------50-74 visits----------------------------------------------75-99 visits---------------------------------------------100 visits or more---------------------------------------
Number of patients seen per week
Less than 25 patients------------------------------------25-49 patients-------------------------------------------50-74 patients-------------------------------------------75-99 patients-------------------------------------------100 patients or more-------------------------------------
Number of supplementary helpers of all types
None-----------------------------------------------------1 assistant----------------------------------------------2 assistants---------------------------------------------3 assistants or more-------------------------------------
Number of optometric services rendered
1-3 semices ---------------------------------------------4-6 sewices ---------------------------------------------7-9 seNices ---------------------------------------------10 services or more--------------------------------------
Type of optometric service
Refractions----------------------------------------------Visual field examination---------------------------------Tonometry------------------------------------------------Aniseikonic testing--------------------------------------Biomicroscopy--------------------------------------------Ophthalmoscopy-------------------------------------------Contact lens fitting-------------------------------------Visual training (orthoptics)-----------------------------Developmental vision--------------------------------------Prescribing low vision aids------------------------------Visual readiness for reading-----------------------------Dispensing and adjusting eyeware-------------------------Frame repairs--------------------------------------------Fabrication of eyeware-----------------------------------Other----------------------------------------------------
Totaloptometrists
Number of generaloptometric assistants
None I 1 I 2 3 ormore
18.299
13,5102,178530
951171636183140
1;,08:
’41O
1,5783,7624,9892,7505,221
4,0866,8863,7191,7261,881
3,9606,6553,8833,801
18,23813,78012,0981,5285,90716,92814,5219,1285,2257,4504,73517,12215,5326,610718
Number
14.07C
10,73:1,467325
68013E481140104
11,6592,131280
1,4123,1843,9022,0453,527
3,5125,4482,7091,2331,168
3,9605>5042,5222,084
7933,5355,8503,892
14,02010,2688,7231,0623,83912,85310,766;,;;;
5;3173,19913,07011,7774>947454
3,011
2,171437106
152
%2324
2,54841349
126463803507
1,111
4541,082719326429
1,151951909
3;?1,1221,479
3,0052,5442,440327
1,4642,9082,6761,8531,2181,5421,0882,9022,6931,175176
826
47716654
63
4;108
63516229
3284201146363
2%197115162
41;415
1%254440
821684659
4;;79673651235840132778774032953
393
12710746
577
?:4
24110052
9
::
2;;
299594
1%
39;
19
1:;169
3922832754117737134219813219012136232315936
47

Table 15. Number and percent distribution of optometrists by number of general optometric assistantsthey used to assist in practice,accordingto selected professional characteristicsof the optometrist:Uni~ed States, 1968—Con.
Selected professional characteristicsof optometrist
United States--------------------------------------
Principal form of employment
Self employed:Solo practice----------------------------------------J-Partnership--------------------------------------------Group practice-----------------------------------------
Employed by:Optometrists-------------------------------------------Ophthalmologistsor other physicians-------------------Profit-making firms------------------------------------Nonprofit organizations (includinggovernment)---------
Other----------------------------------------------------
Ntnnberof office locations
1 office-------------------------------------------------2 offices------------------------------------------------3 offices or more----------------------------------------
Number of patient visits per week
Less than 25 visits--------------------------------------25-49 visits---------------------------------------------50-74 visits---------------------------------------------75-99 visits---------------------------------------------100 visits or more---------------------------------------
Number of patients seen per week
Less than 25 patients------------------------------------25-49 patients-------------------------------------------50-74 patients-------------------------------------------75-99 patients-------------------------------------------100 patients or more-------------------------------------
Number of supplementaryhelpers of all types
None-----------------------------------------------------1 assistant----------------------------------------------2 assistants---------------------------------------------3 assistants or more-------------------------------------
Number of optometric seivices rendered
1-3 senices ---------------------------------------------4-6 semices ---------------------------------------------7-9 senices ---------------------------------------------10 services or more--------------------------------------
Type of optometric service
Refractions----------------------------------------------\’LSUal field exmination ---------------------------------Tonometry------------------------------------------------Aniseikonic testing--------------------------------------Biomicroscopy--------------------------------------------Ophthatioscopy-------------------------------------------Contact lens fitting-------------------------------------Visual training (orthoptics)-----------------------------Developmental vision-------------------------------------Prescribing low vision aids------------------------------Visual readiness for reading-----------------------------Dispensing and adjusting eyeware-------------------------Frame repairs--------------------------------------------Fabrication of eyeware-----------------------------------Other----------------------------------------------------
II
Percent distribution
100.0
100.0100.0100.0
100.0100.0100.0100.0100.0
100.0100.0100.0
100.0100.0100.0100.0100.0
100.0100.0100.0100.0100.0
]00.0100.0100.0100.0
100.0100.0100.0100.0
100.0100.0100.0100.0100.0100.0100.0100.0100.0100.0100.0100.0100.0100.0100.0
76.9
79.567.461.3
71.580.775.676.574.3
77.375.968.4
89.584.678.274.467.6
86.079.172.871.462.1
100.082.764.954.8
88.186.779.765.1
76.974.572.169.565.075.974.171.967.371.467.676.375.874.963.1
16.5
16.120.120.0
16.014.811.412.617.2
16.914.712.0
1::!16.118.521.3
11.115.719.318.922.8
17.;24.523.9
6.5
1:::24.7
16.518.520.221.424.817.218.420.323.320.723.017.017.317.824.5
4.5
2210.1
M7.55.55.4
4.2
R
2.0
:::
;:;
2.23.8
2:;8.6
10.;10.9
3.32.5
;::
4.5
R6.4
;:;5.15.6
H
:::4.8
H
2.2
::;8.7
6.03.95.55.43.1
1.6
12:;
0.60.81.7
;:;
0.71.42.53.06.5
10.4
::;
;::
2.2
:::2.7
;::2.42.22.52.62.62.12.12.45.0
48

Table 16. Number and percent distribution of optometrists by number ofoptometric technicians they usedto assist in practice, according to State: United States, 1968
State
United States------------------------------------------
Alabama------------------------------------------------------Alaska-------------------------------------------------------Arizona------------------------------------------------------Arkansas-----------------------------------------------------California---------------------------------------------------Colorado-----------------------------------------------------Connecticut--------------------------------------------------Delaware-----------------------------------------------------District of Columbia-----------------------------------------Florida------------------------------------------------------
~:fp ------------------------------------------------------------- ------- ---------- -------------------- -----------
Idaho--------------------------------------------------------Illinois-----------------------------------------------------Indiana------------------------------------------------------Iowa---------------------------------------------------------Kansas-------------------------------------------------------Kentucky-----------------------------------------------------Louisiana----------------------------------------------------Maine--------------------------------------------------------
Maqland -----------------------------------------------------Massachusetts------------------------------------------------Michigan-----------------------------------------------------Minnesota----------------------------------------------------Mississippi--------------------------------------------------Missouri-----------------------------------------------------Montana------------------------------------------------------Nebraska-----------------------------------------------------Nevada-------------------------------------------------------New Hampshire------------------------------------------------
New Jersey ---------------------------------------------------New Mexic0---------------------------------------------------New York-----------------------------------------------------North Carolina-----------------------------------------------~h:;h Dakota-------------------------------------------------
......-.-------------------------------------------------Oklahoma-----------------------------------------------------Oregon-------------------------------------------------------Pennsylvania-------------------------------------------------Rhode Island-------------------------------------------------
South Carolina-----------------------------------------------South Dakota-------------------------------------------------Tennessee----------------------------------------------------Texas--------------------------------------------------------Utah---------------------------------------------------------Vemont ------------------------------------------------------Virginia-----------------------------------------------------Washington---------------------------------------------------West Virginia------------------------------------------------Wisconsin----------------------------------------------------Wyoming------------------------------------------------------
Totaloptometrists
Number of optometrictechnicians
I I INone 1 I 2 I 3 or
moreII 1 1 1
Number
18,299
180
Ii;151
2,22218625835
4;;
1,602503336229229222116
1747147083531204:;
1553670
674
1,5:+320
9;$245265
1,133132
15594292740743827235614742841
17,649
17117
122150
2,144181253
:2467
2536183
1,540483320218226213113
162702678348116420
1::
69
6::
1,518308
9::238254
1,099130
150
2%682703726234114441540
485
6
i
5:42
i23
7
;3915138372
111121
21012
?“
;5012
17710202
5
H11
1!
1:1
104
49

Table 1.6. Number and percent distribution of optometrists by number ofoptometric technicians they usedto assist in practice, according to State: United States, 1968-Con.
State
United States------------------------------------------
Alabama----------------------.---------------.---------------Alaska-------------------------------------------------------Arizona-------------------.-------------------.----.----------Arkansas-----------------------------------------------------California---------------------------------------------------Colorado-----------------------------------------------------Connecticut--------------------------------------------------Delaware-----------------------------------------------------District of Columbia-----------------------------------------Florida----------------------------.-------------------------
Georgia------------------------------------------------------~h:i ------- ------- -------------- --------------- ------- -----
------- ------- -------- -------------- -------------- ------Illinois-----------------------------------------------------Indiana------------------------------------------------------Iowa---------------------------------------------------------Kansas--------------------------------------------------------Kentucky-----------------------------------------------------Louisiana----------------------------------------------------Maine--------------------------------------------------------
Maryland-.-.-.----.---.----.------------.---.---------..-----Massachusetts------------------------------------------------Michigan------------------------------------------------.-.--Minnesota----------------------------------------------------Mississippi----------------------------p-------------.--.-.---.—Missouri-----------------------------------------------------Montana------------------------------------------------------Nebraska-----------------------------------------------------Nevada-------------------------------------------------------New Hampshire------------------------------------------------
New Jersey -------- --------- -------- -------- -------- -------- ---New Mexico---------------------------------------------------New York-----------------------------------------------------North Carolina-----------------------------------------------North Dakota-------------------------------------------------Ohio---------------------------------.-=----------------------Oklahoma-----------------------------------------------------Oregon-------------------------------------------------------Pennsylvania-------------------------------------------------Rhode Island-------------------------------------------------
South Carolina-------------------------------------------------South Dakota----------------........--------........--------.Tennessee----------------------------------------------------Texae--------------------------------------------------------Utah---------------------------------------------------------L'emont------------------------------------------------------Virginia-----------------------------------------------------Washington---------------------------------------------------West Virginia------------------------------------------------Wisconsin----------------------------------------------------Wyoming------------------------------------------------------
IINumber of optometric
techniciansTotal
.=:ometrists
None 1 2 3 ormore
ont
Percent distribution
100”01+100.0100.0100.0100.0100.0100.0100.0100.0100.0100.0
100.0100.0100.0100.0100.0100.0100.0100.0100.0100.0
100.0100.0100.0100.0100.0100.0100.0100.0100.0100.0
100.0100.0100.0100.0100.0100.0100.0100.0100.0100.0
95.0100.096.599.396.597.798.4
100.091.594.8
96.895.196.196.295.995.295.498.696.098.2
93.198.395.798.596.597.598.898.01::.;
.
98.594.295.796.398.497.596.996.096.998.3
100.0 96.6100.0 1;:.:100.0100.0 92:2100.0 93.7100.O 97.1100.0 96.4100.0 95.8100.0 97.8100.0 97.0100.0 97.2
2.7—
3.1.
k;2.62.30.8
::;
2.8
2.;2.53.03.93.71.43.01.8
6.31.52.90.9
H
;::
1.;
:::3.23.7
1.93.1
t;1.7
3.5
4.;5.3
M2.8
M
:::
0.6=
0.;
0.;
0.;
o.i
0.4
;::0.2
0.;
1.0
0.6
%$0.3
0.31.50.7
1.60.6
;::
-
0.;
N
0.;0.30.70.5
50.

Table 17. Number and percent distribution of optometrists by number ofoptometric technicians they usedto assist in practice, according to geographic areaUnited States, 1968
and selected characteristics of the optometrist:
Geographic area and selected characteristics ofoptometrist
United States------------------------------------------
Geographic region
Northeast----------------------------------------------------North Central------------------------------------------------Suuth--------------------------------------------------------wQst..---------:---------------------------------------------
Geographic division
New England--------------------------------------------------Middle Atlantic----------------------------------------------East North Central-------------------------------------------Wust North Central-------------------------------------------South Atlantic-----------------------------------------------East South Central-------------------------------------------West South Central-------------------------------------------Mountain-----------------------------------------------------Pacific------------------------------------------------------
Standard Federal Administrative Region
RegionRegionRegionRegionRegionRegionRegionRegionRegionRegion
I---- -------------------------------------------------
II----------------------------------------------------III---------------------------------------------------Iv----------------------------------------------------v-----------------------------------------------------vI----------------------------------------------------vII---------------------------------------------------VIII--------------------------------------------------Ix----------------------------------------------------x-----------------------------------------------------
Age of optometrist
Under 25 years-----------------------------------------------25-34 years--------------------------------------------------35-44 years--------------------------------------------------45-54 years--------------------------------------------------55-64 years--------------------------------------------------65-74 years--------------------------------------------------75 years and over--------------------------------------------
Sex of optometrist
Male---------------------------------------------------------Female-------------------------------------------------------
Number of States licensed in
No States----------------------------------------------------1 State------------------------------------------------------2 States-----------------------------------------------------3 States or more---------------------------------------------
Hours per week usually worked
1-34 hours---------------------------------------------------35-39 hours--------------------------------------------------40 hours -----------------------------------------------------41-44 hours--------------------------------------------------45-48 hours--------------------------------------------------49 hours or more---------------------------------------------
Totaloptometrists
Number of optometrictechnicians
18,299
4,7215,8384,1073,633
1,3273,3944,1681,6701,929820
1.358“709
2,924
1,3272,2611,8342,0494,5211,4291,151556
2,448725
2,0%5/;;
2;6011,205396
17,912387
2013,9203,3551,005
2,1532,8974,2182,3303,4313,269
Number
17,649
4,5855,6423,9183,503
1,3043,2814,0191,6231,847789
1,283686
2,817
1,3042,1821,7681,9674,3671,3491,110544
2,363696
1,9:;5,2156,3892,5021,163388
17,274375
1613,4543,209970
2,1022,8194,0802,2403,2893,118
485
1%15496
+;102
?:26551581
19
z
J:5833
6?25
12:17575323
4769
34i10827
;:9967
1;:
104
27282623
2:25
:
li
Ii
1:14
22191
J3
1;
:;l?
3
1031
370274
8521173023
62
1230
1?
E8
:3
1;
i6
2:
2
161
;12261141
602
4;113
7
1:71414
51

Table 17. Number and percent distribution of optometrists by number ofoptmmetric technicians they usedto assist in practice, according to geographic area and selected characteristicsof the optometrist:United States, 1968—Con.
Geographic area and selected characteristicsofoptometrist
United States------------------------------------------
Geographic region
Northeast----------------------------------------------------North Central------------------------------------------------South--------------------------------------------------------West---------------------------------------------------------
Geographic division
New Englad --------------------------------------------------Middle Atlantic----------------------------------------------East North Central-------------------------------------------West North Central-------------------------------------------South Atlantic-----------------------------------------------East South Central-------------------------------------------West South Central-------------------------------------------Momtain -----------------------------------------------------Pacific------------------------------------------------------
Standard Federal Administrative Region
RegionRegionRegionRegionRegionRegionRegionRegionRegionRegion
I---------------------“-------------------------------II----------------------------------------------------III---------------------------------------------------Iv----------------------------------------------------V---------------------------------------------------------------------------------------------------------
;;I---------------------------------------------------VIII--------------------------------------------------IX----------------------------------------------------x-------------------.---------------------------------
Age of.optometrist
Under 25 years-----------------------------------------------25-34 years--------------------------------------------------35-44 years--------------------------------------------------45-54 years--------------------------------------------------55-64 years--------------------------------------------------65-74 years--------------------------------------------------75 years and over--------------------------------------------
Sex of optometrist
Male----------------------------------------------------------Female-------------------------------------------------------
Number of States licensed in
No States----------------------------------------------------1 StEte------------------------------------------------------2 States-----------------------------------------------------3 States or more---------------------------------------------
Hours per week usually worked
1-34 hours---------------------------------------------------35-39 hours--------------------------------------------------40 hours-----------------------------------------------------41-44 hours--------------------------------------------------45-48 hours--------------------------------------------------49 hours or more---------------------------------------------
II Nmnber of optometrictechnicians
Percent distribution
100.0
100.0100.0100.0100.0
100.0100.0100.0100.O100.0100.0100.0100.0100.0
100.0100.0
100.0100.0100.0100.0
100.0100.0100.0100.0100.0100.0
96.5
97.196.695.496.4
98.396.796.497.295.796.294.596.796.4
98.396.596.496.096.694.496.597.896.596.0
100.096.496.696.396.296.598.0
96.496.9
83.196.795.796.5
97.697.396.796.195.995.4
2.7
2.02.4
N
;::2.52.23.8
M2,22.8
;::2.53.6
;:;2.91.42.53.4
2.i
;:;2.9
;:;
2.72.3
2.;3.22.7
1.72.4
N2.93.5
0.6
0.6
%20.6
0.2
M0.20.40.11.31.00.6
0.20.6
n0.6
::?
M!0.5
0.;0.50.60.5
::;
0.60.3
16.9
%;0.4
0.4
:::
~:;.
0.3
0.30.50.20.3
0.;0.5
H
::20.20.3
0.;0.30.20.5
M
O.i0.2
0.;
%:0.40.40,3
M
0.3
:::
::?0.40.30.40.4
52

Table 18. Number and percent distribution of optometrists by number ofoptometric technicians they usedto assist in practice, according to selected professionalUnited States, 1968
characteristics of the optometrist:
Selected professional characteristicsof optometrist
United States--------------------------------------------
Principal form of employment
Self employed:Solo practice------------------------------------------------Partnership--------------------------------------------------Group practice----------------------------------.------------
Employed by:Optometrists-------------------------------------------------Ophthalmologistsor other physicians-------------------------Profit-making firms------------------------------------------Nonprofit organizations (includinggovernment)---------------
Other----------------------------------------------------------
Number of office locations
1 oifice------------------......-----------------------.-------2 offices----------------------------------------------.-------3 offices or more----------------------------------------------
Number of patient visits per week
Less than 25 visits--------------------------------------------25-49 visits---------------------------------------------------50-74 visits---------------------------------------------------75-99 visits---------------------------------------------------100 visits or more---------------------------------------------
Number of patients seen per week
Less than 25 patients------------------------------------------25-49 patients-------------------------------------------------50-74 patients-------------------------------------------------75-99 patients-------------------------------------------------100 patients or more-------------------------------------------
Number of supplementaryhelpers of all types
None-----------------------------------------------------------2.assistant----------------------------------------------------2 assistants---------------------------------------------------3 assistants or more-------------------------------------------
Number of optometric services rendered
1-3 services---------------------------------------------------4-6 services---------------------------------------------------7-9 senices ---------------------------------------------------10 services or more--------------------------------------------
TvDe of optometric service
Refractions----------------------------------------------------Visual field examination---------------------------------------Tonometry------------------------------------------------------Anfseikonic testing--------------------------------------------Biomfcroscopy--------------------------------------------------Ophthalmoscopy-------------------------------------------------Contact lens fitting-------------------------------------------Visual training (orthoptics)-----------------------------------Developmentalvision-------------------------------------------Prescribing low vision aids------------------------------------Visual readiness for reading-----------------------------------Dispensing and adjusting eyeware-------------------------------Frame repairs--------------------------------------------------Fabrication of eyeware-----------------------------------------Other----------------------------------------------------------
Number
18,29$
13,51C2>17$53(
95117163618314C
15,0822,80641C
1>5783,7624,9892,7505,221
4,0866,8863,7191,7261,881
3,9606,6553,8833,801
9004,0757,3445,980
18,23813,78012,0981,5285,907
16,92814,5219,1285,2257,4504,73517,12215,5326,610-718
17,649
13,2511,990472
881155;5;
132
14,5832,675391
1,5453,6924,8492,6504,913
4,0226,6923,5681,6321,734
;,;%;
3:7453,310
8783,9447,1405,688
L7,588L3,27711,6291,4385,608L6,322L3,9738,7855,0097,1274,518L6,521L4,9886,319678
485
22513136
431323
;
385928
23.53113
2;;
47156109
L;!
-
1;$330
12
L%233
L8538636175?42155io9~72L7025(3L69kslill~zz25
104 62
1318
8
10
:61
421010
449
3;
1:13
2;
6i
1;2618
z33
817
2$25
H2253
:;1
53
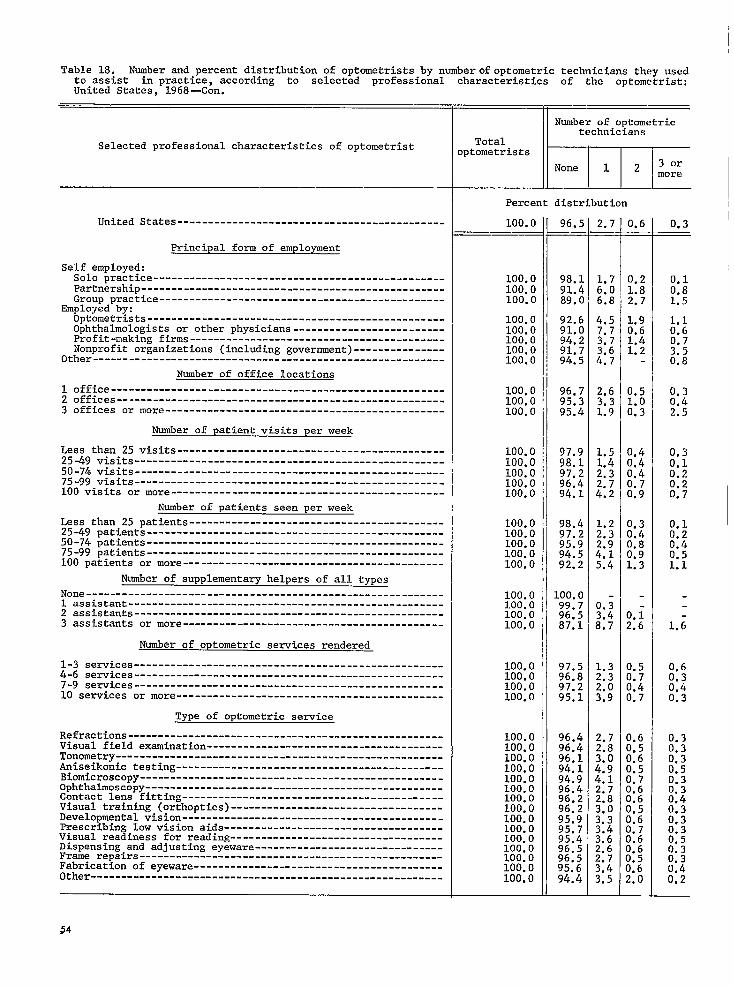
Table 18. Number and percent distribution of optometrists by number of optometric technicians they usedto assist in practice, according to selected professional characteristics of the optometrist:United States, 1968—Con.
. . . .
Selected professional characteristics of optometrist
United States--------------------------------------------
Principal form of employment
Self employed:Solo practice------------------------------------------------Partnership--------------------------------------------------Group practice-----------------------------------------------
Employed by:Optometrists-------------------------------------------------Ophthalmologistsor other physicians-------------------------Profit-making firms------------------------------------------Nonprofit organizations (including government)---------------
Other----------------------------------------------------------
Number of office locations
1 office-------------------------------------------------------2 offices------------------------------------------------------3 offices or more----------------------------------------------
Number of patient visits per week
Less than 25 visits--------------------------------------------25-49 visits---------------------------------------------------50-74 visits---------------------------------------------------75-99 visits---------------------------------------------------100 visits or more---------------------------------------------
Number of patients seen per week
Less than 25 patients------------------------------------------25-49 patients-------------------------------------------------50-74 patients-------------------------------------------------75-99 patients-------------------------------------------------100 patients or more-------------------------------------------
Number of supplementaryhelpers of all types
None-----------------------------------------------------------1 assistant----------------------------------------------------2 assistants---------------------------------------------------3 assistants or more-------------------------------------------
Number of optometric services rendered
1-3 senices ---------------------------------------------------4-6 senices ---------------------------------------------------7-9 senices ---------------------------------------------------10 services or more--------------------------------------------
Type of optometric service
Refractions----------------------------------------------------Visual field examination---------------------------------------Tonmetry ------------------------------------------------------Aniseikonic testing--------------------------------------------Bimicroscopy --------------------------------------------------Ophthalmoscopy-------------------------------------------------Contact lens fitting-------------------------------------------Visual training (orthoptics)-----------------------------------Developmental vision-------------------------------------------Prescribing low vision aids------------------------------------Visual readiness for reading-----------------------------------Dispensing and adjusting eyeware-------------------------------Frame repairs--------------------------------------------------Fabrication of eyeware-----------------------------------------Other----------------------------------------------------------
Totaloptometrists
Number of optometrictechnicians
I
None 1 2 3 ormore
I I IPercent distribution
100.0
100.0100.0100.0
100.0100.0100.0100.0100.0
100.0100.0100.0
100.0100.0100.0100.0100.0
100.0100.0100.0100.0100.0
100.0100.0100.0100.0
100.0100.0100.0100.0
100.0100.0100.0100.0100.0100.0100.0100.0100.0100.0100.0100.0100.0100.0100.0
96.5
98.191.489.0
92.691.094.291.794.5
96.795.395.4
97.998.197.296.494.1
98.497.295.994.592.2
100.099.796.587.1
97.596.897.295.1
96.496.496.194.194.996.496.296.295.995.795.496.596.595.694.4
2.7
:::6.8
4.57.73.7
::;
2.6
::2
1.5
;::
::;
1,22.3
::?5.4
0.;3.4B.7
1.32.32,03.9
2.7
$:
::!!2.72.8
::!3.43.6
;:;3.43.5
0.6
0.21.82.7
A::1.41.2
0.5
::!/
0.40.40,40.70.9
0.30.40.80.91.3
0.i2.6
0.50.70.40.7
0.60.50.60.50.70.60.60.50.60.70.60.60.50.62.0
0.3
0.10.81.5
:::0.7
;::
0.30.42.5
i ?0.20.20.7
i ;0.40.51.1
1.6
0.60.30.40.3
0.30.30.30.50.3
$:0.30:30.30.50.3
:::0.2

Table 19. Number and percent distribution of optometrists by number of dispensing opticians they usedto assist in practice, according to State: United States, 1968
State
United States------------------------------------------
::::;y --------------------------------------------------------------------------- ---------------------------- -------
Arizona------------------------------------------------------Arkansas-----------------------------------------------------California---------------------------------------------------Colorado-----------------------------------------------------Connecticut--------------------------------------------------Delaware-----------------------------------------------------~$~)~t of Columbia-----------------------------------------
-----------------..-------------..----------------------
Georgia------------------------------------------------------Hawaii-------------------------------------------------------Idaho--------------------------------------------------------:::~n:s -----------------------------------------------------
------------------------------------------------------Iowa---------------------------------------------------------Kansas-------------------------------------------------------Kentucky-----------------------------------------------------Louisiana----------------------------------------------------Maine.......-------------------------------------------------
Maqland -----------------------------------------------------Massachusetts------------------------------------------------Michigan-----------------------------------------------------Minnesota----------------------------------------------------Mississippi--------------------------------------------------Missouri-----------------------------------------------------Montana------------------------------------------------------Nebraska-----------------------------------------------------Nevada........------------------------------------------------New Hmpshire ------------------------------------------------
New Jersey ---------------------------------------------------NewMexico ----------------------------------------------------New York-----------------------------------------------------North Carolina-----------------------------------------------North Dakota-------------------------------------------------Ohio........-........----------------------------------------Oklahoma-----------------------------------------------------Oregon.......------------------------------------------------Pennsylvania-------------------------------------------------Rhode Island------------------------------...................-
South Carolina-----------------------------------------------South Dakota-------------------------------------------------Tennessee----------------------------------------------------Texas--------------------------------------------------------Utah---------------------------------------------------------Vemont ------------------------------------------------------Virginia-----------------------------------------------------Washington---------------------------------------------------West Virginia-------------------------------------------------Wisconsin----------------------------------------------------~ming ------------------------------------------------------
Number of dispensingovticians
18,295
18C17
127151
2,22218625E35
4;;
261
%1,602503336229229222116
174714708353120431
1::3670
674
1,5;+320
9;?245265
1,133132
15594292740743827235614742841
16.068
15716
112143
1,960152244
::428
224
E1,442433300206214190110
123665584291119373
lg
65
6X&
1,252316
8;;243225
1,071124
149
2%51861
2%X&
36935
451
55

Table 19. Number and percent distribution of optometrists by number of dispensing opticians they usedto assist in practice, according to State: United States, 196&Con.
State
United States------------------------------------------
Alabma ------------------------------------------------------Alaska-------------------------------------------------------Arizona------------------------------------------------------Arkansas-----------------------------------------------------California---------------------------------------------------Colorado-----------------------------------------------------Connecticut--------------------------------------------------Delaware-----------------------------------------------------District of Columbia-----------------------------------------Florida------------------------------------------------------
Georgia------------------------------------------------------Hawaii-------------------------------------------------------Idaho--------------------------------------------------------Illinois-----------------------------------------------------Indiana------------------------------------------------------Iowa.-----------.------------------------------.-------------Kansas-------------------------------------------------------Kentucky-----------------------------------------------------Louisiana----------------------------------------------------Maine--------------------------------------------------------
~qland -----------------------------------------------------&ssachusetts ------------------------------------------------Michigan-----------------------------------------------------Miwesota ----------------------------------------------------Mississippi--------------------------------------------------Missouri-----------------------------------------------------Montana------------------------------------------------------Nebraska-----------------------------------------------------Nevada-------------------------------------------------------New Hampshire------------------------------------------------
New Jersey ---------------------------------------------------New Mexico ---------------------------------------------------New York-----------------------------------------------------North Carolina-----------------------------------------------North Dakota-------------------------------------------------Ohio---------------------------------------------------------Oklahoma---------------------------------------------.-------Oregon-----------------2-------------------------------------Pennsylvania-------------------------------------------------Rhode Island-------------------------------------------------
South Carolina-----------------------------------------------South Dakota-------------------------------------------------Tennef.L&----------------------------------------------------Tex::-----------------------------------------.--------------ut.lFl---------------------------------------------------------V:rmont...---------------------------------------------.-----Virginia-----------------------------------------------------~7ashington---------------------------------------------------West Virginia------------------------------------------------Wisconsin----------------------------------------------------Wyoming------------------------------------------------------
Totaloptometrists
Percent distribution
100.0
100.0100.0100.0100.0100.0100.0100.0100.0100.0100.0
100.0100.0100.0100.0100.0100.0100.0100.0100.0100.0
100.0100.0100.0100.0100.0100.0100.0100.0100.0100.0
100.0100.0100.0100.0100.0100.0100.0100.0100.0100.0
100.0100.0100.0100.0100.0100.0100.0100.0100.0100.0100.0
87.8
87.493.888.794.988.282.094.8100.066.186.9
85.598.498.790.086.189.489.893.585.995.4
70.6:;.;
82:499.186.595.183.690.992.4
94.493.178.999.095.287.199.184.894.594.1
95.987..5;9.$
82:5100.093.987.697.186.486.1
7.6
8.26.37.85.2
1!:24.8
18.;11.8
9.61.6
;:;
;:;
::;
;:;
10.6
1::;10.30.9
:::11.0
R
4.1
1;:;0.7
U
R4.2
1::;
1;:;.
4.;9.1
1;:;13.9
2.5
1.3
1.;
1.;
:::
5.;1.3
1.6
;:;2.90.91.9
;:;
8.1
U4.6
2.;
4.i
1.;
1.5
$:;
:::2.8
3.;1.11.7
0.71.10.40.66.4
O.i1.5
1.;
2.1
3.1
1.;
:::
10.;
3.2
;::
;:;
4.;
10.60.52.42.7
2.;
1.Z
1.;
-
4.i
3.;
2.:0.3
1.10.45.9106
0.;1.8
1.0
56

Table 20. Number and percent distribution of optometrists by number’of dispensing opticians they usedto assist in practice, according to geographic area and selected characteristics of the optometrist:Unhted States, 1968
Geographic area and selected characteristicsofoptometrist
United States------------------------------------------
Geographic region
Northeast----------------------------------------------------North Central------------------------------------------------South--------------------------------------------------------west---------------------------------------------------------
Geographic division
New England--------------------------------------------------Middle Atlantic----------------------------------------------East North Central-------------------------------------------West North Central-------------------------------------------south Atlantic-----------------------------------------------East South Central-------------------------------------------Wcs’cSouth Central-------------------------------------------Mountain-----------------------------------------------------Pacific------------------------------------------------------
Standard Federal Administrative Region
RegionRegionRegionRegionRegionRegionRegionRegionRegionRegion
I -------- ------------- -------- -------- --------- ----------- - --- - ----- ------ -- - --------- ---------------------
:~I-------------------------------------------------------------------------------------------------------
v---------------------------,---------------------------vI----------------------------------------------------VII---------------------------------------------------vIII--------------------------------------------------r----------------------------------------------------
i~----------------------------------------------------
Age of optometrist
Under 25 years-----------------------------------------------25-34 years--------------------------------------------------35-44 years--------------------------------------------------45-54 years--------------------------------------------------55-64 years--------------------------------------------------b5-74 years--------------------------------------------------75 years and over--------------------------------------------
Sex of optometrist
Male---------------------------------------------------------Female-------------------------------------------------------
Number of States licensed” in
No States----------------------------------------------------1 State------------------------------------------------------2 States-----------------------------------------------------3 States or more---------------------------------------------
Hours per week usually worked
1-34 hours---------------------------------------------------35-39 hours--------------------------------------------------40 hours-----------------------------------------------------41-44 hours---------------------------------------------------45-48 hOU~S --------------------------------------------------49 hours or more---------------------------------------------
Number of dispensingouticians
18.299
4,7215,8384,1073,633
1,3273,3944,1681,6701,929820
1,358709
2,924
1,3272,2611,8342,0494,5211,4291,151556
2,448725
622,0045,4006,6322,6011,205
396
17,912387
13,9%’3,3551,005
2,1532,8974,2182,3303,4313,269
16.068
4,2055,0863,5743,204
1,2462,9583,6351,4501,721759
1,094628
2,576
1,2461,8881,6751,8763,9261,1591,008484
2,168638
1,6;:4,6925,8712,3031,081373
15,735333
12,2;;2,:;;
2,0152,6673,5961,9962,9532,841
1.389
341476312261
2;:335140139
l;i
2;;
63231
1::372131
;:15859
1824544701837520
.,35436
.,02:27194
1:357205291298
451
3 ormore
391
57

Table 20. Number and percent distribu~ion of optometrists by number of dispensing opticians they usedto assist in practice, according to geographic area and selected characteristics of the optometrist:United States, 1968—Con.
Geographic area and selected characteristicsofoptometrist
United States------------------------------------------
Geographic region
Northeast----------------------------------------------------North Central------------------------------------------------South--------------------------------------------------------West---------------------------------------------------------
Geographic division
New England--------------------------------------------------Middle Atlantic----------------------------------------------East North Central-------------------------------------------West North Central-------------------------------------------South Atlantic-----------------------------------------------East South Central-------------------------------------------West South Central-------------------------------------------Mowtain -----------------------------------------------------Pacific------------------------------------------------------
Standard Federal Administrative Region
RegionRegionRegionRegionRegionRegionRegionRegionRegionRegion
I-----------------------------------------------------II----------------------------------------------------III---------------------------------------------------IIJ----------------------------------------------------v-.----------------------- ------------- ------------- --vl----- -----------------------------------------------VII---------------------------------------------------VIII--------------------------------------------------Ix----------------------------------------------------x-----------------------------------------------------
Age of optometrist
Under 25 years-----------------------------------------------25-34 years--------------------------------------------------35-44 years--------------------------------------------------45-54 years--------------------------------------------------55-64 years--------------------------------------------------65-74 years--------------------------------------------------75 years and over--------------------------------------------
Sex of optometrist
Male---------------------------------------------------------Female-------------------------------------------------------
Number of States licensed in
No States----------------------------------------------------1 State------------------------------------------------------2 States-----------------------------------------------------3 States or more---------------------------------------------
Hours per week usually worked
1-34 hours---------------------------------------------------35-39 hours--------------------------------------------------40 hours-----------------------------------------------------41-44 hours--------------------------------------------------45-48 hours--------------------------------------------------49 hours or more---------------------------------------------
Number of dispensingopticians
Total?tometrists
None 1 2 3 ormore
Percent distribution
100.0
100.0100.0100.0100.0
100.0100.0100.0100.0100.0100.0100.0100.0100.0
100.0100.0100.0100.0100.0100.0100.0100.0100.0100.0
100.0100.0100.0100.0100.0100.0100.0
100.0100.0
100.0100.0100.0100.0
100.0100.0100.0100.0100.0100.0
87.8
89.187.187.088.2
93.987.287.286.889.292.680.688.588.1
93.983.591.391.686.981.187.687.188.688.0
84.284.686.988.588.689.794.4
87.986.0
88.588.387.382.3
93.692.185.285.786.186.9
7.6
7.28.27.67.2
4,88.28.1
!?:;5.7
H6.9
1;:;5.26.78.2
;::8.76.58.1
5.2
;::7.17.06.25.0
7.69.2
5.87.48.19.4
4.35.18.5
M9.1
2.5=
2.22.73.01.9
;:;2.6
u0.96.21.71.9
1.03.4
N2.76.o
;::1.82.1
3.62.72.72.23.01.80.3
2.52.9
2.;2.5%.7
1.31.53.12,93.12.3
2.1~
1.62.12.42.8
0.32.12.21.8
M4.01.53.1
0.32.9
k;2.23.81.71.8
?:;
7.0
;::2.2
k:0.3
2.12.0
5.8
::?3.5
0.81,43.2
;::1.7
58
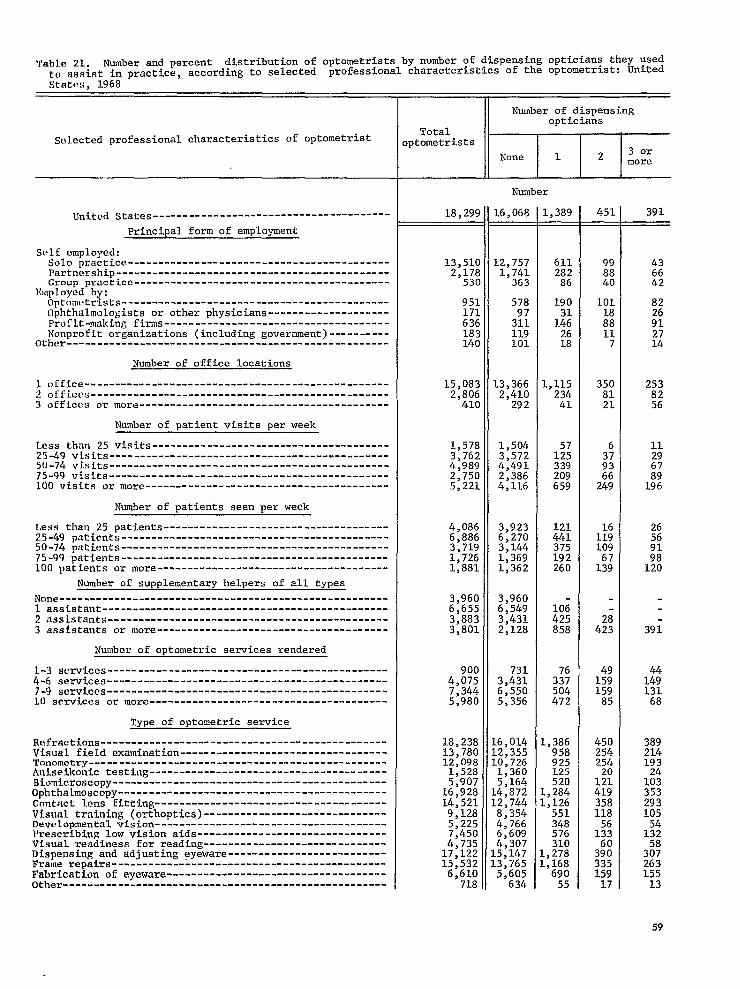
Table 21. Number and percent distribution of optometrists by number of dispensing opticians they usedto assist in Dractice, according to selected professional characteristics of the optometrist: UnitedStates, 1968 -
Selected professional characteristics of optometrist
United States---------------------------------------
Principal form of employment
Self employed:SII1Opractice-------------------------------------------PartnersIlip---------------------------------------------Group practice------------------------------------------
Employed by:Optometrists--------------------------------------------Ophthalmologistsor other physicians--------------------Profit-making firms-------------------------------------Nonprofit organizations (including government)----------
Other-----------------------------------------------------
Number of office locations
1 Office--------------------------------------------------2 offices-------------------------------------------------3 offices or more-----------------------------------------
Number of patient visits per week
Less than 25 visits---------------------------------------25-49 visits---.--------------------------------,----------50-74 visits“---------------------------------------------75-99 visits----------------------------------------------100 visits or more----------------------------------------
Number of patients seen per week
Less than 25 patients-------------------------------------25-49 patients--------------------------------------------50-74 patients--------------------------------------------75-99 patients--------------------------------------------LOO patients or more--------------------------------------
Number of supplementaryhelpers of all types
None------------------------------------------------------1 assistant-----------------------------------------------2 assistants----------------------------------------------3 assistants or more--------------------------------------
Number of optometric services rendered
1-3 services------..---.-----------------------------------4-6 semices ----------------------------------------------7-9 services----------------------------------------------10 services or more---------------------------------------
Type of optometric service
Refractions-----------------------------------------------Visual field examination----------------------------------Tonometry-------------------------------------------------AniseLkonic testing---------------------------------------BLonicroscopy---------------------------------------------Ophthalmoscopy--------------------------------------------Contact lens fitting--------------------------------------Visual training (orthoptics)------------------------------Developmentalvision--------------------------------------Prescribing low vision aids-------------------------------Visual readiness for reading------------------------------Dispensing and adjusting eyeware--------------------------Frame repairs---------------------------------------------Fabrication of eyeware------------------------------------Other-----------------------------------------------------
Totaloptometrists
Number of dispensingopticians
I I I
None I 1 I 2 3 ormore
18,299
13,51C2,17853C
95117163618:140
15,0832,806
410
1,5783,7624,9892,7505,221
4,0866,8863,7191,7261,881
3,9606,6553,8833,801
9004,075J, 3445,980
18,23813,78012,0981,5285,90716,92814,5219,1285,2257,4504,73517,12215,5326,610
718
Number
16,068
12,7571,741363
578
3;:119101
13,3662,410292
1,5043,.5724,4912,3864,116
3,9236,2703,1441,3691,362
3,9606,5493,4312,128
7313,4316,5505,356
.6,014
.2,355
.0,7261,3605,164.4,872.2,7448,3544,7666>6094,307.5,147.;,;;;
’634
L,389
6112::
190
12;2618
.,11523441
1;;339209659
121441375;:;
10;425858
3;;504472
,386958925125520,284,126551348576310,278,16869055
391
43
H
;;
912714
2538256
1129
:;196
i’:
R120
39i
1:$1;:
389214193
1::35329310554132
3%26315513
59

Table 21. Number and percent distribution of optometrists by number of dispensing opticians they used ~to assist in nractice. accordinz to selected professional characteristicsof the optometrist: UnitedStates, 1968~Con. “
Selected professional characteristicsof optometrist
United States---------------------------------------
Principal form of employment
Self employed:Solo pzactice-------------------------------------------Partnership---------------------------------------------Group practice------------------------------------------
Employed by:Optometrists--------------------------------------------Ophthalmologistsor other physicians--------------------Profit-making firms-------------------------------------Nonprofit organizations (including government)----------
Other-----------------------------------------------------
Number of office locations
1 office--------------------------------------------------2 offices-------------------------------------------------3 offices or more-----------------------------------------
Number of patient visits per week
Less than 25 visits---------------------------------------25-49 visits----------------------------------------------50-74 visits----------------------------------------------75-99 visits----------------------------------------------100 visits or more-----------------------------:----------
Number of patients seen per week
Less than 25 patients-------------------------------------25-49 patients--------------------------------------------50-74 patients--------------------------------------------75-99 patients--------------------------------------------100 patients or more--------------------------------------
Number of supplementar~helpers of all types
None------------------------------------------------------1 assistant-----------------------------------------------2 assistants----------------------------------------------3 assistants or more--------------------------------------
Number of optometric services rendered
1-3 senices ----------------------------------------------4-6 services----------------------------------------------7-9 semices ----------------------------------------------10 services or more---------------------------------------
Type of optometric service
Refractions-----------------------------------------------Visual field examinat’ion----------------------------------Tonmetry -------------------------------------------------Aniseikonic testing---------------------------------------Biomicroscopy---------------------------------------------Ophthalmoscopy--------------------------------------------Contact lens fitting--------------------------------------Visual training (orthoptics)------------------------------Developmental vision--------------------------------------Prescribing low vision aids-------------------------------Visual readiness for reading------------------------------Dispensing and adjusting eyeware--------------------------Frame repairs---------------------------------------------Fabrication of eyeware------------------------------------Other-----------------------------------------------------
60
TotalOptometrists
Number of dispensingopticians
None I 1 I 2 3 ormore
Percent distribution
100.0
100.0100.0100.0
100.0100.0100.0100.0100.0
100.0100.0100.0
100.0100.0100.0100.0100.0
100.0100.0100.0100.0100.0
100.0100.0100.0100.0
100.0100.0100.0100.0
87.8
94.480.068.5
60.856.548.964.872.5
88.685.971.3
95.394.990.086.878.8
96.091.184.579.372.4
100.098.488.456.0
81.384.289.289.6
87.889.788.789.087.487.987.891.5::.;
91:088.588.684.888.2
7.6
1::;16.1
19.917.923.014.312.7
;::9.9
3.6
;:;
12:6
:::10.111.113.8
1;:;22.6
:::6.97.9
7.67.0
ii;8.87.6
:::6.7
::;7.5
1;::7.6
~
H7.5
10.710.313.86.04.7
2.32.95.1
0.41.01.9
;::
0.41.72.93.97.4
-
1?::
5.43.92.21.4
2.51.8;.:.
$:;2.51.3
;::1.32,32.2
;::
2.1
0.33.07.8
1!:;:$;
10:2
;:;13.7
0.70.81.33.23.8
‘0.60.8
$;6.4
10.i
“4.93.71.81.1
2.11.61.61.61.72.12.01.2;.:
1:2
::!2.41.9
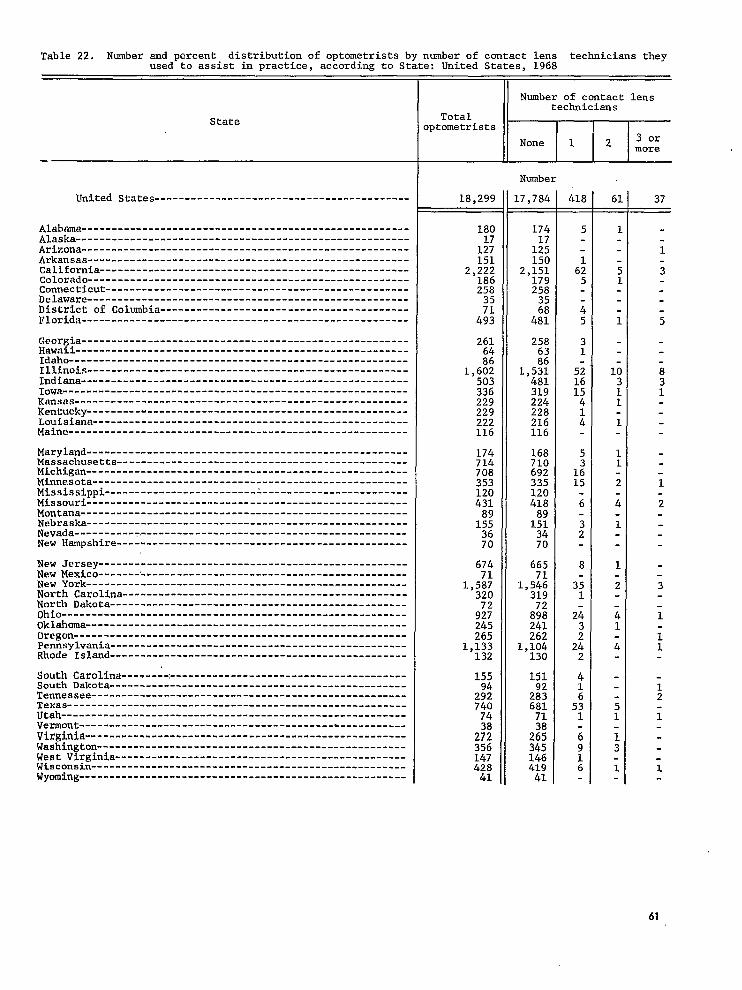
Table 22. Number and percent distribution of optometrists by number of contact lens technicians theyused to assist in practice, according to State; United States. 1968
State
United states------------------------------------------
Alabma ------------------------------------------------------Alaska-------------------------------------------------------Arizona------------------------------------------------------Arkansas-----------------------------------------------------California---------------------------------------------------Colorado-----------------------------------------------------Connecticut--------------------------------------------------Delaware-----------------------------------------------------District of Colombia-----------------------------------------Florida------------------------------------------------------
Georgia------------------------------------------------------~;;i -------------------------------------------------------
--------------------------------------------------------Illinois-----------------------------------------------------Indiana------------------------------------------------------Iowa---------------------------------------------------------Kansas-------------------------------------------------------Kentucky-----------------------------------------------------Louisiana----------------------------------------------------Maine--------------------------------------------------------
Maryland-----------------------------------------------------Massachusetts------------------------------------------------Michigan-----------------------------------------------------Minnesota----------------------------------------------------Mississippi--------------------------------------------------Missouri-----------------------------------------------------Montana------------------------------------------------------Nebraska-----------------------------------------------------Nevada-------------------------------------------------------New H-pshire ------------------------------------------------
New Jersey ---------------------------------------------------New Mexico-------'--------------------------------------------New York-----------------------------------------------------North Carolina-----------------------------------------------North Dakota-------------------------------------------------Ohio---------------------------------------------------------Oklahoma-----------------------------------------------------Orega -------------------------------------------------------Pennsylvania-------------------------------------------------Rhode Island-------------------------------------------------
South Carolina-------+..---------------------------------------South Dakota-------------------------------------------------Tennessee----------------------------------------------------Texas--------------------------------------------------------Utah---------------------------------------------------------ve~o~t.-----------------------------------------&-----------Virginia -----------------------------------------------------Washington---------------------------------------------------West Virginia------------------------------------------------Wisconsin----------------------------------------------------Wyoming------------------------------------------------------
11
II Number of contact lenstechnicians
Number
18.299
180
1;;151
2,222186258
;:493
261
%1,602503336229229222116
17471470835312043189155
%
674
1,5;+32072927245265
1,133132
155
2;;74074
2;;35614742841
17,784
1741712515C
2,15117$258
:2481
25863
1,5X481319224228216116
168710692335120418
1:?3470
66571
1>546319
8;;241262
1,104130
151
2%68171
2%34514641941
418 6:
61

Table 22. Number and percent distribution of optometrists by number or contact lens technicians theyused to assist in practice. accordinz to State: United States, 1968—con.
State
United States------------------------------------------
Alabma ------------------------------------------------------Alaska-------------------------------------------------------Arizona------------------------------------------------------Arkansas-----------------------------------------------------California---------------------------------------------------Colorado-----------------------------------------------------Connecticut--------------------------------------------------Delaware-----------------------------------------------------District of Columbia-----------------------------------------Florida-----------------------------.------------------------
Georgia------------------------------------------------------Hawaii-------------------------------------------------------Idaho--------------------------------------------------------Illinois-----------------------------------------------------Indiana------------------------------------------------------Iowa-------.-------------------------------------------------Kansas.------------------------------------------------------Kentucky-----------------------------------------------------Louisiana----------------------------------------------------Maine--------------------------------------------------------
Maryland-----------------------------------------------------Massachusetts------------------------------------------------Michigan-----------------------------------------------------Minnesota----------------------------------------------------Mississippi--------------------------------------------------Missouri-----------------------------------------------------Montana------------------------------------------------------Nebraska-----------------------------------------------------Nevada-------------------------------------------------------New Hmpshire ------------------------------------------------
New Jersey --------------------------- ------------------------
New Mexico---------------------------------------------------New York-----------------------------------------------------North Carolina-----------------------------------------------North Dakota-------------------------------------------------Ohio---------------------------------------------------------Oklahoma-----------------------------------------------------Oregon-------------------------------------------------------Pennsylvania-------------------------------------------------Rhode Island-------------------------------------------------
South Carolina-----------------------------------------------South Dakota-------------------------------------------------Tennessee----------------------------------------------------Texas--------------------------------------------------------utah---------------------------------------------------------Vermont------------------------------------------------------Virginia-----------------------------------------------------Washington---------------------------------------------------West Virginia------------------------------------------------Wiscmsin ----------------------------------------------------Wyming ------------------------------------------------------
Number of contact lenstechnicians
Percent distribution
100.0
100.0100.0100.0100.0100.0100.0100.0100.0100.0100.0
100.0100.0100.0100.0100.0100:0100.0100.0100.0100.0
100.0100.0100.0100.0100.0100.0100.0100.0100.0100.0
100.0100.0100.0100.0100.0100.0100.0100.0100.0100.0100.0
97.2
96.9100.099.199.396.896.5100.0100.094.997.6
98.898.4100.095.695.594.997.799.597.5100.0
96.3;;.:
94:9100.097.0100.097.393.9100.0
98.7100.097.499.7
100.096.998.398.897.498.3
97.297.797.192.195.2100.097.696,799.398.0100.0
2.3
2.5
0,?2.82.9
5.;1.1
1.21.6
3.3
::;
;::2.0
::;
::;
1.;
2.;6.1
1.2
2.20.3
2.;
::;2.11.7
2,8
H7.21.6
2.62.40.71.5
0.3
0.6
0.;0.6
0.;
.
0.;0.6
::;
0.;
0.60.2
0.;
1,6
0.;
0.2.-0.1
0.;0.4
0.4
0.;1.6
0.;0.9
0.;
0.2
0,;
0.;
1.;
0.;0.60.3
0.;
0,;
.
0.2
0.1
O.z0.1
;:;
1.;
0.;
62

Table 23. Number and percent distribution of optometrists by number of contact lens technicians theyused to assist in practice, according to geographic area and selected characteristicsof the optome-trist: United States, 1968
Geographic area and selected characteristicsofoptometrist
United States-------------------------------------------
Geographic region
Northeast-----------------------------------------------------l$o~~ Central-------------------------------------------------
-----------------------------------------------------.---West----------------------------------------------------------
Geographic division
New England---------------------------------------------------Middle Atlantic-----------------------------------------------East North Central--------------------------------------------West North Central--------------------------------------------South Atlantic----y-------------------------------------------East South Central...--------.-&------------------------------West South Central--------------------------------------------Mountain----------y-------------------------------------------Pacific-----------i-------------------------------------------
Standard Federal Administrative Region
RegionRegionRegionRegionRegionRegionRegionRegionRegionRegion
-------- ---------------- -------- ------------ --------- -;I-----------------------------------------------------III----------------------------------------------------IV-------....ti-----------------------------------------v--------..l..-..--------------------------------------VI---------A-------------------------------------------VII----------------------------------------------------VIII---------------------------------------------------IX-------------J---------------------------------------X------------------------------------------------------
Age of optometrist
Under 25 years------------------------------------------------25-34 years----------------------<----------------------------35-44 years---------------------------------------------------45-54 years---------------------------------------------------55-64 yeara---------------------------------------------------65-74 years---------------------------------------------------75 years and over----;----------------------------------------
,,I Sex of optometrist
Male----------------------------------------------------------Femle --------------------------------------------------------
Number of States licensed in
y~~:s --------------------------------------------------------------------- -------- -------- -------- -------- . ------
2 States------------------------------------------------------3 States or more----------------------------------------------
Hours per week usually worked
1-34 hours----------------------------------------------------35-39 hours---------------------------------------------------40 hours------------------------------------------------------41-44 hours---------------------------------------------------45-48 hours---------------------------------------------------49 hours or more----------------------------------------------
I I
Number
18,299
4,7215,8384,1073,633
1,3273,3944,1681,6701,929820
1,358709
2,924
1,3272,2611,8342,0494,5211,4291,;::
2,448725
2,0::5,4006,6322,6011,205396
17,912387
13,9;:3,3551,005
2,1532,8974,2182,330:,:;;s
17,784
4,6355,6313,9843,533
1,3203,3154,0211,6101,:;;
1,288696
2,838
1,3202,2111,7872,0144,3561,3591,111544
2,374710
1,9:;5,246;,;;:
1;174389
17,415369
L3,5;?3,260961
2,1112,854;,;;:
3;3093,156
418
J:10482
5
1!
29
&
7:
$
261306229
6;11
5:13115150234
40413
31:
x
313998639988
63

Table 23. Number and percent distribution of optometrists by number of contact lens technicians they iused to assist in practice, according to geographic area and selected characteristicsof the Optome-trist: United States, 1968—Con.
Geographic area and selected characteristicsofoptometrist
United States------------------------------------------
Geographic region
Northeast----------------------------------------------------North Central------------------------------------------------south--------------------------------------------------------West---------------------------------------------------------
Geographic division
New England--------------------------------------------------Middle Atlantic----------------------------------------------East North Central-------------------------------------------West North Central-------------------------------------------South Atlantic-----------------------------------------------East South Central-------------------------------------------West South Central-------------------------------------------Mountain-----------------------------------------------------Pacific------------------------------------------------------
Standard Federal Administrative Region
RegionRegionRegionRegionRegionRegionRegionRegionRegionRegion
I-----------------------------------------------------II----------------------------------------------------III---------------------------------------------------IV----------------------------------------------------V---------------------------------------------------------------------------------------------------------
;:I---------------------------------------------------VIII--------------------------------------------------IX----------------------------------------------------X-----------------------------------------------------
Age of optometrist
Under 25 years-----------------------------------------------25-34 years--------------------------------------------------35-44 years--------------------------------------------------45-54 years--------------------------------------------------55-64 years--------------------------------------------------65-74 years--------------------------------------------------75 years and over--------------------------------------------
Sex of optometrist
Male---------------------------------------------------------FemalF -------------------------------------------------------
Number of States licensed in.
No States-----------------------------------------------------1 state------------------------------------------------------~ ~t~re~-.-s-------..---.----.--=--.-------.---=-------------3 States w- more-------------- .-----------------------------
Hours per we;% .,1~y : .ked
1-34 hours---------------------------------------------------35-39 hours--------------------------------------------------40 hours------------------------------------------------------41-44 hours--------------------------------------------------45-48 hours--------------------------------------------------49 hours or more---------------------------------------------
Number of contact lenstechnicians
Totaloptometrists
m
Percent distribution
100.0
100.0100.0100.0100.0
100.0100.0100.0100.0100.0100.0100.0100.0100.0
100.0100.0100.0100.0100.0100.0100.0100.0100.0100.0
100.0100.0100.0100.0100.0100.0100.0
100.0100.0
100.0100.0100.0100.0
100.0100.0100.0100.0100.0100.0
97.2
98.296.597.097.3
99.597.796.596.498.098.294.998.197.1
99.597.8;2.;
96:395.196.597.897.097.9
93.096.497.297.297.797.498.3
97.295.4
94.697.397.295.6
98.198.597.196.896.496.5
2.3
1.52.72.52.3
0.42.02.8
::;
;:21.22.5
0.41.92.11.3
;:;2.51.42.71.5
5.22.82.42.31.9
;:?
2.33.5
5.42.32.03.5
1.41.42.3
;:;2.7
0.3
0.20.50.30.3
0.10.2
:::
8:;0.60.30.3
0.10.20.40.1
H0.70.40.20.5
.
;::0.40.30.40.6
0.30.6
0.;0.40.3
0.30.00.30.4
H
0.2
0.10.30.20.2
o.i0.30.30.30.3
8::
.0.20.10.40.3
0.30.40.20.2
:::
::$
::;.
0.20.6
o,i0.40.5
0,2
%$0.10.20.3
64

Table 24. Number and percent distribution of optometrists by number of contact lens technicians theyused to assist in practice? according to selected professional characteristicsof the optometrist:United States, 1968
Selected professional characteristics of optometrist
United States---------------------------------------
Principal form of employment
Self employed:solo practice-------------------------------------------Partnership---------------------------------------------Group practice------------------------------------------
Employed by:Optometrists--------------------------------------------ophthalmologistsor other physicians--------------------profit-making firms-------------------------------------Nonprofit organizations (includinggovernment)----------
Other-----------------------------------------------------
Number of office locations
1 office--------------------------------------------------2 offices-------------------------------------------------3 offices or more-----------------------------------------
Number of patient visits per week
Less than 25 visits---------------------------------------25-49 visits----------------------------------------------50-74 visits----------------------------------------------75-99 visits----------------------------------------------100 visits or more----------------------------------------
Number of patients seen per week
Less than 25 patients-------------------------------------25-49 patients--------------------------------------------50-74 patients--------------------------------------------75-99 patients--------------------------------------------100 patients or more--------------------------------------
Number of supplementaryhelpers of all types
None.-.--.------------------------------------------------1 assistant-----------------------------------------------2 assistants----------------------------------------------3 assistants or more--------------------------------------
Number of optometric services
1-3 services----------------------------------------------4-6 semices ----------------------------------------------7-9 senices ----------------------------------------------10 services or more---------------------------------------
Type of optometric service
Refractions-----------------------------------------------Visual field examination----------------------------------Tonometry-------------------------------------------------Aniseikonic testing---------------------------------------Biomicroscopy---------------------------------------------ophthahoscopy --------------------------------------------Contact lens fitting--------------------------------------Visual training (orthoptics)------------------------------Developmentalvision--------------------------------------Prescribing low vision aids-------------------------------Visual readiness for reading------------------------------Dispensing and adjusting eyeware--------------------------Frame repairs---------------------------------------------Fabrication of eyeware-------’----------------------------Other-----------------------------------------------------
II I I I
Number
18,299
13,5102,178530
951171636183140
15,0832,806410
1,5783,7624,9892,7505,221
4,0866,8863,7191,7261,881
3,9606,6553,8833,801
9004,0757,3445,980
18,23813,78012,0981,5285,90716,92814,5219,1285,2257,4504,73517,12215,5326,610718
17,784
13,3422,082473
864149566175132
14,6952,711378
1,5553,7114,8812,6784,958
4,0406,7623,6011,6511,730
3,9606,6483,8293,347
8573,9317,1765,821
.7,731
.3,442S,7761,4625,681:6,462.4,0568,9305,1167,2414,635L6,700L5,1616,414680
418
146
:!
76215358
3227520
183987
2:;
3610392
lx
i
3%
1?:145128
414285264
1:?377370170
1%
3;230715829
61
132010
6
1:1
42136
2711
32
5
H
2:
6;
1;1621
58
:;8
;+59211123
::38227
37
977
6
;2
2477
36
10
1:
4
1?29
3;
1:
1;
351918
1232356
1:
3;25153
65

Table 24. Number and percent distribution of optometrists by number of contact lens technicians theyused to assist in Dractice. according to selected Professional characteristicsof the optometrist:United States, 196&Con. ‘
Selected professional characteristicsof optometrist
United States---------------------------------------
Principal form of employment
Self employed:Solo practice-------------------------------------------Partnership---------------------------------------------Group practice------------------------------------------
Employed by:Optometrists--------------------------------------------Ophthalmologistsor other physicians--------------------Profit-making firms-------------------------------------Nonprofit organizations (includinggovernment)----------
Other-----------------------------------------------------
Number of office locations
1 office--------------------------------------------------2 offices-------------------------------------------------3 offices or more-----------------------------------------
Number of patient visits per week
Less than 25 visits---------------------------------------25-49 visits----------------------------------------------50-74 visits----------------------------------------------75-99 visits----------------------------------------------100 visits or more----------------------------------------
Number of patients seen per week
Less than 25 patients-------------------------------------25-49 patients--------------------------------------------50-74 patients--------------------------------------------75-99 patients--------------------------------------------100 patients or more--------------------------------------
Number of supplementaryhelpers of all types
None ------------------------------------------------------1 assistant-----------------------------------------------2 assistants----------------------------------------------3 assistants or more--------------------------------------
Number of optometric services rendered
1-3 senices ----------------------------------------------4-6 se~ices ----------------------------------------------7-9 senices ----------------------------------------------10 services or more---------------------------------------
Type of optometric service
Refractions-----------------------------------------------Visual field examination----------------------------------Tonometry-------------------------------------------------Aniseikonic testing---------------------------------------Biomicroscopy---------------------------------------------Ophthalmoscopy--------------------------------------------Contact lens fitting--------------------------------------Vis7!~ltraining (orthoptics)------------------------------Developmental vision--------------------------------------Prescribing low vision aids-------------------------------Visual readiness for reading------------------------------Dispensing and adjusting eyeware--------------------------Frame repairs---------------------------------------------Fabrication of eyeware------------------------------------Other-----------------------------------------------------
Percent distribution
100.0
100.0100.0100.0
100.0100.0100.0100.0100.0
100.0100.0100.0
100.0100.0100.0100.0100.0
100.0100.0100.0100.0100.0
100.0100.0100.0100.0
100.0100.0100.0100.0
100.0100.0100.0100.O100.0100.0100.0100.0100.0100.0100.0100.0100.0100.0100.0
97.2
98.895.689.3
90.987.289.095.294.6
97.496.692.2
98.598.797.897.495.0
98.998.296.895.691.9
100.099.998.688.1
95.296.597.797.3
97.297.597.395.696.297.396.897.897.9‘97.297.997.597.697.094.6
2.3
1.1
::;
1:::8.32.95.4
2.1
::;
1.1
t?
::?
0.9
H
2::
o.i1.49.4
n2.02.1
2.32.12.23.63.1
M1.9
;::1.72.02.0
M
0.3
0.10.91.8
0.60.6
;::
0.30.51.4
0.10.2
%;0.7
0.10.2
M1.2
1.;
0.5
u0.4
%:
;:20.5
;::0.20.20.30.3
M0.30.9
0.2
0.10.31.2
0.6
l.i1,3.
R1.6
0.20.2
t:0.3
%1
;:!0.5
1.;
0.50.40.10.2
0.20.10.20.30.30.2
::;0.1
M0.20.2
;:;
66

Table 25. Number and percent distributionof optometrists by number of optical technicians (shopmen)they used to assist in practice, according to State: United state~. 196g
State
United States-----------------------------------------
Alabama------------------------------------------------------Alaska--.---------------------------------------------------Arizona------------------------------------------------------Arkansas--.-------------.-----------------------------------,California--------------------------------------------------,Colorado--------........-------------------------------.----,Connecticut---------------------------------.------------.--,Delaware-----------------------------------------------------District of Columbia-----------------------------------------Florida------------------.-----.------------.---------------.
Georgia------------------------------------------------------Hawaii-------------------------------------------------------Idaho--.--------.---------.-----------------.---------------.Illinois-----------------------------------------------------Indiana----------------------s-------------------------------Iowa--------.-----------------------------------------------.Kansas-------------------------------------------------------Kentucky-,-----------------------------------------------------Louisiana----------------------------------------------------Maine!--------------------------------------------------------
Maryland---.------.-----.-.-.----.--.-.--.--s--.-------------Massachusetts------------------------------------------------Michigan-----------------------------------------------------Minnesota----------------------------------------------------Mississippi--------------------------------------------------MLssourI------------.-----------------.-----.-.--.----.---m-.Montana-..--.--=.--.-.-.=...-.-.w.w..-----------.-----=------Nebraska-------------------------------------.----------------Nevada----------.----.-------------..-------.----.----.------New Hampshire------------------------------------------------
New Jersey---------------.-----------------------------------New I.lcxico----------------------------------------------------New York-----------------------.--------..-------------------North Carolina--.-------.-----.-------------s----------------North Dakota-------------------------------------------------Ohio----..--..--------.------.--------.----------.-----------Oklahoma........----------------.........-----------------.-.-Orugon-------------------------------------------------------Pennsylvania-------------------------------------------------RhocleIsland-------------------------------------------------
South Carolina-----------------------------------------------South Dakota-------------------------------------------------Tennessee----------------------------------------------------~s ........................................................
----------------------------------------------------------Vemont ------------------------------------------------------Virginia-...--.--------.------------..-------.-.-.-----------Washington..................................................-West Virginia................................................Wisconsin----------------------------------------------------Wyoming------------------------------------------------------
18,291
18(
1+:15:
2,22;18(25[3!
4;!
2616/
1,6~[50:
17471470835:12C431891553670
674
1,51$320
9;;245265
1,133132
155
2;;740
;:27235614742841
Number
16,82:
165
1::143
2,08916723534
4::
23564
1,4%456320226213200111
144689646338120390851473367
636
1,3!?302
8;;232246
1,066117
1$:
26566664
2::33414038141
24!
1
:
1:
c
4
226
i621
3131
9
;
12
5;3
1;239
11
2:4
;2
6
67

Table 25. Number and percent distribution of optometrists by number of optical technicians (shopmen)they used to assist in practice, according to State: United States, 1968-Con.
State
United States------------------------------------------
Alabama--------------------.---.-s-------------------------.=.Alzska-----------------------------------------=-------------Arizona------------------------------------------------------Arkansas-----------------------------------------------------California------.--------------------------------------m-----Colorado-----------------------------------------------------Connecticut--------------------------------------------------Delaware--------------------------------------.--------------District of Columbia-----------------------------------------Florida------------------------------------------------------
Georgia------------------------------------------------------Hawaii-------------------------------------------------------Idaho---------------------------------------------------------Illinois-----------------------------------------------------Indiana------------------------------------------------------Iowa----------------------------------------------------------tinsas-------------------------------------------------------Kentucky------------------------------------.----------------Louisiana-----------------------------=----------------------klaine--------------------------------------------------------
Maryland-----------------------------------------------------Massachusetts------------------------------------------------Michigan-----------------------------------------------------Minnesota----------------------------------------------------Mississippi-=-----------..--.---.------.--..---.-.-=---------Missouri-----------------------------------------------------Montana------------------------------------------------------Nebraska.....................................................Nevada-------------------------------------------------------New Hampehire------------------------------------------------
New Jer:ey ---------------------------------------------------NewMexzco. . . . . . . . . . . . . . . . . . . . . . . . . . . . . . . . . . . . . . . . . . . . . . . . . . .New ~ork . . . . . . . . . . . . . . . . . . . . . . . . . . . . . . . . . . . . . . . . . . . . . . . . . . . . .
North Carolina..............................................-North Dakota-------------------------------------------------Ohio---------------------------------------------------------Oklahom -----------------------------------------------------Oregon-------------------------------------------------------Pennsylvania-------------------------------------------------Rhode Island-------------------------------------------------
South Carolina-----------------------------------------------South Dakota-------------------------------------------------Tennessee----------------------------------------------------Texas----------------------------------------........--------Utah---------------------------------------------------------Vemont ------------------------------------------------------Virginia-----------------------------------------------------Washington----------------------------------------------------West Virginia------------------------------------------------Wisconsin----------------------------------------------------Wyoting------------------------------------------------------
Percent distribution
100.0
100.0100.0100.0100.0100.0100.0100.0100.0100.0100.0
100.0100.0100.0100.0100.0100.0100.0100.0100.0100.0
100.0100.0100.0100.0100.0100.0100.0100.0100.0100.0
100.0100.0100.0100.0100.0100.0100.0100.0100.0100.0
100.0100.0100.0100.0100.0100.0100.0100.0100.0100.0100.0
91.9
91.893.893.094.994.090.191.296.776.392.7
90.0100.098.792.090.695.298.693.090.496.3
82.596.591.295.8100.090.596.395.290.995.5
94.4.95.783.094.696.891.594.892.894.188.2
93.890.990.990.085.7100.089.593.695.089.1100.0
5.4
2::
::;
::?8.03.3
::;
8.4
4.;5.83.2
4.5
R
8.12.96.43.3
R4.89.1
3.84.40.73.73.24.94.46.04.31.8
4.86.85.86.06.4
8.i5.54.38.8
1.4
0.6
1.71.50.91.7
6.;0.7
1.6
1.41.3
0.;2.8
A::
;:;0.50.3
2.;
.3.0
1.8
3.;1.0
1.60.91.20.8
0.7
;:;
:::
2.;0.6
1.;
1.3
2.5-
1.;
0.8
1.;0.2
1.32.42.4
A::
5.6
;:52.00.6
2.;
.1.5
2.;0.7
2.i
0.;.
0.7
h:;
$::
O.i0.30,70.5
68

Table 26. Number and percent distribution of optometrists by number of optical technicians (shopmen)they used to assist in practice, according to geographic area and selected characteristicsof the op-tometrist:United States, 1968
Geographic area and selected characteristics ofoptometrists
United States----------------.-----------------.-----
Geographic region
Northeast --------------------------------------------------
~o;;~ Central-.----Q---------------------------------------------------------------------------------------------
west -------------------------------------------------------
Geographic division
New England------------------------------------------------Middle Atlantic--------------------------------------------East North Central-----------------------------------------West North Central-----------------------------------------South Atlmtic .........--------........---------------------East South Central-----------------------------.-----------West South Central-----------------------------------------Mountain---------------------------------------------------Pacific-----------------.----.------..------p--------------
Standard Federal Administrative Region
RegionRegionRegionRegicmRegionRegionRegionRegiooRegionRegion
-------------------- ---------- -------------------- -:I--------------------------------------------------111 -------- -------- --s----- -------- -----.--- --------IV - --- . - -- -- ---- .- .- . - -- -- -- -- . - ---- -. ---- --- --- -- --v . . . . . . . . -------- . . . . . . . . -------- -------- ---.---- ---vI--------------------------------------------------vII-------------------------------------------------vIII ------------------------------------------------Ix--------------------------------------------------X-------- -------- -------- -------- ---.---- -------- ---
Age of optometrist
Under 25 years ---------------------------------------------25-34 years---.-.-----------.-.-------------..--w----------35-44 years------------------------------------------------45-54 years------------------------------------------------55-64 years------------------------------------------------65-74 years------------------------------------------------75 years and over------------------------------------------
Sex of optometrist
Male -------------------------------------------------------Feule -----------------------------------------------------
Number of States licensed in
No States -------- -------- -------- -------- ----.--” ----------L State -------- -------- -------- -------- -------- -------- ----2 States ---------------------------------------------------3 States or lnore -------------------------------------------
Hours per week usually worked
1-34 hours -------------------- ---------- ---------- ---------35-39 huurs ------------------------------------------------40 hours ---------------------------------------------------41-44 hours -------------------------------------------------45-48 hours -------------------- ---------- ------------------49 hours or more -------- -------- -------- -------- -------- ---
18,29!
4,7215,83[4,10:3,63:
1,32;3,39~4,16[1,67(1,92!
82C1,35[
7052,924
1,3272,2611,8342,0454,5211,4291,151
5562,4L8
725
2,0;:5,4006,6322,6011,205
396
17,912387
2013,920
3,3551,005
2,1532,8974,2182,3303,4313,269
Number
L,6,825
4,2755,3813,7603,409
1,2563,0193,8051,5771,756
7631,242
6612,748
1,2561,9531,6821,9034,1431,3101,083
5132,303
681
1,8:?4,9976,1062,3751,090
370
.6,463362
2,8;:3,071
908
2,0482,7383,8492,0983,1272,966
981
304286231160
2::225
1::
2:
12:
60195103109236
ii329736
5
2::354158
E
9:;
72;199
58
76104232151202215
24; 245

Table 26. Number and percent distribution of optometrists by number of optical technicians (shopmen)they used to assist in practice, according to geographic area and selected characteristicsof the op-tometrist: United States, 1968—Con.
Geographic area and selected characteristics ofoptometrist
United states----------------------------------------
Geozrauhic re~ion
Northeast------------------------------------.-------------North Central----------------------------------------------South------------------------------------------------------West-------------------------------------------------------
Geographic division
New England----------------------- ---.--------------------Middle Atlantic--------------------------------------------East North Central-----------------------------------------West North Central -----------------------------------------South Atlantic---------------------------------------------East South Central-----------------------------------------West South Central-----------------------------------------Mou?tain---------------------------------------------------Pacific----------------------------------------------------
Standard Federal Administrative Region
Region I---------------------------------------------------Region II--------------------------------------------------Region III-------------------------------------------------Region IV--------------------------------------------------Region V---------------------------------------------------Region VI--------------------------------------------------Region VII---...--..------.-m---.----..--..------------.---Region VIII--------“----------.------------.---------------Region H --------------------------------------------------Region X----------------------------------------..---------
Age of optometrist
Under 25 years---------------------------------------------25-34 years------------------------------------------------35-44 years------------------------------------------------45-54 years------------------------------------------------55-64 years------------------------------------------------65-74 years------------------------------------------------75 years and over........-----------------........----------
Sex of optometrist
Male-.-.--.------.-------------.--.---------.---.-.--------Female-----------------------------------------------------
Number of States licensed in
No States--------------------------------------------------1 State-------------..,---------.,----------------------------2 States---------------------------------------------------3 States or mre-------------------------------------------
Hours per week usually worked
1-34 hours----------------........-------------------------35-39 hours-.....-.........--------------------------------40 hours----------------------------------------------------41-44 hours------------------------------------------------45-48 hours------------------------------------------------49 hours or more-------------------------------------------
Totalptometrists
Number of opticaltechnicians (shopmen)
I I I
None 1 I 2 I 3 ormore
II I I I
Percent distribution
100.0
100.0100.0100.0100.0
100.0100.0100.0100.0100.0100.0100.0100.0100.0
100.0100.0100.0100.0100.0100.0100.0100.0100.0100.0
100.0100.0100.0100.0100.0100.0100.0
100.0100.0
100.0100.0100.0100.0
100.0100.0100.0100.0100.0100.0
91.9
90.692.291.693.8
94.789.091.394.491.093.091.593.294.0
94.786.491.792.991.691.794.192.394.193.9
87.791.492.592.191.390.593.7
91.993.5
94.292.291.590.4
95.194.591.390.091.190.7
5.4 1.4 1.3
1.31.81.20.8
0.51.62.11.2
::;1.60.5O.Y
0.52.0
;:;1.91.51.40.6
;::
1.81.9
::;
:::.
1.32.0
;::1.21.4
0.91.01.51.5
::;
70
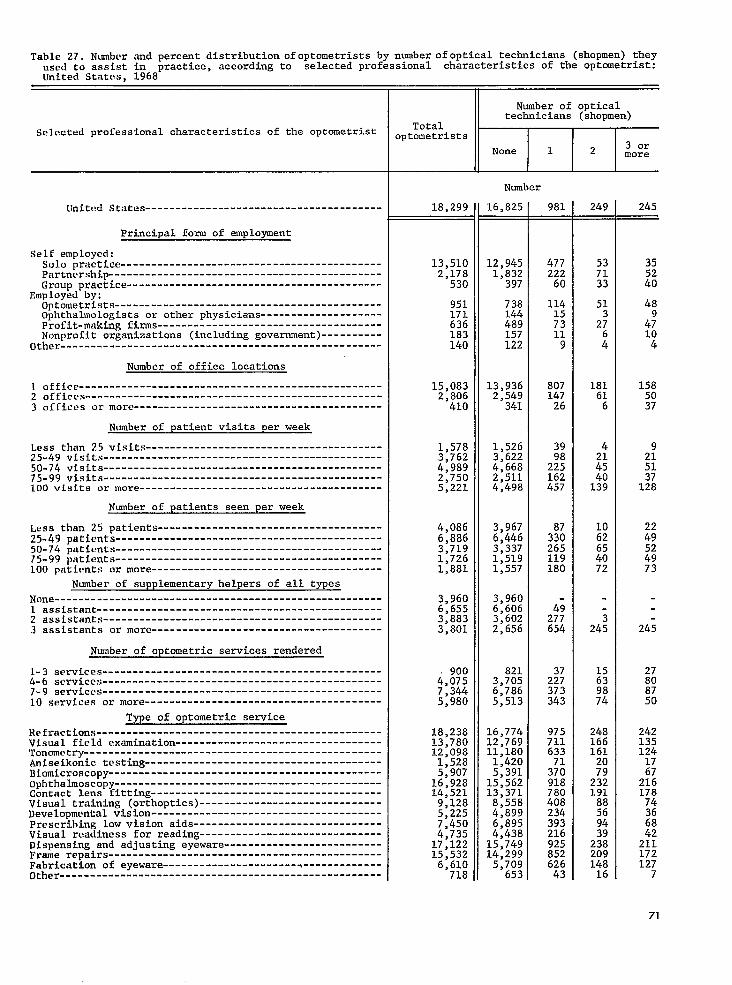
Table 27. Number and percent distributionofoptometrists by number ofoptical technicians (shopmen) theyused to assist in practice, according to selected professional characteristicsof the optometrist:United States, 1968
Selected professional characteristicsof the optometrist
LInitedStates--------------------------------------.
Principal form of employment
Self employed:Solo practice-------------------------------------------Partnership---------------------------------------------Group practice------------------------------------------
Employed by:Optometrists--------------------------------------------Ophthalmologistsor other physicians--------------------Profit-making firms-------------------------------------Nonprofit organizations (includinggovernment)----------
Other-----------------------------------------------------
Number of office locations
1 Office--------------------------------------------------2 offices-------------------------------------------------3 offices or more-----------------------------------------
Number of patient visits per week
Less than 25 visits---------------------------------------25-49 visits----------------------------------------------50-74 visits----------------------------------------------75-99 visits----------------------------------------------100 visits or more----------------------------------------
Number of patients seen per week
Less than 25 patients-------------------------------------25-49 patients--------------------------------------------50-74 patients--------------------------------------------75-99 patients--------------------------------------------100 patients or more--------------------------------------
Number of supplementaryhelpers of all types
None------------------------------------------------------1 assistant-----------------------------------------------2 assistants----------------------------------------------3 assistants or more--------------------------------------
Number of optometric services rendered
1-3 semices ----------------------------------------------4-6 services----------------------------------------------7-9 services----------------------------------------------10 services or more---------------------------------------
Tvoe of optometric service
Refractims -----------------------------------------------Visual field examination----------------------------------Tonometry-------------------------------------------------Aniseikonic testing---------------------------------------Biomicroscopy---------------------------------------------ophthahoscopy --------------------------------------------Contact lens fitting--------------------------------------Visual training (orthoptics)------------------------------Developmental vision--------------------------------------Prescribing low vision aids-------------------------------Visual readiness for reading------------------------------Dispensing and adjusting eyeware--------------------------Frame repairs---------------------------------------------Fabrication of eyeware------------------------------------Other-----------------------------------------------------
18,299
13,5102,178530
951171636183140
1;,());
’41O
1,5783,7624,9892,7505,221
4,0866,8863,7191,7261,881
3,9606,6553,8833,801
9004,0757,3445,980
18,23813,78012,0981,5285,90716,92814,5219,1285,2257,4504,73517,12215,5326,610718
Number
16,82!
12,9451,832397
738144489157122
13,9362,549341
1,5263,6224,6682,5114,498
3,9676,4463,3371,5191,557
3,9606,6063,6022,656
8213,7056,7865,513
16,77412,76911,1801,4205,39115,56213,3718,5584,8996,8954,43815,74914,2995,709653
981
47722260
114
E119
80714726
39
2%162457
3!;265119180
2%654
2;;373343
975711633
3;:91878040823439321692585262643
249
537133
51
2;
:
181616
4
::
1%
1062
::72
i245
1563
X
248166161
%232191
%9439
23820914816
245
35
%
48
4?104
1585037
2?51
l;i
z
2;73
24;
27808750
24213512417
2!217874
%
2;?1721277
71

Table 27. Number and percent distributionofoptometrists by number ofoptical technicians (shopmen) theyused to assist in practice, according to selected professional characteristicsUnited States, 1968—Con.
of the optometrist:
Selected professional characteristicsof the optometrist
United States---------------------------------------
Principal form of employment
Self employed:Solo practice-------------------------------------------Partnership---------------------------------------------Group practice------------------------------------------
Employed by:Optometrists--------------------------------------------Ophthalmologistsor other physicians--------------------Profit-making firms-------------------------------------Nonprofit organizations (includinggovernment)----------
Other-----------------------------------------------------
Number of office locations
1 office--------------------------------------------------2 offices-------------------------------------------------3 offices or more-----------------------------------------
Number of Datient visits uer week
Less than 25 visits---------------------------------------25-49 visits----------------------------------------------50-74 visits----------------------------------------------75-99 visits----------------------------------------------100 visits or more----------------------------------------
Number of patients seen per week
Less than 25 patients-------------------------------------25-49 patients--------------------------------------------50-74 patients--------------------------------------------75-99 patients--------------------------------------------100 patients or more--------------------------------------
Number of supplementaryhelpers of all types
None------------------------------------------------------1 assistant-----------------------------------------------2 assistants----------------------------------------------3 assistants or more--------------------------------------
Number of optometric services rendered
1-3 semices ----------------------------------------------4-6 services----------------------------------------------7-9 services----------------------------------------------10 senices or more---------------------------------------
Type of optometric service
Refractions-----------------------------------------------Visual field examination----------------------------------TonOmetry--------------------------------------------------iseikonic testing---------------------------------------Biomlcroscopy---------------------------------------------Ophthalmoscopy--------------------------------------------Contact lens fitting--------------------------------------Visual training (orthoptics)------------------------------Developmentalvision--------------------------------------Prescribing low vision aids-------------------------------Visual readiness for reading------------------------------Dispensing and adjusting eyeware--------------------------Frame repairs---------------------------------------------Fabrication of eyeware------------------------------------Other-----------------------------------------------------
Totaloptometrists
100.0
100.0100.0100.0
100.0100,0100.0100.0100.0
100.0100.0100.0
100.0100.0100.0100.0100.0
100.0100.0100.0100.0100.0
100.0100.0100.0100.0
100.0100.0100.0100.0
100.0100.0100.0100.0100.0100.0100.0100.0100.0100.0100.0100.0100.0100.0100.0
I None I 1 I 2 I 3 ormore
Number
95.884.274.9
77.684.176.985.687.4
92.490.883.1
96.796.393.691.386.2
97.193.689.788.082.7
100.099.392.869.9
91.390.992.492.2
92.092.792.492.991.391.992.193.893.892.693.792.092.186.490.9
5.4
3.510.211.4
12.08.911.56.16.3
5.45.26.4
2.5
;:;
:::
:::7.16.99.6
0.;
1;:;
4.2
H5.7
5.45.2
::;6.35.4
i::4.5
::25.45.59.55.9
1.4
0.4
2:;
;::4.33.03.1
H1.6
0.30.60.91.52.7
0.20.9
H3.8
0.;6.5
1.61.51.31.2
1.41.21.31.31.41.4
M1.1
:::
M2.22.3
1.3
0.32.47.5
H7.4
::;
M8.9
0.60.61.0
;:;
0.50.7
;::3.9
6.;
H
M
M
::?1.11.3
M0.70,90.91,21.1
::;
72

APPENDIX 1
TECHNICAL NOTES
Background of Report
t%e data presented in this report were collected as
part of the lWM-69 Vision and Eye Care ManpowerSurvc,y. The survey, conducted by the U.S. Bureau of theLlmsus under concract to the then Division of Health Re-sources Statistics, National Center for Health Statistics
(NCHS), was designed to obtain information about thed~vnographic find professional characteristics of op-tomcv rists cmg+ysd in providing direct health care tothe public.
Survey Coverage
[’IILS tCItLII llllnlb~r of optometrists for purposes of
this survey was defined as all legally registered persons
liccms~,d to pructice optometry in any of the 50 Statesand the District of Columbia, The most complete andI_LY~di]\] available list of these persons was The BlueBook “of”Optometvists,l which provided the names andaddresses of licensed optometrists in each State andthe’ District of Columbia, This list of 20,565 names and.~ddrcsses became the original mailing list for thesurvey.
A pretest of the questionnaire used for the op-tomutristst survey was conducted during the periodMay-.[uly 1%/3. Questionnaires were mailed to twooptometrists in each State and the District of Columbia.After an initiol mailout, one mail followup, and a tele-
plmnu follcmwp a response rate of 91 percent wasachieved. The quest ionnaire proved CO be an effectiveinstrument. Only minor alterations were required forthe final questionnaire. (See appendix 111for a copy of
the final questionnaire.)
Data Collection and Processing
The collect ion of data for the 1968 Manpower Surveywas accomplished under contract with the U.S. Bureauof the Census. This agency was responsible for mailing
the questionnaires, receipt and control procedures,coding the completed questionnaires in accordance withspecifications ‘established by NCHS,
I ~ylc,~[llc+BL,,,~ ~j” optonietrk~$: 1968.Press Inc., 1968),
and for followup
Chicago. (thofessiond
whenever incomplete or inadequate questionnaires werereturned or whenever a questionnaire was not returned.
For the actual survey, three mailouts were em-
ployed in an attempt to elicit a response, the first twoby first-class mail, the last by certified mail. All threemailings were made in every case in which a return wasnot received.
Telephone contacts and personal interviews werealso used. They were employed in cases of nonresponseor refusal as well as in cases of questionnaires that hadbeen only partially completed.
A preliminary edit of the data was undertaken at
the time of the return of the survey questionnaires. Thiswas done to insure completeness of the responses. Thedata from the questionnaires were coded, punched oncards, transferred to computer tape, and sent to NCHS
for processing. Processing included an elaborate seriesof checks and cross-checks to confirm the accuracy ofresponses, to correct coding and punching errors thatoccurred, and also to insure consistency between re-lated items.
Response to the Survey
A total of 20,565 optometrists were provided bythe original mailing list for the survey; 262 duplicatenames and military personnel were eliminated. Militarypersonnel were eliminated because some were in-accessible. The data provided in this report are forcivilian optometrists in the 50 States and the Districtof Columbia, This amounted to 20,303 optometrists, or98.7 percent of the original list.
A total of 18,533, or 91.2 percent of the 20,303,responded to the survey with usable questionnaires. The
remainder was composed of 699 nonrespondents (i.e,reasons unknown); 533 postmaster returns (i.e, unableto locate); 308 deceased; and 230 refusals.
Of these 18,533 usable questionnaires (good re-
sponses), 16,835, or 90.8 percent, were active op-tometrists, while 1,698 reported that they were eitherretired or not currently engaged in optometricalactivities although not retired (table I). There is evi-dence to indicate that the responses from active op-tometrists were better than those from inactive op-tometrists.
73

Table 1. Number and percent distribution of respondents to the questionnaire by question numberand content, according to activity status: United States, 1968 ~
Question number and content
All respondents ------------------------------------------------
Total ------------------------------------------------------------
1::
16a.
In what year wer% you born?------------------------------------Sex?--------------------------------------.--------------------From which school of optometry did you graduate?---------------When did you graduate?-----------------------------------------What degrees have you earned?----------------------------------In which States do you currently hold an active license topractice optometry?------------------------------------------
Are you currently active in optometry?-------------------------Which categories best describe your principal form of
emplo~ent? --------------------------------------------------How mqny weeks per year do you usually practice optometry?-----How many hours per week do you usually practice optometry?-----Approximately what percent of the hours per week do you usually
spend in optometric practice?--------------------------------In your optometric pracrice, approximately how manypatient visits for all purposes do you have during a typicalweek?--------------------------------------------------------
16b. Approximately how many patients does this represent?-----------18. In your optometric practice do you have supplementary personnel
to assist you?-----------------------------------------------
All Inactive
active respondents, ~respondents retired and
not retired
Number
16,835I 1,698
Percent distribution
100.0
99.697:999.198.797.5
98.6100.0
99.699.099.0
98.8
92.088.4
98.4
100.0
82.581.178.175.672.4
74.1100.0
...
...
...
..*
...
...
...
Item Response
A response to the survey does not necessarilyinsure adequate answers to all of the questions on thequestionnaire. In fact, a response to a single question
is considered a response to the survey. This sectionwill be concerned with the nonresponses to individualquestions on the questionnaire, i.e., item nonresponse.The previous section discussed nonresponses to thesurvey as a whole, i.e., unit nonresponses. This dis-cussion will involve only the 18,533 good unit responsesbecause interest here concerns the variability ofre-sponses to different questions. Table I presents the
distribution of responses to selected questions on thequestionnaire. Selection of the questions was basedontheir relevance to this report.
One can hardly avoid noticing the differences in
the pe” entages of responses to the individual questionsbetwe~,l the active and inactive respondents. At least17 T-rcent more active respondents answered everyque. .on(among those asked ofboth active and inactive
optcmetriscs) than did inactive respondents. Basedonthis finding, it is not unrealistic to suspect that a similarsituation prevailed in terms of responses to the question-
74
naire generally. A larger shareoftheunitnonresponseswere probably attributable to inactive persons than tothose who were active.
Imputation for Unknowns
As a matter of policy, tables in this publication
are presented with item nonresponses imputed. Theallocation of the item nonresponses was done by com-puter, utilizing two principles: first, random assign-ment; and second, utilization of related information as
category controls to insure consistencyammtgdifferentrelated items within the same record.
Assignment of values to replace item nonresponseis done on a random basis to prevent bias. The valueused to replace an item nonresponse israndomly se-Iected from within a range of values prescribed byrelated information from the record containing theitem nonresponse. Establishment of arange of valuesis necessary to insure that the value used to replace the
item nonresponse will not be inconsistent with othervalues within the record in which the value is beingplaced.

An txarnple may clarify the procedures. Mr. Blank
is 4S yL’ars of age. His year at graduation is not known.It must be imputed. Age and year at graduation arerclitt~,d itums. In this case, Mr. Blank’s age will beused ds a category control to choose an appropriater~wwd from which a year at graduation will be selected.13Ym~wxs of a random selection process, hlr. Given’srL’cord is chosen because his age was 49. The age cate-gory in this case could have been 48-50 .- Thus Mr.13LInk*s LInd Mr. Givents ages were both in the sameC.ltL’gOr}r. Mr. Given’s year at graduation was listed as]OJZ, The year 1942 is then copied into Mr. Blank’s
r~word as his year at graduation and will be counted in
all labuldtions as if it were the actual year Mr. Blankhad provided on his questionnaire.
State and National Estimates
I“IIL,statistics presented in this report were inflated1[1:Illuw t’or unit nonresponses, i.e., for entire question-
naires that were not available. This “inflation” factor
was the ratio of total optometrists to the number of
usable (good) responses obtained. Within each State thenumber of optometrists was divided by the number ofgood responses to obtain the increment needed to adjustthe statistics for the nonresponses. The incrementmultiplied by the number of respondents provided theinflated number of civilian optometrists (20,301). Table11presents the number of respondents to the optometrymanpower survey, the ratio weights, and the inflatednumbers of active optometrists for each State.
Rounding
Numbers that appear in the present report wereindependently rounded and may not add to totals. Per-cents were also independently rounded and may not al-ways add to 100 percent. Percents and rates werecalculated on the basis of original, unrounded figuresand will not necessarily agree with rates and percentswhich might be calculated from rounded data.
75
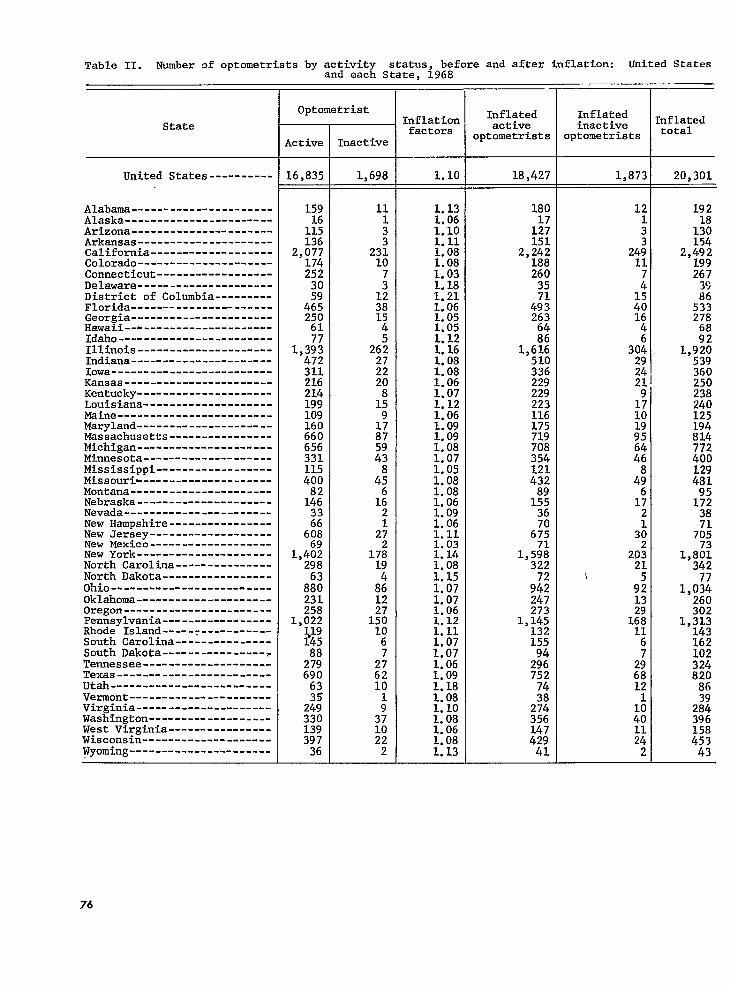
Table II. Number of optometrists by activity status, before and after inflation: United States
State
United States ----------
Alabama ----------------------Alaska -----------------------Arizona ----------------------Arkansas ---------------------California -------------------Colorado---------------------Connecticut ------------------Delaware ---------------------District of Columbia ---------Florida----------------------Georgia----------------------Hawaii -----------------------Idaho------------------------Illinois---------------------Indiana----------------------Iowa-------------------------Kansas-----------------------Kentucky---------------------Louisiana--------------------Maine ------------------------Maryland ---------------------Massachusetts ----------------Michigan ---------------------Minnesota --------------------Mississippi ------------------Missouri---------------------Montana ----------------------Nebraska ---------------------Nevada -----------------------New Hampshire ----------------New Jersey-------------------New Mexico -------------------New York ---------------------North Carolina ---------------North Dakota -----------------Ohio -------------------------Oklahoma ---------------------Oregon -----------------------Pennsylvania -----------------Rhode Island-----?-----------South Carolina ---------------South Dakota -----------------Tennessee --------------------Texas ------------------------Utah -------------------------Vermont ----------------------Virginia ---------------------Washington -------------------West Virginia ----------------Wisconsin --------------------~yoming ----------------------
and each State, 1968
Optometrist
Active
16,835
159
1;:136
2,077174252
%46525061
1,3;;472311216214199109160660656331115400
1%
2:608
1,4%298
8%231258
1,022~g
2%6:;
3524933013939736
Inactive
1,698
Inflationfactors
1.10
1.131,061.101.111:081.081.031.181.211.061.051.051.121;161.081.081.061.071.121.061.091.091.081.0710051.081.081.061.091.061.111.031.141.081.151.071.071.061.121.111.071.071.061.091.181.081.101.081.061.081.13
Inflatedactive
optometrists
18,427
180
1;;151
2,24218826035
4;;2636486
1,616510336229229223116175719708354121432
1%36
6;:
1,5;2322
;g
2731,145
1321559429675274
2%35614742941
Inflatedinactive
optometrists
1,873
24;1174
304292421
1;10
4!6172
3;
20;21
\9:
;;168116
Inflatedtotal
20,301
192
1%154
2,49;
26739
5X278
;;1,;;;
360250238;::
194814772;;;
481
1%38
7;:
1,8;?342
1,0;:260302
1,31314316210232482086
2;;396158453
43
76
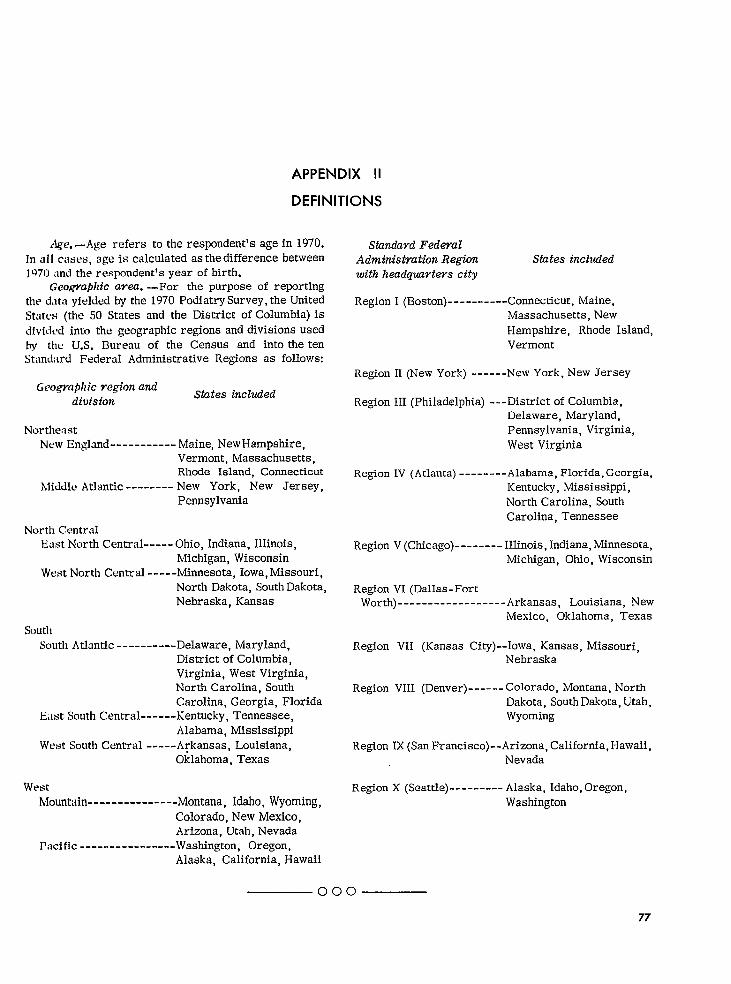
APPENDIX II
DEFINITIONS
&e. -Age refers to the respondent’s age in 1970.In all cases, age is calculated as the difference betweenIC)7[Iand the respondent’s year of birth.
Geogva@ic area. —For the purpose of reportingthe data yielded by the 1970 Podiatry Survey, the UnitedStates (the 50 States and the District of Columbia) isdivided into the geographic regions and divisions usedby thu U.S. Bureau of the Census and into the tenStandard Federal Administrative Regions aa follows:
Geographic re@”onanddivision
States included
NortheastNew England ----------- Maine, NewHampshire,
Vermont, Massachusetts,Rhode Island, Connecticut
Llkidle Atlantic -------- New York, New Jersey,Pennsylvania
North CentralEast North Central ----- Ohio, Indiana, Illinois,
Michigan, WisconsinWest North Central -----Minnesota, Iowa, Missouri,
North Dakota, South Dakota,Nebraska, Kansas
SouthSouth Atlantic ----------Delaware, Maryland,
District of Columbia,Virginia, West Virginia,North Carolina, SouthCarolina, Georgia, Florida
East South Central ------ Kentucky, Tennessee,Alabama, Mississippi
West South Central -----Arkansas, Louisiana,Oklahoma, Texas
westMountain --.------------Montana, Idaho, Wyoming,
Colorado, New Mexico,Arizona, Utah, Nevada
Pacific ----------------Washington, Oregon,Alaska, California, Hawaii
Standavd Fed@’alAdminist?’ation Re@”on States includedwith headquarters city
Region I (Boston) ----------Connecticut, Maine,Massachusetts, NewHampahire, Rhode Island,Vermont
Region II (New York) ------New York, New Jersey
Region III (Philadelphia) ---District of Columbia,Delaware, Maryland,Pennsylvania, Virginia,West Virginia
Region IV (Atlanta) --------Alabama, Florida, Georgia,Kentucky, Mississippi,North Carolina, SouthCarolina, Tennessee
Region V (Chicago) -------- Illinois, Indiana, Minnesota,Michigan, Ohio, Wisconsin
Region VI (Dallas-FortWorth) -- ----------------Arkansas, Louisiana, New
Mexico, Oklahoma, Texas
Region VII (Kansas City) --Iowa, Kansas, Missouri,Nebraska
Region VIII (Denver) ------ Colorado, Montana, NorthDakota, South Dakota, Utah,Wyoming
Region IX (San Francisco) --Arizona, California, Hawaii,Nevada
Region X (Seattle) --------- Alaska, Idaho, Oregon,Washington
000
77

APPENDIX IllSURVEY QUESTIONNAIRE
PHS-T407-3REV. 8-68
U.S. DEPARTMENT OF COMMERCE
BUREAU OF THE CENSUS
ACTING AS COLLECTING AGENT FOR THE
U.S. PUBLIC HEALTH SERVICE
CONFIDEN’HAL: All information which permitsthe identification of the individual will be heldstrictly confidential, will be used scdely bypersons engaged in, and only for the purposes ofthe survey and will not be disclosed at releasedto ocher persons or for any other purpose.
SURVEY OF OPTOMETRISTS
Form Approve dBudget Bureau No. 68-s68028
I. Is your name correct, and is the address abave yaur PRIMARY PLACE OF PRACTICE?
t n Yes ZDNO
IIf no, please enter the correct information below
Name:Frrst ,Jfzddle Lu. I
Primary place of practice:Number Sfrc.v
City Sfalc Zrp Cod,
2. In what year were you born?( )’ear)
3. Where were you born?(State or foreign country)
4. Are yau a citizen af the United States? (Please check appropriate box)
t u Yes, Native Bom
z ❑ Yes, Naturalized
3mNo
5. Sex I ❑ Male
z ❑ Female
6. A. From which schoal af optometry did you graduate?
Name of School
City State or Ceuntry
78
B. When did yau graduate?(Year graduated)
PAGE 1
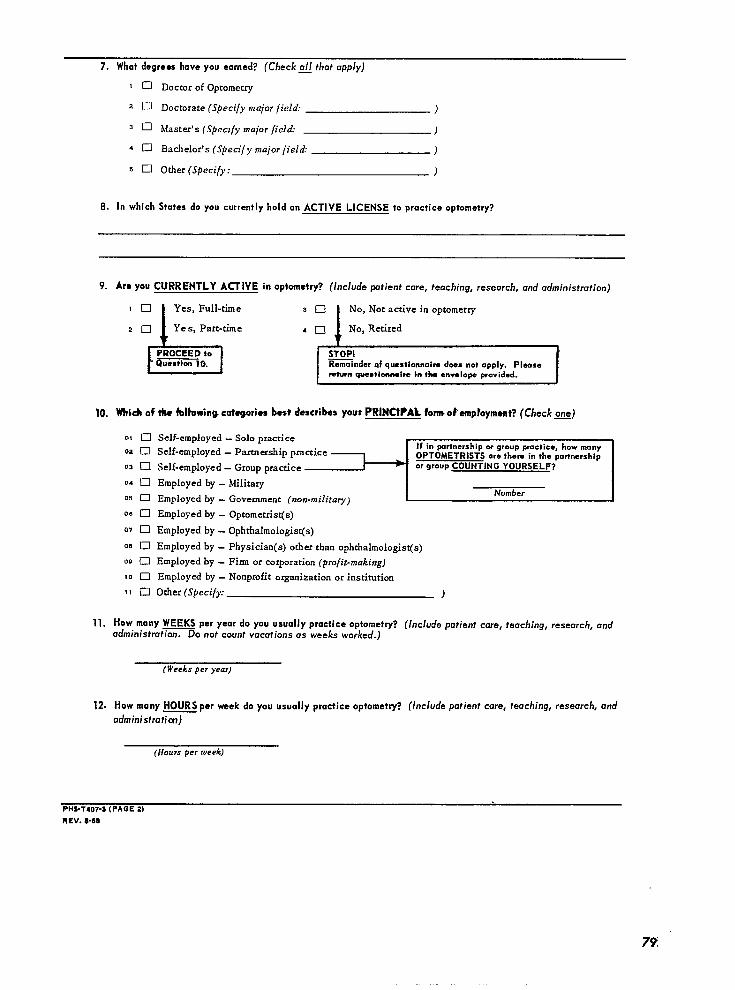
7. What degrees have you earned? (Check all that apply)—
I ❑ Dactor of Optometry
z a Doctarate (Sfreci/y major field: )
3 ❑ Master’s (SpecI/y major jield: )
4 ❑ Bachelor’s (Speci/y major field )
5 •l Other (Speci/},: )
8. In which States do you currently hold an ACTIVE LICENSE to practice optometry?
9.
10.
11,
12.
Aro you CURRENTLY ACTIVE in optometry? (/nc/ude patient care, teaching, research, and administration}
JU
LYes, Full-time 3
20 Yes, Part-time 4
PROCEED tO
GGiao. ‘e=nder af qusstiorumire does not apply. Pleasemtwn qaemtimire im k enmlops ~ovided.
Which of the followin~ cutegoriee best describes your PRINC?PAL tom otemptoym~t? (Check ~)
oI U Self- emplayed - Solo practiceIf in partnership m group practice, how mony
oa •l Self-employed - Parra ership practice OPTOMETRISTS are them in the partnership
os ❑ Self-emplayed - Group practice or group COUNTING YOURSELF?
ad ❑ Employed by - Military
os 0 Employed by - Government (non-military)Number
DO U Emplayed by - Optometrist(s)
w ❑ Employed by - Ophthalmologist(s)
os •l Emplayed by - Physician(s) other tbsn aphthalmologist(s)
Oa 0 Employed by - Firm or corporation (profit-making)
Io 0 Employed by - Nonprofit organization or iasritution
11 ❑ Other (Speci/y: )
How many WEEKS per year do you usually practice optometry? (Include patient care, teaching, research, andadministrat7&750 not count vacations as weeks warked.)
(Weeks per year)
How many HOURS per week da you usually practice optometry?
administratictr)
(Hours per week)
(Include patient care, teaching, research, and
PHS-T407-3 (PAGE 2)
REV. 6-66
79:
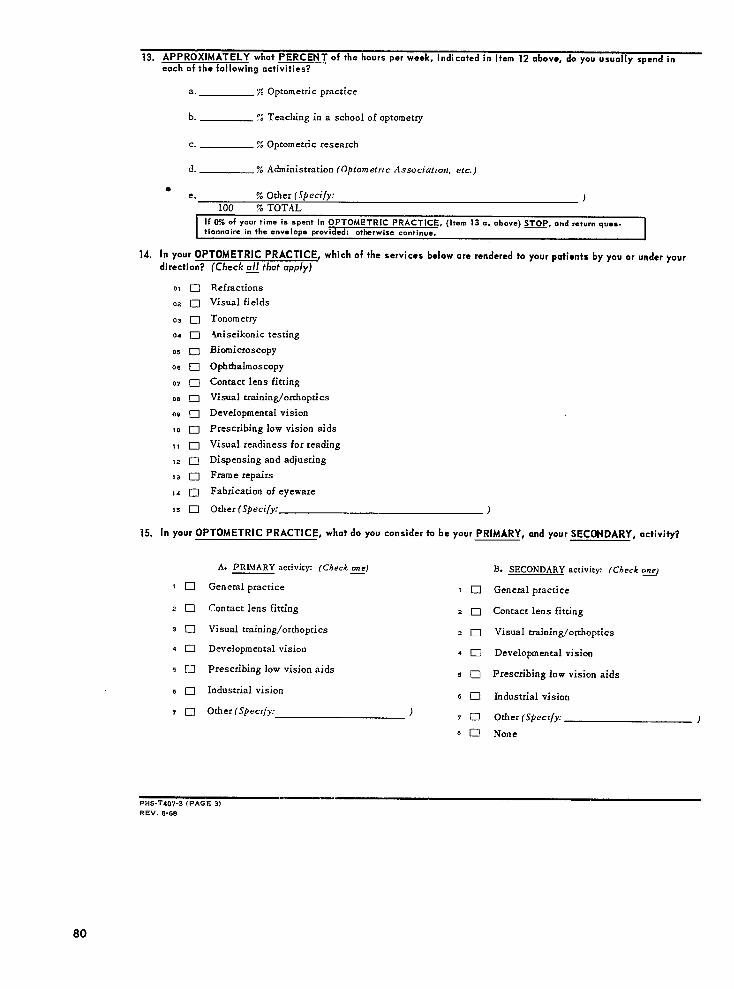
13. APPROXIMATELY what PERCENT of the hours per week, indicated in Item 12 above, do you usually spend in
each of the following activities?
a. Z Optometric practice
b. % Teaching in a school of optometry
c. % Optometric research
d. % Administration (Optom etrzc A.ssociatzon, etc. )
●e. % Orber (.Spea”/y: )
100 % TOTAL
If O% of your time is spent in OPTOMETRIC PRACTICE, (Item 13 a. above) -P, and return ques-
tionnaire i“ the envelope provided: otherwise continue.
14. In your OPTOMETRIC PRACTICE, which of the services below are rendered to your patients by you or under your
direction? (Check M that apply)
01 n02 ❑
03 ❑
04 n
05 n
06 ❑
07 a
08 n
09 ❑
10 n
11 n
12 0
13 ❑
14 ❑
15 n
Refractions
Visual fields
Tonometry
Ani seikonic testing
Biomicroscopy
Ophthalmoscopy
Contact lens fitting
Visual training/orrhoptics
Developmental vision
Prescribing low vision aids
Visual readiness for reading
Dispensing and adjusting
Frame repairs
Fabrication of eyeware
Other (Speci/y: )
15. In your OPTOMETRIC PRACTICE, what do you consider to be your PRIMARY, and your SECONDARY, activity?
A. PRLMARY activity (Check one)—
General practice
Contact lens fitting
Visual training/OrrbOpti cs
Developmental vision
Prescribing low vision aids
Industrial vision
Other (Sp.cz/y: )
B. SECONDARY acrivity (Check ~
Germ-al practice
Contact lens fitting
Visual training/orthaptics
Developmental vision
Prescribing low vision aids
Industrial vision
Other (SpecZ/y: )
None
PHS-T407-3 (PAGE 3)
REV. S-68
80

16. A. In your OPTOMETRIC PRACTICE, APPROXIMATELY how many patient V- fo~all purpases do you hoveduring a typical week?
(Apbmvimatc number 0/ wsits)
B. APPROXIMATELY how many PATIENTS does this represent? (Patients with multiple visits should be counted
anly on cc)
(Appm wmate number of pafisrrts)
17, What is the total number of affice Iacations
(Nurn her 0/ locations)
at which you currently practice optometry?
18. In yaur PRINCIPAL FORM OF EMPLOYMENT, indicated in Item 10 above, do you have supplementary personnelto assist you?
in+
Yes 20N0
Please indicate the NUMBER in each category be/ow far ALL affices combined which are related to your
principal form of emps
(Pers ans who spend less than 75% of their time in any one category below shouid be counted in category b,
general aptarnetric assistant) —
a.
b.
c.
d.
e.
f.
&
NUh{ BER WHO WORK FULL-TIh4E NUMBER WHO WORK PART-TIMi
(3> ho. m or mow per week) (Less !han 3> hours per week)
FOR YOU F:&Y:;;;: FOR YOU FOR YOU AND
ALONE ALONE Associates
Secrutuies, Receptionists . . . . . . . . . . — . . . ..-. . . . . . . . . . .
General optometric assistants . . . . . . . . —. . . . . . . . . . . . . . . . .
Optometric techaiciarss . . . . . . . . . . . . — . . . . . . . . . . . . . . . . .
Dispensing opticians . . . . . . . . . . . . . . . . . . . . . . . . . . . . . .
Contact lens technicians . . . . . . . . . . . . . . . . . . . . . . . . . . . .
Optical technicians (Skopmerr). . . . . . . . — . . . . . . . . . . . . . . . . .
Other ( $prc I/y. ) . . . . . . . . . . . . . . . . . . . . . . . .
19. A. If YOU have made entries under FOR YOU AND ASSOC ATESI in the full-time ar part-time columns in Item 18 abavehow many associates, COUNTING YOURSELF, share these persannel?
(Nurnbcr o/ associates)
B. Of thsse associates, how many are OPTOMETRISTS, COUNTING YOURSELF?
( Nrnnber of optometrists)
COMMENTS . General comments are invited as well as comments on specific item=
~.--–PLEASE RETURN QUESTIONNAIRE IN THE STAMPED ENVELOPE PROVIDED. I
PHS-T407-3 [PAGE 4)
REv. (6-68
—-
000
81
VITAL AND HEALTH STATISTICS PUBLICATION SERIES
Originally Public Health Service Publication No. 1000
Series 1. PYogvams and collection pvoceduves. — Reports which describe the general programs of the NationalCenter for Health Statistics and its offices and divisions, data collection methods used, definitions,and other material necessary for understanding the data.
Series 2. Data evaluation and methods Yesearch, —Studies of new statistical methodology including: experi-mental tests of new survey methods, studies of vital statistics collection methods, new analyticaltechniques, objective evaluations of reliability of collected data, contributions to statistical theory.
Series 3, Analytical studies. —Reports presenting analytical or interpretive studies based on vital and healthstatistics, carrying the analysis further than the expository types of reports in the other series.
SeYies 4. Documents and committee veports.— Final reports of major committees concerned with vital andhealth statistics, and documents such as recommended model vital registration laws and revisedbirth and death certificates.
Stwks 10. Data from the Health Interview Survev. —Statistics on illness, accidental injuries, disability, useof hospital, medical, dental, and other services, and other health-related topics, based on datacollected in a continuing national household interview survey.
Suries 11. Data from the Health Examination Sumey. —Data from direct examination, testing, and measure-ment of national samples of the civilian, noninstitutional population provide the basis for two typesof reports: (1) estimates of the medically defined prevalence of specific diseases in the UrdtedStates and the distributions of the population with respect to physical, physiological, and psycho-logical characteristics; and (2) analysis of relationships among the various measurements withoutreference to an explicit finite universe of persons.
$kvim L?. Da h fvom the 1%$titutional Population Sumeys — Statistics relating to the health characteristics ofpersons in institutions, and their medical, nursing, and personal care received, based on nationalsamples of establishments providing these services and samples of the residents or patients.
S~Yi~’s 13. Data from the Hospital DiscJzaYge Survey. —Statistics relating to di scharged patients in short-stayhospitals, based on a sample of patient records in a national sample of hospitals.
JWvirs 14. Data on health resources: manpowe~ and facilities. —Statistics on the numbers, geographic cfistri -Ix.ttion, and characteristics of health resources including physicians, dentists, nurses, other healthoccupations, hospitals, nursing homes, and outpatient facilities.
Srri4:s 20, Datu on mortality. — Various statistics on mortality other rhan as included in regular annual ormonthly reports —special analyses by cause of death, age, and other demographic variables, a!so
geographic and time series analyses.
Scvim 21, Data on natality, mamia~e, and divorce. —Various statistics on na[ality, marriage, and diwm ceother than as included in regular annual or monthly reports+ pecial analyses by demographicvariables, also geographic and time series analyses, studies of fertility.
SC:YZ,IS22, Dati from the A’atiortal Natality and Mortality Surveys, — Statistics on characteristics of birthsand deaths not available from the vital records, based on sample surveys stemming horn theserecords, including such topics as mortality by socioeconomic class, hcqit~l experience in thelast year of life, medical care during pregnancy, health insurance coverage, etc.
Fur :1 list of titles of reports published in these series, write m: Office of InformationNat ~onal C~nt~r i.jr }iedltn Mat Et IC5
Public 1Iealth Service, HSP.lHARockville, PId. 213852
