option one title here
TRANSCRIPT
FINANCIAL INCLUSION AND ECONOMIC SECURITY
PANEL
1
2017 Launch and Symposia
October 12, 2017

Content
2
Digital Platforms Towards Financial Inclusion for All: Hype
or reality?
Billy Jack, Georgetown University, MPESA
Demonetization and implications for digital financial
services in India
Misha Sharma, Institute for Financial Management and
Research, India
Measuring Financial Inclusion Around the World
Dorothe Singer, World Bank
Moderator: Rani Deshpande, Save the Children

Why does digital financial inclusion matter?Kenya’s mobile money revolution
William Jack
Financial Inclusion and Economic Security
Launch of Global Social Development Innovations
October 12th, 2017 University of North Carolina
Documenting the economic impacts of digital financial inclusion in Kenya

• According to the Global Findex:*
“Financial inclusion is critical in reducing poverty and achieving inclusive economic growth. When people can participate in the financial system, they are better able to start and expand businesses, invest in their children’s education, and absorb financial shocks.”
* Based on interviews with about 150,000 nationally representative and randomly selected adults (age 15+) in over 140 countries.
Who cares about financial inclusion?
reducing poverty economic growth
start expand businesseschildren’s education absorb
shocksinvest

Mobile Money – a DFI success

M-PESA adoption

M-PESA adoption by gender
36%
68%
79%
87%
98%
33%
59%
71%
82%
92%
0
0.2
0.4
0.6
0.8
1
2008 2009 2010 2011 2014
Male Headed Female Headed

When times get bad…..…..mobile money protects consumption
12%
+4.6%
-7.4%
Consumptionper capita
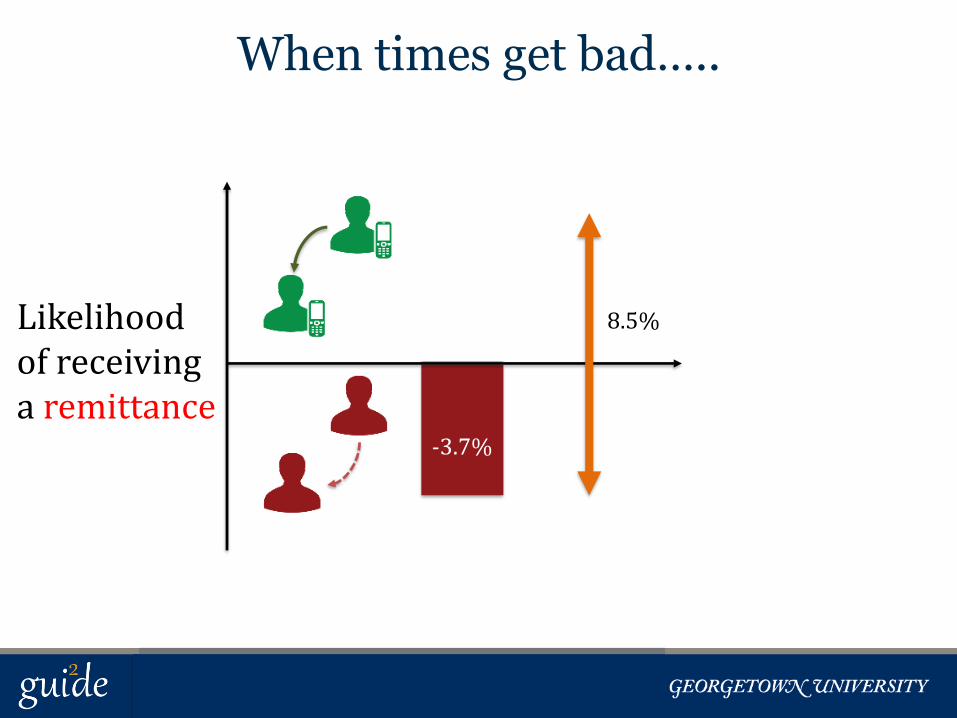
When times get bad…..…..mobile money connects networks
Likelihood of receiving a remittance
8.5%+4.8%
-3.7%
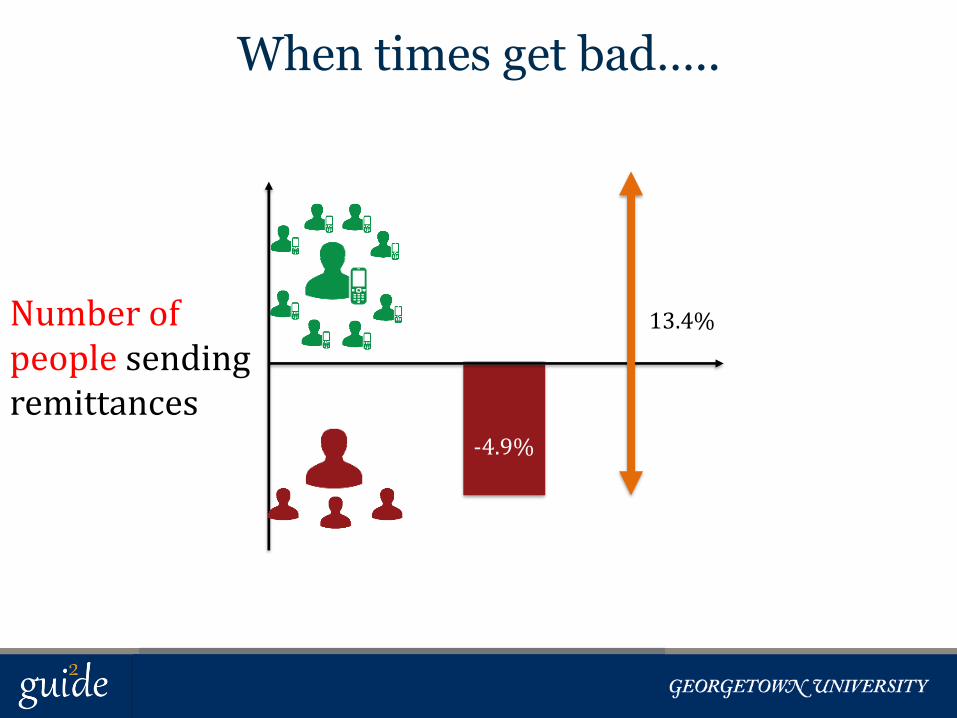
When times get bad…..…..mobile money expands networks
Number of people sending remittances
13.4%
+8.5%
-4.9%

+33%
+29%
4%
24%
+10%
-14%
+5%
-4%
9%
When health shocks hit…..…..mobile money provides insurance
Medicalexpenses
Non-food expenses
Foodexpenses

Per-capita consumption0
.2.4
.6
Den
sity
-4 -2 0 2 4Change in Log Consumption Per Capita, Male Headed HHs
Change in Agent Density No Change in Agent Density
-4 -2 0 2 4Change in Log Consumption Per Capita, Female Headed HHs
Change in Agent Density No Change in Agent Density
Male-headedhouseholds
Female-headedhouseholds
Households without M-PESAHouseholds with M-PESA
186,000households
out of poverty

High Hopes:saving for the transition to high school
Savings? Education?


Randomization
Kisumu Nyeri Kilifi3 Counties
3 x 120 schools
~14 parents per school
Control
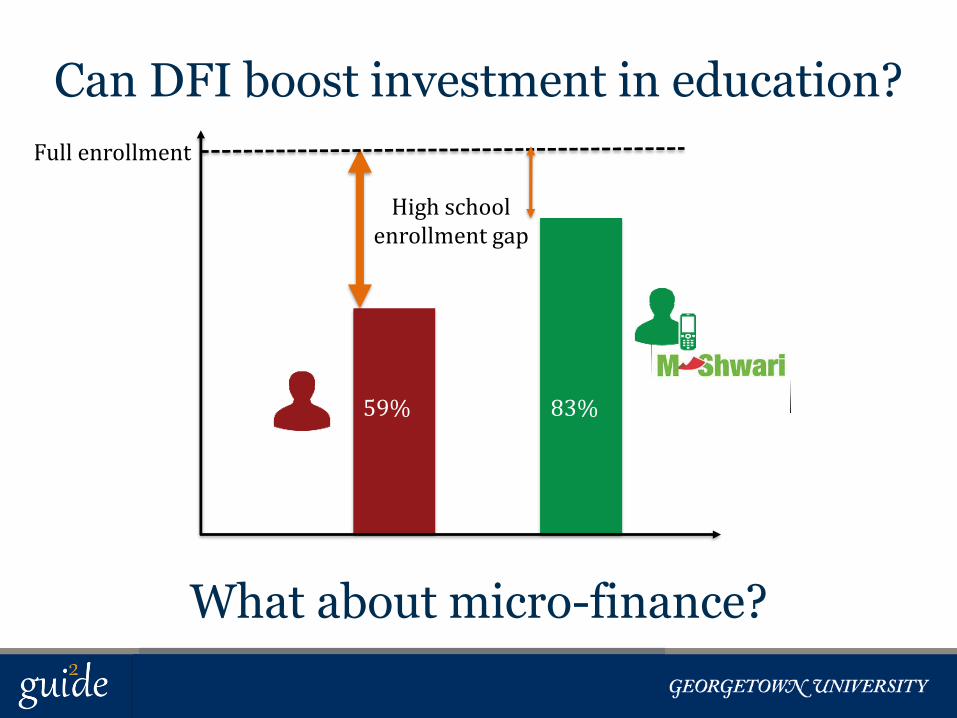
Can DFI boost investment in education?
59% 83%
High school enrollment gap
Full enrollment
What about micro-finance?

www.gui2de.org

MISHA SHARMANext
18
Demonetization: Insights from the field
Demonetization & its Implications for Digital Financial Services in India
GSDI CONFERENCE 2017
12th October 2017

Demonetization: Insights from the field
Background
• In November 2016, delegalization of Rs.500 and Rs.1000 notes was announced 86% by value of cash withdrawn from circulation Introduction of new Rs. 500 and Rs. 2000 notes
• Stated objectives: Fight corruption, eliminate black money and counter money laundering Secondary objective: Shift towards digital financial
services
• Short-term effects included currency crunch Shortages and transactional difficulties for those most
reliant on cash

Demonetization: Insights from the field
Demonetization in the Indian Context
• India largely a cash driven economy India’s cash to GDP ratio is at 11 percent Highest among the BRICS nation
• Indians largely employed in the informal sector Informal sector constitutes of 82 percent of total
employment and predominantly transacts in cash Lack of tax compliance
• India largely a rural economy 70 percent live in rural areas largely occupied in
agriculture and as casual labourers Sectors predominantly transacting in cash
21

Demonetization: Insights from the field
Chaos at ATMs and Banks..
22

Demonetization: Insights from the field
Informal Sector Choked Up..
23

Demonetization: Insights from the field
The other side of the story..
24
Volume and value of digital transaction increased gradually in the last 8 months

Demonetization: Insights from the field
But Where Does India Stand on Financial Inclusion?
• 65 percent of Indians financially included Have access to a bank account/other accounts at a
formal financial institution
• Access does not imply usage 60 percent are non-active users of their bank
accounts
• PMJDY- India’s flagship financial inclusion program One of the largest financial inclusion programs in
India Out of the ~300 million accounts, 26 percent are zero
balance
25Data Source: World Bank- Findex Data

Demonetization: Insights from the field
Digital Financial Inclusion in India- Still a Distant Dream!
• 30 percent are digitally-financially included Have digital access to their bank accounts
• Mobile phones are ubiquitous in India However, women, elderely and those living in rural areas
are less likely to access and own a phone
• Internet and Smartphone Usage Only 22 percent of Indian adults use the internet and 17
percent own smartphones
• Digital Literacy ~50 percent have lower levels of digital literacy The elderley, women and those will lower levels of
education are less likely to be digitally literate
26Data Source: finclusion.org
Demonetization: Insights from the field
IFMR LEAD Research
• How did demonetization affect the daily lives of low income households?
Effect on occupation and income profiles Expenditure and consumption patterns
• What were the coping mechanisms used by the poor to overcome the liquidity crunch?
Alternative payment methods used
• What was the effect on the take up and usage of digital financial services (DFS)?
Behavioural change in using digital modes of transactions
27
Demonetization: Insights from the field
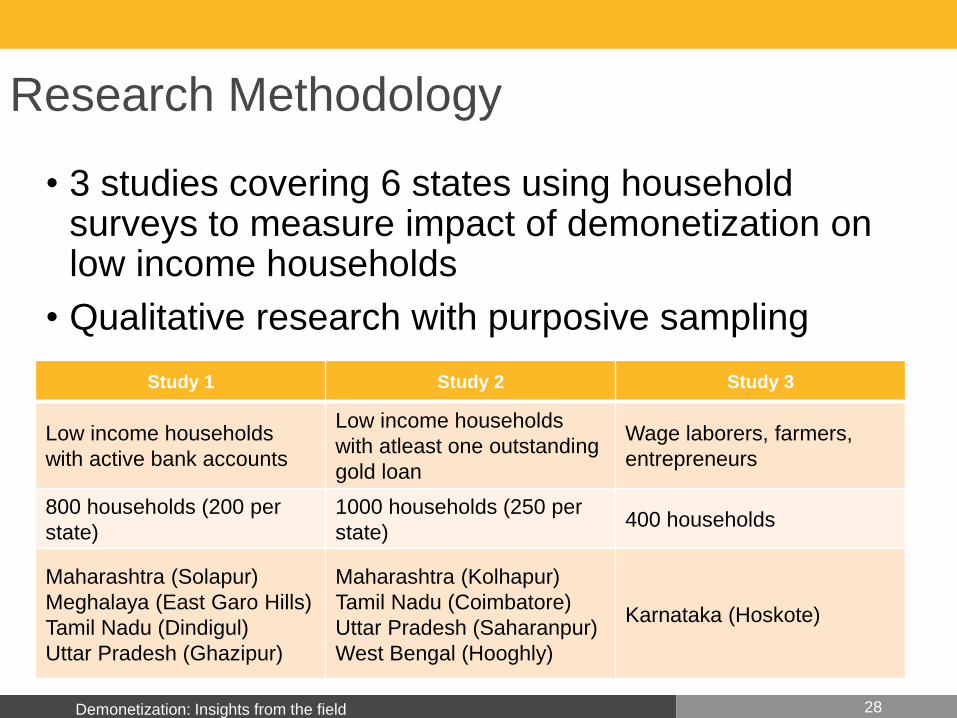
Research Methodology
• 3 studies covering 6 states using household surveys to measure impact of demonetization on low income households
• Qualitative research with purposive sampling
28
Study 1 Study 2 Study 3
Low income households
with active bank accounts
Low income households
with atleast one outstanding
gold loan
Wage laborers, farmers,
entrepreneurs
800 households (200 per
state)
1000 households (250 per
state)400 households
Maharashtra (Solapur)
Meghalaya (East Garo Hills)
Tamil Nadu (Dindigul)
Uttar Pradesh (Ghazipur)
Maharashtra (Kolhapur)
Tamil Nadu (Coimbatore)
Uttar Pradesh (Saharanpur)
West Bengal (Hooghly)
Karnataka (Hoskote)
Demonetization: Insights from the field
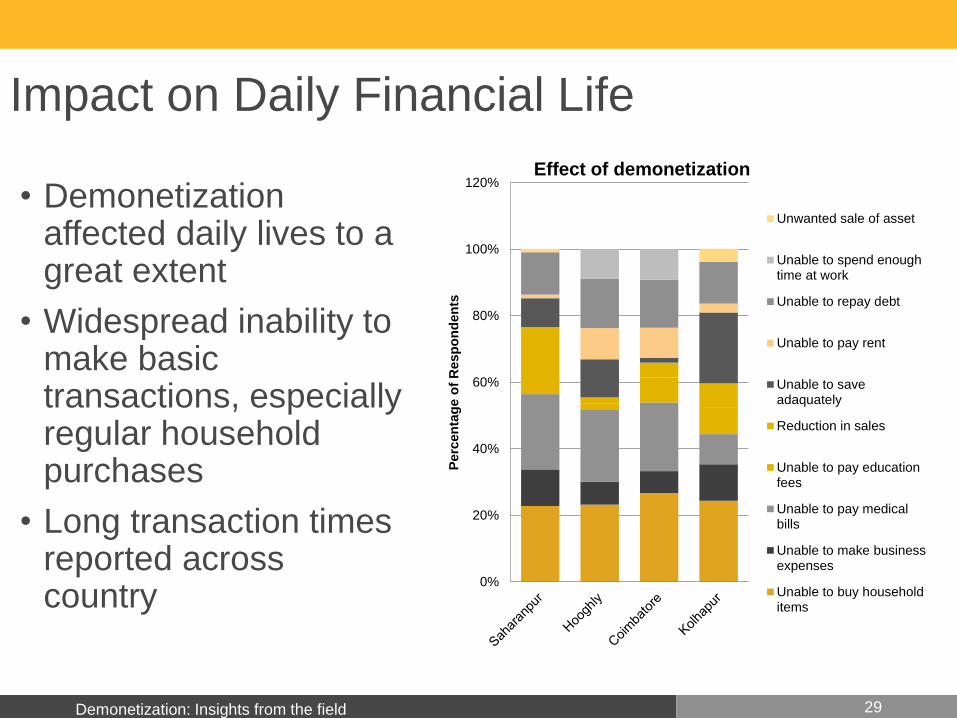
Impact on Daily Financial Life
• Demonetization affected daily lives to a great extent
• Widespread inability to make basic transactions, especially regular household purchases
• Long transaction times reported across country
29
0%
20%
40%
60%
80%
100%
120%
Perc
en
tag
e o
f R
esp
on
den
ts
Effect of demonetization
Unwanted sale of asset
Unable to spend enoughtime at work
Unable to repay debt
Unable to pay rent
Unable to saveadaquately
Reduction in sales
Unable to pay educationfees
Unable to pay medicalbills
Unable to make businessexpenses
Unable to buy householditems

Demonetization: Insights from the field
Impact on Income and Occupation Profile
• Drop in household incomes immediately post-demonetizationMissed workDifficulty finding employmentDelayed payment of wages/salesLoss of non-durable stock
• Largest decrease in days worked seen amongst daily wage laborers
• Recovery of income levels observed 3 months after policy rollout
30
Demonetization: Insights from the field
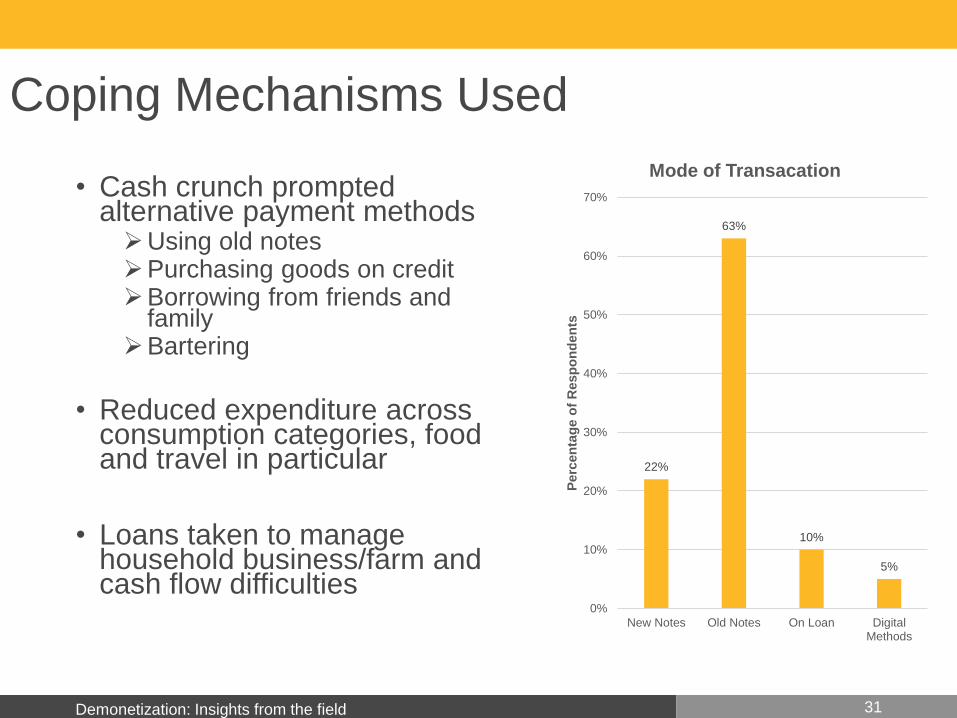
Coping Mechanisms Used
• Cash crunch prompted alternative payment methodsUsing old notesPurchasing goods on creditBorrowing from friends and
familyBartering
• Reduced expenditure across consumption categories, food and travel in particular
• Loans taken to manage household business/farm and cash flow difficulties
31
22%
63%
10%
5%
0%
10%
20%
30%
40%
50%
60%
70%
New Notes Old Notes On Loan DigitalMethods
Perc
en
tag
e o
f R
esp
on
den
ts
Mode of Transacation
Demonetization: Insights from the field
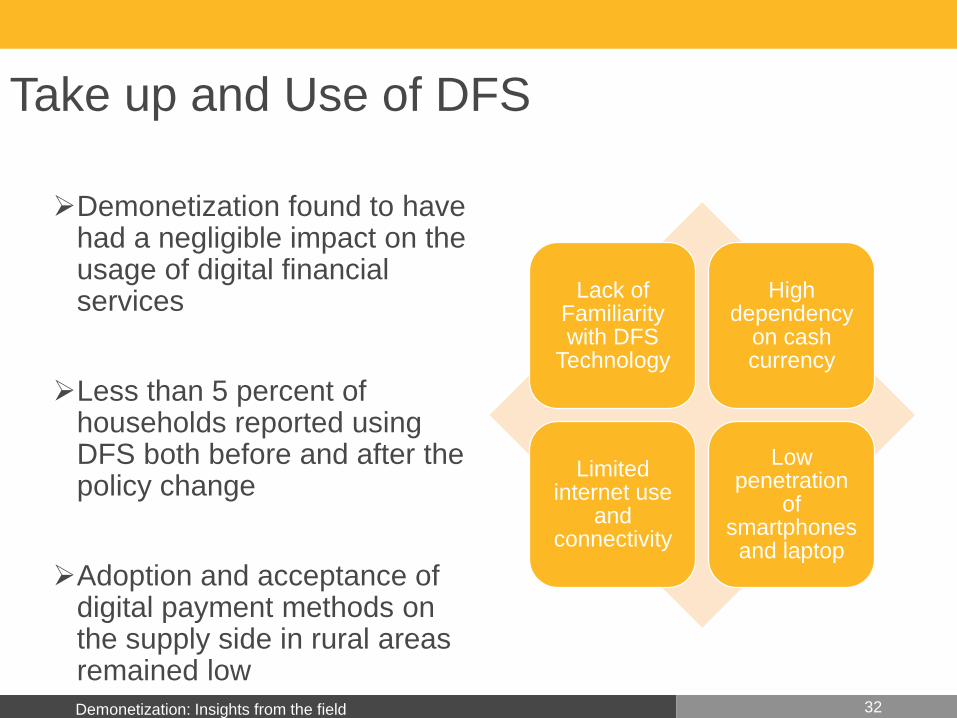
Take up and Use of DFS
Demonetization found to have had a negligible impact on the usage of digital financial services
Less than 5 percent of households reported using DFS both before and after the policy change
Adoption and acceptance of digital payment methods on the supply side in rural areas remained low
32
Lack of Familiarity with DFS
Technology
High dependency
on cash currency
Limited internet use
and connectivity
Low penetration
of smartphones and laptop

Demonetization: Insights from the field
Perception on DFS- Quotes from Respondents
‘I might be taxed if I make payments through my card or other digital means.’
‘I don’t know how to use digital methods. I am not literate and don’t understand the instructions
on the smartphones.’
‘Shops in my area don’t accept digital methods of payment, why should I then use it!’
33

Demonetization: Insights from the field
Implications• Last Mile Consumer
Transition to digital platforms will depend on the customer segment based on income volatility, age and literacy levels
Access does not imply usage
• Financial Service ProvidersImportant to understand which type of customer is likely to
transition to digital modes firstImportant to train agents who can bridge the gap between
access and usage for customers
• Policy MakersDigital literacy and data protection are key concerns to
barriers of trustAcceptance infrastructure needs to be improved and a
holistic ‘eco-system’ approach needs to be adopted
34

Demonetization: Insights from the field
Follow us on Twitter @ifmrlead.org
Visit our website www.ifmrlead.org
Thank You
Misha Sharma- [email protected]
Acknowledgements: Shruti Korada, Preethi Rao, Shambhavi
Srivastava, Suraj Nair, Suraj Jacob
CGAP, World Gold Council & IIM Ahmedabad

DOROTHE SINGERNext
36

37
Measuring Financial Resilience Around the World:
The Global Findex Dataset
Dorothe Singer
Economist
Development Research Group
World Bank

Fin
What is Financial Inclusion?
• Financial inclusion means that individuals have access and can effectively use appropriate formal financial services. Such services must be provided responsibly and sustainably in a well regulated environment
Financial Inclusion is Not an End in Itself – But a Means to an End
• People around the world face financial risks such as health, job opportunities, and weather related events.
• They are better able to manage such risks when they have a safe place to save money as well as access to credit when needed
• This is especially important for people in the poorest households as any
income shock might have severe consequences
How Financially Resilient are People Around the World?
Financial Inclusion and Financial Resilience

Fin
What is the Global Findex?
• The world’s most comprehensive set of data on how people save, borrow, make payments, and manage risks based on interviews with almost 150,000 adults in over 140 countries worldwide
• First launched in 2011, it was initiated to create and maintain a public, demand-side database that measures financial inclusion in a consistent manner over a broad range of countries over time. Second edition was collected in 2014; third edition (2017) will be launched in April 2018
• The Global Findex database is widely used by policymakers and researchers and frequently cited in the media
• Used to measure progress towards the World Bank’s goal of Universal Financial Access by 2020
• Data source for the G20 Financial Inclusion Indicators
• Global Findex data on account ownership is an indicator (8.10.2) for the United Nation’s Sustainable Development Goals
The World Bank’s Global Findex Database

• Globally, account ownership is 62% in 2014, up from 51% in 2011
• But 2 billion adults remain unbanked in 2014 (down from 2.5 billion in 2011)
Account Ownership
Account ownershipAdults with an account (%), 2014
Source: Global Findex (2014); http://www.worldbank.org/globalfindex

Now, imagine that you have an emergency and you need to pay [1/20th of GNI per
capita in local currency (~ $2,600 in the United States)]. How possible is that you
would come up with [1/20th of GNI per capita in local currency] with the NEXT
MONTH?
How Possible to Come Up With Emergency Funds?
Possibility to come up with emergency funds Adults able to raise emergency funds (%), 2014
76%
World'

Now, imagine that you have an emergency and you need to pay [1/20th of GNI per
capita in local currency (~ $2,600 in the United States)]. How possible is that you
would come up with [1/20th of GNI per capita in local currency] with the NEXT
MONTH?
How Possible to Come Up With Emergency Funds?
Possibility to come up with emergency funds Adults able to raise emergency funds (%), 2014
76%83%
74%
World High-income:OECD
Developing

Now, imagine that you have an emergency and you need to pay [1/20th of GNI per
capita in local currency (~ $2,600 in the United States)]. How possible is that you
would come up with [1/20th of GNI per capita in local currency] with the NEXT
MONTH?
How Possible to Come Up With Emergency Funds?
Possibility to come up with emergency funds Adults able to raise emergency funds (%), 2014
76%83%
74%80%
70%
54%
World High-income:OECD
Developing China India Brazil

How Possible to Come Up With Emergency Funds?
Possibility to come up with emergency funds Adults able to raise emergency funds (%), 2014
Men Women Richest60%
Poorest40%
Men Women Richest60%
Poorest40%
Developing High-income: OECD
Gender gap: 5 pp
Gender gap: 5 pp
Income gap: 18 pp
Income gap: 18 pp
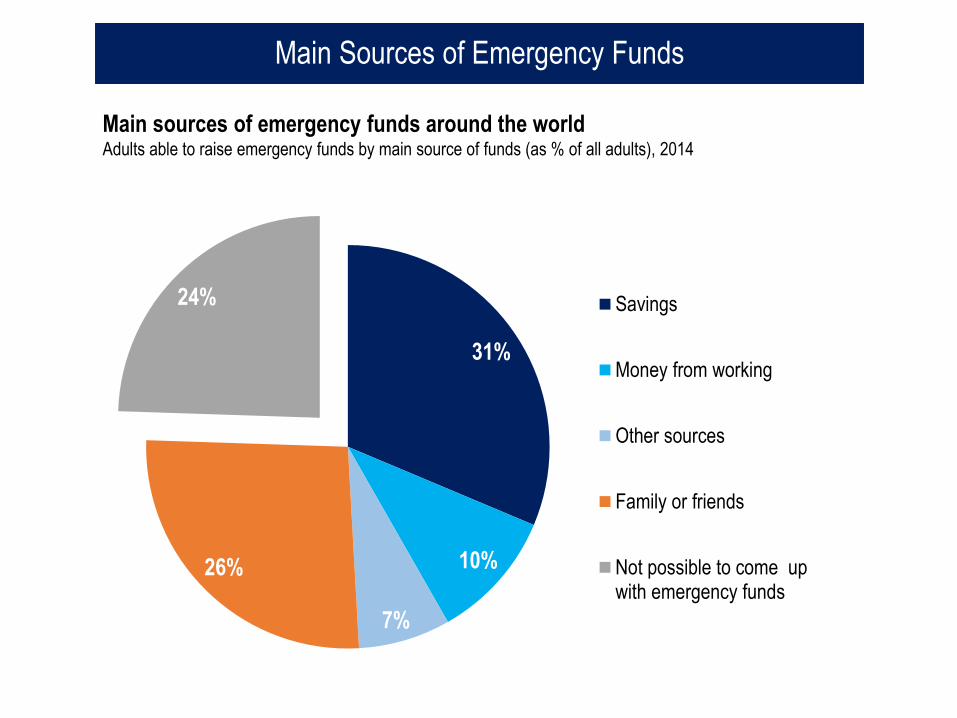
Main sources of emergency funds around the world Adults able to raise emergency funds by main source of funds (as % of all adults), 2014
Main Sources of Emergency Funds
31%
10%
7%
26%
24% Savings
Money from working
Other sources
Family or friends
Not possible to come upwith emergency funds

Main sources of emergency funds by country income group classification Adults able to raise emergency funds by main source of funds (as % of all adults), 2014
Main Sources of Emergency Funds
0% 10% 20% 30% 40% 50% 60% 70% 80% 90% 100%
Developing
HighIncome:OECD
Savings
Money from working
Other sources
Family or friends
Unable to come up with emerging funds
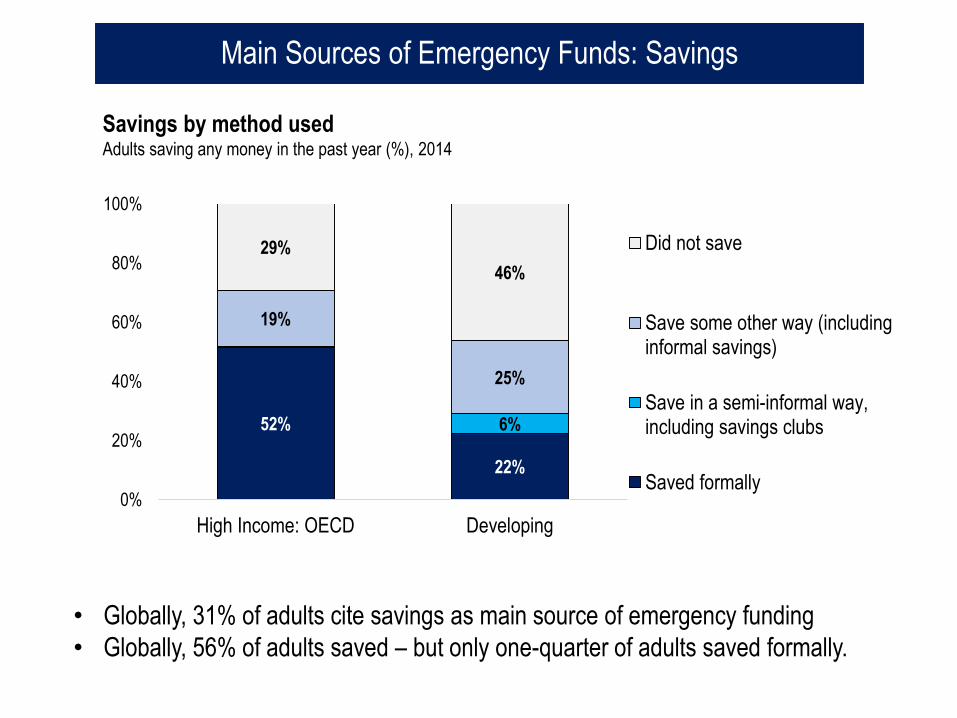
• Globally, 31% of adults cite savings as main source of emergency funding
• Globally, 56% of adults saved – but only one-quarter of adults saved formally.
Savings by method usedAdults saving any money in the past year (%), 2014
Main Sources of Emergency Funds: Savings
52%
22%
6%
19%
25%
29%
46%
0%
20%
40%
60%
80%
100%
High Income: OECD Developing
Did not save
Save some other way (includinginformal savings)
Save in a semi-informal way,including savings clubs
Saved formally

Savings as main source of emergency funds by formal and informal savingsAdults reporting savings as main source of emergency funds (as % of all adults), 2014
Main Sources of Emergency Funds: Savings
32%
13%
14%
16%
0%
20%
40%
60%
80%
100%
High-income: OECD Developing
Save some other way (including informal savings)
Save at a bank or other financial insitution

Main sources of emergency funds by employment status in developing countriesAdults able to raise emergency funds by main source of funds (as % of all adults), 2014
Main Sources of Emergency Funds: Money from Working
36%
20%
33%
19%
5%
11%
6%
6%
8%
21%
35%
26%
0% 10% 20% 30% 40% 50% 60% 70% 80% 90%
Wage employed
Out of work force
Self-employed
Savings Money from working Other sources Family or friends
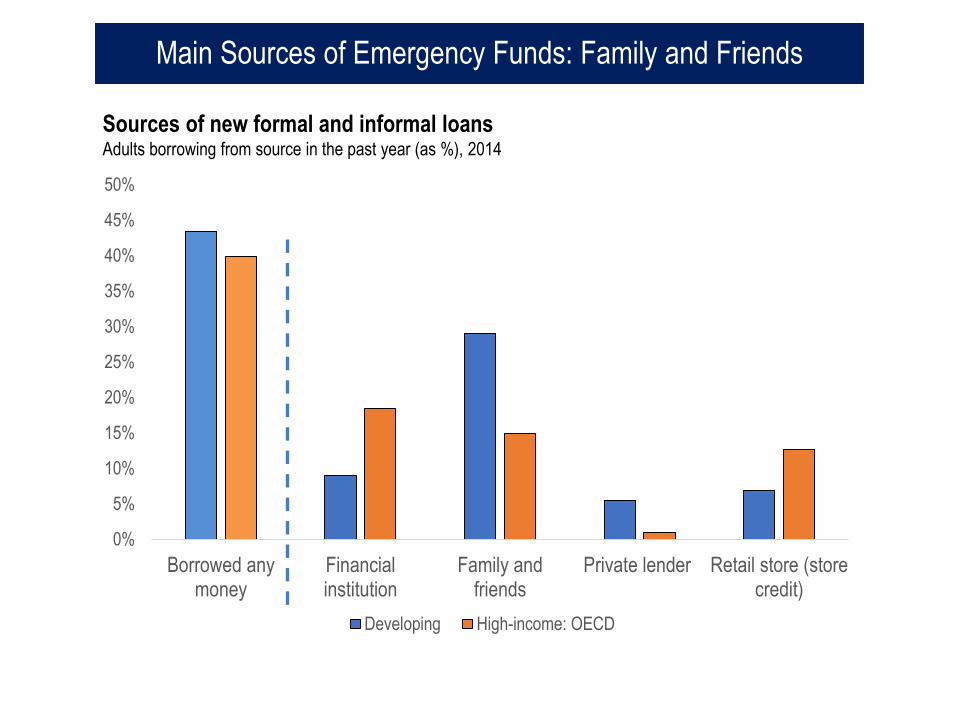
Sources of new formal and informal loansAdults borrowing from source in the past year (as %), 2014
Main Sources of Emergency Funds: Family and Friends
0%
5%
10%
15%
20%
25%
30%
35%
40%
45%
50%
Borrowed anymoney
Financialinstitution
Family andfriends
Private lender Retail store (storecredit)
Developing High-income: OECD

Conclusion
Fin
• People around the world face financial risks
• Mechanisms that improve financial resilience are especially important for poor people
• How can financial inclusion help?
• Removing potential barriers to savings (Karlan et al. 2014; Dupas and Robinson, 2013; Kast and Pomeranz, 2014; Prina 2015)
• More immediate and easier access to friends and family in other parts of the country (Jack and Suri, 2014)
• Building relationship with financial institution that may be able to be leveraged for better access to credit
• May be especially important for women (Ashraf et al., 2010; Aker et al., 2015)
www.worldbank.org/globalfindex
@GlobalFindex

Savings behavior Total Percentage of Adults
0%
10%
20%
30%
40%
50%
60%
70%
80%
90%
100%
High Income:OECD
China East Asia &Pacific (ex.
China)
India South Asia(ex. India)
Europe &Central Asia
LatinAmerica &Caribbean
Sub-SaharanAfrica
Saved using
an account
Saved using a
community
savings group
Did not save
Saved in
other ways
Savings

Borrowing behavior Total Percentage of Adults
0%
10%
20%
30%
40%
50%
60%
70%
80%
90%
100%
World Developing East Asia &Pacific
Europe &Central Asia
High Income:OECD
LatinAmerica &Caribbean
Middle East South Asia Sub-SaharanAfrica
Family &
Friends
Formal
financial
institution
Did not
borrow
Access to Credit
Fin
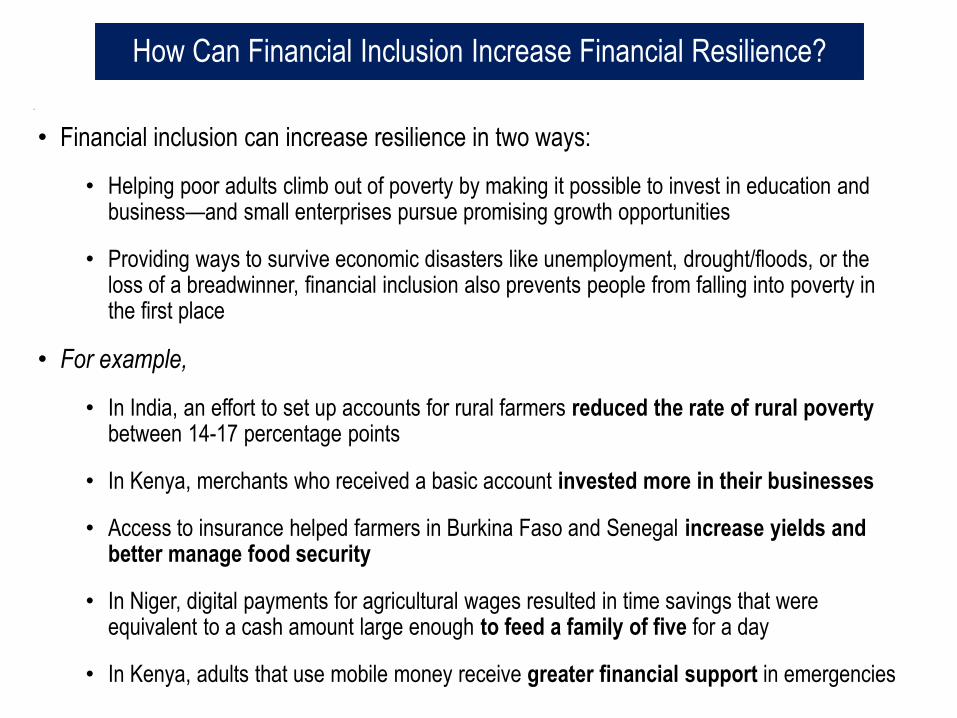
• Financial inclusion can increase resilience in two ways:
• Helping poor adults climb out of poverty by making it possible to invest in education and business—and small enterprises pursue promising growth opportunities
• Providing ways to survive economic disasters like unemployment, drought/floods, or the loss of a breadwinner, financial inclusion also prevents people from falling into poverty in the first place
• For example,
• In India, an effort to set up accounts for rural farmers reduced the rate of rural poverty between 14-17 percentage points
• In Kenya, merchants who received a basic account invested more in their businesses
• Access to insurance helped farmers in Burkina Faso and Senegal increase yields and better manage food security
• In Niger, digital payments for agricultural wages resulted in time savings that were equivalent to a cash amount large enough to feed a family of five for a day
• In Kenya, adults that use mobile money receive greater financial support in emergencies
How Can Financial Inclusion Increase Financial Resilience?
