optimum operation of bulk energy … operation of bulk energy storage systems in contemporary spot...
TRANSCRIPT

OPTIMUM OPERATION OF BULK ENERGY STORAGE SYSTEMS
IN CONTEMPORARY SPOT ELECTRICITY MARKETS
D. Zafirakis, K. Chalvatzis
Norwich Business School
University of East Anglia
Norwich, NR4 7TJ, UK
email: [email protected]
INTRODUCTION
During the recent years, there has been
considerable interest in the R&D of energy storage
systems
Among the most established services that such
systems can provide, are spinning reserve,
arbitrage, transmission system stability, voltage
regulation and peak shaving
On the other hand, increased investment costs and
inherent energy conversion losses attached to them
lead to increased production costs that discourage
investment in such projects
An effort is made to develop an arbitrage model for
two different bulk energy storage technologies;
pumped hydro storage (PHS) and compressed air
energy storage (CAES), operating in contemporary
electricity spot markets

NORD POOL MARKET
The two energy storage systems are set to
operate in two different Nord Pool regions,
i.e. of West Denmark and Finland
Nord Pool is the leading market for buying
and selling energy in the Nordic region,
Estonia, Germany and Great Britain, with
74% of the Nordic region energy
production traded on its basis
Contribution of wind energy in the Danish
market exceeds 20%, complementing
operation of CHP units. On the other hand,
the fuel mix of Finland is much more
diverse, with nuclear power holding the
greatest share
Electricity Fuel Mix of Denmark (2010)
21,4%
78,3%
0,3%
Wind CHP Other
Electricity Fuel Mix of Finland (2010)
28,2%
16,0%
0,4%17,8%
24,6%
0,1%13,0%
Nuclear Hydro Wind Comb. Fuels CHP Other Net imports
SPOT PRICE PATTERNS
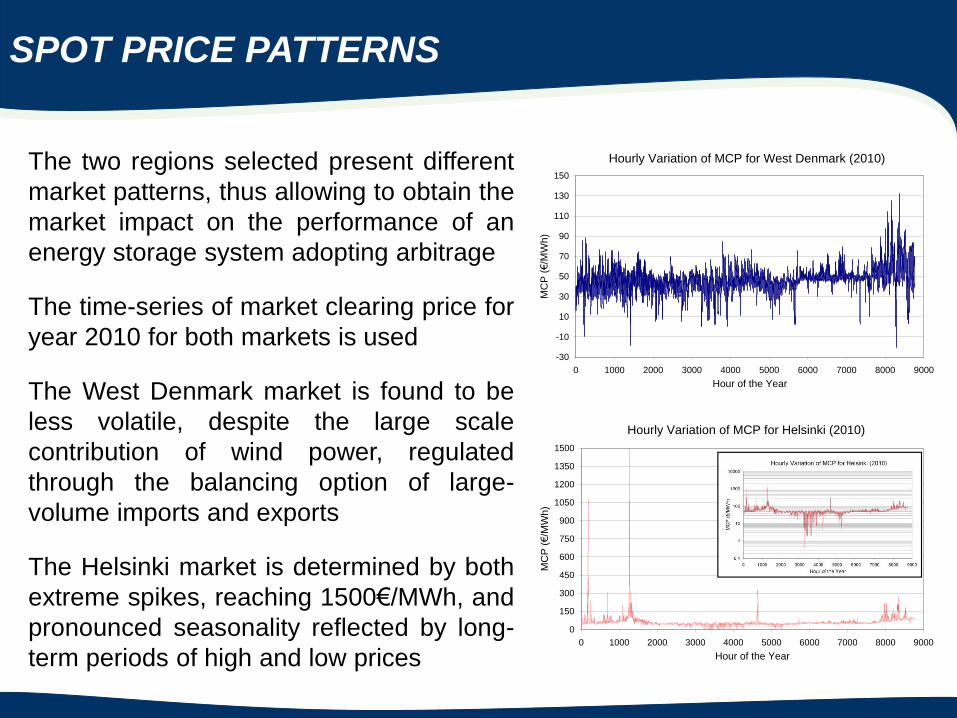
The two regions selected present different
market patterns, thus allowing to obtain the
market impact on the performance of an
energy storage system adopting arbitrage
The time-series of market clearing price for
year 2010 for both markets is used
The West Denmark market is found to be
less volatile, despite the large scale
contribution of wind power, regulated
through the balancing option of large-
volume imports and exports
The Helsinki market is determined by both
extreme spikes, reaching 1500€/MWh, and
pronounced seasonality reflected by long-
term periods of high and low prices
Hourly Variation of MCP for West Denmark (2010)
-30
-10
10
30
50
70
90
110
130
150
0 1000 2000 3000 4000 5000 6000 7000 8000 9000
Hour of the Year
MC
P (
€/M
Wh)
Hourly Variation of MCP for Helsinki (2010)
0
150
300
450
600
750
900
1050
1200
1350
1500
0 1000 2000 3000 4000 5000 6000 7000 8000 9000
Hour of the Year
MC
P (
€/M
Wh)
PUMPED HYDRO STORAGE (PHS)
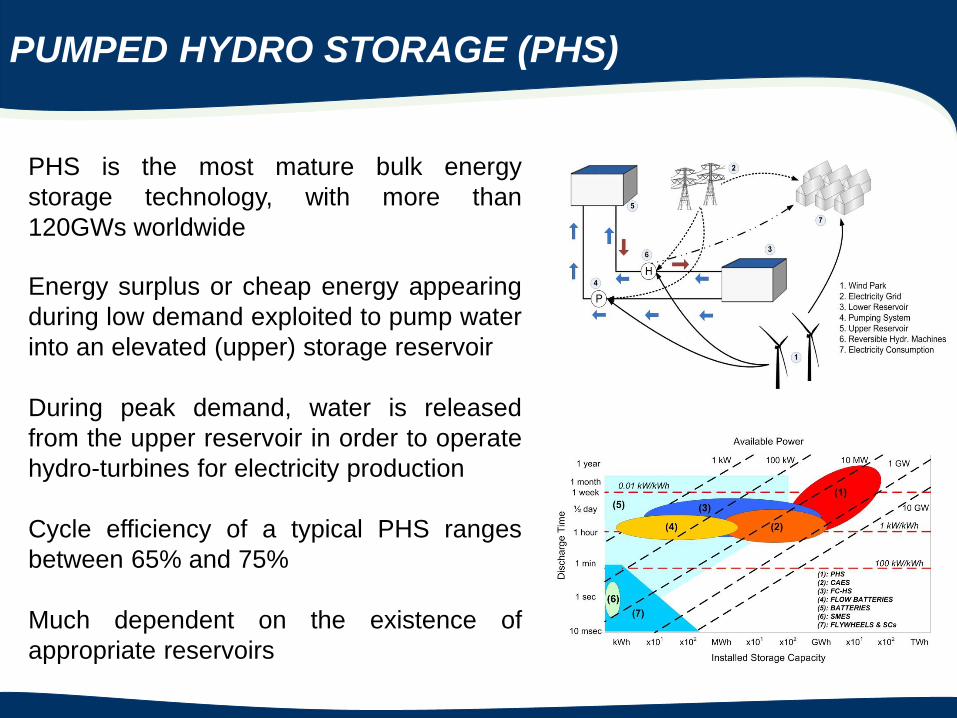
PHS is the most mature bulk energy
storage technology, with more than
120GWs worldwide
Energy surplus or cheap energy appearing
during low demand exploited to pump water
into an elevated (upper) storage reservoir
During peak demand, water is released
from the upper reservoir in order to operate
hydro-turbines for electricity production
Cycle efficiency of a typical PHS ranges
between 65% and 75%
Much dependent on the existence of
appropriate reservoirs
COMPRESSED AIR EN. STORAGE (CAES)
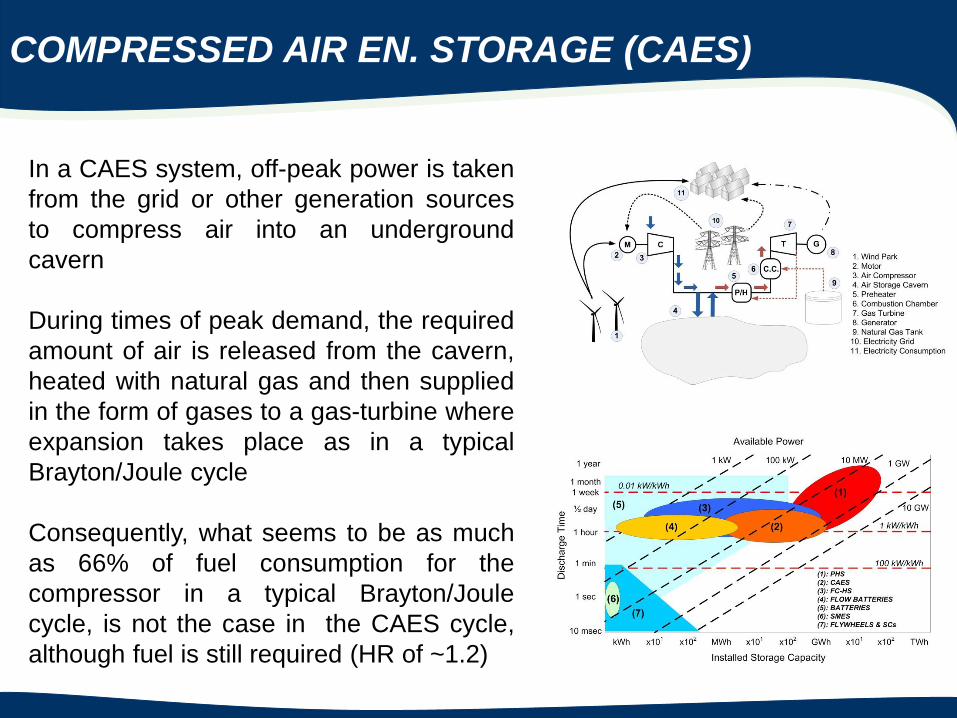
In a CAES system, off-peak power is taken
from the grid or other generation sources
to compress air into an underground
cavern
During times of peak demand, the required
amount of air is released from the cavern,
heated with natural gas and then supplied
in the form of gases to a gas-turbine where
expansion takes place as in a typical
Brayton/Joule cycle
Consequently, what seems to be as much
as 66% of fuel consumption for the
compressor in a typical Brayton/Joule
cycle, is not the case in the CAES cycle,
although fuel is still required (HR of ~1.2)
DISPATCH STRATEGY
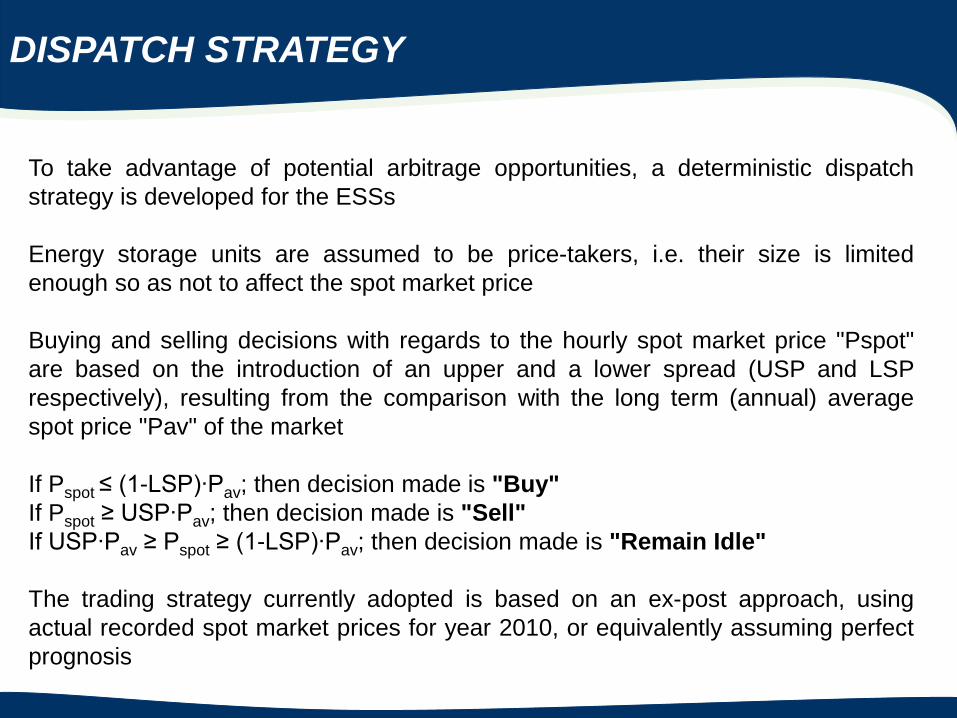
To take advantage of potential arbitrage opportunities, a deterministic dispatch
strategy is developed for the ESSs
Energy storage units are assumed to be price-takers, i.e. their size is limited
enough so as not to affect the spot market price
Buying and selling decisions with regards to the hourly spot market price "Pspot"
are based on the introduction of an upper and a lower spread (USP and LSP
respectively), resulting from the comparison with the long term (annual) average
spot price "Pav" of the market
If Pspot ≤ (1-LSP)∙Pav; then decision made is "Buy"
If Pspot ≥ USP∙Pav; then decision made is "Sell"
If USP∙Pav ≥ Pspot ≥ (1-LSP)∙Pav; then decision made is "Remain Idle"
The trading strategy currently adopted is based on an ex-post approach, using
actual recorded spot market prices for year 2010, or equivalently assuming perfect
prognosis

PROBLEM PARAMETERS
The main technical characteristics of the
energy storage units are also taken into
account
Maximum power input and output values,
along with the corresponding efficiency
rates and the system storage capacity
In the case of the CAES system, there is
also need to define the unit heat rate
Variation of all parameters evaluated on
the basis of maximum net cash flows
through arbitrage, varying at the same
time both USP and LSP values on a 10%
variation step
Power input (MW) 20-150
Power output (MW) 20-150
Storage Capacity (MWh) 150-1000
Input efficiency–PHS 75%
Input efficiency–CAES 85%
Output efficiency–PHS 85%
Output efficiency–CAES 120%
CAES heat rate 1.2

PRELIMINARY APPLICATION RESULTS
The practical trading strategy is applied
to the markets of West Denmark and
Helsinki for a representative PHS system
A 10% value is selected for both USP
and LSP, implying frequent system
operation since the system is allowed to
buy and sell when the price falls below
and increases above 10% of the long-
term average
The higher price concentration in the
case of West Denmark (STDV of
12€/MWh) -compared with Helsinki
(STDV of 50€/MWh)- encourages
adoption of narrower spreads
Hourly Storage Level Variation Vs Revenues/Expenses;
Np=20MW; Nt=20MW; LSP-USP=10%; Ess=1000MWh;
West Denmark
-700
-500
-300
-100
100
300
500
700
900
1100
1300
1500
1 651 1301 1951 2601 3251 3901 4551 5201 5851 6501 7151 7801 8451
Hour of the Year
Revenues (
€/h
)
0
100
200
300
400
500
600
700
800
900
1000
1100
Sto
rag
e L
eve
l (M
Wh
)
Revenues/Expenses
Storage Level
Hourly Storage Level Variation Vs Revenues/Expenses;
Np=20MW; Nt=20MW; LSP-USP=10%; Ess=1000MWh;
Helsinki
-2000
0
2000
4000
6000
8000
10000
12000
14000
16000
18000
20000
1 651 1301 1951 2601 3251 3901 4551 5201 5851 6501 7151 7801 8451
Hour of the Year
Reve
nu
es (
€/h
)
0
100
200
300
400
500
600
700
800
900
1000
1100
Sto
rag
e L
eve
l (M
Wh
)
Revenues/Expenses
Storage Level
PARAMETRICAL ANALYSIS (1)
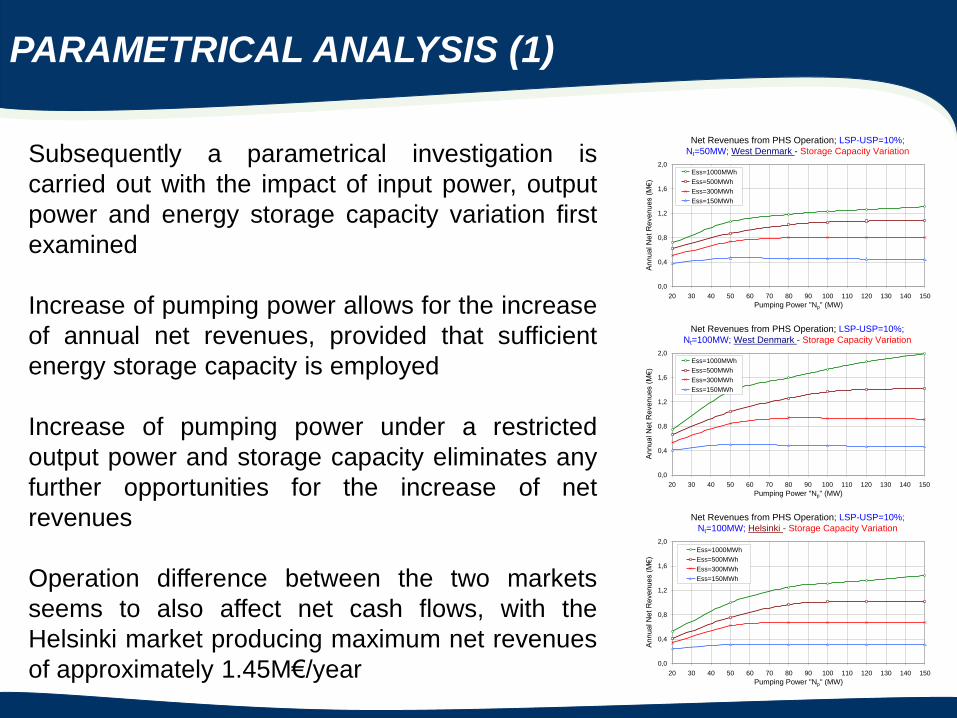
Subsequently a parametrical investigation is
carried out with the impact of input power, output
power and energy storage capacity variation first
examined
Increase of pumping power allows for the increase
of annual net revenues, provided that sufficient
energy storage capacity is employed
Increase of pumping power under a restricted
output power and storage capacity eliminates any
further opportunities for the increase of net
revenues
Operation difference between the two markets
seems to also affect net cash flows, with the
Helsinki market producing maximum net revenues
of approximately 1.45M€/year
Net Revenues from PHS Operation; LSP-USP=10%;
Nt=50MW; West Denmark - Storage Capacity Variation
0,0
0,4
0,8
1,2
1,6
2,0
20 30 40 50 60 70 80 90 100 110 120 130 140 150
Pumping Power "Np" (MW)
Ann
ua
l N
et
Reve
nu
es (
M€
)
Ess=1000MWh
Ess=500MWh
Ess=300MWh
Ess=150MWh
Net Revenues from PHS Operation; LSP-USP=10%;
Nt=100MW; West Denmark - Storage Capacity Variation
0,0
0,4
0,8
1,2
1,6
2,0
20 30 40 50 60 70 80 90 100 110 120 130 140 150
Pumping Power "Np" (MW)
Ann
ua
l N
et
Reve
nu
es (
M€
)
Ess=1000MWh
Ess=500MWh
Ess=300MWh
Ess=150MWh
Net Revenues from PHS Operation; LSP-USP=10%;
Nt=100MW; Helsinki - Storage Capacity Variation
0,0
0,4
0,8
1,2
1,6
2,0
20 30 40 50 60 70 80 90 100 110 120 130 140 150
Pumping Power "Np" (MW)
Ann
ua
l N
et
Reve
nu
es (
M€
)
Ess=1000MWh
Ess=500MWh
Ess=300MWh
Ess=150MWh
PARAMETRICAL ANALYSIS (2)
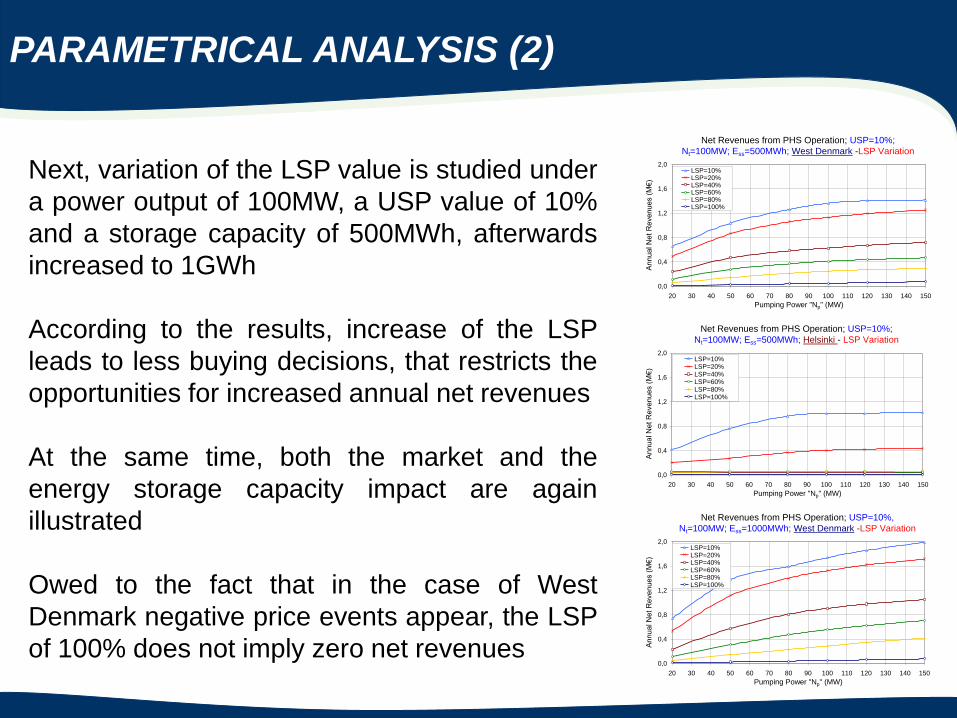
Next, variation of the LSP value is studied under
a power output of 100MW, a USP value of 10%
and a storage capacity of 500MWh, afterwards
increased to 1GWh
According to the results, increase of the LSP
leads to less buying decisions, that restricts the
opportunities for increased annual net revenues
At the same time, both the market and the
energy storage capacity impact are again
illustrated
Owed to the fact that in the case of West
Denmark negative price events appear, the LSP
of 100% does not imply zero net revenues
Net Revenues from PHS Operation; USP=10%;
Nt=100MW; Ess=500MWh; West Denmark -LSP Variation
0,0
0,4
0,8
1,2
1,6
2,0
20 30 40 50 60 70 80 90 100 110 120 130 140 150
Pumping Power "Np" (MW)
Ann
ua
l N
et
Reve
nu
es (
M€
)
LSP=10%LSP=20%LSP=40%LSP=60%LSP=80%LSP=100%
Net Revenues from PHS Operation; USP=10%;
Nt=100MW; Ess=500MWh; Helsinki - LSP Variation
0,0
0,4
0,8
1,2
1,6
2,0
20 30 40 50 60 70 80 90 100 110 120 130 140 150
Pumping Power "Np" (MW)
Ann
ua
l N
et
Reve
nu
es (
M€
)
LSP=10%LSP=20%LSP=40%LSP=60%LSP=80%LSP=100%
Net Revenues from PHS Operation; USP=10%,
Nt=100MW; Ess=1000MWh; West Denmark -LSP Variation
0,0
0,4
0,8
1,2
1,6
2,0
20 30 40 50 60 70 80 90 100 110 120 130 140 150
Pumping Power "Np" (MW)
Ann
ua
l N
et
Reve
nu
es (
M€
)
LSP=10%LSP=20%LSP=40%LSP=60%LSP=80%LSP=100%

PARAMETRICAL ANALYSIS (3)
The variation of the system capacity
factor (CF), is also estimated for a
capacity of 500MWh, USP=10%, and
output power of 100MW
Greater STDV for Helsinki has a direct
impact on the deriving CF values, which
do not exceed 2.1% on an annual basis
On the other hand, the considerably
lower STDV, encountered in West
Denmark, allows for more frequent
system operation, with the CF values
reaching 8% for the current set of
parameters
Capacity Factor Variation for PHS; USP=10%; Nt=100MW;
Ess=500MWh; Helsinki - LSP Variation
0,0%
0,5%
1,0%
1,5%
2,0%
2,5%
20 30 40 50 60 70 80 90 100 110 120 130 140 150
Pumping Power "Np" (MW)
Capacity F
acto
r
LSP=10%LSP=20%LSP=40%LSP=60%LSP=80%LSP=100%
Capacity Factor Variation for PHS; USP=10%; Nt=100MW;
Ess=500MWh; West Denmark - LSP Variation
0%
2%
4%
6%
8%
10%
20 30 40 50 60 70 80 90 100 110 120 130 140 150
Pumping Power "Np" (MW)
Capacity F
acto
r
LSP=10%LSP=20%LSP=40%LSP=60%LSP=80%LSP=100%

PARAMETRICAL ANALYSIS (4)
Next, variation of the USP parameter is also
undertaken
Increase of the USP value has an adverse
impact on the annual net revenues for West
Denmark, while the opposite happens for
Helsinki, for the lower values of pumping
power
Increase of the USP value to 100% implies
maximum net revenues for 0-40MW input
power, justified on the basis minimum CF
values, with parallel exploitation of prices that
exceed by far the respective average
As the pumping power increases and more
energy is being bought, the requirement for
energy sales increases, designating that USP
of 10% ensures greater net cash flows
Net Revenues from PHS Operation; LSP=10%;
Nt=100MW; Ess=500MWh; West Denmark - USP Variation
0,0
0,4
0,8
1,2
1,6
2,0
20 30 40 50 60 70 80 90 100 110 120 130 140 150
Pumping Power "Np" (MW)
Annual N
et R
evenues (
M€)
USP=10%USP=20%USP=40%USP=60%USP=80%USP=100%
Net Revenues from PHS Operation; LSP=10%;
Nt=100MW; Ess=500MWh; Helsinki - USP Variation
0,0
0,4
0,8
1,2
20 30 40 50 60 70 80 90 100 110 120 130 140 150
Pumping Power "Np" (MW)
Annual N
et R
evenues (
M€)
USP=10%
USP=20%
USP=40%
USP=60%
USP=80%
USP=100%
OPTIMUM RESULTS (1)
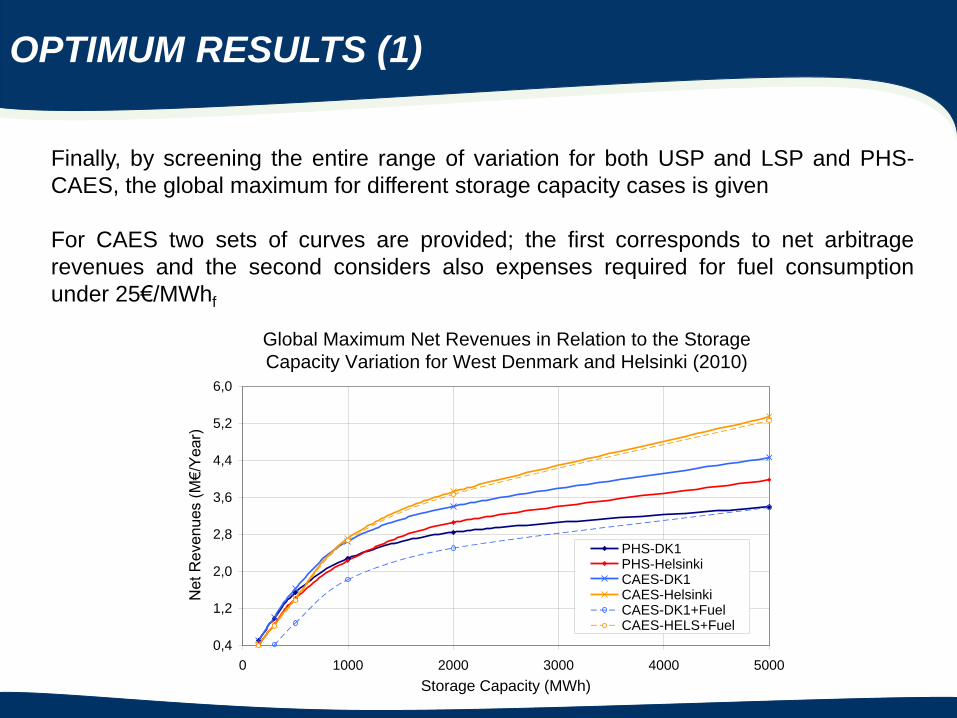
Finally, by screening the entire range of variation for both USP and LSP and PHS-
CAES, the global maximum for different storage capacity cases is given
For CAES two sets of curves are provided; the first corresponds to net arbitrage
revenues and the second considers also expenses required for fuel consumption
under 25€/MWhf
Global Maximum Net Revenues in Relation to the Storage
Capacity Variation for West Denmark and Helsinki (2010)
0,4
1,2
2,0
2,8
3,6
4,4
5,2
6,0
0 1000 2000 3000 4000 5000
Storage Capacity (MWh)
Net
Reve
nu
es (
M€
/Ye
ar)
PHS-DK1 PHS-HelsinkiCAES-DK1CAES-HelsinkiCAES-DK1+FuelCAES-HELS+Fuel
OPTIMUM RESULTS (2)
CAES is found to produce higher net revenues in the case of the Helsinki
market -in comparison to PHS- even when fuel expenses are taken into
account
On the other hand, in the case of West Denmark, CAES although ensuring
greater net arbitrage revenues than PHS, is considerably affected by the fuel
factor, resulting to lower net cash flows in comparison to PHS
Recall that West Denmark is characterized by a significantly higher frequency
operation, which also implies higher fuel consumption
It is noteworthy that there is a critical storage capacity (in the order of 1GWh)
above which the Helsinki market presents greater net revenues than West
Denmark
That is owed to the fact that by exploiting extreme storage capacities, large
amounts of energy stores may be sold during the appearance of price spikes

CONCLUSIONS
Based on the development of a practical arbitrage trading strategy for bulk energy storage, investigation of two different spot market patterns was undertaken According to the results obtained, the less volatile price pattern of West Denmark market encourages operation of smaller capacity systems, while in the case of the more volatile Helsinki market, both CAES and PHS systems perform better if a storage capacity of more than 1GWh is employed At the same time, increased CF of systems operating in West Denmark is also responsible for the considerable reduction of net cash flows in the case of CAES, owed to the increased fuel consumption On the other hand, extremely low CF values noted in the case of ESSs operating in the Helsinki region, also have a direct impact on CAES fuel consumption As a result, CAES is found to be more suitable for the Helsinki market, while PHS is the most appropriate solution for the West Denmark market Examination of investment and maintenance costs, as well as economic evaluation on a long-term basis for both systems examined is required

Thank you for
Your Attention