optimizing re-evaluation of malware distribution networks
TRANSCRIPT
Optimizing Re-Evaluation of MalwareDistribution Networks
by
Kyle Zeeuwen
A THESIS SUBMITTED IN PARTIAL FULFILLMENT OFTHE REQUIREMENTS FOR THE DEGREE OF
MASTER OF APPLIED SCIENCE
in
The Faculty of Graduate Studies
(Electrical and Computer Engineering)
THE UNIVERSITY OF BRITISH COLUMBIA
(Vancouver)
October, 2011
c© Kyle Zeeuwen 2011
Abstract
The retrieval and analysis of malicious content is an essential task for security researchers.
Security labs use automated HTTP clients known as client honeypots to visit hundreds of
thousands of suspicious URLs daily. The dynamic nature of malware distribution networks
necessitate periodic re-evaluation of a subset of the confirmed malicious sites, which introduces
two problems: 1) the number of URLs requiring re-evaluation exhaust available resources, and
2) repeated evaluation exposes the system to adversarial blacklisting, which affects the accuracy
of the content collected. To address these problems, I propose optimizations to the re-evaluation
logic that reduce the number of re-evaluations while maintaining a constant sample discovery
rate during URLs re-evaluation.
I study these problems in two adversarial scenarios: 1) monitoring malware repositories where
no provenance is available, and 2) monitoring Fake Anti-Virus (AV) distribution networks. I
perform a study of the adversary by repeatedly content from the distribution networks. This re-
veals trends in the update patterns and lifetimes of the distribution sites and malicious executa-
bles. Using these observations I propose optimizations to reduce the amount of re-evaluations
necessary to maintain a high malicious sample discovery rate.
In the first scenario the proposed techniques, when evaluated versus a fixed interval scheduler,
are shown to reduce the number of re-evaluations by 80-93% (assuming a re-evaluation interval
of 1 hour to 1 day) with a corresponding impact on sample discovery rate of only 2-7% percent.
In the second scenario, optimizations proposed are shown to reduce fetch volume by orders of
magnitude and, more importantly, reduce the likelihood of blacklisting.
During direct evaluation of malware repositories I observe multiple instances of blacklisting, but
on the whole, less than 1% of the repositories studied show evidence of blacklisting. Fake AV dis-
tribution networks actively blacklist IPs; I encountered repeated occurrences of IP blacklisting
while monitoring Fake AV distribution networks.
ii
Preface
This chapter documents the external contributions to this research.
Statement of Co-Authorship
Virus Bulletin 2011: Section 5.2.2, Section 5.2.3, Chapter 6 and Chapter 7 present materials
from analysis of Fake Anti-Virus Malware Distribution Networks that has been submitted for
publication [KZRB11]. This analysis and resulting write up was performed in collaboration
with Onur Komili, Matei Ripeanu, and Konstantin Beznosov and included in this thesis as well
as the Virus Bulletin paper. The data was collected and analyzed using the Tachyon Detection
Grid (TDG) (Section 4.1), a system I was solely responsible for building (with contributions
noted in the Preface). Onur’s analysis of the data identified the Malware Distribution Networks
(MDNs), which led to joint development of analysis scripts to produce the statistics presented.
The proposed optimizations and simulation methodology were both my work. Onur wrote
the initial drafts of Section 5.2.2; however after 4 rounds of collaborative revision we both can
safely claim authorship. Matei Ripeanu contributed to a final revision of the sections mentioned
above.
O. Komili, K. Zeeuwen, M. Ripeanu, and K. Beznosov. Strategies for Monitoring Fake AV
Distribution Networks. In Virus Bulletin 2011. Virus Bulletin, October 5-7, 2011.
WebQuality 2011: A preliminary study of zero provenance malware repositories using my
experimental apparatus was published in [ZRB11]. The results presented in this paper are not
directly reproduced in this thesis, however much of the approach is the same and the content
in the background and approach section of the WebQuality Paper may appear throughout the
thesis.
iii
Preface
K. Zeeuwen, M. Ripeanu, and K. Beznosov. Improving Malicious URL Re-Evaluation Schedul-
ing Through an Empirical Study of Malware Download Centers. In WebQuality 2011. ACM,
April 28, 2011.
Hardware and software support from Sophos
This section documents the contributions to this work made by SophosLabs [Sop11] and specific
individuals within the Lab. The first version of the Tachyon Detection Grid (TDG) was hosted
entirely on two virtual servers provisioned by a company called Linode [Lin11]. This became
costly and the experiment quickly outgrew this infrastructure. The second version was hosted
on SophosLabs hardware. Once inside the SophosLabs infrastructure, I was able to leverage
several technologies, allowing me to focus on the research aspects of the system. The specific
contributions of SophosLabs to this research are listed below:
Hardware In the second version of the TDG, the central server was hosted on SophosLabs
hardware. All communication to and from the central server ran over SophosLabs band-
width.
Apache QPID Message Broker Sean Macdonald wrote the perl AMQP bindings and de-
ployed the Apache QPID messaging broker. This broker provided the communication
mechanism between all persistent processes on the central server.
NodeJS Key-Value Store Sean Macdonald wrote the REST based key-value store used by
the TDG. This software was used in a separate project and was adopted for use in the
TDG with very minimal modifications.
High Interaction Honey Client The initial work to set up Virtual Box and develop scripts
to control Firefox was performed by Onur Komili and Jeff Leong. I modified their pro-
totype to interact with the TDG and performed several subsequent improvements. The
Sikuli script to emulate human interaction with the browser was developed by Jeff Leong
and updated by Onur Komili.
Analysis and Interpretation of Fake AV crawling In early June 2011, Onur Komili be-
gan actively participating in the Fake AV experiments. The work was very much a collab-
iv
Preface
orative effort and I am grateful for his contributions. This specific subset of the research
will be presented at Virus Bulletin in October, 2011 [KZRB11] in a paper co authored by
Onur. This is addressed separately in the Statement of Authorship.
AV Detection Filter Lists For several analysis tasks it was necessary to infer a sample cate-
gory (malicious executable, malicious web content, suspicious, application control) based
on an AV detection. Human maintained lists for Sophos and other vendor detections were
made available by SophosLabs. These are discussed in Section 4.2.
v
Table of Contents
Abstract . . . . . . . . . . . . . . . . . . . . . . . . . . . . . . . . . . . . . . . . . . . . ii
Preface . . . . . . . . . . . . . . . . . . . . . . . . . . . . . . . . . . . . . . . . . . . . . iii
Table of Contents . . . . . . . . . . . . . . . . . . . . . . . . . . . . . . . . . . . . . . . vi
List of Tables . . . . . . . . . . . . . . . . . . . . . . . . . . . . . . . . . . . . . . . . . x
List of Figures . . . . . . . . . . . . . . . . . . . . . . . . . . . . . . . . . . . . . . . . . xi
Glossary . . . . . . . . . . . . . . . . . . . . . . . . . . . . . . . . . . . . . . . . . . . . xiii
Acknowledgments . . . . . . . . . . . . . . . . . . . . . . . . . . . . . . . . . . . . . . xv
1 Introduction . . . . . . . . . . . . . . . . . . . . . . . . . . . . . . . . . . . . . . . . 1
2 Background . . . . . . . . . . . . . . . . . . . . . . . . . . . . . . . . . . . . . . . . 5
2.1 Mechanics of the World Wide Web . . . . . . . . . . . . . . . . . . . . . . . . . . 5
2.1.1 Essential Web Protocols . . . . . . . . . . . . . . . . . . . . . . . . . . . 6
2.1.2 Web Browsers . . . . . . . . . . . . . . . . . . . . . . . . . . . . . . . . . 8
2.2 Malware on the World Wide Web . . . . . . . . . . . . . . . . . . . . . . . . . . 8
2.2.1 Malicious Distribution Network . . . . . . . . . . . . . . . . . . . . . . . 10
2.2.2 Infection Vectors . . . . . . . . . . . . . . . . . . . . . . . . . . . . . . . . 14
2.3 Adversarial Information Retrieval Systems . . . . . . . . . . . . . . . . . . . . . 15
2.3.1 Adversarial Information Retrieval Objectives . . . . . . . . . . . . . . . . 16
2.3.2 What to Harvest . . . . . . . . . . . . . . . . . . . . . . . . . . . . . . . . 17
2.3.3 How to Harvest . . . . . . . . . . . . . . . . . . . . . . . . . . . . . . . . 18
vi
Table of Contents
2.3.4 Adversarial Concerns . . . . . . . . . . . . . . . . . . . . . . . . . . . . . 20
2.4 Related Work . . . . . . . . . . . . . . . . . . . . . . . . . . . . . . . . . . . . . 22
2.4.1 Studies of Malware on the Web . . . . . . . . . . . . . . . . . . . . . . . 22
2.4.2 Study of Blacklisting Techniques . . . . . . . . . . . . . . . . . . . . . . . 23
2.4.3 Fake AV Malware Distribution Networks . . . . . . . . . . . . . . . . . . 23
2.5 Summary . . . . . . . . . . . . . . . . . . . . . . . . . . . . . . . . . . . . . . . . 24
3 Preliminaries . . . . . . . . . . . . . . . . . . . . . . . . . . . . . . . . . . . . . . . . 25
3.1 Evaluating Zero-Provenance Malware Repositories . . . . . . . . . . . . . . . . . 28
3.2 Evaluating Fake AV Malware Distribution Networks . . . . . . . . . . . . . . . . 31
3.3 Summary . . . . . . . . . . . . . . . . . . . . . . . . . . . . . . . . . . . . . . . . 32
4 Approach . . . . . . . . . . . . . . . . . . . . . . . . . . . . . . . . . . . . . . . . . . 33
4.1 The Tachyon Detection Grid . . . . . . . . . . . . . . . . . . . . . . . . . . . . . 33
4.2 Data Validity Concerns . . . . . . . . . . . . . . . . . . . . . . . . . . . . . . . . 34
4.3 Simulation Methodology . . . . . . . . . . . . . . . . . . . . . . . . . . . . . . . 39
4.3.1 Pre-Simulation Data Processing . . . . . . . . . . . . . . . . . . . . . . . 39
4.3.2 Performing the Simulation . . . . . . . . . . . . . . . . . . . . . . . . . . 40
4.3.3 Measuring Re-Evaluation Improvements . . . . . . . . . . . . . . . . . . 40
5 Results . . . . . . . . . . . . . . . . . . . . . . . . . . . . . . . . . . . . . . . . . . . 43
5.1 Optimizing Re-Evaluation of Zero Provenance Malware Repositories . . . . . . . 43
5.1.1 Simulation Terminology . . . . . . . . . . . . . . . . . . . . . . . . . . . . 43
5.1.2 Malware Repository Data Set . . . . . . . . . . . . . . . . . . . . . . . . 44
5.1.3 Malware Repository Data Analysis . . . . . . . . . . . . . . . . . . . . . 45
5.1.4 Evaluation of Optimizations . . . . . . . . . . . . . . . . . . . . . . . . . 48
5.1.5 Summary . . . . . . . . . . . . . . . . . . . . . . . . . . . . . . . . . . . . 53
5.2 Optimizing Re-Evaluation Fake AV Distribution Networks . . . . . . . . . . . . 54
5.2.1 Fake AV Data Set . . . . . . . . . . . . . . . . . . . . . . . . . . . . . . . 54
5.2.2 Fake AV Data Analysis . . . . . . . . . . . . . . . . . . . . . . . . . . . . 54
5.2.3 Fake AV Network Re Evaluation Optimizations . . . . . . . . . . . . . . 60
vii
Table of Contents
5.2.4 Summary . . . . . . . . . . . . . . . . . . . . . . . . . . . . . . . . . . . . 61
6 Discussion . . . . . . . . . . . . . . . . . . . . . . . . . . . . . . . . . . . . . . . . . 64
6.1 Zero Provenance Malware Repositories . . . . . . . . . . . . . . . . . . . . . . . 64
6.1.1 Composition of Data Set . . . . . . . . . . . . . . . . . . . . . . . . . . . 64
6.1.2 Performance of Optimizations . . . . . . . . . . . . . . . . . . . . . . . . 66
6.1.3 Limitations . . . . . . . . . . . . . . . . . . . . . . . . . . . . . . . . . . . 68
6.2 Fake AV Malware Distribution Networks . . . . . . . . . . . . . . . . . . . . . . 69
6.2.1 Benefits of Identifying MDNs . . . . . . . . . . . . . . . . . . . . . . . . . 69
6.2.2 Limitations . . . . . . . . . . . . . . . . . . . . . . . . . . . . . . . . . . . 70
6.3 Design Considerations . . . . . . . . . . . . . . . . . . . . . . . . . . . . . . . . . 70
6.4 Monitoring Polymorphic Repositories . . . . . . . . . . . . . . . . . . . . . . . . 71
7 Conclusion . . . . . . . . . . . . . . . . . . . . . . . . . . . . . . . . . . . . . . . . . 73
7.1 Future Work . . . . . . . . . . . . . . . . . . . . . . . . . . . . . . . . . . . . . . 73
Bibliography . . . . . . . . . . . . . . . . . . . . . . . . . . . . . . . . . . . . . . . . . . 75
Appendices
A Appendix . . . . . . . . . . . . . . . . . . . . . . . . . . . . . . . . . . . . . . . . . . 80
A.1 Tachyon Detection Grid Architecture . . . . . . . . . . . . . . . . . . . . . . . . 80
A.1.1 System Components . . . . . . . . . . . . . . . . . . . . . . . . . . . . . . 80
A.1.2 System Events . . . . . . . . . . . . . . . . . . . . . . . . . . . . . . . . . 85
A.2 Zero Provenance Malware Repositories Tabular Data . . . . . . . . . . . . . . . 87
A.2.1 Probability of Update Behaviour Given Initial Detection . . . . . . . . . 87
A.2.2 Evaluation of Optimizations . . . . . . . . . . . . . . . . . . . . . . . . . 94
A.3 Fake AV MDN Tabular Data . . . . . . . . . . . . . . . . . . . . . . . . . . . . . 99
A.4 Blacklisting Case Studies . . . . . . . . . . . . . . . . . . . . . . . . . . . . . . . 101
A.4.1 Reactive Blacklisting of a Client IP - ZBot . . . . . . . . . . . . . . . . . 101
A.4.2 Assigning a single sample to each client IP - Swizzor . . . . . . . . . . . 102
A.4.3 Planet Lab Block . . . . . . . . . . . . . . . . . . . . . . . . . . . . . . . 102
viii
Table of Contents
A.4.4 Inconsistent DNS Responses . . . . . . . . . . . . . . . . . . . . . . . . . 103
A.4.5 Negative Responses to High Volume Client . . . . . . . . . . . . . . . . . 103
A.5 Survey Question and Answer . . . . . . . . . . . . . . . . . . . . . . . . . . . . . 103
ix
List of Tables
2.1 HTTP Response Code Values . . . . . . . . . . . . . . . . . . . . . . . . . . . . . 7
5.1 Malware Repositories: Update Behaviour Distribution . . . . . . . . . . . . . . . 45
5.2 Malware Repositories: Cutoff Seed Parameters . . . . . . . . . . . . . . . . . . . 48
5.3 Fake AV MDN Statistics . . . . . . . . . . . . . . . . . . . . . . . . . . . . . . . . 56
A.1 Conditional Probability of Update Behaviours . . . . . . . . . . . . . . . . . . . . 92
A.2 Malware Repositories: Update Behaviour Probabilities . . . . . . . . . . . . . . . 93
A.3 Malware Repositories Simulation: Varying Re-Evaluation Interval . . . . . . . . . 94
A.4 Malware Repositories Simulation: Low Fetch Interval (1hr) . . . . . . . . . . . . 95
A.5 Malware Repositories Simulation: Best Optimization Combination For Intervals . 96
A.6 Malware Repositories Simulation: Vary Conditional Probability Parameters . . . 97
A.7 Malware Repositories Simulation: Different State Cutoff Thresholds . . . . . . . 97
A.8 Malware Repositories Simulation: Different State Backoff Parameters . . . . . . . 98
A.9 Fake AV MDN Simulation: Varying Re-Evaluation Interval . . . . . . . . . . . . 99
A.10 Fake AV MDN Simulation: Impact of Optimizations . . . . . . . . . . . . . . . . 100
A.11 α value Survey Results . . . . . . . . . . . . . . . . . . . . . . . . . . . . . . . . . 105
x
List of Figures
2.1 URL Decomposition . . . . . . . . . . . . . . . . . . . . . . . . . . . . . . . . . . 7
2.2 HTTP Request Response Example . . . . . . . . . . . . . . . . . . . . . . . . . . 7
2.3 Attack Scenario Showing Components of MDN . . . . . . . . . . . . . . . . . . . 9
2.4 Pay Per Install Roles . . . . . . . . . . . . . . . . . . . . . . . . . . . . . . . . . . 10
2.5 Dynamic Nature of MDN . . . . . . . . . . . . . . . . . . . . . . . . . . . . . . . 12
2.6 MDN Configurations . . . . . . . . . . . . . . . . . . . . . . . . . . . . . . . . . . 15
3.1 URL State Model for Malware Repositories . . . . . . . . . . . . . . . . . . . . . 27
4.1 Tachyon Detection Grid Architecture . . . . . . . . . . . . . . . . . . . . . . . . . 34
5.1 Malware Repository State Transition Distributions . . . . . . . . . . . . . . . . . 47
5.2 Repository Simulation: Varying Re-Evaluation Interval . . . . . . . . . . . . . . . 49
5.3 Repository Simulation: Optimizations at 1 hour Interval . . . . . . . . . . . . . . 51
5.4 Repository Simulation: Optimizations at Multiple Intervals . . . . . . . . . . . . 52
5.5 Fake AV MDN Repository Patterns . . . . . . . . . . . . . . . . . . . . . . . . . . 55
5.6 Fake AV Repository Lifetimes . . . . . . . . . . . . . . . . . . . . . . . . . . . . . 57
5.7 Fake AV MDN Screen Profiling Code Sample . . . . . . . . . . . . . . . . . . . . 58
5.8 MDN Blacklisting Over Time . . . . . . . . . . . . . . . . . . . . . . . . . . . . . 59
5.9 Fake AV MDN Simulation: Varying Re-Evaluation Interval . . . . . . . . . . . . 61
5.10 Fake AV MDN Re-Evaluation Optimization 1 . . . . . . . . . . . . . . . . . . . . 62
5.11 Fake AV MDN Re-Evaluation Optimization 2 . . . . . . . . . . . . . . . . . . . . 62
A.1 Tachyon Detection Grid Architecture . . . . . . . . . . . . . . . . . . . . . . . . . 81
A.2 Example Experiment Definition . . . . . . . . . . . . . . . . . . . . . . . . . . . . 82
xi
List of Figures
A.3 Example URL Summary . . . . . . . . . . . . . . . . . . . . . . . . . . . . . . . . 84
A.4 URL Attribute Tuples . . . . . . . . . . . . . . . . . . . . . . . . . . . . . . . . . 86
xii
Glossary
AV Anti Virus
AIR Adversarial Information Retrieval
CDF Cumulative Distribution Function
DB Database
DNS Domain Name System
FP False Positive
HC Honey Client
HIHC High Interaction Honey Client
HTML Hypertext Markup Language
HTTP Hypertext Transfer Protocol
IP Internet Protocol
JS Java Script
LIHC Low Interaction Honey Client
LWP Perl WWW Library
MDN Malware Distribution Network
MIHC Medium Interaction Honey Client
NAT Network Address Translation
xiii
Glossary
RFC Request for Comment
RRT Repository Re-Evaluation Threshold
SEO Search Engine Optimization
SQL Structured Query Language
SSH Secure Shell
TCP/IP Transmission Control Protocol/Internet Protocol
TDG Tachyon Detection Grid
TDS Traffic Direction System
TLD Top Level Domain
URL Uniform Resource Locator
WWW World Wide Web
xiv
Acknowledgments
Thanks to everyone in SophosLabs for their invaluable expertise and constant feedback during
my research. Specifically Onur, Dmitry, Mike, Mike, Mike, Dave, David, Jeff, Sean, and Brett.
Thanks to SophosLabs for all the hardware, bandwidth, and time off to complete the work.
Thanks to my supervising professors: Konstantin Beznosov and Matei Ripeanu. Without their
wisdom and guidance this would not be possible. Thanks to Yazan Boshmaf for his feedback
on the thesis.
Thanks to the anonymous reviewers at WebQuality2011.
Thanks to my parents and my awesome syster.
xv
Chapter 1
Introduction
The installation of malicious software, or malware, on computers is a profitable activity for
criminal organizations [FPPS07, SGAK+11]. The web has become one of most effective mecha-
nisms for the installation of malware. This shift to the web as the delivery mechanism of choice
is attributed to three trends: the increasing prevalence of perimeter network security devices,
the increasing complexity of modern web browsers, and the abundance of insecure web servers
on the Web [PMRM08].
Given this shift to the malware delivered over the web, information security researchers con-
stantly download web content and system executables from the Internet looking for new threats.
I refer to the systems used to accomplish this task as Adversarial Information Retrieval (AIR)
systems. The typical goal in this information retrieval scenario is to get the same treatment as
the average Internet user: that is, to receive a malicious executable, often via a path of redi-
rections, culminating in a browser exploit or social engineering trick to initiate the download of
a malicious executable file onto the victim computer [PMRM08]. The data collected by secu-
rity researchers is used to update Uniform Resource Locator (URL) blocklists1 and anti-virus
detections for malicious executable files and web content.
The task of studying MDNs is adversarial in nature: behind the networks and the binaries
is a group of humans that change their behaviour to counter the efforts of security researchers.
The adversarial nature of the problem introduces several challenges to effective AIR on the web.
The first challenge is the dynamic nature of MDNs. These networks are typically composed
of multiple layers of servers, each playing a different role in the malware delivery chain. The
links between servers, and the content served by each server, including the malicious binary,
are constantly updated to evade the efforts of security researchers. The second challenge is
1Terminology clarification: a blocklist is a list of resources to block. Blacklisting is the act of using a blocklistto change a response.
1
Chapter 1. Introduction
the adversarial countermeasure of blacklisting, where an MDN identifies the components of a
security AIR system and alters its behaviour when studied by the AIR system. These challenges
lead to two problems in AIR system design, which this research addresses:
1. Scalability: There are too many URLs to evaluate. The volume of new URLs is
such that AIR systems are in a constant state of work; there is always a backlog of URLs
awaiting initial or subsequent evaluation. New suspicious URLs are constantly discovered,
and confirmed malicious URLs must be periodically re-evaluated for content updates, due
to the dynamic nature of MDNs.
2. Accuracy of Content: URL evaluation can be tainted by blacklisting. Blacklist-
ing occurs because the AIR system repeatedly visit the same servers, and they visit many
different servers controlled by the same organization. This repetitive downloading leaves
patterns in HTTP server logs that can be identified by malicious adversaries. If a client
has been identified, the MDN can alter content, which limits the effectiveness of the AIR
system.
I attempt to address these problems by reducing the number of re-evaluations necessary to
discover the same amount of new malicious content. My research takes the following approach:
• Systematically study malicious web sites over time to identify the distribution and preva-
lence of MDN update behaviours.
• Develop and evaluate optimizations to the re-evaluation logic of AIR systems based on
update behaviours observed.
• Identify the prevalence of IP blacklisting by malware networks, and propose strategies to
cope with blacklisting of AIR resources.
I studied this problem within the context of two common AIR scenarios: (1) investigating
malware repositories with no associated provenance2, and (2) MDNs serving fake anti-virus
(Fake AV) software. I developed a research focused AIR system capable of controlling multiple
HTTP clients and performing precise URL re-evaluations over long periods of time. This system
2Provenance refers to the history of ownership. It is used in sensor network and security research to refer tothe source of information. I adopt it to refer to the sites that lead to a malware repository.
2
Chapter 1. Introduction
produced a corpus of over 500,000 Hypertext Transfer Protocol (HTTP) Traces3 from over 9000
malicious URLs over a period of two months. I analyze this corpus to determine MDN update
patterns, which are presented in detail. Based on the observed update behaviours, multiple
optimizations to the AIR system re-evaluation component are proposed and then evaluated.
Throughout the data collection phase, I monitored for signs of blacklisting, and discard any
data that is potentially tainted by blacklisting.
Through simulation I show that the optimizations in the zero provenance malware repository
scenario reduce the number of URL re-evaluations by 80-93% (depending on the re-evaluation
interval), with a corresponding drop in malware discovery rate of only 2-7%. The optimizations
in the Fake AV MDN scenario reduce the number of re-evaluations by over 90% with small
reductions in malware discovery rates that vary depending on the update behaviour of the
MDN.
This thesis provides the following contributions:
• I propose and evaluate three optimization techniques that apply to the case of directly re-
evaluating malware repositories. These techniques can reduce the required fetch volume by
80-93% (depending on the re-evaluation interval) with a corresponding impact on sample
discovery rate of only 2-7% compared to a fixed-interval scheduler with no optimizations
applied.
• I propose and evaluate two optimization techniques that apply to the specific case of
monitoring MDNs used to distribute Fake Anti Virus (AV) malware. These techniques
can reduce fetch volume by over 90% with a sample discovery rate drop of under 10%
compared to fixed-interval scheduler that re-evaluates all landing pages of a single MDN
independently.
• I provide fresh data that contributes to the study of a challenging adversary in the secu-
rity community: fake AV distributors. My study confirms that several of the statistical
observations provided by Rajab et al. in [RBM+10] are still valid, over 18 months after
their study. Analysis of the data I collected provides new insights with regards to unique
3I adopt the terminology used by Zhang et al. in [ZSSL11]. An HTTP Trace is a log of all HTTP trafficgenerated by visiting a URL, which typically includes meta data about how the trace was generated. Note thatI use the terms fetch log and HTTP Trace interchangeably.
3
Chapter 1. Introduction
affiliate behaviours and the use of IP blacklisting countermeasures.
The thesis is organized into the following chapters. Chapter 2 provides necessary background
information and also incorporates a survey of related work. Chapter 3 discusses AIR systems,
focusing on the two problems identified above, and proposes optimizations to address these
problems. Chapter 4 presents the system that collected data and the approach I used to
analyze the data and perform simulations. Chapter 5 presents results of data collection and
analysis. Discussion of these results is provided in Chapter 6, and Chapter 7 concludes.
4
Chapter 2
Background
This chapter provides background on the problem space. Section 2.1 provides a brief overview
of Internet technologies. Section 2.2 discusses the exploitation of these technologies to spread
malware. Section 2.3 introduces the use of AIR systems to monitor malware on the web,
Section 2.4 provides an overview of related work, and Section 2.5 summarizes the chapter.
2.1 Mechanics of the World Wide Web
The World Wide Web (WWW) is a collection of technologies built on top of the Internet that
allows the delivery of a wide range of services to web users. Web browsing is one of the
most common user tasks on the WWW and is the focus of this section. Each WWW resource
is identified by a unique Uniform Resource Locator (URL) [BLMM94]. Web users employ
web browsers (e.g., Microsoft Internet Explorer, Mozilla Firefox, Google Chrome) to retrieve
content from the web. Web browsers use several technologies to achieve this task. The steps
(and enabling technologies) taken by a web browser to retrieve content given a URL are listed
below. The technologies listed are briefly described in Section 2.1.1; a detailed treatment of
these technologies (i.e., TCP/IP, DNS, and HTTP) can be found in [KR07].
1. The URL is separated into domain, path and query components.
2. The Internet Protocol (IP) address of the domain is determined by making a Domain
Name System (DNS) query.
3. A Transmission Control Protocol/Internet Protocol (TCP/IP) connection is established
with the web server.
4. An HTTP GET request is sent to the web server.
5
2.1. Mechanics of the World Wide Web
5. The content is extracted from the HTTP response.
6. The content is displayed by the browser, or a plugin is invoked to interpret the content,
depending on the content-type header.
2.1.1 Essential Web Protocols
Web browsers use many technologies to communicate with web servers. This section focuses
on the essential protocols used during basic browsing. When a browser is instructed to fetch a
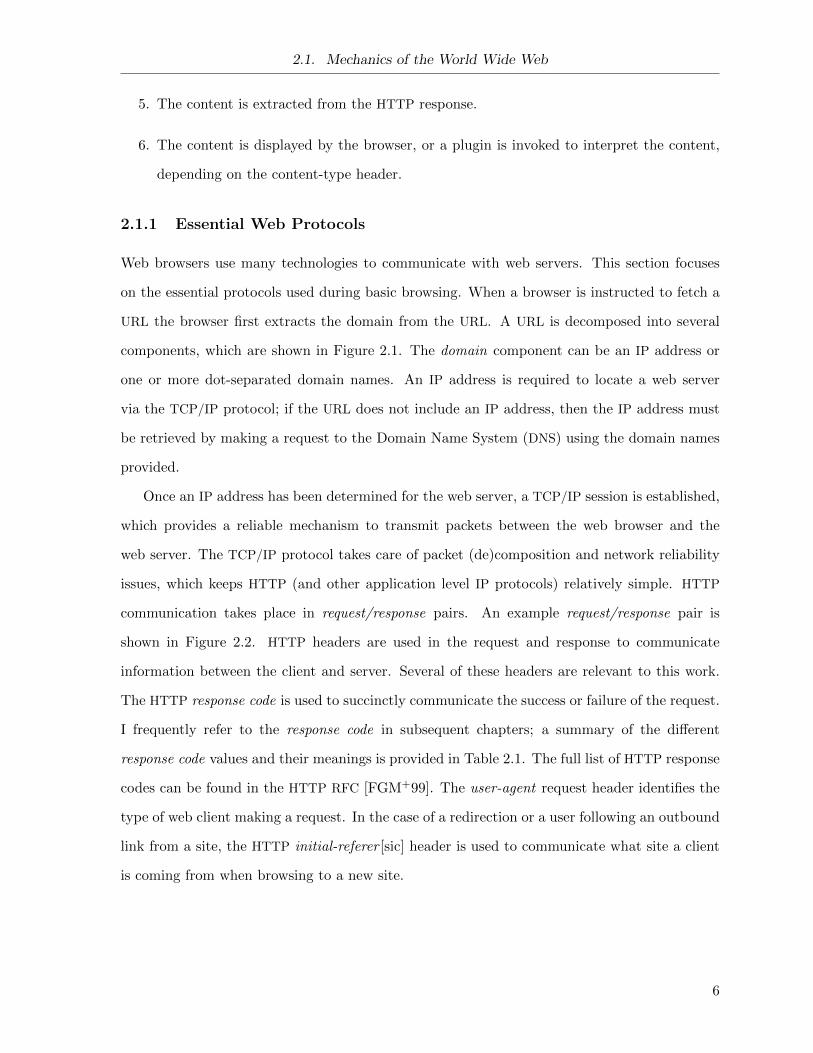
URL the browser first extracts the domain from the URL. A URL is decomposed into several
components, which are shown in Figure 2.1. The domain component can be an IP address or
one or more dot-separated domain names. An IP address is required to locate a web server
via the TCP/IP protocol; if the URL does not include an IP address, then the IP address must
be retrieved by making a request to the Domain Name System (DNS) using the domain names
provided.
Once an IP address has been determined for the web server, a TCP/IP session is established,
which provides a reliable mechanism to transmit packets between the web browser and the
web server. The TCP/IP protocol takes care of packet (de)composition and network reliability
issues, which keeps HTTP (and other application level IP protocols) relatively simple. HTTP
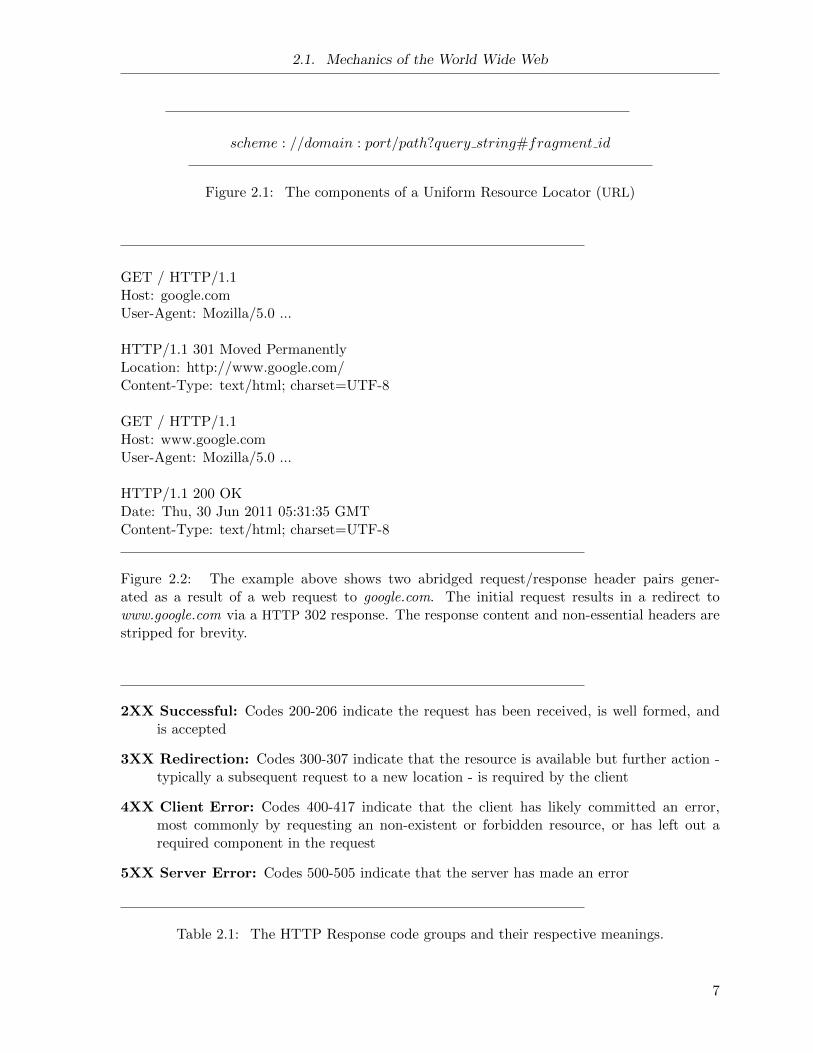
communication takes place in request/response pairs. An example request/response pair is
shown in Figure 2.2. HTTP headers are used in the request and response to communicate
information between the client and server. Several of these headers are relevant to this work.
The HTTP response code is used to succinctly communicate the success or failure of the request.
I frequently refer to the response code in subsequent chapters; a summary of the different
response code values and their meanings is provided in Table 2.1. The full list of HTTP response
codes can be found in the HTTP RFC [FGM+99]. The user-agent request header identifies the
type of web client making a request. In the case of a redirection or a user following an outbound
link from a site, the HTTP initial-referer [sic] header is used to communicate what site a client
is coming from when browsing to a new site.
6
2.1. Mechanics of the World Wide Web
scheme : //domain : port/path?query string#fragment id
Figure 2.1: The components of a Uniform Resource Locator (URL)
GET / HTTP/1.1Host: google.comUser-Agent: Mozilla/5.0 ...
HTTP/1.1 301 Moved PermanentlyLocation: http://www.google.com/Content-Type: text/html; charset=UTF-8
GET / HTTP/1.1Host: www.google.comUser-Agent: Mozilla/5.0 ...
HTTP/1.1 200 OKDate: Thu, 30 Jun 2011 05:31:35 GMTContent-Type: text/html; charset=UTF-8
Figure 2.2: The example above shows two abridged request/response header pairs gener-ated as a result of a web request to google.com. The initial request results in a redirect towww.google.com via a HTTP 302 response. The response content and non-essential headers arestripped for brevity.
2XX Successful: Codes 200-206 indicate the request has been received, is well formed, andis accepted
3XX Redirection: Codes 300-307 indicate that the resource is available but further action -typically a subsequent request to a new location - is required by the client
4XX Client Error: Codes 400-417 indicate that the client has likely committed an error,most commonly by requesting an non-existent or forbidden resource, or has left out arequired component in the request
5XX Server Error: Codes 500-505 indicate that the server has made an error
Table 2.1: The HTTP Response code groups and their respective meanings.
7
2.2. Malware on the World Wide Web
2.1.2 Web Browsers
Web browsers provide the user with a way to interact with the WWW. Early browsers were
relatively simple applications that fulfilled the client role of the HTTP exchange and rendered
basic Hypertext Markup Language (HTML) content to the user. The browsers of 2011, such as
Microsoft Internet Explorer, Mozilla Firefox, Google Chrome, and Apple Safari, render a wide
variety of content and perform complex client side operations encoded in ECMAScript [Ass99]
based languages (e.g., JavaScript). To handle increasingly complex and diverse content types,
web browsers use code plug-ins to handle specific content types. These extensions are often
written and maintained by third-party organizations.
2.2 Malware on the World Wide Web
The installation of malicious software on computers has become a profitable activity for criminal
organizations [FPPS07, SGAK+11]. The means to perform this installation have evolved over
time. In the earliest days of malware a virus would embed itself in files on the local system and
wait to be transferred to new hosts by natural propagation of the infected files (e.g., removable
media, network file transfer). These viruses had no means of self-propagation. With the increas-
ing connectedness of computing systems came the rise of network worms, which exploited vulner-
abilities in network services to spread from host to host [CER01a, CER01b, CER03a, CER03b].
The exploitation of vulnerable network services as a means to spread malware has become less
effective due to the increased deployment of Network Address Translation (NAT) and firewalls,
which prevent untrusted incoming network traffic [PMM+07].
At this point, the web became, and is still currently, the delivery mechanism of choice for
malware distributors. The increasing prevalence of perimeter network security devices coincided
with the increasing complexity of modern browsers mentioned in Section 2.1.2. This increasing
complexity and reliance on externally developed code plugins has greatly increased the attack
surface of the web browser. The SANS Top Cyber Security Risks report [SAN09] consistently
lists “web browsers and client side applications that can be invoked by web browsers” as some
of the most exploited client side applications.
The tactics of any single instance of a web-based malware infection vary in several ways,
8
2.2. Malware on the World Wide Web
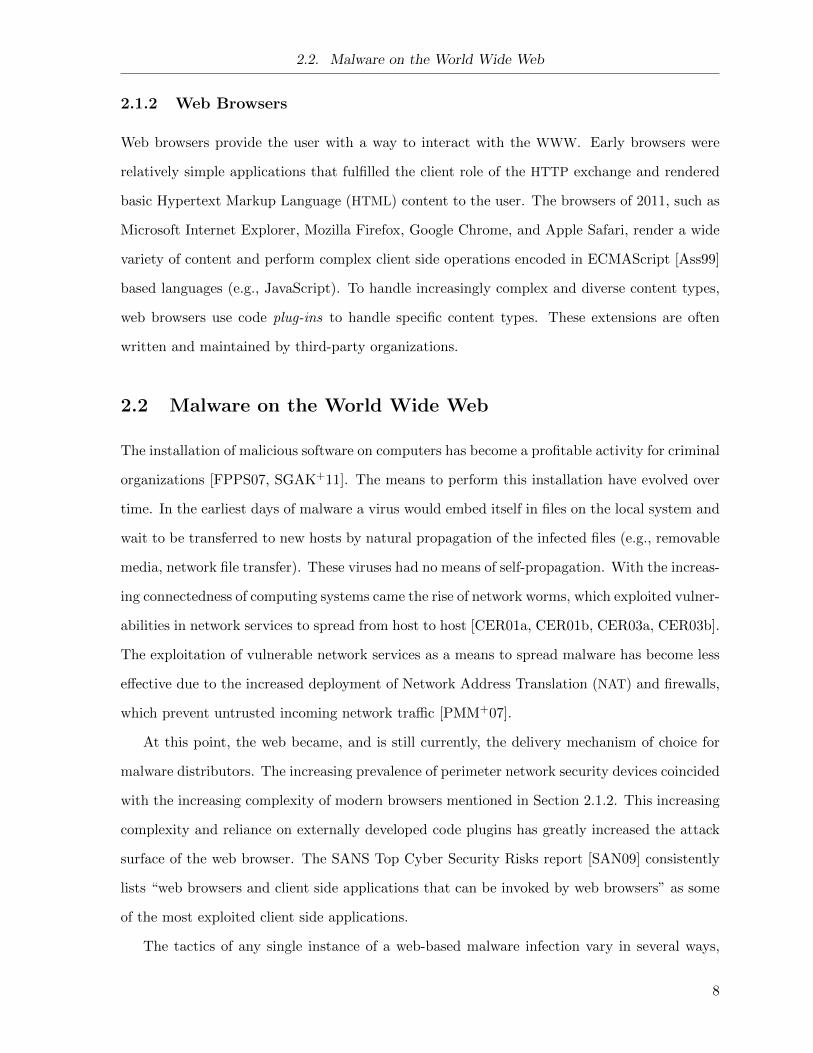
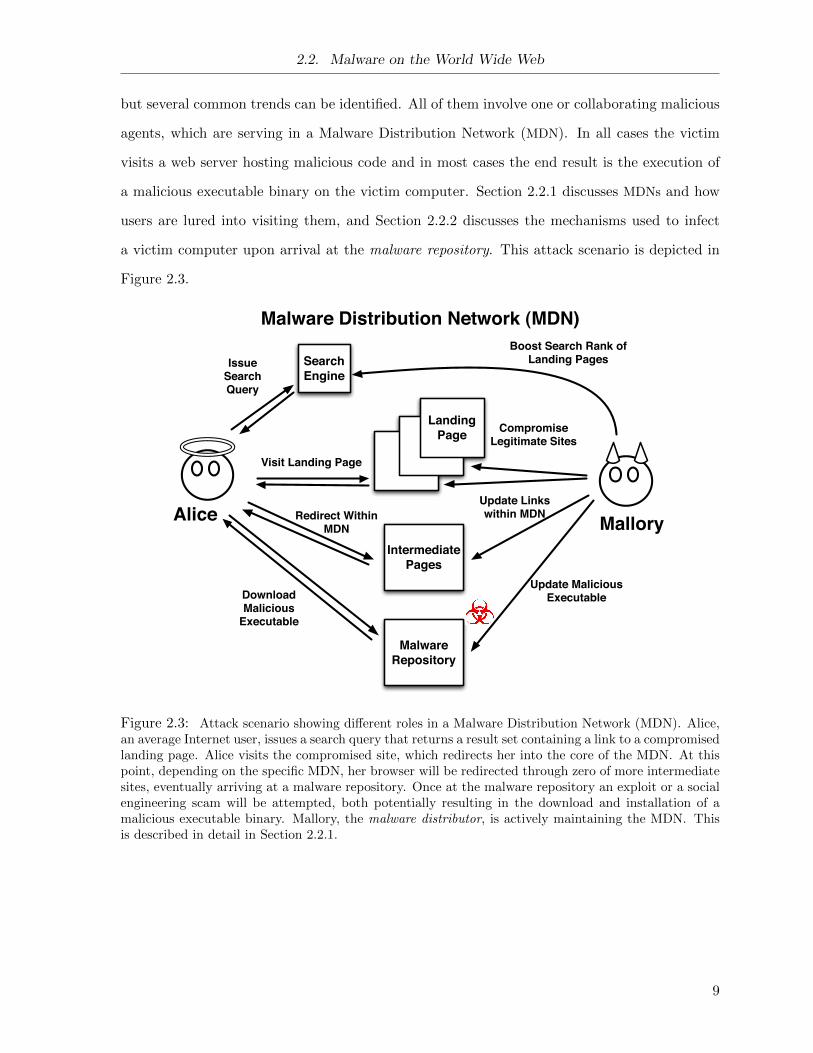
but several common trends can be identified. All of them involve one or collaborating malicious
agents, which are serving in a Malware Distribution Network (MDN). In all cases the victim
visits a web server hosting malicious code and in most cases the end result is the execution of
a malicious executable binary on the victim computer. Section 2.2.1 discusses MDNs and how
users are lured into visiting them, and Section 2.2.2 discusses the mechanisms used to infect
a victim computer upon arrival at the malware repository. This attack scenario is depicted in
Figure 2.3.
Landing Page
IntermediatePages
Malware Repository
Search Engine
Issue Search Query
Visit Landing Page
Redirect Within MDN
Download Malicious
Executable
Boost Search Rank of Landing Pages
Compromise Legitimate Sites
Update Links within MDN
Update Malicious Executable
MalloryAlice
Malware Distribution Network (MDN)
Figure 2.3: Attack scenario showing different roles in a Malware Distribution Network (MDN). Alice,an average Internet user, issues a search query that returns a result set containing a link to a compromisedlanding page. Alice visits the compromised site, which redirects her into the core of the MDN. At thispoint, depending on the specific MDN, her browser will be redirected through zero of more intermediatesites, eventually arriving at a malware repository. Once at the malware repository an exploit or a socialengineering scam will be attempted, both potentially resulting in the download and installation of amalicious executable binary. Mallory, the malware distributor, is actively maintaining the MDN. Thisis described in detail in Section 2.2.1.
9
2.2. Malware on the World Wide Web
2.2.1 Malicious Distribution Network
Malware distributors on the web, like so many in e-commerce, live and die by click traffic
[Sam09]. Irrespective of the sophistication of the malicious binary or the exploit used to trigger
the binary download, the MDN will experience no success unless there is a stream of victims
entering the network. It is worth briefly noting that there is a trend toward specialization of
certain parts of the malware delivery chain [CGKP11, Rad09]. The individuals compromising
web servers in order to redirect to a malware repository are not necessarily the same individuals
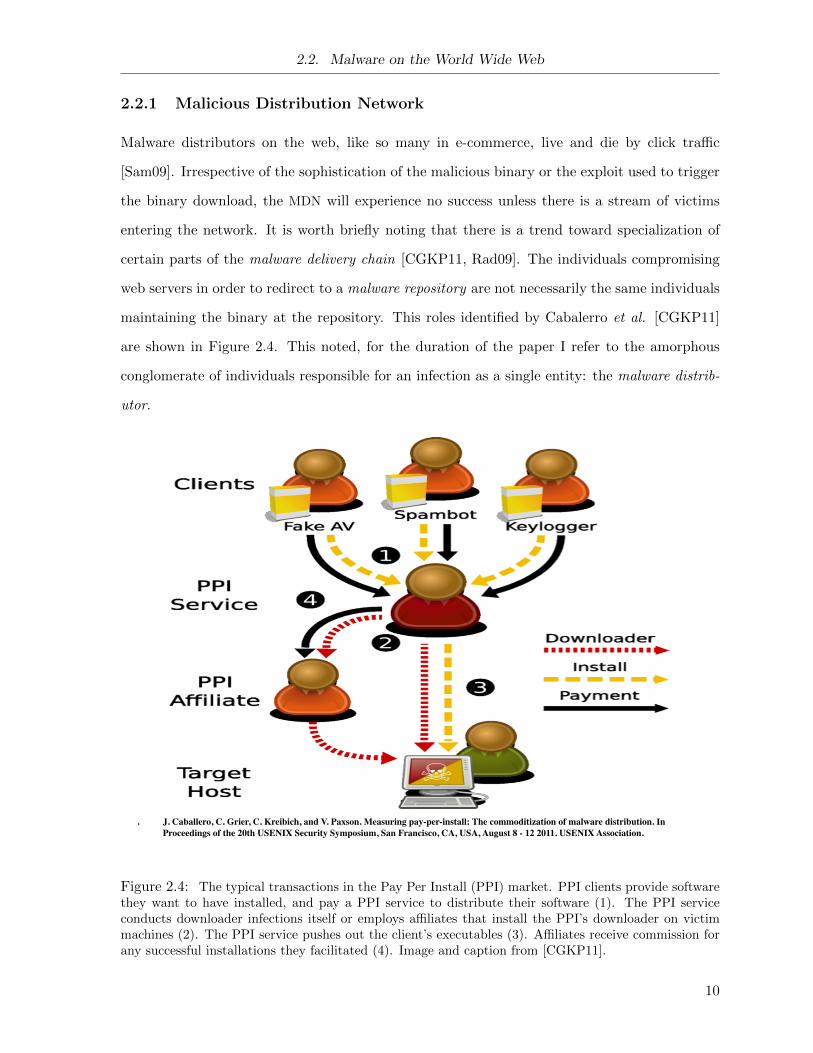
maintaining the binary at the repository. This roles identified by Cabalerro et al. [CGKP11]
are shown in Figure 2.4. This noted, for the duration of the paper I refer to the amorphous
conglomerate of individuals responsible for an infection as a single entity: the malware distrib-
utor.
. J. Caballero, C. Grier, C. Kreibich, and V. Paxson. Measuring pay-per-install: The commoditization of malware distribution. In Proceedings of the 20th USENIX Security Symposium, San Francisco, CA, USA, August 8 - 12 2011. USENIX Association.
Figure 2.4: The typical transactions in the Pay Per Install (PPI) market. PPI clients provide softwarethey want to have installed, and pay a PPI service to distribute their software (1). The PPI serviceconducts downloader infections itself or employs affiliates that install the PPI’s downloader on victimmachines (2). The PPI service pushes out the client’s executables (3). Affiliates receive commission forany successful installations they facilitated (4). Image and caption from [CGKP11].
10
2.2. Malware on the World Wide Web
The click traffic (i.e., a users web browser being directed into the network) is achieved
through the control of landing pages. The remainder of this section discusses landing pages,
and the structure and dynamic nature of MDNs.
Landing Pages
Toward the goal of click traffic the malware distributor has two options: create or compromise.
Both strategies are used on the WWW and worth briefly describing.
Software is available (e.g., ’jonn22’) to aid malware distributors in quickly generating content
that ranks high in web searches [Sam09]. The distributor can link their pages together in order
to boost the search rank and resultant click volume. Compared to the compromise option,
creating is more expensive in terms of time and money, and search engines are becoming more
tuned to detect and punish auto-generated pages [Cut11]. For these reasons, it is more common
for a malware distributor to inject code into a legitimate site and leverage the existing reputation
and popularity of the site.
There are multiple means in which a legitimate site can be made to serve as a landing page
in a malicious network. There are many commercial and open source HTTP servers available,
most popular being Apache and Microsoft IIS [Net11]. On top of these software packages are
content management platforms such as Drupal [Dru11] and WordPress [Wor11]. Each of these
widely deployed components, the content management platforms in particular, contain bugs,
some of which become vulnerabilities once a means is discovered to exploit the bug. Exploit
kits (e.g., phoenix exploit kit [Vil11], blackhole exploit kit [Puz11]) are available that contain
exploits targeting specific versions of vulnerable software. These kits often include the search
terms that can be used to find vulnerable servers [JYX+11]. Once a server is found the kit
code makes execution of the exploit trivial, allowing attackers to add and alter content on the
legitimate site. In much the same manner as the create scenario described above, attackers
commonly deploy Search Engine Optimization (SEO) kits in order to automatically generate
popular content and cross-link with other compromised sites, further boosting traffic to the
compromised site [HK10].
It is not necessary for the attacker to fully compromise the web hosting software in order
to inject content. Many sites rely on user submitted content and advertising networks for
11
2.2. Malware on the World Wide Web
content. This provides two new vectors for an attacker to inject code into the rendered content
presented to a web user upon visiting the site. Sites that rely upon user content often store
this data in a Database (DB) and generate the web markup dynamically by querying the DB.
The attacker can inject the redirection code into the content DB by exploiting one of many
known SQL injection vulnerabilities [MIT11], and it will be rendered to users by the content
management platform when they visit the page. This type of injected content is harder for web
administrators to detect because it cannot be caught when inspecting the static content of a
web site.
Landing Page1
Redirector1
Redirector2
Malware Repository1
Malware Repository2
Landing Page1Landing Page1Landing
PageN
1
2
Landing Page1
Redirector1
Redirector2
Malware Repository1
Malware Repository2
1
2
Malware Delivery Tree , time = 0
Malware Delivery Tree , time = 1
Landing Page1Landing Page1Landing
PageN
Alice
Alice
Malware Distribution Network Update Behaviour
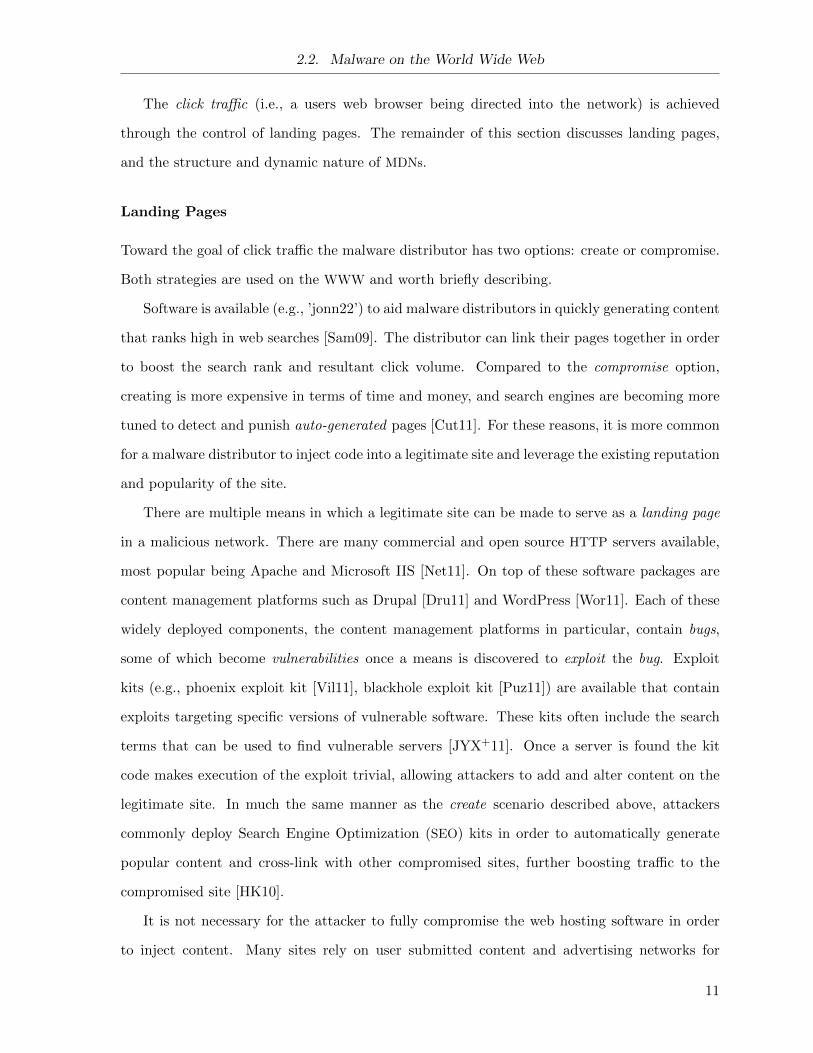
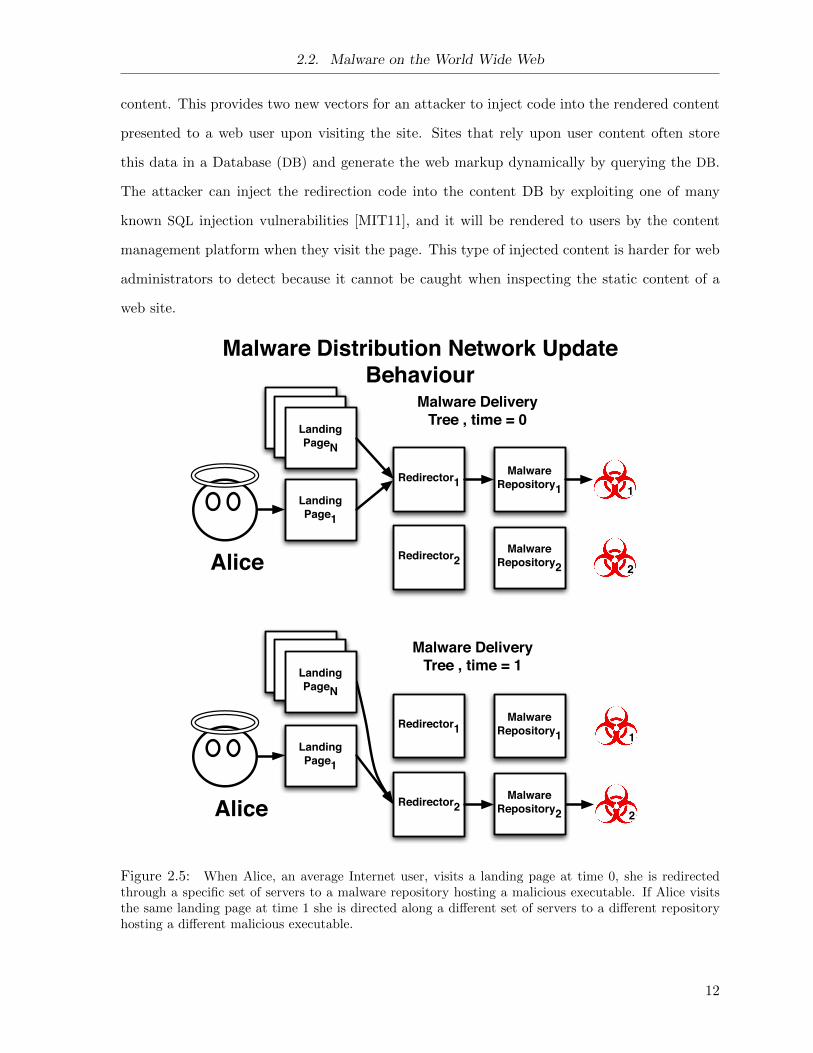
Figure 2.5: When Alice, an average Internet user, visits a landing page at time 0, she is redirectedthrough a specific set of servers to a malware repository hosting a malicious executable. If Alice visitsthe same landing page at time 1 she is directed along a different set of servers to a different repositoryhosting a different malicious executable.
12
2.2. Malware on the World Wide Web
The landing page is rarely the same page used to deliver the exploit or perform the social
engineering scam. The injected code on the landing page is most commonly a small piece of code
that will either redirect the browser (henceforth referred to shorthand as redirection) to another
site or cause the browser to download content through the use of embedded elements such as
iframe or img tags (henceforth referred to as embedding). The redirection/embedding will lead
directly or indirectly (in some cases there are multiple intermediate servers that redirect the
victim) to a malware repository responsible for carrying out the actual attack. This attack
scenario is depicted in Figure 2.3. The differences between redirection and embedding are not
relevant to this research and are used interchangeably for the remainder of the paper.
Structure
MDNs are composed of several components and are sometimes very dynamic in nature: the path
of redirection from the landing page to the malicious executable (i.e., the malware delivery tree
or the malware redirection chain), as well as the malware executables themselves, are frequently
updated. Figure 2.5 shows how the malware delivery chain changes between two visits to the
same MDN.
Two factors contributing to the dynamic nature are:
1. URL Blocklists and AV Detection: An MDN must constantly change domains to avoid
URL blocklists and takedown requests. Executables are constantly modified to evade AV
detections.
2. Pricing Differentials: A single MDN can serve as an affiliate for multiple PPI providers (see
Figure 2.4 for list of PPI roles). Each provider has a different price payment scheme, and
certain traffic (e.g., a Canadian IP address) will be more valuable to one PPI provider.
Several features of the MDN change over time:
Landing Pages
Each compromised landing page is kept active as long as possible. The churn in landing pages
over time is primarily based on newly compromised sites entering the network and site disin-
13
2.2. Malware on the World Wide Web
fections removing landing pages from the network.4.
Intermediate Sites
Not all MDNs have intermediate hops between the landing page and the distribution site. Re-
search suggests the intermediate sites are likely a Traffic Direction System (TDS), that routes
traffic to maximize profit based on the current click-traffic market [CGKP11]. If this is the
case, the lifetime is hard to predict for the intermediate elements.
Malware Repositories
The full URL and domains used for the repositories are rotated to avoid URL blocklists and the
samples are frequently updated to avoid AV detections. The update frequency of the malicious
executable (I interchangeably use the terms binary, executable, and sample to refer to the
malicious executable) served by a malware repository varies depending on the MDN. I classify
a repository into three categories of sample update behaviours:
Single Sample Repository A repository that does not update the malicious executable for
the lifetime of the repository.
Multiple Sample Repository A repository that performs updates to the malicious exe-
cutable over time, but is not generating the samples for each request.
Polymorphic Repository A repository that produces a unique malicious executable for every
download request. [She08].
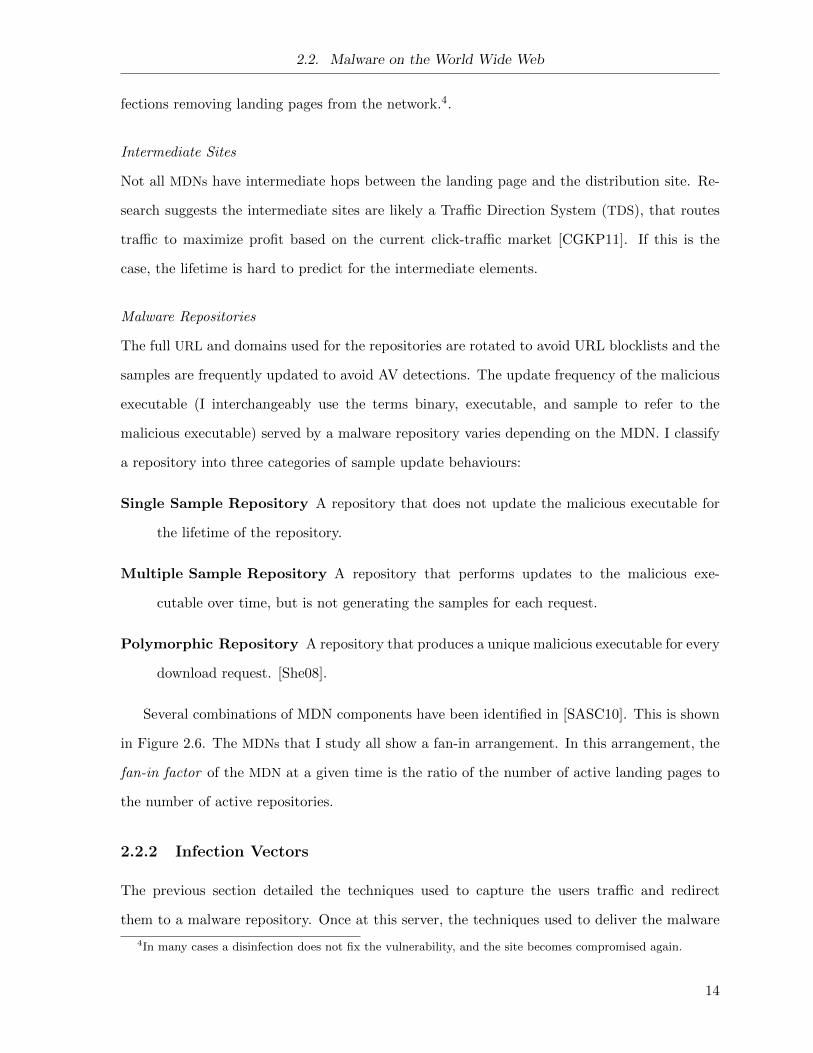
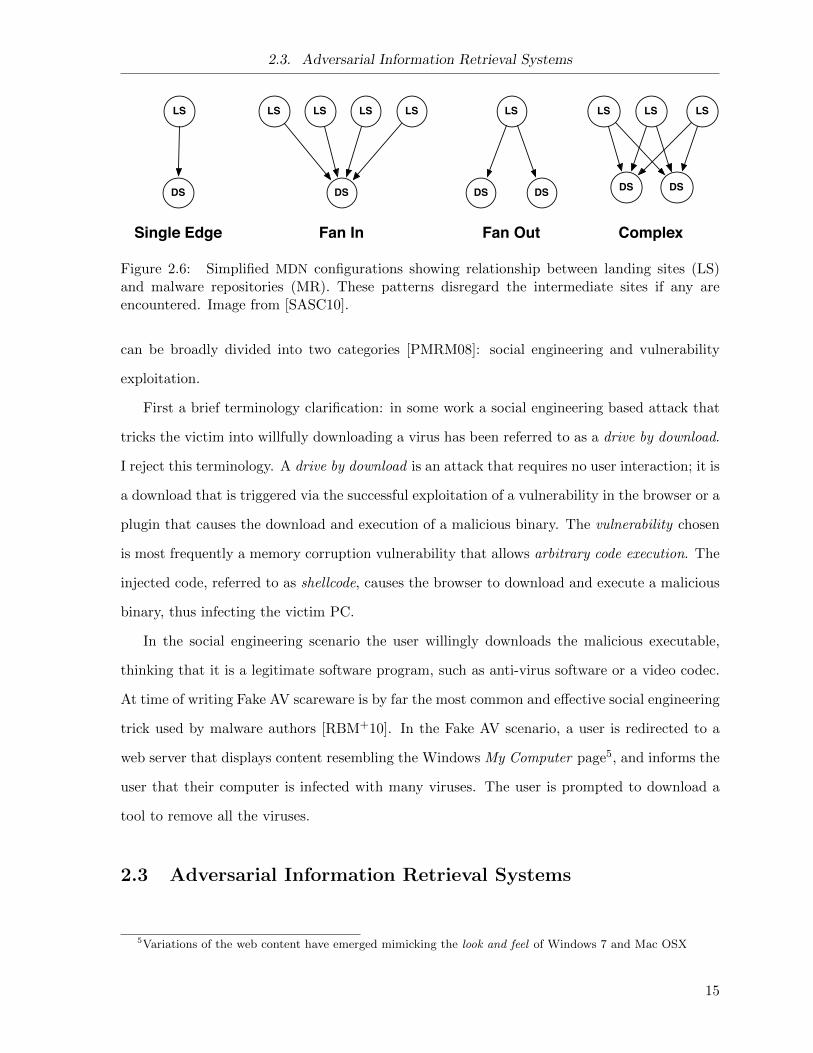
Several combinations of MDN components have been identified in [SASC10]. This is shown
in Figure 2.6. The MDNs that I study all show a fan-in arrangement. In this arrangement, the
fan-in factor of the MDN at a given time is the ratio of the number of active landing pages to
the number of active repositories.
2.2.2 Infection Vectors
The previous section detailed the techniques used to capture the users traffic and redirect
them to a malware repository. Once at this server, the techniques used to deliver the malware
4In many cases a disinfection does not fix the vulnerability, and the site becomes compromised again.
14
2.3. Adversarial Information Retrieval Systems
LS
DS
Single Edge
LS LS LS LS
DS
Fan In
LS
DS DS
Fan Out
LS LS LS
DSDS
Complex
Figure 2.6: Simplified MDN configurations showing relationship between landing sites (LS)and malware repositories (MR). These patterns disregard the intermediate sites if any areencountered. Image from [SASC10].
can be broadly divided into two categories [PMRM08]: social engineering and vulnerability
exploitation.
First a brief terminology clarification: in some work a social engineering based attack that
tricks the victim into willfully downloading a virus has been referred to as a drive by download.
I reject this terminology. A drive by download is an attack that requires no user interaction; it is
a download that is triggered via the successful exploitation of a vulnerability in the browser or a
plugin that causes the download and execution of a malicious binary. The vulnerability chosen
is most frequently a memory corruption vulnerability that allows arbitrary code execution. The
injected code, referred to as shellcode, causes the browser to download and execute a malicious
binary, thus infecting the victim PC.
In the social engineering scenario the user willingly downloads the malicious executable,
thinking that it is a legitimate software program, such as anti-virus software or a video codec.
At time of writing Fake AV scareware is by far the most common and effective social engineering
trick used by malware authors [RBM+10]. In the Fake AV scenario, a user is redirected to a
web server that displays content resembling the Windows My Computer page5, and informs the
user that their computer is infected with many viruses. The user is prompted to download a
tool to remove all the viruses.
2.3 Adversarial Information Retrieval Systems
5Variations of the web content have emerged mimicking the look and feel of Windows 7 and Mac OSX
15
2.3. Adversarial Information Retrieval Systems
Given the prevalence of malicious web content on the Internet, Anti Virus (AV) firms must
continually identify MDNs and harvest their content. In this research I refer to the systems
that are responsible for this task as Adversarial Information Retrieval systems. I divide the
discussion of these systems into why evaluate (and re-evaluate) URLs (Section 2.3.1), which
URLs to evaluate (Section 2.3.2), and how to evaluate URLs (Section 2.3.3). Answering the
question of when to evaluate URLs, more precisely when to re-evaluate, is the fundamental
question addressed in this thesis; thus this is addressed separately in Chapter 3.
2.3.1 Adversarial Information Retrieval Objectives
The evaluation of URLs by security vendors is necessary to support several objectives, which
are detailed below:
Collect new malicious binaries to update detections strategies
Malicious binaries are periodically updated in response to AV detections. In some cases new
URLs are used to host the updated binaries, in other cases the same URL is used to host a new
binary. The latter case necessitates the periodic re-evaluation of confirmed malicious URLs in
order to harvest new malicious binaries.
Collect new malicious web content to update detection strategies
Many AV products include detection for malicious web content as well as malicious executable
content. This provides an additional layer of protection to users; often an attack will be stopped
by the identification of malicious web content before a user’s browser is compromised and made
to download a malicious executable. This content, like the malicious binaries, is updated
to counter AV detection strategies [How10], so a persistent effort to collect and analyze new
malicious web content is necessary.
Maintain a blocklist of malicious URLs
URL blocklists provide an additional layer of protection. Even if an update to malicious content
by malware distributors breaks AV detection, if the malicious content is hosted on a blocklisted
domain or IP then the user is still protected. Populating and maintaining blocklists of network
elements (domains, name servers, IPs, rDNS patterns, ASs) requires collection and inspection
16
2.3. Adversarial Information Retrieval Systems
of content from these respective network components.
Avoid false positives
The classification of benign content as malicious is referred to as a False Positive (FP). This is
a constant risk in any system that classifies content. The use of blocklists introduces a new FP
concern: the listing of a legitimate but compromised site for longer than necessary. The initial
decision to list a legitimate site that has been compromised is itself contentious; putting this
contention aside, once a legitimate site is blocklisted, the site must be monitored for signs of
clean up so that the site can be subsequently removed from the blocklist.6
2.3.2 What to Harvest
Assuming unlimited resources, from a protection standpoint the best strategy is to repeatedly
crawl everything on the Internet. For all but the largest technology firms, this is not feasible.
Given this reality, what URLs should an AV firm harvest? There are several common sources
of suspicious URLs processed in security labs:
Following trending search terms
The use of Search Engine Optimization (SEO) poisoning to generate traffic to malicious networks
is a common tactic [PMRM08]. It is possible to identify trending search terms and then execute
searches for these terms. The results currently7 contain landing pages that lead to MDNs.
Searching for vulnerable strings
Vulnerable web hosting platforms can be identified by footers containing the version string
(e.g., powered by Wordpress v 2.3.3). Searching for these yields potentially compromised sites.
These sites can be used as anchors in subsequent searches (using search operators such as inurl
[Goo11]), yielding potential landing pages.
6A separate policy issue is how to handle legitimate sites that are repeatedly infected and cleaned up withoutsufficient patching taking place. Is an AV vendor being negligent by removing the site from a list too early? Arethey being unnecessary harsh towards the owners of the site by permanently listing them?
7This is another example of an AIR scenario: search providers (e.g., Google) change heuristics to filter SEOpoisoned content from search results, the techniques to boost search rank change to counter the heuristics and theresults once again become tainted. At time of writing, searches for trending terms still yield many compromisedlanding pages.
17
2.3. Adversarial Information Retrieval Systems
Searching for known kit patterns
Many exploit kits will generate URLs that have known patterns
(e.g., bad.com/bad.php?. . . &page=[0-9]). Search modifiers can be used to identify URLs match-
ing these patterns, yielding potential landing pages.
Static and dynamic analysis of executable files
URLs can be retrieved from the static strings contained in malicious executable binaries, as well
as from monitoring the runtime behaviour of a sample.
Product Feedback
An excellent real-time source of malicious URLs come from modern security products that
report detection incidents back to the vendor. Many feedback strategies are possible, this
research uses feedback from web content filters that report URLs classified as malicious based
on content inspection.
Strategic Relationships
There are symbiotic relationships possible where a non-security firm with unique visibility (e.g.,
search engines, social networks, telecommunications firms) use augmented security products
to identify malicious networks affecting the partner. In exchange the partner delivers threat
intelligence that was gained using the security product.
Cooperative Industry Exchanges
It is common practise in industry to share confirmed malicious executables and URLs between
AV labs and security researchers. These feeds are of various composition and quality and must
typically be verified upon receipt.
2.3.3 How to Harvest
In order to collect samples of malicious web content and binaries, security researchers have
developed custom HTTP clients that automatically collect content for analysis. These systems
are commonly referred to as client-side honeypots, or honey clients. The Honey Client (HC)
is responsible for content retrieval and monitoring system state after download and malware
18
2.3. Adversarial Information Retrieval Systems
installation. This section provides an overview of honey client technologies, focusing on the
content retrieval phase.
HCs vary widely in terms of their implementation and feature set. Similar to honeypots,
honeyclients are commonly classified into high and low interaction varieties [PH08]. Fundamen-
tally, a high interaction honeypot uses the actual vulnerable software (in this case the browser
and plugin), whereas a low interaction honeypot will emulate the vulnerable software. In the
description below I have added a third category, the Medium Interaction Honey Client (MIHC).
Each are described below.
Low Interaction Honey Clients (LIHCs) (e.g., GNU Wget [GNU11], Heretrix [Her11]) im-
plement the HTTP protocol and are capable of downloading content and following basic HTTP
redirection. They do not interpret the downloaded content in the same manner as a web
browser. This means that Java Script (JS) or HTML redirections will not be followed, and
embedded content will not be retrieved. The upside to a LIHC is that they are typically light
weight in terms of resource use, and the state of the downloader does not need to be reset
between fetch attempts (as in the case of a HIHC). Therefore, a LIHC can download at a higher
rate than a MIHC or a HIHC.
Medium Interaction Honey Clients (MIHCs), such as jsunpack [jsu11] or Wepawet [CKV10],
add additional functionality to interpret the content and emulate certain browser features to-
wards the goal of identifying malicious behaviours. For example, jsunpack mimics ActiveX
plugins, which allows the software to identify exploits targeting specific plugins. The analysis
and interpretation features of a MIHC add an additional resource cost compared to a MIHC,
but they do not need to reset state, so there is still a time savings compared to a HIHC.
High Interaction Honey Clients (HIHCs), such as Microsoft’s HoneyMonkey [WBJ+06], use
an automated web browser in a sand-boxed environment to perform the URL evaluation. The
operating system is monitored for unexpected state changes, such as file downloads or process
creation that indicate the system has been infected with malware. The main advantage of a
HIHC is the full fidelity of the environment; a real browser is used to perform the sequence
of HTTP requests, and all content interpretation is performed by the browser. Some honey
clients monitor the post infection behaviour of the malware, providing additional insight and
confidence in any subsequent malicious classification. The design and maintenance of a HIHC is
19
2.3. Adversarial Information Retrieval Systems
more complex simply due to the amount of components involved. Another downside is the time
required to restore state between download attempts. The HIHC may become compromised
during a download attempt, therefore it is necessary to reset the HIHC to a known clean state
between downloads. Without this reset, the results of one download could potentially taint
subsequent downloads.
A fundamental decision in AIR system design is which type of honey client to use to download
a URL. A HIHC can handle a wider range of URLs than a LIHC; however, HIHCs are typically
orders of magnitude slower and more expensive than a LIHC. If the resources are available, it
makes sense to harvest everything with HIHCs. When this is not feasible a mix of high and low
interaction honey clients is most appropriate [CCVK11].
An HIHC is necessary when a MDN uses a browser or plugin exploit, or when the network
uses crawler evasion techniques (Section 2.3.4) that prevent study by a LIHC. URL streams
received from external sources typically do not contain enough provenance to determine the
expected content a priori. By performing a preliminary fetch with a LIHC one can identify
URLs that require analysis by a HIHC. For URLs that are discovered through in house sources
(e.g., searching for SEO poisoned links) origin is known and there is an expectation that a HIHC
is needed. In these cases the initial LIHC fetch should be skipped.
This research uses both high and low interaction honey clients to download web content.
The choice to use both is based on the availability of resources. It should be noted that the
HIHC I used did not perform post HTTP operations, such as monitoring for system changes.
2.3.4 Adversarial Concerns
The study of malware on the web is complicated by several countermeasures employed by
adversaries. These include anti-crawler content and blacklisting, which are each described
below:
Anti Crawler Content
I consider any use of technology towards the objective of complicating the task of a honey client
an anti-crawling technique. There are many content-based techniques that must be considered
when designing AIR systems. The most common is the use of obfuscated Javascript. This
20

2.3. Adversarial Information Retrieval Systems
technique is widely deployed [How10] to complicate the task of content interpretation. Simple
Javascript functions (e.g., ’window.location’) are layered with multiple layers of encoding to
prevent simple crawlers from interpreting their intent (typically redirect or exploit). This area
is highly adversarial (rapid updates on both sides of the problem). As a result, the techniques
used to prevent crawlers are evolving quickly to include multiple cooperating scripts, use of
DOM content in decryption loops, checking for the presence or absence of cookies, and other
nasty tricks.
Blacklisting
There is little published information on the use of blacklisting by malicious networks [ZRB11,
Woo11, Sob11, CGKP11]; however, it is a commonly accepted belief in the security community
that certain malware networks engage in this behaviour. The act of blacklisting in the context
of malicious networks can be broken into two steps: identification of honey clients, and altering
responses to honey clients. These are discussed below.
Identifying Honey Clients
Honey clients are identifiable because they repeatedly visit web servers, and they visit many
web servers controlled by the same organization. This repetition of the download operation
creates a fingerprint of the honey client that can be identified by malicious adversaries. Iden-
tifiable characteristics include: the IP address, TCP/IP characteristics, HTTP characteristics,
frequecny of requests, and volume of requests.
In addition to the “do it yourself” approach to identifying honey clients, there are also a
number of sources of pre-compiled lists of IP addresses used by security researchers [Web11,
AV 11, Sob11], search engine crawlers, [Fan11], and anonymizing proxy networks [Blo11].
Altering Responses To Honey Clients
Once a honey client has been identified, the malware distributor has a number of options
available:
HTTP 500 In this scenario a malware network simply refuses to deliver content to the honey
client.
21
2.4. Related Work
Benign Content In this scenario the malware network will deliver content or redirect to a
benign website, such as cnn.com [HK10].
Old Content In this scenario a malware network will continue to serve malware to the honey
client, however the rendered content will be an older version of malware.
Tarpit The use of tarpitting was originally deployed to mitigate the effects of network worms
[Tar11]. the MDN deliberately holds the TCP/IP connection open as long as possible,
delivering content at a very low rate, or not delivering content at all.
2.4 Related Work
The research in this paper evaluates optimizations to the re-evaluation logic of AIR system
towards the goal of reducing the overall fetch volume of the system. To the best of my knowledge
this is the first research to address this specific issue. However; there are several areas of related
research. This chapter surveys this work.
2.4.1 Studies of Malware on the Web
The study of malware on the web has been an active area of research for several years. Stokes et
al. [SASC10] provide an effective classification of the existing approaches to malware discovery
into top down and bottom up approaches. In the top down approach [MBGL06, PMM+07,
PMRM08, WBJ+06] suspicious URLs are evaluated, the malware delivery tree is traversed, and
the malware is collected and in some cases executed. This research takes a top down approach,
but is different from previous works in that I focus on the re-evaluation of known malicious
networks to collect new data instead of the initial discovery and classification of the malicious
components. The work by Provos et al. [PMM+07] includes statistics on the distribution of
binaries across URLs, but does not provide a detailed treatment on the update behaviours.
My work is similar to theirs, but studies a smaller amount of MDNs in greater detail, focusing
specifically on the MDN update behaviour and strategies to use resources more efficiently.
In the bottom up approach [SASC10, ZSSL11], data from many HTTP Traces is aggregated
in an offline process to discover a larger percentage of the components of MDNs. This is similar
22
2.4. Related Work
to the approach I use to group landing pages and repositories into MDNs. Their approach incor-
porates more network information to identify MDNs and also provides a degree of automation
to the process through the use of AutoRE [XYA+08]. Our work differs from theirs in that we
use the identification of MDNs to adjust and optimize re-evaluation logic, whereas they used the
identification of MDNs to retroactively identify malicious fetch logs to improve URL blocklists.
2.4.2 Study of Blacklisting Techniques
The web spam technique of cloaking, that is to return altered content to search engine crawlers
for the purpose of search engine optimization (SEO), became a popular research topic around
2005. Wu and Davison [WD05, WD06] performed several studies of sites that performed se-
mantic cloaking. They impersonate regular Internet users as a baseline as well as automated
crawlers by varying the user agent. Niu et al. [NWC+07] performed a similar study focusing
on the problem of forum-based spamming as a black SEO technique. They identified a new
type of cloaking known as click through cloaking that differentiates user from crawler based on
the value of the HTTP referrer. They trigger the cloaking by varying the HTTP referrer and
use the presence of cloaking as a spam sign to aid in URL classification. I am monitoring for
blacklisting caused by repeated evaluations of malicious sites, as opposed to blacklisting based
on characteristics of the client. Further, they do not propose strategies to reduce the likelihood
of blacklisting.
2.4.3 Fake AV Malware Distribution Networks
Rajab et al. [RBM+10] specifically addressed Fake AV distribution networks. Their results
were consistent with the observations made in my research: Fake AV MDNs are updating the
malware repositories and malicious payloads on a frequent basis, and there is still a strong fan in
factor from the landing pages to the malware repository. While their analysis typically presents
results at the macro scale, something only possible with the visibility of an organization like
Google, I provide a very focused study of several MDNs and specific strategies for identifying
and re-evaluating these MDNs. Recent work by Stone-Gross et al. [SGAK+11] also focused on
Fake AV networks, however their work focused primarily on the payment systems in place to
monetize the infections, whereas I focus on the delivery networks.
23
2.5. Summary
2.5 Summary
In this chapter I presented relevant background and related work. Section 2.1 presents back-
ground on the World Wide Web (WWW). Section 2.2 describes the rise of malware on the
Web. In Section 2.3 I discuss the role of Adversarial Information Retrieval (AIR) systems in
web security research. In the next chapter I discuss how high rates of suspicious incoming URLs
and the threat of blacklisting challenge the success of deployed AIR systems. I motivate the
need for further research into this area and propose several optimizations to re-evaluation logic
that help to address these challenges.
24
Chapter 3
Preliminaries
The previous chapter provided background on Internet technologies, the rise of malware on
the web, and the use of AIR systems to monitor MDNs. This chapter discusses several problems
faced by AIR systems and proposes solutions.
AIR systems must cope with a large volume of URLs. Industry sources estimate between
600,000 - 1,000,000 new unique potentially malicious URLs are reported daily [Dun11]. Ad-
ditionally, to satisfy the goals outlined in Section 2.3.1, a proportion of these URLs must be
periodically re-evaluated. However, the questions of which URLs to re-evaluate, and for how
long to re-evaluate the URLs, are not adequately addressed in the current body of research.
Not all URLs will provide an “additional gain” from subsequent evaluation. If an MDN
does not update the redirection chain or if a malware repository does not update the malicious
binary, then the subsequent visits to these malicious resources serves no purpose. Unfortunately,
it is not easy to determine which URLs will provide additional gain on re-evaluation without
actually conducting the re-evaluation. As a result, all URLs must be re-evaluated, which greatly
increases the work load of the AIR system.
This naive re-evaluation strategy is a significant contributor to AIR system workload. Any
AIR system that implements a naive re-evaluation algorithm will be in a perpetual state of
work. That is, the percentage of time that the system spends in an idle state is negligible; there
is always a list of URLs that need evaluation. Given this reality, techniques are necessary to
cope with the daily volume of URLs. However, there is insufficient research publicly available to
make improvements on the naive approach without performing a study of the problem space.
In addition to system load, re-evaluation of MDNs increases the probability of blacklisting,
which is discussed in Section 2.3.4. When AIR resources are identified, each of the objectives
25
Chapter 3. Preliminaries
listed in Section 2.3.1 are impacted. It is therefore important to: 1) limit the opportunity for
blacklisting by reducing the number of times the AIR resources are exposed to MDNs, and 2)
detect the blacklisting when it occurs.
In order to reduce the load on AIR systems caused by re-evaluation of URLs, this research
studies the problem space and proposes techniques to identify which URLs do not require subse-
quent re-evaluation.
I pursue these research objectives in two distinct adversarial scenarios that are commonly
encountered by security vendors:
1. Evaluating zero-provenance malware repositories
2. Evaluating Fake AV MDNs
I take the following approach: first I build a corpus of data by collecting data from active
malicious networks. Next I analyze the data looking for optimization points. Finally, I simulate
re-evaluation algorithms on the data collected to evaluate the proposed optimizations. The
results of data collection and simulation are presented in Chapter 5. The proposed optimization
are presented in the sections that follow.
26
Chapter 3. Preliminaries
Web
Sn = 1
Aen = 0
Ann > 0
Mn > 1
Pn >> 1
Start
Exe 404/500
U
Legend
S - single sample serverM - multiple sample serverP - polymorphic serverAe - active no exe everAn - active no exe right nowU - unresponsiven - number unique executable samples from URL
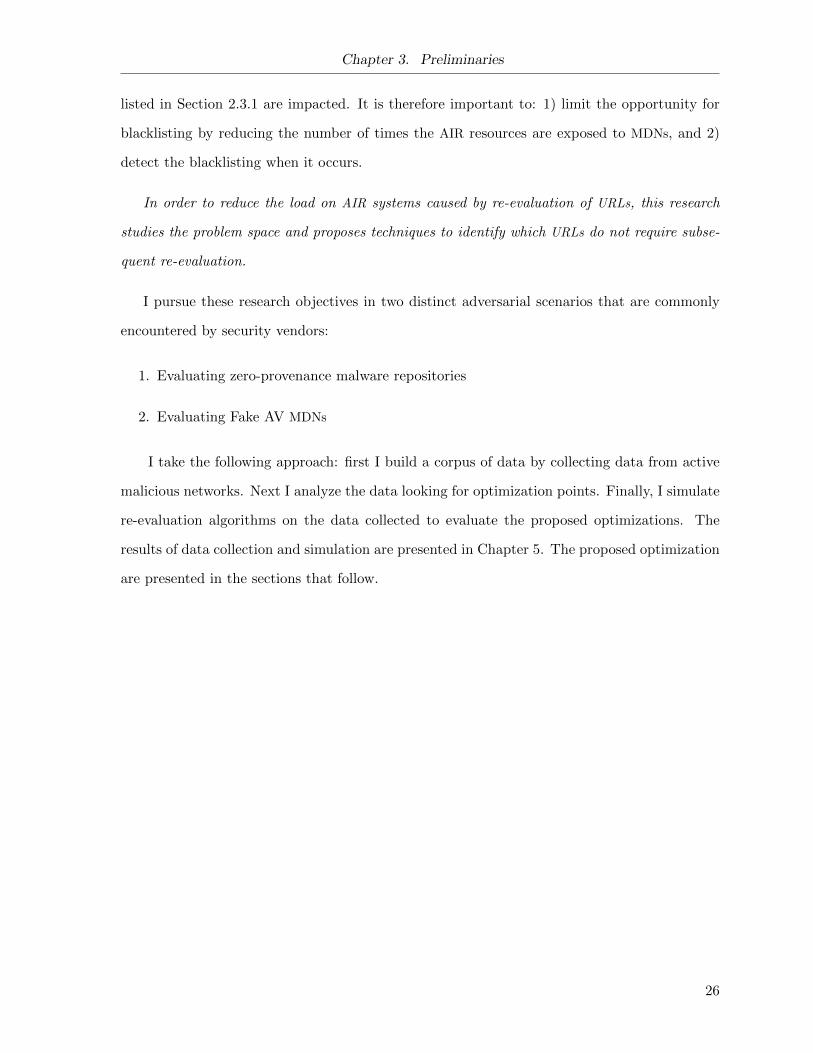
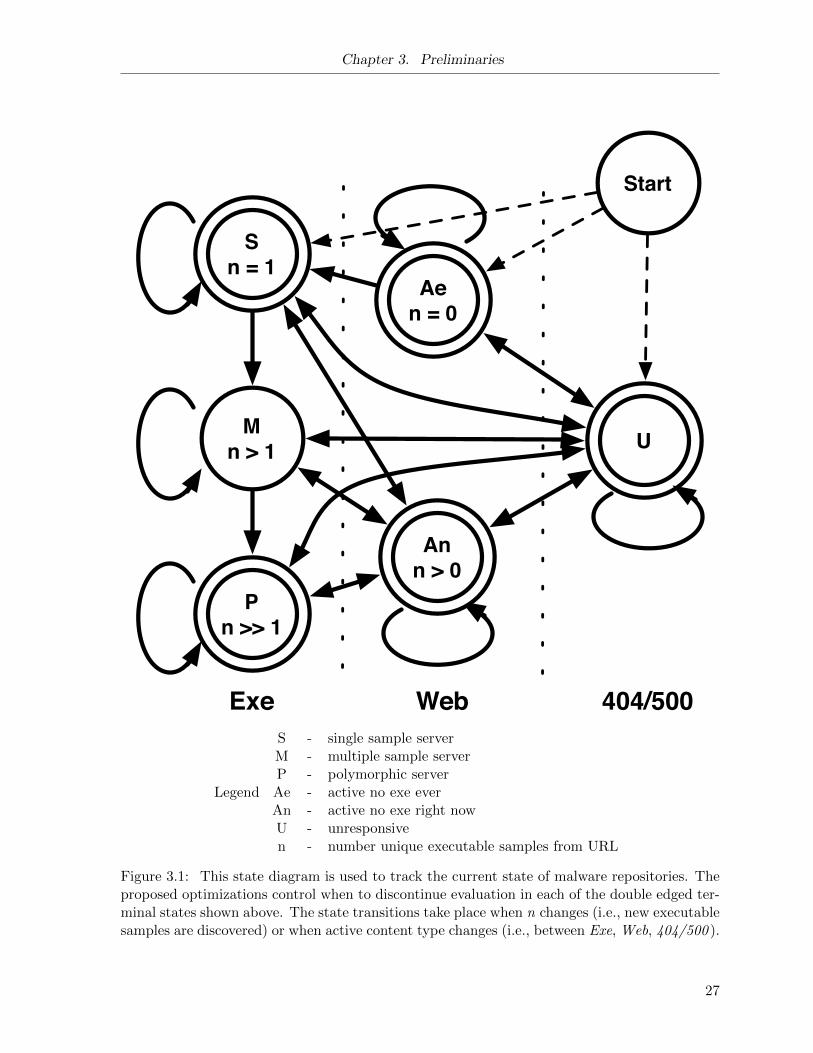
Figure 3.1: This state diagram is used to track the current state of malware repositories. Theproposed optimizations control when to discontinue evaluation in each of the double edged ter-minal states shown above. The state transitions take place when n changes (i.e., new executablesamples are discovered) or when active content type changes (i.e., between Exe, Web, 404/500 ).
27
3.1. Evaluating Zero-Provenance Malware Repositories
3.1 Evaluating Zero-Provenance Malware Repositories
Malware repositories are typically discovered by following a malware redirection chain and
arriving at a repository. When a malware repository has no associated information about the
upstream links in the MDN, I refer to it as having zero provenance. This situation arises when
processing URLs found in cooperative industry exchanges or other external sources of suspicious
URLs. It is not possible to study these sites by entering the MDN from the landing page, because
this information is not available. Therefore, a direct evaluation of the repository is necessary
in order to retrieve content from these URLs. My primary interest when studying malware
repositories in this manner is to determine if the repository is delivering malicious binaries and
if the repository will serve multiple executables over time. I want to discontinue re-evaluations
of the repository once it is no longer useful.
To reduce the total volume of evaluations performed by an AIR system, I propose several
optimizations to reduce the number of re-evaluations performed on malware repositories while
maintaining a constant rate of malicious executable discovery.
The optimizations are based on the state model shown in Figure 3.1. In this model I
introduce 5 terminal states where re-evaluation is discontinued. All of the optimizations share
the goal of reducing the amount of resources (i.e., re-evaluations) spent on malware repositories
in one of these 5 states. The three optimizations are introduced below, followed by a more
detailed treatment of each state in Section 3.1, focusing on why to “discontinue” re-evaluation
of a zero provenance malware repository in each of these states.
Cutoff optimizations (ct): After each re-evaluation, the scheduling component of the AIR
system checks the current state of the repository. If the repository is in one of the five
terminal states and has been in that state longer than a threshold value (each state has
a distinct threshold), then discontinue re-evaluation.
Backoff optimizations (bk): After each re-evaluation, the scheduling component of the AIR
system checks the current state and the transition (or lack of transition) that just occurred
as a result of the most recent evaluation. If the repository has not transitioned and is in
one of the following states: single sample (S), active no exe right now (An), and active
28
3.1. Evaluating Zero-Provenance Malware Repositories
no exe ever (Ae), then increase the re-evaluation interval by a fixed increment.8
In each of these states, re-evaluations are not forwarding the goal of sample collection,
but re-evaluation must continue for a period to prevent missed samples. Increasing the
re-evaluation interval reduces the number of re-evaluations spent waiting for the cutoff
threshold to be reached.
Initial Detection optimizations (cp): Assuming that the same “distribution strategy” is
used by a given family of malware over time (I provide results towards this assertion
in Section 5.1.3), then it is possible in some cases to predict the update behaviour of a
new malware repository based on the “family” of malware that is initially downloaded
from the repository. If a family known to use single server repositories is downloaded,
immediately discontinue re-evaluating a repository. In the same manner, if a family of
malware has a history of being served from multiple sample repositories that update at a
periodic interval, this interval is used to seed the initial re-evaluation interval.
The implementation of this optimization requires two thresholds for each optimization:
the minimum probability, and the minimum data points (also referred to as the minimum
confidence) that contribute to the probability score: n(d). For example, assume for the
single sample conditional probability optimization I use a minimum probability of 0.7 and
a minimum confidence of 5. I would only apply the optimization to a repository with
an initial detection of d if: (1) at least 5 repositories with initial detection d have been
previously studied (i.e., n(d) ≥ 5), and 2) the current P (S|d) is greater than or equal to
0.7.
States
The significance and unique considerations for each of the states are discussed below.
Unresponsive (U)
There are multiple causes for a server to appear inactive. In the experiments performed I treat
all of these conditions as equivalent negative responses:
8In [ZRB11] I explore different functions to update the re-evaluation interval. In the thesis work I constrainmy evaluation to using a function that increases the re-evaluation interval by a fixed increment.
29
3.1. Evaluating Zero-Provenance Malware Repositories
1. There is no DNS record available for the URL
2. The server refuses to initiate a TCP connection
3. The server sends no data during the entire TCP conversation (then a timeout occurs)
4. The server responds with a negative HTTP response (i.e., 40X or 50X)
When a consecutive run of negative responses exceeding some threshold is observed, the
server is considered inactive and re-evaluation should be discontinued.9 Repeatedly querying
inactive servers does not advance the goal of content discovery, and detracts from the goal
of resource conservation and blacklisting avoidance. It is therefore desirable to discontinue
attempts to fetch from inactive servers. This objective - to discontinue attempts to fetch
content from inactive servers - is complicated by a characteristic exhibited by some malicious
networks: intermittent availability. Some malicious networks appear to be inactive, only to
become active at a later time. The consequence of categorizing an intermittently available
malicious repository as inactive is missed sample updates.
Active No Exe (Ae,An)
Note this section covers both Active No Exe Ever and Active No Exe Right Now. When a LIHC
visits a suspected malware repository and receives non executable content, typically HTML
content, two things should be done:
1. This URL should be revisited by a HIHC for more thorough analysis, as the URL content
may be using crawler evasion techniques or hosting an exploit that will not function unless
in the context of a browser.
2. The URL should be removed from subsequent evaluation by the LIHC as this serves no
value unless the URL begins serving executable content at a later date.
Single Sample (S)
Towards the goal of content discovery there is no benefit to repeatedly downloading the same
9A variation of this strategy is to reschedule an evaluation in the distant future (e.g., several weeks or evenmonths) to see if the server becomes active again. I do not evaluate the merits of this variation.
30
3.2. Evaluating Fake AV Malware Distribution Networks
sample. Additionally, repeatedly downloading the same sample detracts from the goals of
resource conservation and blacklisting avoidance. However, the only way to determine that a
server is a single sample repository is to make multiple requests to the server over time. Making
too many observations wastes network resources and increases blacklisting probability. Taking
too few observations and incorrectly classifying a periodic updater as a single sample repository
will result in missed sample updates.
Polymorphic Server (P)
Dealing with purely polymorphic servers is a challenging task that is not fully addressed in
this research. Every evaluation of a polymorphic server contributes to new content discovery,
but at a diminishing rate. The cost of sample collection, in addition to AIR system resources,
is non-zero and must be considered. A more detailed treatment is provided in Chapter 6.
To summarize, a polymorphic server should be dealt with using a separate iterative approach
allowing human or automated action between batches.
3.2 Evaluating Fake AV Malware Distribution Networks
Fake AV is actively being distributed using sophisticated MDNs (shown in Chapter 5). These
networks engage in IP blacklisting behaviour, the repositories and malicious executables are fre-
quently updated, and the distribution network is sophisticated in terms of the countermeasures
in place to thwart security researchers.
This represents a worse case scenario where information needs to be frequently collected
from the MDN in order to actively protect users, but there is also need to limit the exposure of
AIR resources through the act of collection.
To balance the conflicting objectives of discovery10 and blacklisting avoidance, I propose
several techniques to reduce AIR client exposures to the network, which I assume will reduce
blacklisting, while maintaining a relatively high discovery rate.
The first technique leverages the high degree of fan in from landing page to malware repos-
itory. My data indicates that all landing pages in a MDN redirect to a single repository at a
10discovery of the MDN network topology and malicious executables
31
3.3. Summary
given time. For any MDN that satisfies this condition (i.e., one active repository at a time), a
visit to a single landing page in the MDN will yield the active malware repository at a given
time, and no immediate evaluations are necessary to the other known landing pages in the
MDN.
The second technique reduces the number of exposures to the repository, at the cost of
greater uncertainty about the malicious executable being served by the repository. I propose
the addition of a decision point during the evaluation of a MDN landing page. If the landing
page redirects (directly or indirectly) to a known malware repository, and the repository has
been recently visited, then the HTTP client should not make a HTTP request to the repository.
This requires a threshold value to control when to re-evaluate the repository. I refer to this
threshold as the repository re-evaluation threshold (RRT). The application of this optimization
saves one exposure to the malware repository. This technique will be effective if at least one of
two conditions is met; note the second condition only applies when approaching the problem
from the perspective of a security vendor.
1. The lifetime of an active repository in the MDN is long compared to the lifetime of a
specific malware binary.
2. The ability of a vendor to proactively detect the malicious binaries (i.e., already detected
upon initial discovery) is “good enough”; revisiting the repository to collect a new ma-
licious executable on every evaluation of the MDN is unnecessary. In this scenario, the
MDN is being monitored to add the repositories to blocklists and periodically check that
the malicious samples are proactively detected.
3.3 Summary
This chapter provided a more detailed presentation of the problem addressed by this research,
and proposed optimizations in each of the two adversarial scenarios that are addressed by this
research.
32
Chapter 4
Approach
The previous chapter provided an overview of the problem space and the two adversarial scenar-
ios that are addressed in this research. This chapter presents the approach taken to study these
scenarios: I collected data from suspicious URLs, analyzed the data, proposed optimizations,
and then evaluated the optimizations by simulation using the collected data. Section 4.1 pro-
vides an overview of the major system components used during the data collection phase of my
research. Section 4.2 discusses data validity concerns, and Section 4.3 presents the simulation
and measurement methodology used to evaluate the proposed optimizations.
4.1 The Tachyon Detection Grid
To study the behaviour of malware distribution networks over time, I built a framework that
supported multiple distributed honey clients and pluggable scheduling and data analysis com-
ponents. I named the framework TDG, which is a geeky Star Trek reference.11 Figure 4.1 shows
the TDG architecture. The TDG system consists of a single central server and multiple clients
that execute instructions from the server. The system was implemented in Perl 5.8 [The11] run-
ning on Gentoo Linux [Gen11]. All major components were implemented as objects. The central
server consists of persistent perl processes that communicate with each other using an Apache
QPID [Mes11] message broker. Persistent data storage was realized using MySQL [MYS11] for
relational data storage and a REST based key/value store implemented using Node.js [Nod11].
A more detailed presentation of the TDG is provided in Appendix A.1.
11In StarTrek: The Next Generation, the Federation deploys a Tachyon Detection Grid to detect cloakedRomulan vessels [Tac11]. My initial research objective was to study the use of cloaking by malware networks,and so a name was given to a bunch of code.
33
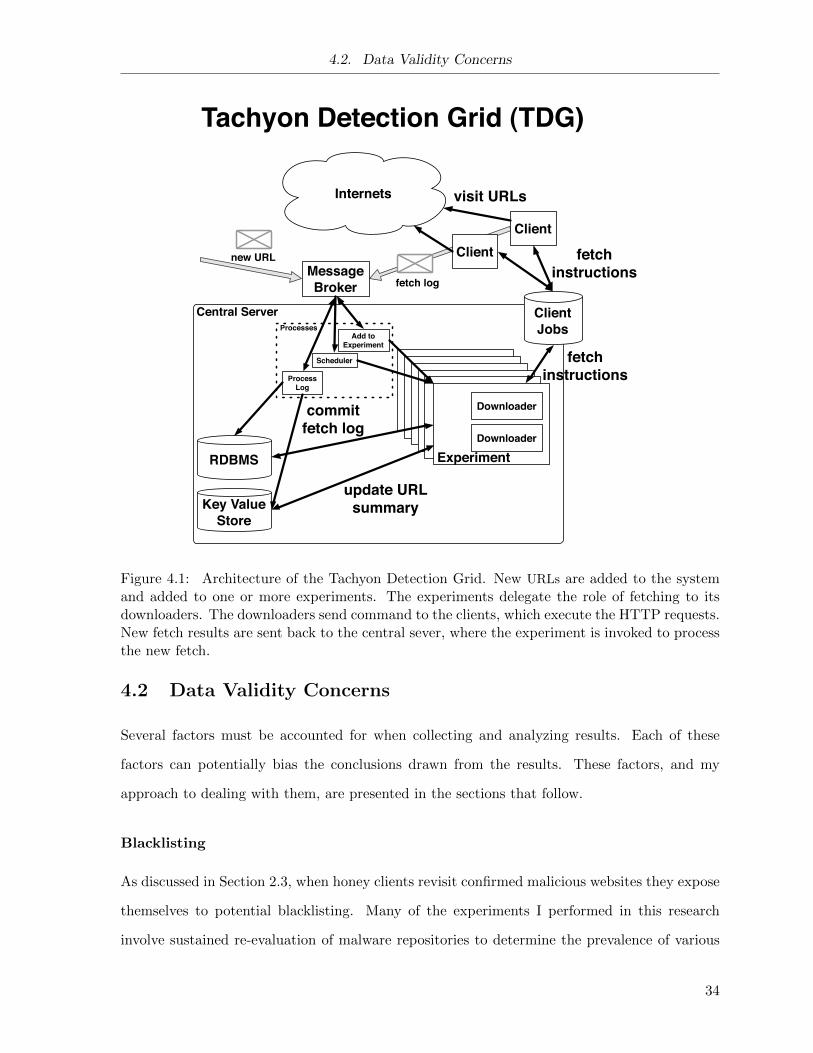
4.2. Data Validity Concerns
Central ServerProcesses
Internets
ClientClient
fetch instructions
Key Value Store
Process Log
RDBMS
Message Broker
Client Jobs
update URL summary
visit URLs
Add to Experiment
Scheduler
ExperimentDownloader
Downloader
fetch instructions
fetch log
new URL
commit fetch log
Tachyon Detection Grid (TDG)
Figure 4.1: Architecture of the Tachyon Detection Grid. New URLs are added to the systemand added to one or more experiments. The experiments delegate the role of fetching to itsdownloaders. The downloaders send command to the clients, which execute the HTTP requests.New fetch results are sent back to the central sever, where the experiment is invoked to processthe new fetch.
4.2 Data Validity Concerns
Several factors must be accounted for when collecting and analyzing results. Each of these
factors can potentially bias the conclusions drawn from the results. These factors, and my
approach to dealing with them, are presented in the sections that follow.
Blacklisting
As discussed in Section 2.3, when honey clients revisit confirmed malicious websites they expose
themselves to potential blacklisting. Many of the experiments I performed in this research
involve sustained re-evaluation of malware repositories to determine the prevalence of various
34
4.2. Data Validity Concerns
update patterns, so there is a chance that blacklisting could occur. To account for this in
the LIHC experiments, I harvested content from URLs using multiple downloaders. In each
experiment there were one or more high volume fetchers distributed across multiple IP addresses,
at least one low volume downloader, often using a pool of IP addresses, and a reserve downloader,
which did not execute any fetches unless there was suspected blacklisting. There are two
forms of blacklisting that I detect: reactive content denial blacklisting and proactive content
denial blacklisting. Any URL that triggers either blacklisting heuristic was discarded from the
evaluation phase of the approach. This was done to prevent results tainted by blacklisting from
affecting the statistical distributions and evaluation results.
Reactive Content Denial Blacklisting
I define reactive blacklisting as an adversarial response from a specific repository after a honey
client has made one or fetch attempts to the site. In the case of reactive content denial black-
listing, the response by the adversary is to deny access to content, via a HTTP response in
the 400 or 500 group (HTTP response code groups are detailed in Figure 2.2). The approach I
used to identify this form of blacklisting relies on the URL state model presented in Figure 3.1.
Every time a high volume downloader transitioned into an inactive state, I enqueued a fetch
attempt using a reserve downloader. If the reserve downloader received a positive response, I
considered this evidence of reactive content denial blacklisting.
Proactive Content Denial Blacklisting
I define proactive content denial blacklisting as an adversarial response from a specific adversary
after a honey client has made requests to multiple repositories under the control of the adversary.
The adversary blacklists the client, and then all subsequent requests, even the first request to
a new repository, will be denied, via a HTTP response in the 400 or 500 group. The approach
I used to identify this form of blacklisting also relies on the URL state model (Figure 3.1). If
a high volume downloader transitioned directly from start to unresponsive, and other high or
low volume downloaders received positive responses, I considered this proactive content denial
blacklisting.
35
4.2. Data Validity Concerns
Sample Truncation
When a download is terminated before a file transfer is completed, the result is a truncated
version of the complete file. If this condition is not detected by the honey client, incorrect
observations can be made regarding the update behaviour of a malware network. Indeed, this
was the case for results that were gathered12 - and presented - from the TDG before May 22,
2011 [ZRB11]. This premature download termination has two main causes: artificial client side
timeouts, and server side timeouts or connection resets.
Some malware distribution networks appear to suffer from performance issues.13 In all ex-
periments conducted during this research, I consistently encountered repositories that delivered
samples at rates under 1 KB / second. In other cases the server paused for multiple seconds
in the middle of a file download, sometimes recovering, and in other cases never resuming the
data transmission. The net result of these intermittent behaviours was a “download time” dis-
tribution with a very long tail. Another cause of sample truncation is server timeouts. In some
instances the server stopped uploading in the middle of a download. In this scenario, regardless
of the client side timeout, a full sample cannot be downloaded.
To cope with these phenomena, a difficult design decision had to be made on whether
to place an artificial upper limit on the time spent per download. Without the upper limit,
the experiment throughput would degrade significantly if repeated download attempts take an
extended period of time. Worse still, a small number of adversaries that identify the clients and
tarpit (see Section 2.3.4) download attempts would impact the study of all malware repositories.
On the other hand, introducing the upper limit inhibits the ability to collect samples from
networks that suffer from connectivity and bandwidth issues. In order to keep the experiments
running without constant supervision and maintenance (e.g., trimming experiment size to cope
with backlogs caused by slow servers) I chose to introduce an artificial client side cutoff threshold
of 10 minutes.
12The results presented in [ZRB11] suggest a ratio of single sample to multi sample repositories were 1.67:1,whereas the dataset used in this thesis suggests 10:1. The discrepancy was confirmed to be due to sampletruncation in the earlier data set. The scheduling algorithms presented in my previous work still provide gainbut the numbers presented are skewed by the data collection fault. None of the data from the flawed set is usedin this thesis.
13It is unclear whether the network issues were a deliberate action of the adversary to thwart security re-searchers, a deliberate action of the hosting provider to throttle downloads, or a legitimate issue with the hostinginfrastructure.
36
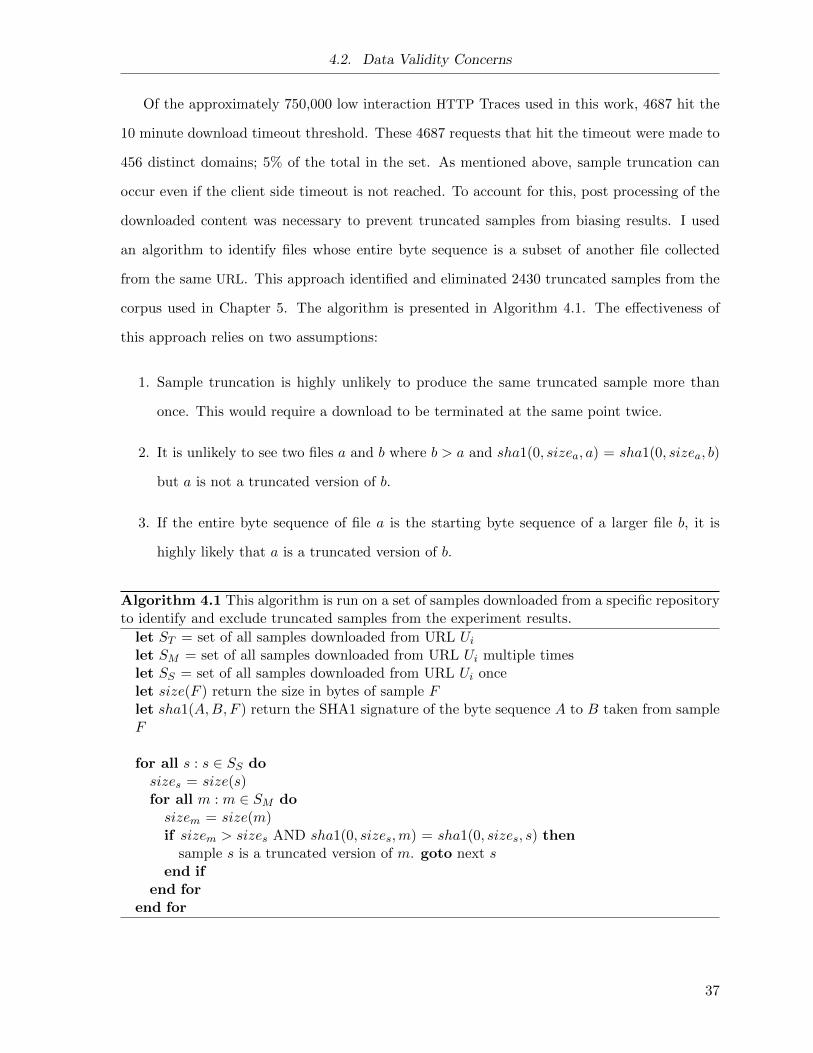
4.2. Data Validity Concerns
Of the approximately 750,000 low interaction HTTP Traces used in this work, 4687 hit the
10 minute download timeout threshold. These 4687 requests that hit the timeout were made to
456 distinct domains; 5% of the total in the set. As mentioned above, sample truncation can
occur even if the client side timeout is not reached. To account for this, post processing of the
downloaded content was necessary to prevent truncated samples from biasing results. I used
an algorithm to identify files whose entire byte sequence is a subset of another file collected
from the same URL. This approach identified and eliminated 2430 truncated samples from the
corpus used in Chapter 5. The algorithm is presented in Algorithm 4.1. The effectiveness of
this approach relies on two assumptions:
1. Sample truncation is highly unlikely to produce the same truncated sample more than
once. This would require a download to be terminated at the same point twice.
2. It is unlikely to see two files a and b where b > a and sha1(0, sizea, a) = sha1(0, sizea, b)
but a is not a truncated version of b.
3. If the entire byte sequence of file a is the starting byte sequence of a larger file b, it is
highly likely that a is a truncated version of b.
Algorithm 4.1 This algorithm is run on a set of samples downloaded from a specific repositoryto identify and exclude truncated samples from the experiment results.
let ST = set of all samples downloaded from URL Ui
let SM = set of all samples downloaded from URL Ui multiple timeslet SS = set of all samples downloaded from URL Ui oncelet size(F ) return the size in bytes of sample Flet sha1(A,B, F ) return the SHA1 signature of the byte sequence A to B taken from sampleF
for all s : s ∈ SS dosizes = size(s)for all m : m ∈ SM dosizem = size(m)if sizem > sizes AND sha1(0, sizes,m) = sha1(0, sizes, s) then
sample s is a truncated version of m. goto next send if
end forend for
37
4.2. Data Validity Concerns
Benign Binaries
There is a risk that a server is not actually malicious. I took several steps to ensure benign
URLs were not included in my results. Essentially, I only added confirmed malicious URLs to
the experiments, and then discarded results from any URL that I could not confirm as malicious
during the experiment.
The experiments were only run on confirmed malicious URLs. The URLs were confirmed to
be malicious by 1) a production system in SophosLabs that downloads URL content and scans
the content using a Sophos AV scanner, or 2) a trusted external feed. Despite this preliminary
filtering, some URLs did not yield confirmed malicious executables during the course of study.
All downloaded content was AV scanned with a multi vendor scanning system immediately
before generating results. For the older experiments included in the results, the time interval
between sample collection and final scan is more than a month. This re-scanning step is impor-
tant (according to Rajab et al. [RBM+10]), because AV detections are always being updated,
thus malware undetected at initial download time may be detected at the final scan time. Any
URL that did not serve at least one detected executable was excluded from the results.
Relying on detections to filter results introduces the chance that a URL serving malicious but
undetected samples will be incorrectly filtered from the results. To minimize this risk I used
AV detection results from eight vendors: Sophos, Microsoft, Kaspersky, Symantec, McAfee,
TrendMicro, K7, and Avira. If a sample was detected as malicious by at least one vendor, then
the URL that served the sample is included in the dataset.
Finally, the presence of an AV detection string does not always indicate that a sample is
malware. This is particularly true for the scanning products I used, which are batch-mode, “on-
demand” scanners14 as opposed to the persistent “on-access” scanners deployed on customer
PCs. A final step was applied to filter out detections that are weak, policy based, or are
otherwise not strong indicators of a sample’s maliciousness (e.g., Symantec’s “Joke Program”
detection). This filtering was accomplished using vendor specific detection filter lists provided
by Sophos. Using these lists, I was able to classify each detection into one of the following
categories: (malicious, suspicious, application, internal, informational, warning, packed file,
14The batch mode scanners used in this research are 1) more verbose in output and 2) running in diagnosticmodes, so they reported on files that would be allowed to run by an “on-access” scanner.
38
4.3. Simulation Methodology
ignorable, checksum/weak detection). If at least one vendor produced a malicious detection for
at least one sample from a URL, then all of the data gathered from the URL was included in
the results.
4.3 Simulation Methodology
In order to evaluate the proposed optimizations I use simulation to determine the data that
would have been collected using different combinations of the proposed optimizations. This
section provides an overview of the simulation and measurement methodology, focusing on
decisions made that may impact results.
4.3.1 Pre-Simulation Data Processing
There were several processing steps necessary before a simulation was performed. First, URLs
that were a) benign, b) polymorphic, or c) blacklisting the apparatus, were identified and
excluded (these are each discussed in Section 4.2). Second, data tuples15 representing the state
of repositories and landing pages are prepared and stored for subsequent use. The information
required varies between the two adversarial scenarios. For the evaluation of zero provenance
malware repositories, a single set of tuples, with one or more records for each repository, is
necessary:
(repository, SHA1, content_type, HTTP code, start, end)
Each tuple represents a period in time from start to end when the repository responded with
a HTTP code and specific content, identified by the SHA1 checksum of the content. The zero
provenance malware repository optimizations also require detection information for samples.
This data was precomputed using the cross scanning system discussed in Section 4.2 and made
available to the simulation.
Simulation of Fake AV MDN re-evaluation required an additional set of tuples recording the
history of links from landing pages to malware repositories over time. The application of two
simplifying assumptions during the pre-simulation data processing steps were also necessary for
15The data tuple storage was implemented using a MySQL database.
39
4.3. Simulation Methodology
Fake AV MDN simulation. First, for each HTTP trace I reduced the network at that moment
to a landing page and a repository; I disregard the intermediate components of the network for
the simulation. Next, I assumed the strong fan in property applies to all MDNs in my data set.
That is, I assumed that at a given time, all landing pages point to a single repository. Note that
all the data I collected shows this assumption to be true for the MDNs studied in this research.
4.3.2 Performing the Simulation
Multiple re-evaluation algorithms, each with a different combination of initial re-evaluation
interval, optimizations and parameters, were simulated. The simulation runs over a specified
period of time (e.g., May 23, 2011 - July 5 2011) and requires a set of URLs and the initial
discovery time for each URL. The re-evaluation algorithms selects times when the URL should
be evaluated. The simulation engine determines the content that would be retrieved at that
time. The time requested will either a) overlap with a record, which requires no interpolation,
or b) fall between two records, which requires data interpolation. When data interpolation is
required, the nearest record, according to time, is selected and that response is used. Note that
interpolation will be inaccurate for polymorphic servers. This is one of the primary reason why
these servers are excluded from simulation.
4.3.3 Measuring Re-Evaluation Improvements
Each simulation produced three measurements: the number of evaluations performed (numF ),
the number of unique executables discovered (numS ), and the number of unique detection
families discovered (numFm). The Fake AV MDN simulations also produced measurements
of the number of malware repositories discovered (numR), and break down the number of
evaluations into the number of client exposures to the landing pages (numExpLP) and to the
malware repositories (numExpR).
I developed a single success score to combine the metrics from the zero-provenance malware
repository simulations.16 Conceptually, the objective of the optimizations is to reduce the
number of evaluations while maintaining a high sample discovery rate. There are additional
16I felt that a similar metric for the Fake AV MDN re-evaluation simulations was unnecessary. The Fake AVMDN results are much easier to interpret than the zero provenance malware repository results.
40
4.3. Simulation Methodology
considerations, such as avoiding downloading many polymorphic samples (unless this is an
objective), and finding as many distinct malware families as possible, however I did not attempt
to model these additional objectives in my success metric. Based on this simple objective
statement, I derived the following success metric: success = α× numSamples− numFetches,
where α is a subjective metric used to express the relative cost of sample discovery in terms of
fetching resources.
The success metric above provides an absolute measurement of the success of a particular
set of optimizations. During my analysis of the results I found it easier to draw conclusions
when using a normalized success metric (nSuccess). The normalization process is based on
several insights:
1. The re-evaluation interval (i.e., time to wait between consecutive evaluations) has a big
impact on the results of the simulation. The initial re-evaluation is a another highly
environment-sensitive parameter. I want to eliminate the impact of the initial re-evaluation
interval from the normalized success score.
2. The initial evaluation (i.e., the first evaluation) of the repository is a strong contributor
to the number of samples detected, and this initial evaluation is constant across the
simulations. I want to eliminate the results of the initial evaluation from the normalized
success score.
Based on these insights, I derived the following metrics to compare the different simulation
results. In the formula below numFBase and numSBase are the simulated fetch and sam-
ple counts for a re-evaluation algorithm using the same initial interval and no optimizations.
numFinitial and numSinitial are the number of fetches performed and the number of samples
discovered on the initial evaluation of each URL.
fetchReductionA = 1− numFA − numFinitial
numFBase − numFinitial(4.1)
sampleCostA = 1− numSA − numSinitialnumSBase − numSintitial
(4.2)
nSuccessA = (numFBase − numFA)− α× (numSBase − numSA) (4.3)
41
4.3. Simulation Methodology
Determining α
The α value introduced above represents the relative cost of each new sample discovered in
terms of the number of fetches spent to get that sample. This is a very subjective value, and
the means to properly calculate this value for a given environment is not something addressed by
this research. I conducted a survey of SophosLabs analysts and developers, asking the following
question: “How many fetches would you spend to get a single sample we have not seen before?”.
The average from a collection of 18 valid responses was 8.2 (standard deviation was 11.9); full
details of the survey are available in Appendix A.5. In Chapter 5, I present normalized success
scores for each of the following α values: 8.2, 100, 1000, and 10000.
42
Chapter 5
Results
I performed multiple experiments using data collected by the Tachyon Detection Grid (TDG)
between May 2011 and July 2011. This section presents the results and analysis of these exper-
iments. Section 5.1 presents analysis of the data collected from the zero provenance malware
repositories and an evaluation of the proposed optimizations. Section 5.2 presents analysis of
the data collected from Fake AV MDNs and an evaluation of the proposed optimizations.
5.1 Optimizing Re-Evaluation of Zero Provenance Malware
Repositories
This section analyzes the data gathered from repeatedly making requests to known malware
repositories. The composition of the data set is provided in Section 5.1.2. In Section 5.1.3 I
present results from analysis of the collected data. In Section 5.1.4 I evaluate the optimizations
proposed in Section 3.1 and quantify the improvements provided.
5.1.1 Simulation Terminology
These terms are used in the sections that follow.
Conditional Probability of Repository Update Behaviours
I present calculations to determine the conditional probability of repository update behaviour
given the initial detection values. The following terms are used:
43
5.1. Optimizing Re-Evaluation of Zero Provenance Malware Repositories
P (S|d) The probability that a URL is a single sample repository given the initial detection
d
P (M |d) The probability that a URL is a multiple sample repository given the initial detec-
tion d
P (P |d) The probability that a URL is a polymorphic repository given the initial detection
d
Zero Provenance Malware Repository Re-Evaluation Optimizations
I apply eight distinct optimizations, grouped into three types: state-based cutoffs (ct), state-
based backoffs (bk), and conditional probability (cp) optimizations, all of which are presented
in Section 3.1. When referring to a simulation that used all optimizations in a group I use the
∀ symbol to indicate that all the optimizations in this group were applied (e.g., ct(∀) indicates
all of the state-based cutoffs were applied to the simulation). When a single optimization is
applied, a short hand notation, enumerated below, is used (e.g., ct(s) refers to a simulation
where only the state based cutoff for the single sample state was used).
cp(s) single sample conditional probability optimization
cp(m) multiple sample conditional probability optimization
ct(i) unresponsive cutoff optimization
ct(s) single sample cutoff optimization
ct(ae) active no exe ever cutoff optimization
ct(an) active no exe right now cutoff optimization
bk(s) single sample backoff optimization
bk(ae) active no exe ever backoff optimization
bk(an) active no exe right now backoff optimization
5.1.2 Malware Repository Data Set
This data set is composed of fetches to confirmed malware repositories. For future reference
I refer to this as the low interaction repository data set. 728325 fetches were made to 8539
URLs between May 23, 2011 and July 6, 2011. The data set was further filtered (details
and motivation of filtering are provided in Section 4.2) to eliminate 1457 URLs that served
44
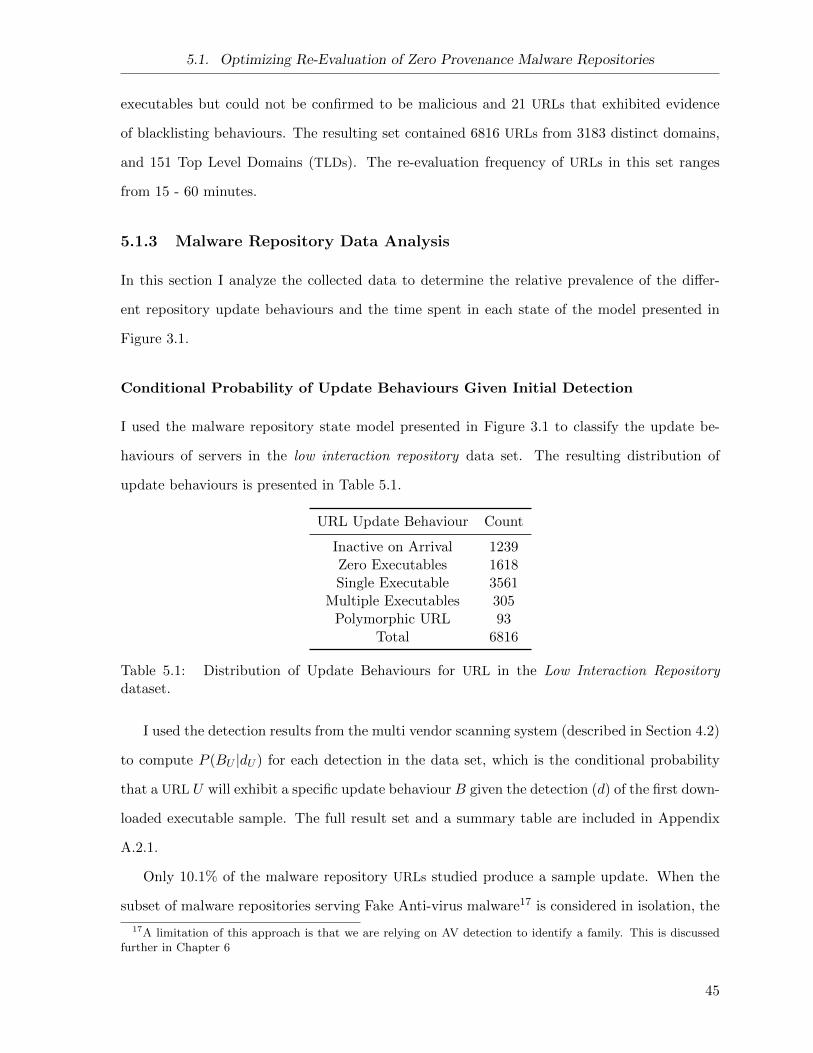
5.1. Optimizing Re-Evaluation of Zero Provenance Malware Repositories
executables but could not be confirmed to be malicious and 21 URLs that exhibited evidence
of blacklisting behaviours. The resulting set contained 6816 URLs from 3183 distinct domains,
and 151 Top Level Domains (TLDs). The re-evaluation frequency of URLs in this set ranges
from 15 - 60 minutes.
5.1.3 Malware Repository Data Analysis
In this section I analyze the collected data to determine the relative prevalence of the differ-
ent repository update behaviours and the time spent in each state of the model presented in
Figure 3.1.
Conditional Probability of Update Behaviours Given Initial Detection
I used the malware repository state model presented in Figure 3.1 to classify the update be-
haviours of servers in the low interaction repository data set. The resulting distribution of
update behaviours is presented in Table 5.1.
URL Update Behaviour Count
Inactive on Arrival 1239Zero Executables 1618Single Executable 3561
Multiple Executables 305Polymorphic URL 93
Total 6816
Table 5.1: Distribution of Update Behaviours for URL in the Low Interaction Repositorydataset.
I used the detection results from the multi vendor scanning system (described in Section 4.2)
to compute P (BU |dU ) for each detection in the data set, which is the conditional probability
that a URL U will exhibit a specific update behaviour B given the detection (d) of the first down-
loaded executable sample. The full result set and a summary table are included in Appendix
A.2.1.
Only 10.1% of the malware repository URLs studied produce a sample update. When the
subset of malware repositories serving Fake Anti-virus malware17 is considered in isolation, the
17A limitation of this approach is that we are relying on AV detection to identify a family. This is discussedfurther in Chapter 6
45
5.1. Optimizing Re-Evaluation of Zero Provenance Malware Repositories
probability of sample update increases to nearly 30%. The conditional probability analysis
revealed 89 distinct detection groups that triggered on malware from repositories that showed
sample update behaviour. For 54 of these detection types P (M |d) was over 50%. However, this
observation is limited by our small data set and the challenges of grouping malware by detection
name: of the 54 detections exhibiting a high probability of sample update behaviour, only 5 of
these detections were observed from at least 5 distinct domains (i.e., n(d) ≥ 5). Indeed, from
the 3959 URLs in this corpus that served at least one piece of malware, there were 1470 unique
initial detections, even after I made efforts to group different sample variants into the same
family (e.g., Mal/Bad-A and Mal/Bad-B are combined to make the Mal/Bad family).
There were many malware families that were served almost exclusively from single sample
repositories. Nearly 50% of the corpus can be mapped to 113 distinct detections whose P (S|d)
value was over 70%. This suggests that the early cutoff based on P (S|d) computations can
provide substantial resource savings.
Malware Repository State Transition Thresholds
In this section I analyze the data collected looking for the most appropriate thresholds for
several re-evaluation cutoff decisions. The malware repository state model (Figure 3.1) shows
six18 subjective state transitions to the “stop fetching” state. The state diagram and motivation
for each of these cutoffs are rooted in the AIR goals presented in Chapter 3. Essentially,
repositories in each of these states are not “interesting”, so I want to stop wasting resources
on them; however, some repositories will transition from these uninteresting states back to
interesting ones. If I discontinue evaluation too soon I lose interesting data. If I wait too long,
I waste resources unnecessarily.
To determine appropriate thresholds to discontinue fetching at each of these states, I ana-
lyzed the low interaction repository dataset looking for repositories that entered into one of the
uninteresting states and then transitioned back to an interesting state. For example, for the
active no exe ever state, I looked for repositories that transitioned from this state into any of
the “Exe” states. For each repository that makes one of these transitions, I recorded the max-
18Figure 3.1 shows 5 subjective transitions but I have split the inactive transition into ’Initial’ and ’Intermediate’as they produced distinct distributions.
46
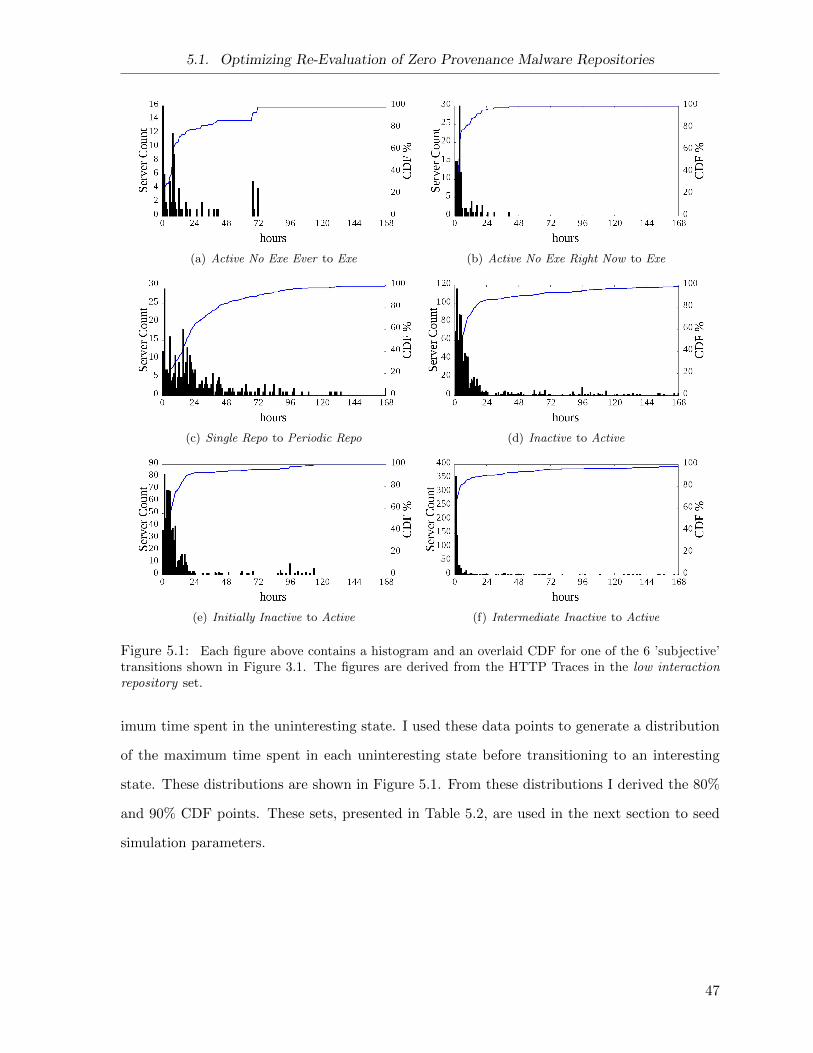
5.1. Optimizing Re-Evaluation of Zero Provenance Malware Repositories
(a) Active No Exe Ever to Exe (b) Active No Exe Right Now to Exe
(c) Single Repo to Periodic Repo (d) Inactive to Active
(e) Initially Inactive to Active (f) Intermediate Inactive to Active
Figure 5.1: Each figure above contains a histogram and an overlaid CDF for one of the 6 ’subjective’transitions shown in Figure 3.1. The figures are derived from the HTTP Traces in the low interactionrepository set.
imum time spent in the uninteresting state. I used these data points to generate a distribution
of the maximum time spent in each uninteresting state before transitioning to an interesting
state. These distributions are shown in Figure 5.1. From these distributions I derived the 80%
and 90% CDF points. These sets, presented in Table 5.2, are used in the next section to seed
simulation parameters.
47
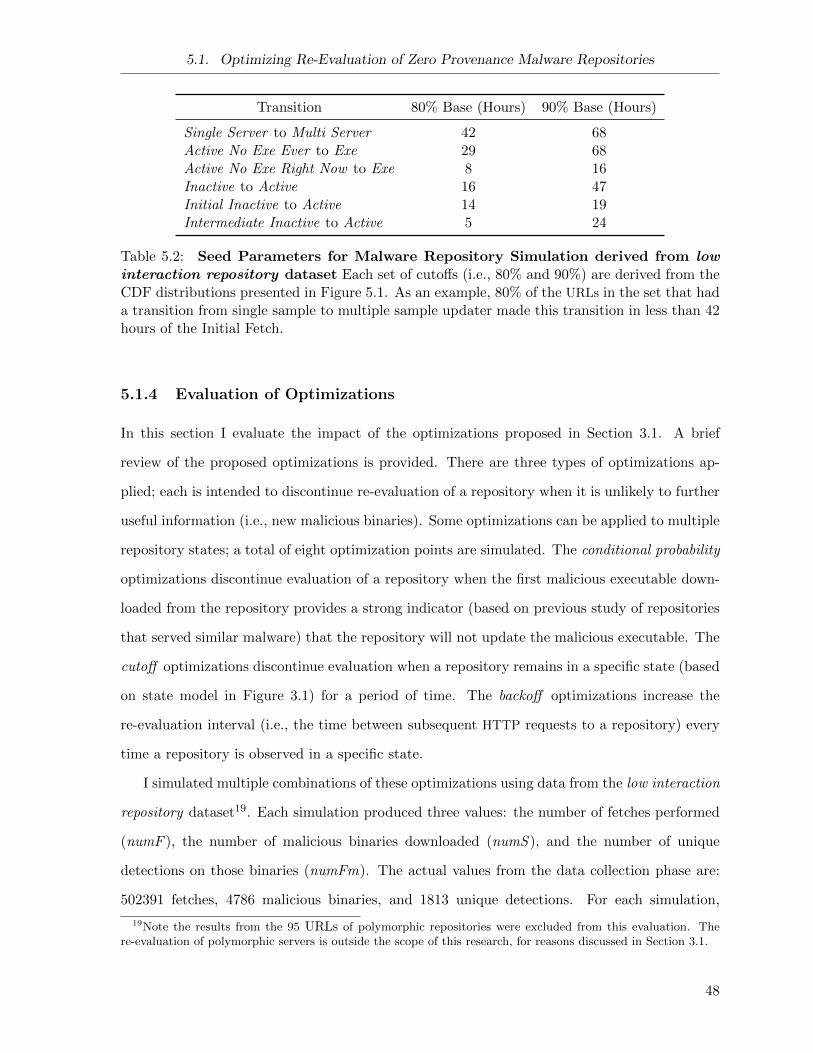
5.1. Optimizing Re-Evaluation of Zero Provenance Malware Repositories
Transition 80% Base (Hours) 90% Base (Hours)
Single Server to Multi Server 42 68Active No Exe Ever to Exe 29 68Active No Exe Right Now to Exe 8 16Inactive to Active 16 47Initial Inactive to Active 14 19Intermediate Inactive to Active 5 24
Table 5.2: Seed Parameters for Malware Repository Simulation derived from lowinteraction repository dataset Each set of cutoffs (i.e., 80% and 90%) are derived from theCDF distributions presented in Figure 5.1. As an example, 80% of the URLs in the set that hada transition from single sample to multiple sample updater made this transition in less than 42hours of the Initial Fetch.
5.1.4 Evaluation of Optimizations
In this section I evaluate the impact of the optimizations proposed in Section 3.1. A brief
review of the proposed optimizations is provided. There are three types of optimizations ap-
plied; each is intended to discontinue re-evaluation of a repository when it is unlikely to further
useful information (i.e., new malicious binaries). Some optimizations can be applied to multiple
repository states; a total of eight optimization points are simulated. The conditional probability
optimizations discontinue evaluation of a repository when the first malicious executable down-
loaded from the repository provides a strong indicator (based on previous study of repositories
that served similar malware) that the repository will not update the malicious executable. The
cutoff optimizations discontinue evaluation when a repository remains in a specific state (based
on state model in Figure 3.1) for a period of time. The backoff optimizations increase the
re-evaluation interval (i.e., the time between subsequent HTTP requests to a repository) every
time a repository is observed in a specific state.
I simulated multiple combinations of these optimizations using data from the low interaction
repository dataset19. Each simulation produced three values: the number of fetches performed
(numF ), the number of malicious binaries downloaded (numS ), and the number of unique
detections on those binaries (numFm). The actual values from the data collection phase are:
502391 fetches, 4786 malicious binaries, and 1813 unique detections. For each simulation,
19Note the results from the 95 URLs of polymorphic repositories were excluded from this evaluation. There-evaluation of polymorphic servers is outside the scope of this research, for reasons discussed in Section 3.1.
48
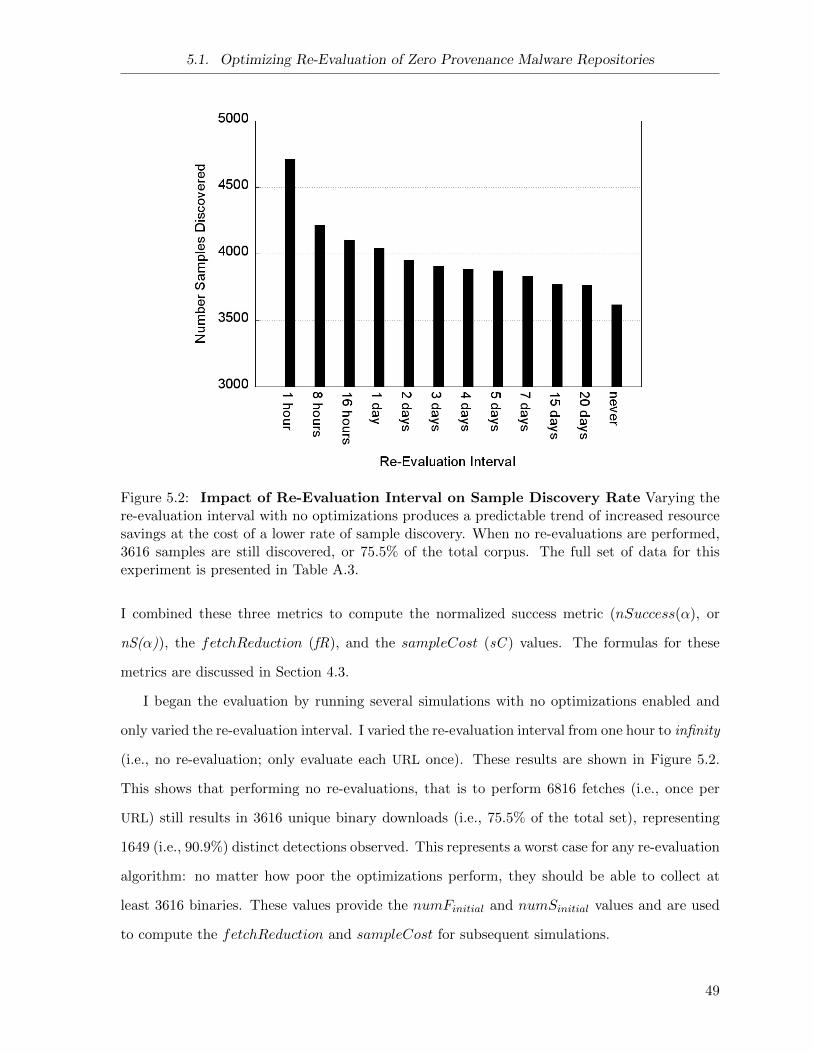
5.1. Optimizing Re-Evaluation of Zero Provenance Malware Repositories
Figure 5.2: Impact of Re-Evaluation Interval on Sample Discovery Rate Varying there-evaluation interval with no optimizations produces a predictable trend of increased resourcesavings at the cost of a lower rate of sample discovery. When no re-evaluations are performed,3616 samples are still discovered, or 75.5% of the total corpus. The full set of data for thisexperiment is presented in Table A.3.
I combined these three metrics to compute the normalized success metric (nSuccess(α), or
nS(α)), the fetchReduction (fR), and the sampleCost (sC ) values. The formulas for these
metrics are discussed in Section 4.3.
I began the evaluation by running several simulations with no optimizations enabled and
only varied the re-evaluation interval. I varied the re-evaluation interval from one hour to infinity
(i.e., no re-evaluation; only evaluate each URL once). These results are shown in Figure 5.2.
This shows that performing no re-evaluations, that is to perform 6816 fetches (i.e., once per
URL) still results in 3616 unique binary downloads (i.e., 75.5% of the total set), representing
1649 (i.e., 90.9%) distinct detections observed. This represents a worst case for any re-evaluation
algorithm: no matter how poor the optimizations perform, they should be able to collect at
least 3616 binaries. These values provide the numFinitial and numSinitial values and are used
to compute the fetchReduction and sampleCost for subsequent simulations.
49
5.1. Optimizing Re-Evaluation of Zero Provenance Malware Repositories
To better understand the impact of each optimization, I compared the results of each of
the optimizations proposed in Section 3.1 against a naive fixed interval scheduler, and also
evaluated the cumulative impact of several optimization combinations. I chose a relatively low
initial re-evaluation interval of 1 hour for these simulations in order to maximize the differences
in fetch volume produced between different simulations. This allows better understanding of
the individual contribution of each optimization. The results are shown in Figure 5.3.
The results show a wide range of fetch savings depending on the optimization combination
used. The single sample cutoff optimization (ct(s)) and the single sample backoff optimization
(bk(s)) provide the largest individual reduction in fetch volume: 53% and 61% respectively. The
single sample conditional probability optimization (cp(s)) also produced a significant reduction
in fetch volume (i.e., 21%), however this optimization produced a much larger cost in samples
versus the previous two single optimizations (i.e., 29% sample loss vs 1-4%). In terms of
optimization combinations, “all on” produced the largest fetch reduction but also had the
largest cost in terms of sample discovery. When the conditional probability optimizations were
removed the simulation produced a fetch reduction of 93% with a relatively small sample cost
of 7%.
Next I determine if the initial re-evaluation interval has an effect on the optimizations. I
simulated each optimization combination with re-evaluation interval values of 1 hour, 8 hours,
16 hours, and 1 day. For each re-evaluation interval, I select the top 4 optimization combina-
tions and present the fetch reduction versus the sample discovery, and the normalized success
scores, in Figure 5.4. For all initial re-evaluation intervals, when α is set low (e.g., 8.2), which
corresponds to a bias toward fetch reduction, the full set of optimizations produced the best
normalized success score. As α increases, more conservative set of optimizations produce better
normalized success scores. For all re-evaluation intervals that were simulated, the ct(∀) sim-
ulation group produced the highest normalized success score when α is at the highest value
simulated (i.e., 10000). Another factor dependant on the initial re-evaluation interval is the
impact of the optimizations: the normalized fetch reduction and sample cost of the backoff
optimizations drop as the initial re-evaluation interval increases. These values remain relatively
constant or the cutoff optimizations.
Finally, I explore the impact of the varying the threshold values for each of the three
50
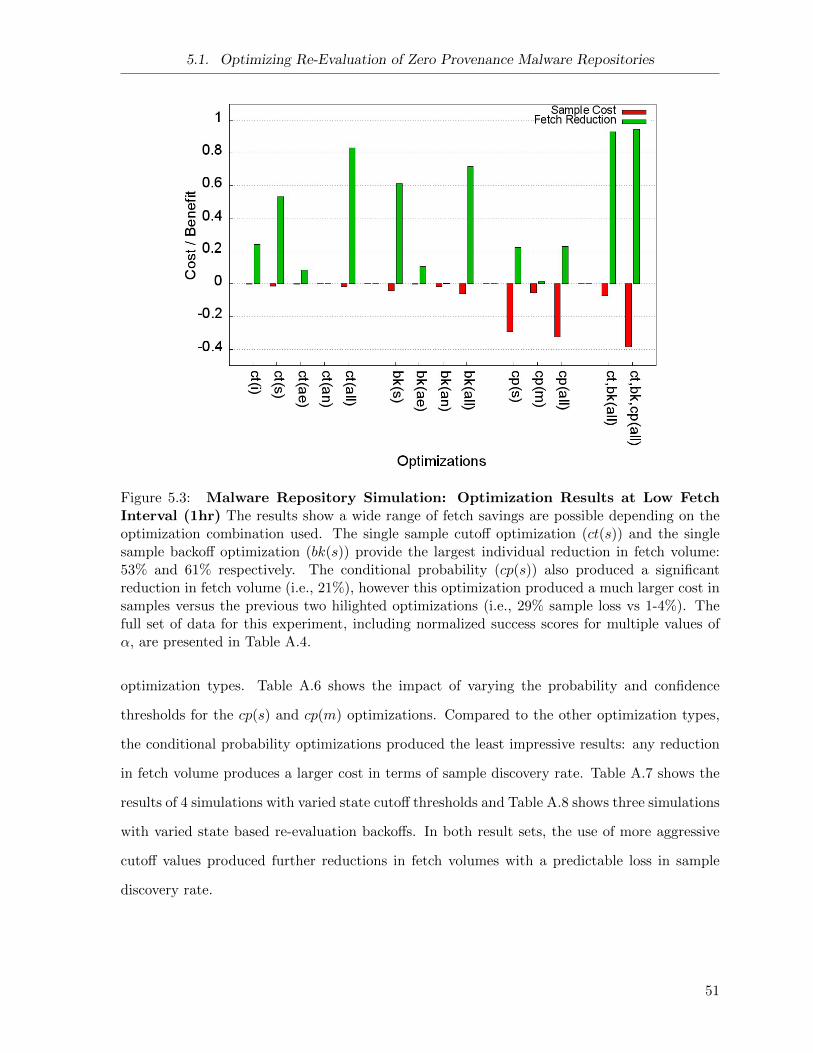
5.1. Optimizing Re-Evaluation of Zero Provenance Malware Repositories
Figure 5.3: Malware Repository Simulation: Optimization Results at Low FetchInterval (1hr) The results show a wide range of fetch savings are possible depending on theoptimization combination used. The single sample cutoff optimization (ct(s)) and the singlesample backoff optimization (bk(s)) provide the largest individual reduction in fetch volume:53% and 61% respectively. The conditional probability (cp(s)) also produced a significantreduction in fetch volume (i.e., 21%), however this optimization produced a much larger cost insamples versus the previous two hilighted optimizations (i.e., 29% sample loss vs 1-4%). Thefull set of data for this experiment, including normalized success scores for multiple values ofα, are presented in Table A.4.
optimization types. Table A.6 shows the impact of varying the probability and confidence
thresholds for the cp(s) and cp(m) optimizations. Compared to the other optimization types,
the conditional probability optimizations produced the least impressive results: any reduction
in fetch volume produces a larger cost in terms of sample discovery rate. Table A.7 shows the
results of 4 simulations with varied state cutoff thresholds and Table A.8 shows three simulations
with varied state based re-evaluation backoffs. In both result sets, the use of more aggressive
cutoff values produced further reductions in fetch volumes with a predictable loss in sample
discovery rate.
51
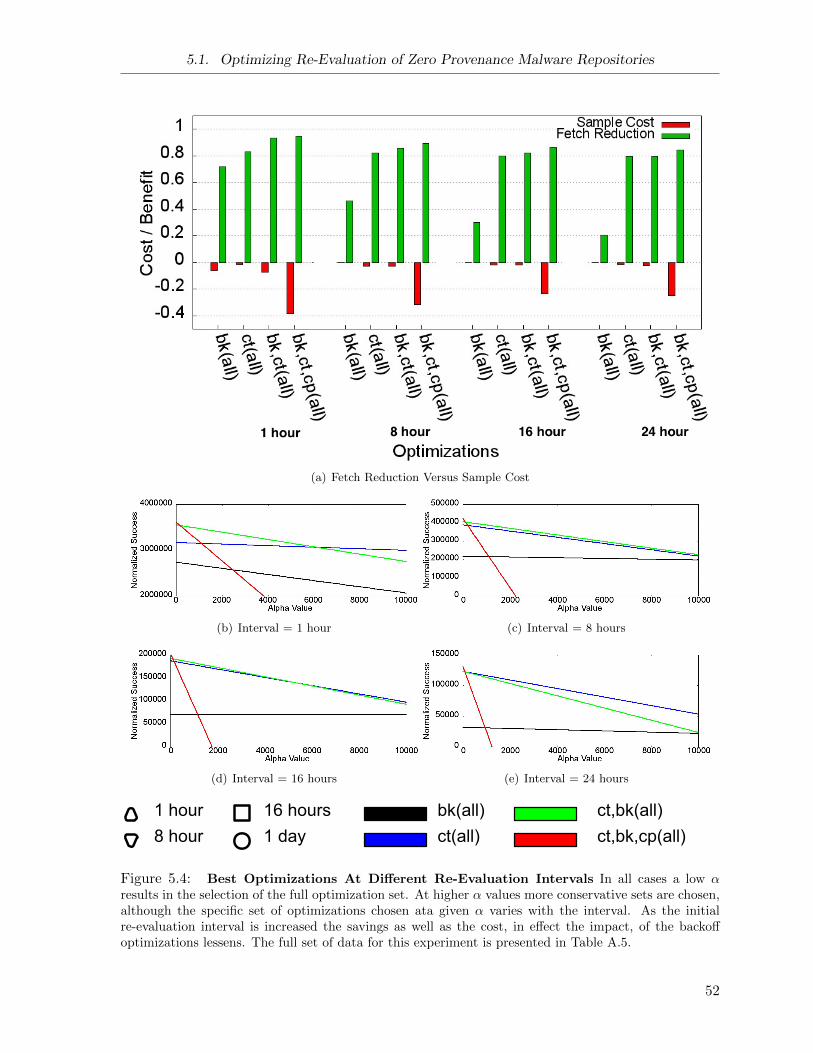
5.1. Optimizing Re-Evaluation of Zero Provenance Malware Repositories
(a) Fetch Reduction Versus Sample Cost
(b) Interval = 1 hour (c) Interval = 8 hours
(d) Interval = 16 hours (e) Interval = 24 hours
1 hour1 day
bk(all)ct,bk,cp(all)ct,bk(all)
ct(all)8 hour16 hours
Figure 5.4: Best Optimizations At Different Re-Evaluation Intervals In all cases a low αresults in the selection of the full optimization set. At higher α values more conservative sets are chosen,although the specific set of optimizations chosen ata given α varies with the interval. As the initialre-evaluation interval is increased the savings as well as the cost, in effect the impact, of the backoffoptimizations lessens. The full set of data for this experiment is presented in Table A.5.
52
5.1. Optimizing Re-Evaluation of Zero Provenance Malware Repositories
5.1.5 Summary
Analysis of the low interaction repository data set showed that only 10% of the active repos-
itories served more than one malicious executable. Evaluation of the proposed optimizations
using the collected data showed that the state based cutoff and backoff optimizations provide
large reductions in fetch volume with a small reduction in sample discovery rate. The use of
conditional probability optimizations introduced a large reduction of sample discovery rate. The
effectiveness of the conditional probability optimizations may have been compromised by my
inability to identify malware families using anti-virus detections; this is discussed further in
Chapter 6.
53
5.2. Optimizing Re-Evaluation Fake AV Distribution Networks
5.2 Optimizing Re-Evaluation Fake AV Distribution Networks
This section analyzes the data gathered from malware networks distributing Fake AV by re-
peatedly visiting the landing pages and following the path of redirects using a HIHCs. The
composition of the data set is provided in Section 5.2.1. In Section 5.2.2 I present results from
analysis of the collected data. In Section 5.2.3 I evaluate the optimizations that were proposed
in Section 3.2.
5.2.1 Fake AV Data Set
The data set includes high interaction fetches originating at the landing pages of Fake AV
distribution networks advertised by SEO poisoning. The landing pages in this data set were
taken from Sophos product feedback: any URL visited by a Sophos customer that triggers a
web content detection is sent back to Sophos for analysis. I selected URLs from this feedback
that triggered specific detections on known landing page content. For future reference I refer
to this as the Fake AV data set.
The data set consists of 22,393 fetch logs. After filtering out fetch logs that did not yield a
binary executable, 5,075 fetch logs remain. This dataset includes 634 URLs from 608 domains
across 65 TLDs. Each site was confirmed to be serving as a landing page in a Fake AV MDN
before being included in the dataset. The re-evaluation frequency in this set ranges from 2 - 4
hours for landing pages and 10 - 30 minutes for malware repositories.20
5.2.2 Fake AV Data Analysis
Our21 analysis produced results consistent with previous Fake AV studies [RBM+10] performed
by Rajab et al. in 2009 : Fake AV MDNs are updating the malware repositories and malicious
payloads on a frequent basis, and there is still a strong fan in factor from the landing pages to
the malware repository. This section describes our solution to identify each Fake AV MDN and
presents the behavioural differences between the different MDNs.
20Whenever possible the malware repositories were directly evaluated from separate pools of IP addresses athigher frequency to supplement the data set.
21Section 5.2.2 and Section 5.2.3 contain analysis of the Fake AV data set that was printed verbatim in[KZRB11]. This analysis and resulting write up was performed in collaboration with Onur Komili, and includedin this thesis as well as the Virus Bulletin paper. See the Statement of Authorship for more details.
54
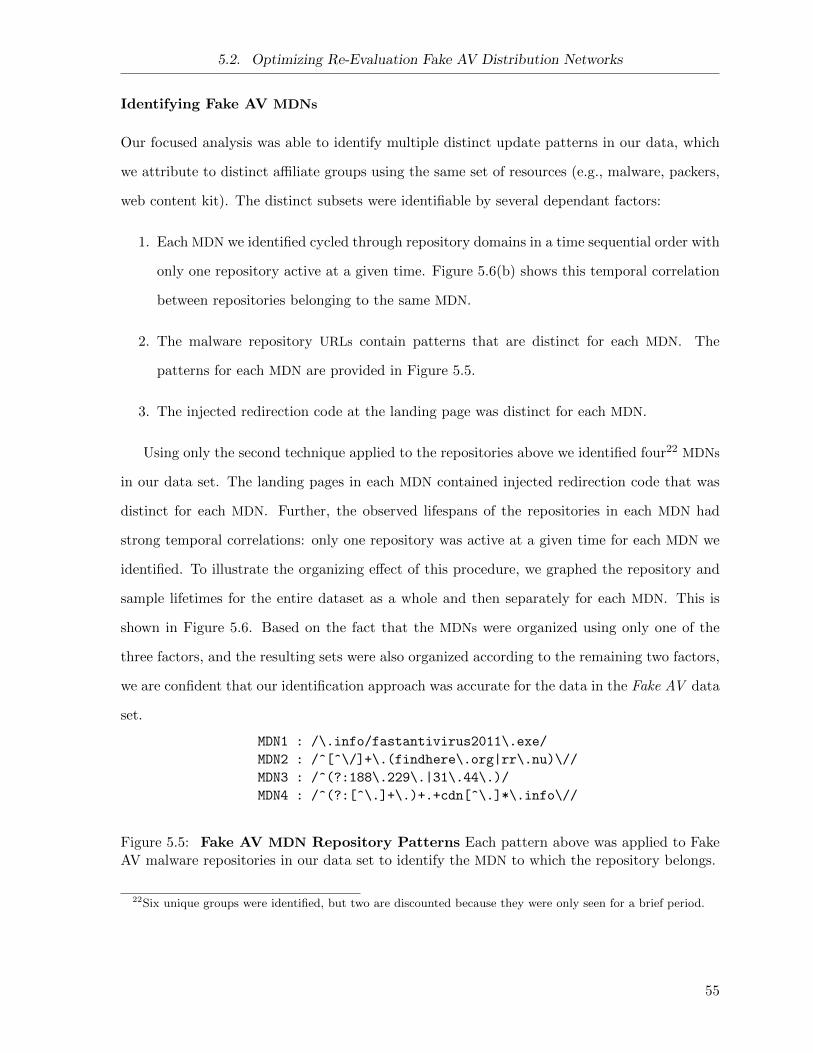
5.2. Optimizing Re-Evaluation Fake AV Distribution Networks
Identifying Fake AV MDNs
Our focused analysis was able to identify multiple distinct update patterns in our data, which
we attribute to distinct affiliate groups using the same set of resources (e.g., malware, packers,
web content kit). The distinct subsets were identifiable by several dependant factors:
1. Each MDN we identified cycled through repository domains in a time sequential order with
only one repository active at a given time. Figure 5.6(b) shows this temporal correlation
between repositories belonging to the same MDN.
2. The malware repository URLs contain patterns that are distinct for each MDN. The
patterns for each MDN are provided in Figure 5.5.
3. The injected redirection code at the landing page was distinct for each MDN.
Using only the second technique applied to the repositories above we identified four22 MDNs
in our data set. The landing pages in each MDN contained injected redirection code that was
distinct for each MDN. Further, the observed lifespans of the repositories in each MDN had
strong temporal correlations: only one repository was active at a given time for each MDN we
identified. To illustrate the organizing effect of this procedure, we graphed the repository and
sample lifetimes for the entire dataset as a whole and then separately for each MDN. This is
shown in Figure 5.6. Based on the fact that the MDNs were organized using only one of the
three factors, and the resulting sets were also organized according to the remaining two factors,
we are confident that our identification approach was accurate for the data in the Fake AV data
set.
MDN1 : /\.info/fastantivirus2011\.exe/
MDN2 : /^[^\/]+\.(findhere\.org|rr\.nu)\//
MDN3 : /^(?:188\.229\.|31\.44\.)/
MDN4 : /^(?:[^\.]+\.)+.+cdn[^\.]*\.info\//
Figure 5.5: Fake AV MDN Repository Patterns Each pattern above was applied to FakeAV malware repositories in our data set to identify the MDN to which the repository belongs.
22Six unique groups were identified, but two are discounted because they were only seen for a brief period.
55
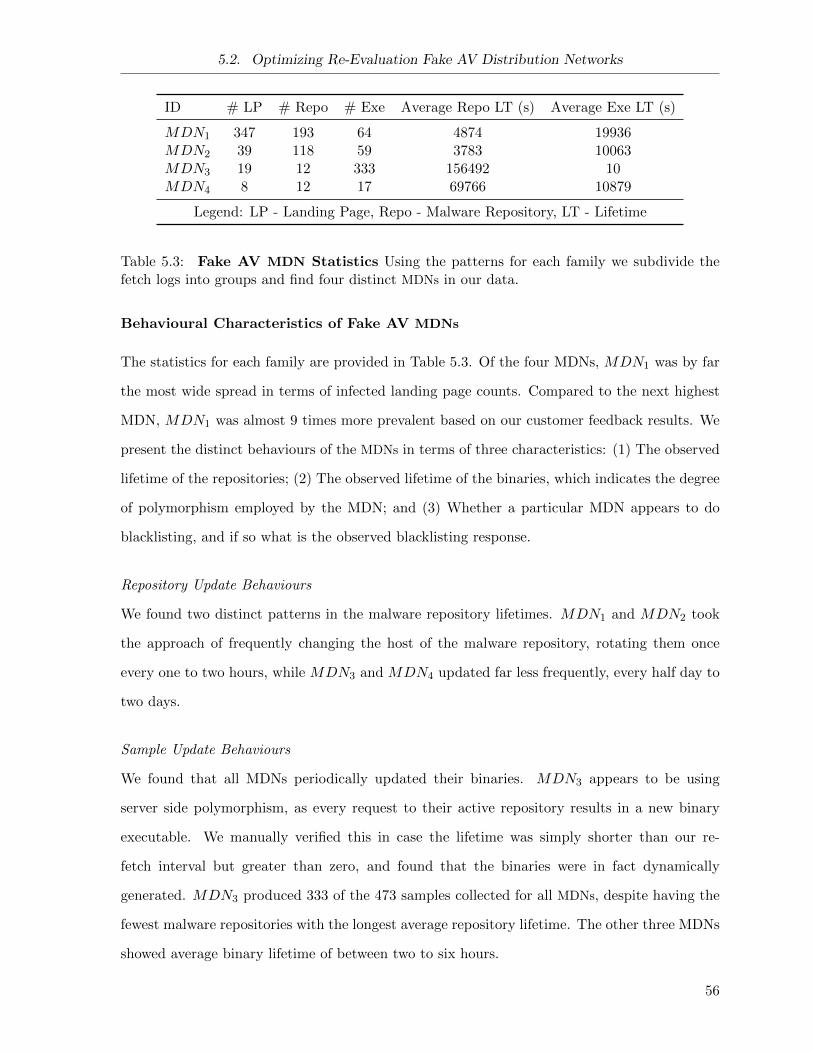
5.2. Optimizing Re-Evaluation Fake AV Distribution Networks
ID # LP # Repo # Exe Average Repo LT (s) Average Exe LT (s)
MDN1 347 193 64 4874 19936MDN2 39 118 59 3783 10063MDN3 19 12 333 156492 10MDN4 8 12 17 69766 10879
Legend: LP - Landing Page, Repo - Malware Repository, LT - Lifetime
Table 5.3: Fake AV MDN Statistics Using the patterns for each family we subdivide thefetch logs into groups and find four distinct MDNs in our data.
Behavioural Characteristics of Fake AV MDNs
The statistics for each family are provided in Table 5.3. Of the four MDNs, MDN1 was by far
the most wide spread in terms of infected landing page counts. Compared to the next highest
MDN, MDN1 was almost 9 times more prevalent based on our customer feedback results. We
present the distinct behaviours of the MDNs in terms of three characteristics: (1) The observed
lifetime of the repositories; (2) The observed lifetime of the binaries, which indicates the degree
of polymorphism employed by the MDN; and (3) Whether a particular MDN appears to do
blacklisting, and if so what is the observed blacklisting response.
Repository Update Behaviours
We found two distinct patterns in the malware repository lifetimes. MDN1 and MDN2 took
the approach of frequently changing the host of the malware repository, rotating them once
every one to two hours, while MDN3 and MDN4 updated far less frequently, every half day to
two days.
Sample Update Behaviours
We found that all MDNs periodically updated their binaries. MDN3 appears to be using
server side polymorphism, as every request to their active repository results in a new binary
executable. We manually verified this in case the lifetime was simply shorter than our re-
fetch interval but greater than zero, and found that the binaries were in fact dynamically
generated. MDN3 produced 333 of the 473 samples collected for all MDNs, despite having the
fewest malware repositories with the longest average repository lifetime. The other three MDNs
showed average binary lifetime of between two to six hours.
56
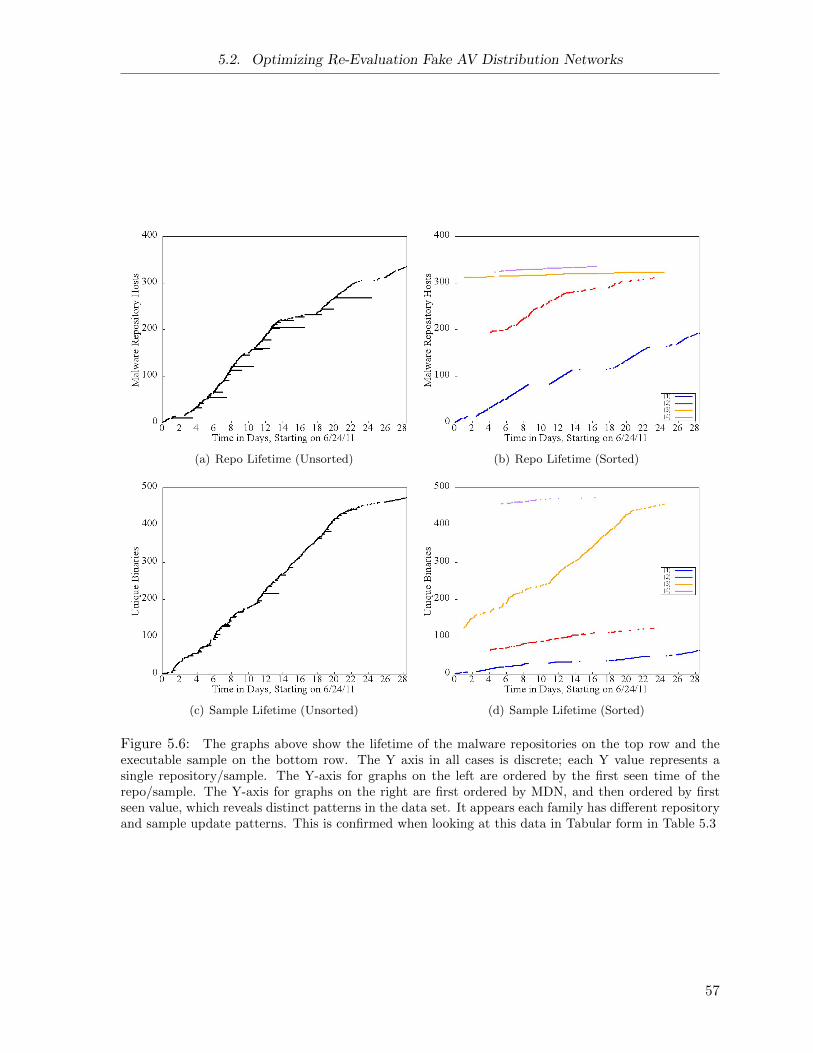
5.2. Optimizing Re-Evaluation Fake AV Distribution Networks
(a) Repo Lifetime (Unsorted) (b) Repo Lifetime (Sorted)
(c) Sample Lifetime (Unsorted) (d) Sample Lifetime (Sorted)
Figure 5.6: The graphs above show the lifetime of the malware repositories on the top row and theexecutable sample on the bottom row. The Y axis in all cases is discrete; each Y value represents asingle repository/sample. The Y-axis for graphs on the left are ordered by the first seen time of therepo/sample. The Y-axis for graphs on the right are first ordered by MDN, and then ordered by firstseen value, which reveals distinct patterns in the data set. It appears each family has different repositoryand sample update patterns. This is confirmed when looking at this data in Tabular form in Table 5.3
57
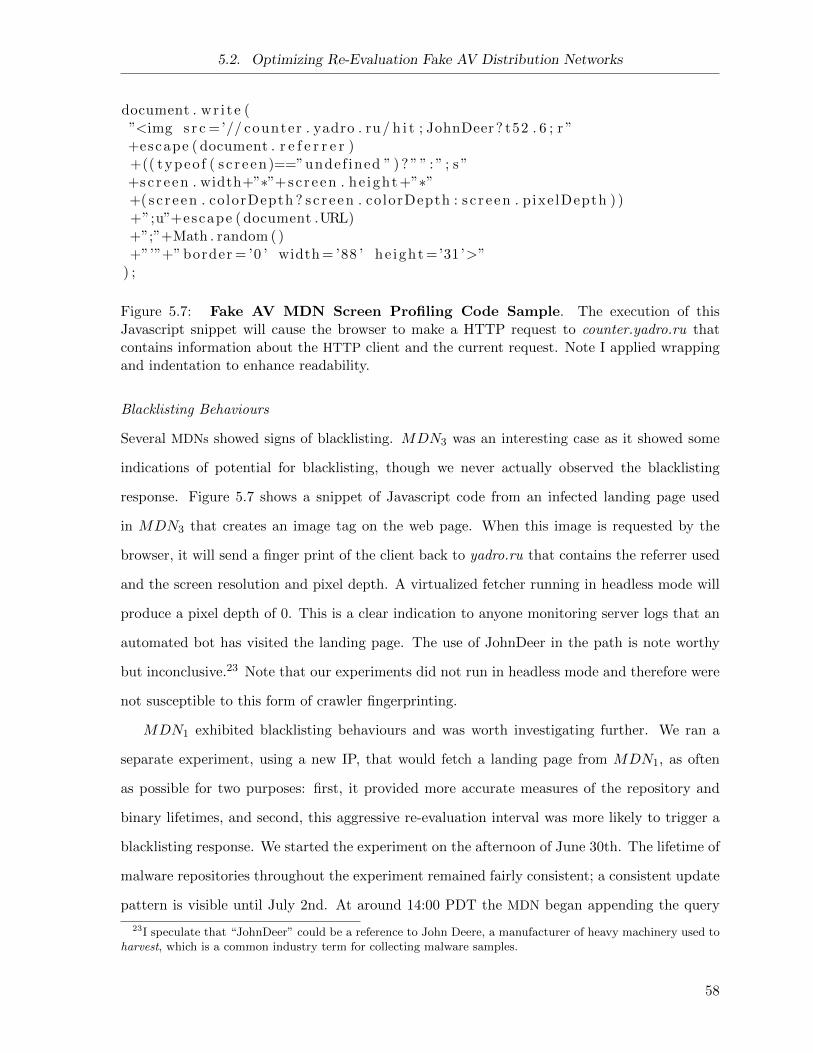
5.2. Optimizing Re-Evaluation Fake AV Distribution Networks
document . wr i t e (”<img s r c =’// counter . yadro . ru/ h i t ; JohnDeer? t52 . 6 ; r ”+escape ( document . r e f e r r e r )+(( typeo f ( s c r e en)==”undef ined ” ) ? ” ” : ” ; s ”+sc r een . width+”∗”+sc reen . he ight +”∗”+( sc r e en . colorDepth ? sc r e en . colorDepth : s c r e en . pixe lDepth ) )+”;u”+escape ( document .URL)+”;”+Math . random ( )+”’”+” border = ’0 ’ width = ’88 ’ he ight =’31’>”
) ;
Figure 5.7: Fake AV MDN Screen Profiling Code Sample. The execution of thisJavascript snippet will cause the browser to make a HTTP request to counter.yadro.ru thatcontains information about the HTTP client and the current request. Note I applied wrappingand indentation to enhance readability.
Blacklisting Behaviours
Several MDNs showed signs of blacklisting. MDN3 was an interesting case as it showed some
indications of potential for blacklisting, though we never actually observed the blacklisting
response. Figure 5.7 shows a snippet of Javascript code from an infected landing page used
in MDN3 that creates an image tag on the web page. When this image is requested by the
browser, it will send a finger print of the client back to yadro.ru that contains the referrer used
and the screen resolution and pixel depth. A virtualized fetcher running in headless mode will
produce a pixel depth of 0. This is a clear indication to anyone monitoring server logs that an
automated bot has visited the landing page. The use of JohnDeer in the path is note worthy
but inconclusive.23 Note that our experiments did not run in headless mode and therefore were
not susceptible to this form of crawler fingerprinting.
MDN1 exhibited blacklisting behaviours and was worth investigating further. We ran a
separate experiment, using a new IP, that would fetch a landing page from MDN1, as often
as possible for two purposes: first, it provided more accurate measures of the repository and
binary lifetimes, and second, this aggressive re-evaluation interval was more likely to trigger a
blacklisting response. We started the experiment on the afternoon of June 30th. The lifetime of
malware repositories throughout the experiment remained fairly consistent; a consistent update
pattern is visible until July 2nd. At around 14:00 PDT the MDN began appending the query
23I speculate that “JohnDeer” could be a reference to John Deere, a manufacturer of heavy machinery used toharvest, which is a common industry term for collecting malware samples.
58
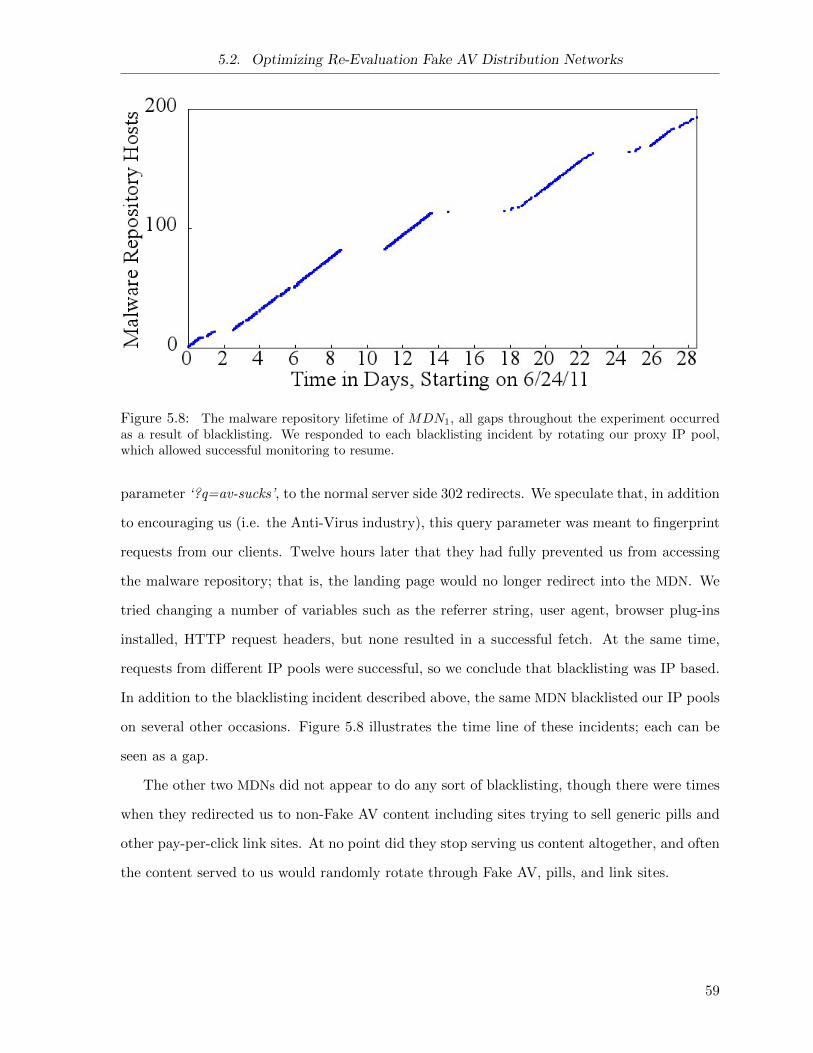
5.2. Optimizing Re-Evaluation Fake AV Distribution Networks
Figure 5.8: The malware repository lifetime of MDN1, all gaps throughout the experiment occurredas a result of blacklisting. We responded to each blacklisting incident by rotating our proxy IP pool,which allowed successful monitoring to resume.
parameter ‘?q=av-sucks’, to the normal server side 302 redirects. We speculate that, in addition
to encouraging us (i.e. the Anti-Virus industry), this query parameter was meant to fingerprint
requests from our clients. Twelve hours later that they had fully prevented us from accessing
the malware repository; that is, the landing page would no longer redirect into the MDN. We
tried changing a number of variables such as the referrer string, user agent, browser plug-ins
installed, HTTP request headers, but none resulted in a successful fetch. At the same time,
requests from different IP pools were successful, so we conclude that blacklisting was IP based.
In addition to the blacklisting incident described above, the same MDN blacklisted our IP pools
on several other occasions. Figure 5.8 illustrates the time line of these incidents; each can be
seen as a gap.
The other two MDNs did not appear to do any sort of blacklisting, though there were times
when they redirected us to non-Fake AV content including sites trying to sell generic pills and
other pay-per-click link sites. At no point did they stop serving us content altogether, and often
the content served to us would randomly rotate through Fake AV, pills, and link sites.
59
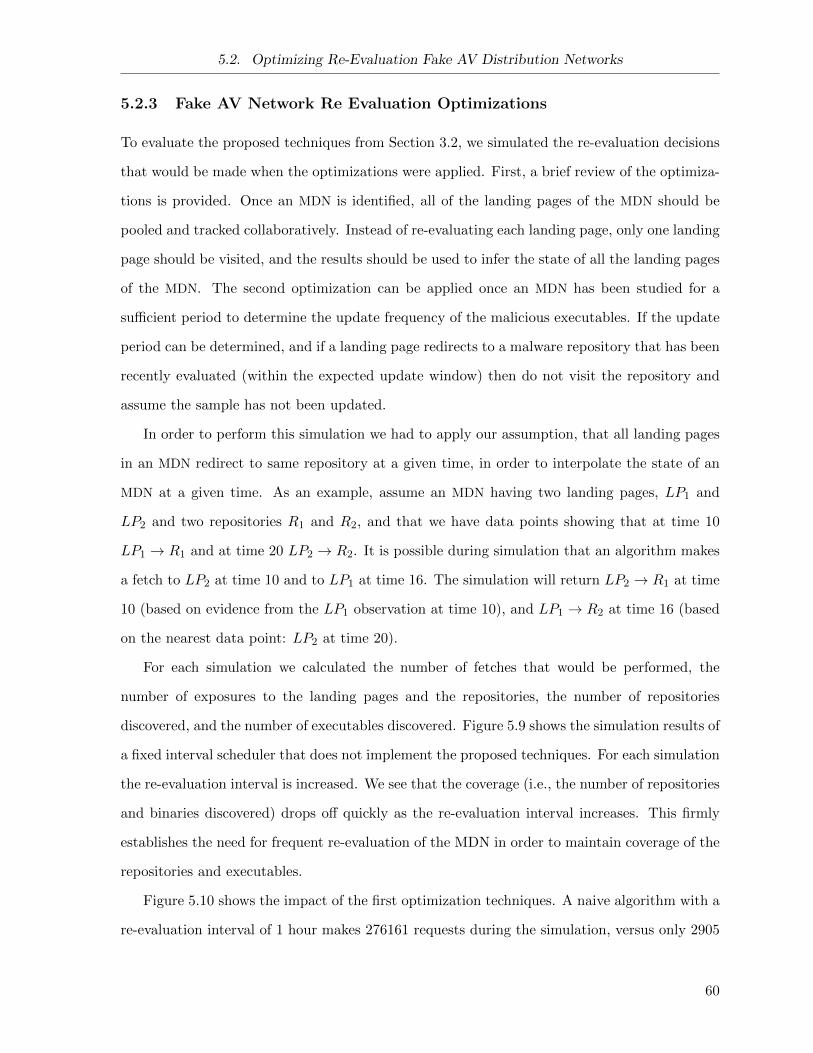
5.2. Optimizing Re-Evaluation Fake AV Distribution Networks
5.2.3 Fake AV Network Re Evaluation Optimizations
To evaluate the proposed techniques from Section 3.2, we simulated the re-evaluation decisions
that would be made when the optimizations were applied. First, a brief review of the optimiza-
tions is provided. Once an MDN is identified, all of the landing pages of the MDN should be
pooled and tracked collaboratively. Instead of re-evaluating each landing page, only one landing
page should be visited, and the results should be used to infer the state of all the landing pages
of the MDN. The second optimization can be applied once an MDN has been studied for a
sufficient period to determine the update frequency of the malicious executables. If the update
period can be determined, and if a landing page redirects to a malware repository that has been
recently evaluated (within the expected update window) then do not visit the repository and
assume the sample has not been updated.
In order to perform this simulation we had to apply our assumption, that all landing pages
in an MDN redirect to same repository at a given time, in order to interpolate the state of an
MDN at a given time. As an example, assume an MDN having two landing pages, LP1 and
LP2 and two repositories R1 and R2, and that we have data points showing that at time 10
LP1 → R1 and at time 20 LP2 → R2. It is possible during simulation that an algorithm makes
a fetch to LP2 at time 10 and to LP1 at time 16. The simulation will return LP2 → R1 at time
10 (based on evidence from the LP1 observation at time 10), and LP1 → R2 at time 16 (based
on the nearest data point: LP2 at time 20).
For each simulation we calculated the number of fetches that would be performed, the
number of exposures to the landing pages and the repositories, the number of repositories
discovered, and the number of executables discovered. Figure 5.9 shows the simulation results of
a fixed interval scheduler that does not implement the proposed techniques. For each simulation
the re-evaluation interval is increased. We see that the coverage (i.e., the number of repositories
and binaries discovered) drops off quickly as the re-evaluation interval increases. This firmly
establishes the need for frequent re-evaluation of the MDN in order to maintain coverage of the
repositories and executables.
Figure 5.10 shows the impact of the first optimization techniques. A naive algorithm with a
re-evaluation interval of 1 hour makes 276161 requests during the simulation, versus only 2905
60
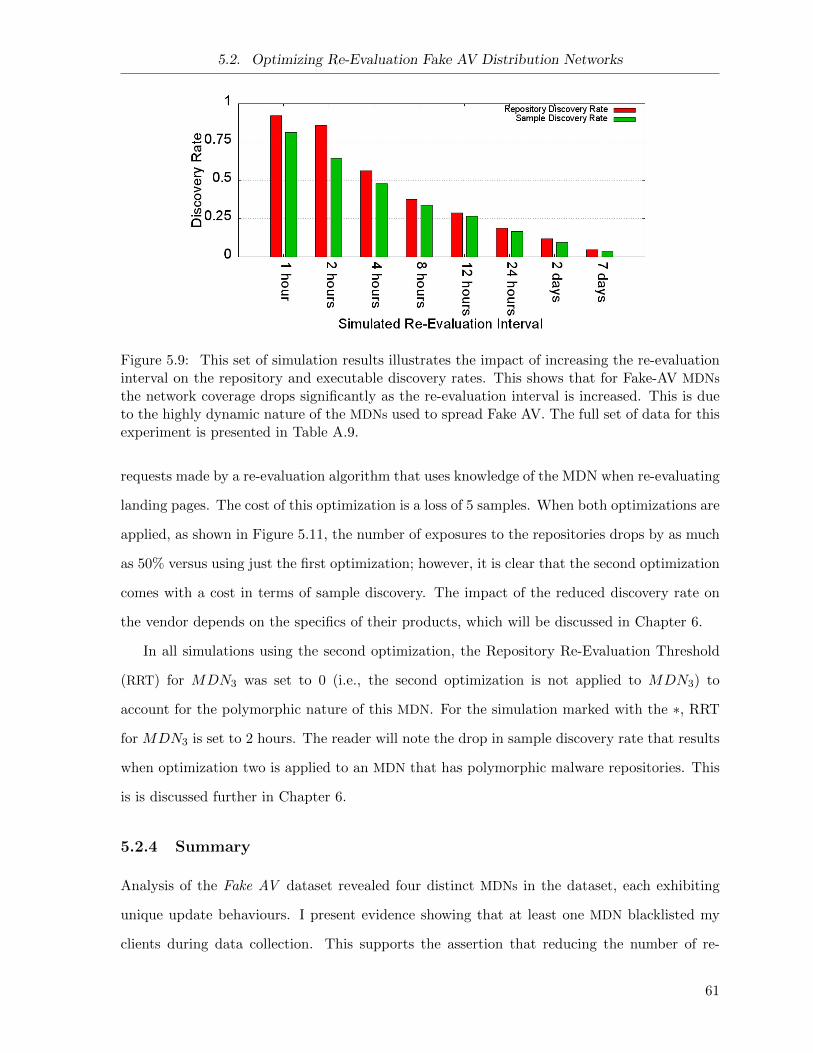
5.2. Optimizing Re-Evaluation Fake AV Distribution Networks
Figure 5.9: This set of simulation results illustrates the impact of increasing the re-evaluationinterval on the repository and executable discovery rates. This shows that for Fake-AV MDNs
the network coverage drops significantly as the re-evaluation interval is increased. This is dueto the highly dynamic nature of the MDNs used to spread Fake AV. The full set of data for thisexperiment is presented in Table A.9.
requests made by a re-evaluation algorithm that uses knowledge of the MDN when re-evaluating
landing pages. The cost of this optimization is a loss of 5 samples. When both optimizations are
applied, as shown in Figure 5.11, the number of exposures to the repositories drops by as much
as 50% versus using just the first optimization; however, it is clear that the second optimization
comes with a cost in terms of sample discovery. The impact of the reduced discovery rate on
the vendor depends on the specifics of their products, which will be discussed in Chapter 6.
In all simulations using the second optimization, the Repository Re-Evaluation Threshold
(RRT) for MDN3 was set to 0 (i.e., the second optimization is not applied to MDN3) to
account for the polymorphic nature of this MDN. For the simulation marked with the ∗, RRT
for MDN3 is set to 2 hours. The reader will note the drop in sample discovery rate that results
when optimization two is applied to an MDN that has polymorphic malware repositories. This
is is discussed further in Chapter 6.
5.2.4 Summary
Analysis of the Fake AV dataset revealed four distinct MDNs in the dataset, each exhibiting
unique update behaviours. I present evidence showing that at least one MDN blacklisted my
clients during data collection. This supports the assertion that reducing the number of re-
61
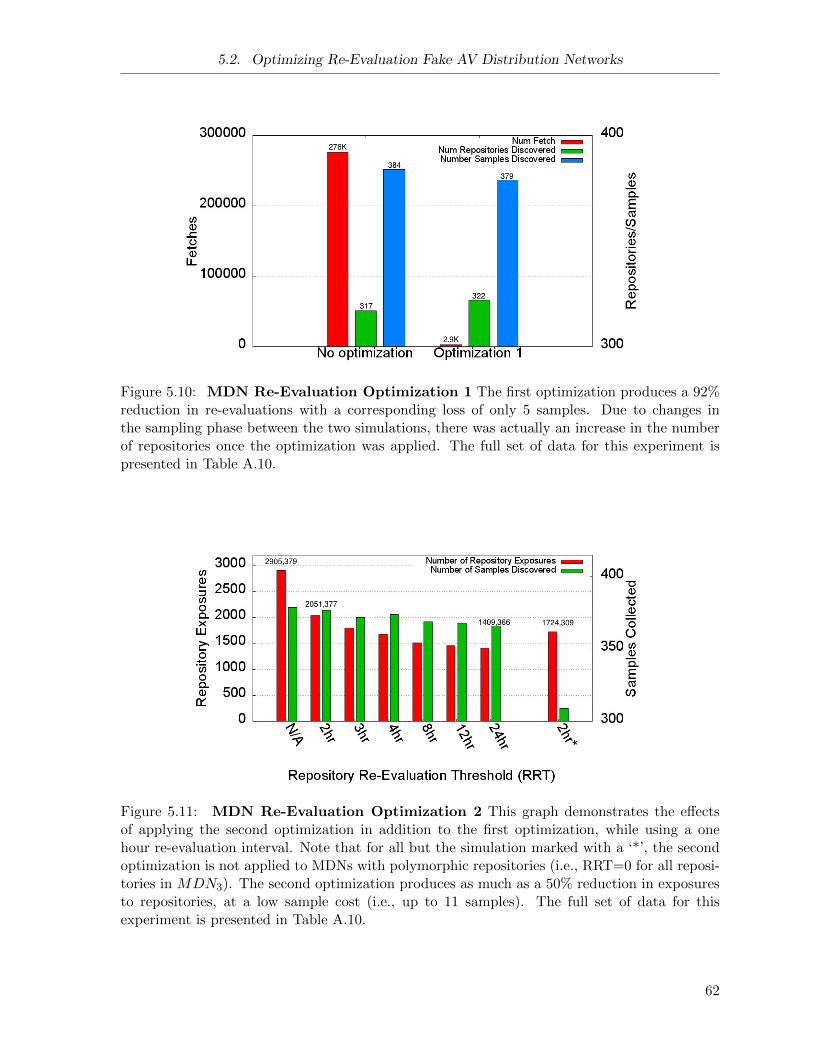
5.2. Optimizing Re-Evaluation Fake AV Distribution Networks
Figure 5.10: MDN Re-Evaluation Optimization 1 The first optimization produces a 92%reduction in re-evaluations with a corresponding loss of only 5 samples. Due to changes inthe sampling phase between the two simulations, there was actually an increase in the numberof repositories once the optimization was applied. The full set of data for this experiment ispresented in Table A.10.
Figure 5.11: MDN Re-Evaluation Optimization 2 This graph demonstrates the effectsof applying the second optimization in addition to the first optimization, while using a onehour re-evaluation interval. Note that for all but the simulation marked with a ‘*’, the secondoptimization is not applied to MDNs with polymorphic repositories (i.e., RRT=0 for all reposi-tories in MDN3). The second optimization produces as much as a 50% reduction in exposuresto repositories, at a low sample cost (i.e., up to 11 samples). The full set of data for thisexperiment is presented in Table A.10.
62
5.2. Optimizing Re-Evaluation Fake AV Distribution Networks
evaluations is necessary (assuming that reducing the number of re-evaluations will reduce the
likelihood of blacklisting). Evaluation of the proposed optimizations shows large reductions in
fetch volume compared to a fixed interval re-evaluation algorithm that is not grouping URLs
into MDNs.
63
Chapter 6
Discussion
In previous chapters I proposed and evaluated several optimizations to the re-evaluation
logic for two distinct AIR scenarios: zero-provenance malware repositories, and landing pages
that lead to Fake AV distribution networks. The key difference between these two scenarios is
the missing provenance data; in the first scenario, a malware repository is investigated without
knowledge of the larger MDN in which it participates. In this chapter I present the key findings
from my investigation, the applications of these findings to the design of AIR systems, and the
limitations of this study and the proposed optimizations.
6.1 Zero Provenance Malware Repositories
My ability to fully understand these repositories is limited by a fundamental property of the
data set: the repositories do not have any provenance information; that is, I do not know the
full malware delivery tree that leads to the repository. This limitation is not unique to my
experiments; the majority of suspicious URL feeds available to researchers do not contain this
essential context information. With this in mind, I explore the noteworthy properties of this
data set and then draw conclusions from the evaluation that was performed.
6.1.1 Composition of Data Set
Analysis of the data collected showed that single sample repositories accounted for 50% of the
total data set and 90% of the repositories that yielded at least one executable during study. This
was an unexpected result that requires further consideration. There are several explanations I
present to explain the high percentage of single sample repositories.
The first is that I am evaluating repositories that were part of an MDN before the period of
64
6.1. Zero Provenance Malware Repositories
my study, and these repositories have been abandoned by the MDN. It is possible that malware
repositories in this data set are no longer being linked to by active malware delivery trees. The
MDN that the repository once participated in has shifted to new repositories that are not part
of my data set, and the repository that I am studying is left active serving the same binary, even
though the repository is not being used in active attacks. A troubling thought: in this scenario
all of the traffic to an abandoned repository will be generated by AIR systems, providing the
malware distributor a form of honeypot! A full 18% of the URLs in the dataset were inactive
on the first and all subsequent requests. This large number is consistent with the assertion
that many repositories in my data set were part of MDNs that actively shift repositories; the
repositories studied were already abandoned when the URL enters the system.
Another possibility is that this data is representative of the overall update behaviour of
malware distributors. This would suggest that 90% of the malware being distributed on the
Internet does not use frequently updating distribution networks. This supports the assertion of
several analysts at SophosLabs: a lot of malware distributors are lazy and unsophisticated.24
There is much research done on the new and interesting threats that uncovers unprecedented
levels of sophistication emerging in the underground malware community [SGAK+11, CGKP11,
ZSSL11]. None of this research refutes the possibility that a lot of malware is distributed by
very basic mechanisms.
The high rate of single sample malware repositories in my data set suggests limited value
in repository re-evaluation; 75% of the malware collected in the study was collected on the
first visit to a repository. However; it is clear (see Table A.2) that some types of malware
consistently favor repositories that engage in sample updating, such as Fake AV (25% in the
low interaction repository data set, and 100% in the Fake AV data set) and banking trojans
(42% in the low interaction repository data set). This motivates two assertions made in this
discussion: 1) there is a need for re-evaluation of some zero provenance malware repositories,
and 2) optimizations should be used to reduce the number of re-evaluations per repository.
Figure 5.1 shows that the majority of state transitions take place within the first day of
studying a given repository. This property of the data set allows the relatively high gains
offered by the state based cutoff optimizations. Several of these distributions have long tails: 4
24Malware distributors: please do not take offense. Many analysts at Sophos are also lazy and unsophisticated.
65
6.1. Zero Provenance Malware Repositories
of the six transitions have 90% CDF point that is more than double the 80% CDF point (see
Table 5.2). Care must be taken to choose thresholds that are consistent with the preferences
(fetch savings versus sample discovery) of the maintainers of the AIR system.
6.1.2 Performance of Optimizations
Of all the optimization types simulated, those that reduced the number of re-evaluations to sin-
gle sample repositories offered the most savings (i.e., cp(s), ct(s), and bk(s)). This is consistent
with, and likely caused by, the large percentage of single sample repositories in the data set.
The conditional probability optimization produced the least impressive results: in all cases the
normalized sample loss rate was higher than the normalized fetch reduction. Even with high
confidence and probability thresholds (i.e., 20 and 0.9 respectively) the conditional probability
optimization resulted in a sample loss of 26%. While the fetch reduction appears to quickly
taper out as these thresholds are made more conservative,25 the sample loss remains relatively
high. I suspect this is due to a few high volume detections that cover a large range of samples
that have nothing in common. This artificially inflates the confidence on these detections, even
though they have no ability to predict the malware family. The limitations of my malware
family grouping technique are discussed shortly; in short my inability to properly group mali-
cious samples into families was the most likely cause of the poor performance of the conditional
probability optimizations.
The state based cutoff and re-evaluation backoff optimizations both showed very promising
results. With an unrealistically high re-evaluation interval of 1 hour the cutoff optimizations
produced a normalized fetch reduction of 83% with only a 1% drop in sample discovery, while
the backoff thresholds provided a 72% fetch reduction with a corresponding 6% drop in sample
discovery. When the re-evaluation interval is raised to 1 day, the numbers are still high with
cutoff optimizations yielding a 79% fetch reduction and the backoff optimizations providing a
21% fetch reduction. The drop in savings from the backoff optimizations as the re-evaluation
interval increases is likely due to the ratio between the back offs and interval: for an interval
of 1 hour the ratio is 1:1 whereas at 1 day the ratio is 1:24. I did not simulate with a one day
25On my use of conservative and aggressive in this discussion: conservative choices favor sample discovery,whereas aggressive choices favour greater reductions in the number of re-evaluations.
66
6.1. Zero Provenance Malware Repositories
interval and backoff values of more than 1 hour. A final note on these optimizations is that
they appear to be complementary. When both optimization sets are combined in a simulation
with a re-evaluation interval of 1 hour, the fetch reduction increases to 93% with a sample loss
of 7%. This leads to the third assertion: 3) The combined use of state based cutoff and backoff
thresholds is an effective mechanism to reduce fetch volume while maintaining a high sample
discovery rate.
Varying the α value, which balances sample discovery rate and fetch reduction in the suc-
cess function, causes different sets of optimizations to provide the best results. In my opinion
the α value of 8.2, which was an average derived from a survey, was too low for most environ-
ments. Inspecting Figure 5.4 shows that an α of 8.2 consistently favours evaluations that use
all optimizations. Applying the conditional probability optimization on top of the cutoff and
backoff optimizations produces an incremental fetch reduction of only 1-5% (depending on the
re-evaluation interval) with a corresponding sample discovery cost of 31-22%. The combined
cutoff and backoff optimization provides a much better tradeoff, this optimization combination
is favored when α is set to between 100-1000, depending on the re-evaluation interval.
I observed two relationships between the initial re-evaluation interval and the optimizations.
First, the overall impact of the optimizations, both in terms of fetch reduction and sample dis-
covery cost, decreases as the initial re-evaluation increases. This observation is intuitive: as the
interval increases there are less fetches to reduce and less samples to miss. Second, as the initial
re-evaluation interval increases, the α values at which more conservative optimizations begin
producing higher normalized success scores decreases. The final assertion from this section: 4)
As the re-evaluation interval for a system increases, more conservative optimizations should be
used.
The biggest lesson to take away from analysis of the zero provenance malware repositories
study is that maintainers of AIR systems should aggressively constrain the amount of resources
spent on zero provenance malware repositories. A full 75% of the samples can be discovered
on the initial visit to the repository. Focusing on the full malware delivery tree, as shown by
the Fake AV MDNs studied in this research, is preferable wherever possible. The optimizations
studied in this research, particularly the state based cutoff and backoff optimizations, provide
the means to quickly filter out repositories that provide no subsequent value on re-evaluation.
67
6.1. Zero Provenance Malware Repositories
6.1.3 Limitations
The URLs studied were sourced exclusively from SophosLabs, who were in turn collecting this
data from multiple locations, as discussed in Section 2.3.2. It is possible this feed of data is not
representative of the overall behaviour of zero provenance malware repositories. Further, this
study took steps to filter out landing pages and other suspicious URLs from the data set; these
steps may have biased the selection of malware repositories.
The zero provenance malware repositories in this study were primarily sourced from co-
operative URL exchanges between Sophos and many AV firms and security researchers. The
URLs from these feeds are arriving at varying frequency (1-24 hours) and the initial delay before
sharing varies with each feed. As a result, the distribution of state transition timing will likely
vary between implementations.
The approach to group malware samples into families was ineffective. Due to this limitation
I was unable to draw conclusions on the effectiveness of using the malware family as a predictor
of repository update behaviour. The detection names assigned by vendors are a poor indicator
of the malware family. Proper identification of malware families is a difficult problem,26 and
not a direct focus of this research.
In order to better group the malware executables, I would generate feature sets for each
malicious executable from static analysis, emulation, and behavioural analysis, in particular the
file download tree [CGKP11] (i.e., a dependence graph representing which samples install other
samples after execution). I suspect the download tree and network behaviour will be helpful for
grouping samples downloaded from the web because these samples are typically ‘droppers’ (i.e.,
their role is to avoid and/or disable AV detection, then install the ‘payload’) and one of their
primary goals is to download subsequent malware from the pay per install infrastructure. While
many droppers appear similar in terms of features, they will differ in the networks that they
contact, and the malware that they install after execution. One potentially predictive factor
of the MDN that is found in the dropper is the affiliate identifier, which should be common27
26David Cornell, Software Development Manager at SophosLabs Vancouver, on the difficulty of groupingmalware: “It’s like trying to group criminals into thieves, murderers, etc by how they are dressed”.
27Common, but not unique: Caballero et al. [CGKP11] show evidence that affiliates sometimes distributedroppers for multiple PPI services, and in some case use custom droppers to install malware from multiple PPIservices simultaneously.
68
6.2. Fake AV Malware Distribution Networks
among all droppers downloaded from a specific network.
6.2 Fake AV Malware Distribution Networks
Our analysis of known Fake AV landing pages revealed several distinct MDNs. All of the MDNs
exhibited strong fan-in characteristics from landing pages to single repositories. This property
can be exploited to drastically reduce the amount of re-evaluations needed to track each MDN
over time.
6.2.1 Benefits of Identifying MDNs
There are several benefits to tracking the relationship between malware samples and the origi-
nating MDN, as well as tracking the update behaviours of the MDN.
Tracking the binary updating behaviour of each MDN in conjunction with current detection
rate of downloaded executables can improve the detection triage process. When detection drops
on samples from a purely polymorphic MDN, this requires immediate analyst attention. Any
automated checksumming strategy will be ineffective as the samples are unique on every request.
When detection dips on an MDN whose samples are longer lived, then an automated checksum
approach is sufficient to reduce the urgency of the incident while analysts address the drop in
detection rate by updating detections.
Grouping executable samples by MDN helps vendors identify patterns to improve detections.
For MDN1, 100% of the binaries are detected by a single Sophos detection. However, the
samples from the other MDNs were detected by no less than six distinct Sophos detections.
After providing the grouped samples to analysts, they were able to quickly produce single
detections for each MDN.
The landing pages of MDNs that exhibit strong fan in can be grouped and re-evaluated using
the proposed optimizations. This reduces the resources required to monitor each MDN, and
reduce the chance of being blacklisted.
Blacklisting is a real threat and is being actively applied by the administrators of MDNs.
This is an important phenomenon to consider when designing a system to monitor MDNs. In
the same way that security vendors monitor threats and blacklist large IP ranges, so too can
69
6.3. Design Considerations
malware distributors. Repeated visits to MDNs from IP addresses in the same range are easy to
spot in server logs. During the data collection phase of this research, I observed the blacklisting
response occur in under a week. It is important for security vendors to use large pools of IP
addresses spread across disparate networks.
6.2.2 Limitations
In order to realize any of the benefits discussed above, MDNs must be constantly identified
via human or automated means. Of the six MDNs that were identified, two were already gone
from our incoming feed at the time of identification. One changed bulk subdomain providers
during the middle of the experiment, from using findhere.org to using rr.nu. An additional
two disappeared towards the end of our data collection. Only one MDN exhibited a predictable
pattern for more than a month. If a human approach is taken, adequate data visualization
must be provided to analysts if they are to sift through fetch logs looking for patterns. Towards
automated identification, promising research [ZSSL11] has been recently presented toward this
direction and future research is necessary in this area.
The optimizations presented rely on the strong fan-in assumption: all of the landing pages
in the MDN at any given time redirect to a single repository. All of my data supported this
assumption; however, there is nothing to prevent an MDN from using a compartmentalized
strategy, where multiple repositories are active at once and the landing pages are split between
the active repositories at any given time. The application of the proposed optimizations to a
compartmentalized MDN would produce a drop in repository and sample discovery rates. A
simple adjustment to the optimized approach would address the issue: instead of fetching only
one landing page, perform a sampling of landing pages. If the sampled landing pages all redirect
to a single repository, discontinue evaluation. If they do not, continue sampling landing pages
until no new repositories are discovered.
6.3 Design Considerations
The state based cutoff and backoff optimizations require state to be maintained for each URL
in the system. The TDG maintains a summary object for each URL studied. This proved to
70
6.4. Monitoring Polymorphic Repositories
be very helpful, not only for maintaining state, but also for purposes of maintaining summaries
that represent data from multiple fetches, for the purposes of data visualization. However; the
TDG was not built with scalability in mind. Maintaining state per URL may lead to system
bottlenecks that prevent the number of concurrent clients from properly scaling horizontally.
Investigating these issues is left as future work.
The MDN fan-in based optimizations require a system abstraction greater than the URL
summary: the MDN abstraction. This abstraction exists as an object that URLs are added to
when they are discovered to be part of the group. Once in the group, a single re-evaluation
algorithm controls evaluations of all of the URLs in the set.
6.4 Monitoring Polymorphic Repositories
At several points throughout the previous chapters I note that dealing with polymorphic mal-
ware repositories is a difficult problem and then defer to the discussion. Here are my thoughts
on how to deal with polymorphic repositories. Note that this is not a focus of this research and
none of these strategies have been evaluated.
Resist the urge to collect polymorphic sample unnecessarily. Every request to a polymorphic
server results in a new sample. It seems useful to collect as many samples as possible from a
research and protection standpoint, however the probability that the exact samples downloaded
will be used to infect a victim PC is negligible, therefore each sample is only valuable as
a contribution to a corpus of similar malware, and by extension valuable as a contribution to
improvements in understanding the malware and protecting against infection. There are several
costs associated with downloading the sample, in addition to the AIR system cost. Every
executable that enters a security lab is stored, processed by automated systems, potentially
shared to other labs and repeatedly scanned in the future to test for detection regression. If the
sample is not detected on entry or after automated analysis, it adds to the queues of undetected
samples that must be triaged for manual analysis.
An iterative approach to sample collection from polymorphic servers that allows for analyst
or automated systems to act between batches of sample collection is necessary. Once a poly-
morphic family has been identified, the honey client will gather a batch of specified size from
71
6.4. Monitoring Polymorphic Repositories
the site and then suspend further fetching. Anti-virus scans are run across the set of samples
to determine the current detection rate. If the detection rate is below a specified threshold,
anti-virus detections are updated, by analysts, to bring detection for this batch of samples above
the threshold. Another batch of samples is downloaded, and the process is repeated, until the
detection rate of new batches rises above the threshold.
72
Chapter 7
Conclusion
This research studies two AIRs scenarios commonly faced by security researchers: collecting
data from zero provenance malware repositories, and collecting data from Fake AV MDNs.
Through analysis of the behaviour of malicious networks, I propose and evaluate optimizations
to the re-evaluation algorithm of AIR systems. I show through simulation that in the zero
provenance malware repositories scenario, a combination of state based cutoff and state based
backoff optimizations is able to reduce fetch volume by 80-93% (depending on the re-evaluation
interval), with a corresponding drop in sample discovery rate of only 2-7%. In the Fake AV MDN
scenario, I show through simulation that incorporating knowledge of the underlying MDN into
the re-evaluation algorithm produces drastic (i.e., >90%) reductions in fetch volume compared
to an approach that does not take advantage of this knowledge.
7.1 Future Work
There are several avenues for future research on re-evaluation strategies and blacklisting mit-
igation. I provided improvements by grouping landing pages and applying a scheduler to
the group. There have been more sophisticated means of grouping recently demonstrated
[ZSSL11, CGKP11]. Exploring the implications of this new research on system design in general
and re-evaluation algorithms specifically offers an interesting angle for future research.
Toward zero provenance data feeds, I am interested in what can be gained from the URLs
serving web content. A percentage of these will lead to landing pages of unknown distribution
networks. There are several challenges to processing heterogeneous sets of suspicious URLs;
the distribution networks encountered require various degrees of simulated human interaction
and patch levels to trigger a malicious download. Acquiring and maintaining old versions of
vulnerable software (i.e., OS, browser, and plugins) is a time consuming task, and there are a
73
7.1. Future Work
growing number of unique human interaction tasks that some attacks require. In my research I
used a basic sikuli [Pro11] script to ‘say yes’ to Fake AV pop-ups. Developing and maintaining
simulated human computer interaction (HCI) is highly adversarial. Any techniques to bypass
this adversarial game represent a valuable contribution to the field.
I observed that the technique of blacklisting is a real threat and is actively applied by
the administrators of MDNs. There are several avenues to address the blacklisting problem.
Any organization that deploys security software (or hardware) at user locations can attempt,
with consent, to use user IP addresses as proxies. This would provide security researchers
access to pools of IP address space for the purpose of malware sample collection. In this
scenario adversarial blacklisting is turned on its head: when a user IP address is blacklisted it
is essentially protected. Of course there are legal ramifications to be analyzed, as well as the
risk of customers being targeted by MDNs in a retaliatory manner.
Another approach to the problem of blacklisting is increased collaboration among security
vendors to share resources and eliminate duplicated data collection effort. URL and sample
sharing among security vendors is already common practice; however, these arrangements do
nothing to actually pool resources and reduce the overall number of exposures to the MDNs.
It is unclear that such collaboration will naturally emerge, especially since some vendors might
view their ability to crawl from a large pool if IPs as their competitive advantage.
A final avenue worth pursuing is increased cooperation with organizations that have Internet
level views, such as ISPs or large research organizations. It has been shown that some MDNs
pre-compute their repositories in advance. However, in other cases landing pages are periodically
updated, via a pull or push mechanism, with the new repository. If these flows could be identified
through passive network analysis, this would provide yet another means to reduce exposure to
the MDN.
74
Bibliography
[Ass99] European Computer Manufacturers Association. ECMAScript Lanuage Specifica-tion 3rd Edition, dec 1999.
[AV 11] Av tracker. http://avtracker.info/, February 2011.
[BLMM94] T. Berners-Lee, L. Masinter, and M. McCahill. RFC1738: Uniform resource loca-tors (URL). 1994.
[Blo11] Blockscript. http://blockscript.com/, September 2011.
[CCVK11] Davide Canali, Marco Cova, Giovanni Vigna, and Christopher Kruegel. Prophiler:A fast filter for the large-scale detection of malicious web pages. In Proceedingsof the 20th Annual World Wide Web Conference (WWW), pages 197–206, Hyder-abad, India, March 28 - April 1 2011.
[CER01a] CERT Advisory CA-2001-19 Code Red: Worm Exploiting Buffer Overflow In IISIndexing Service DLL. http://www.cert.org/advisories/ CA-2001-19.html., 2001.
[CER01b] CERT Advisory CA-2001-26 Nimda Worm. http://www.cert.org/advisories/CA-2001-26.html., 2001.
[CER03a] CERT Advisory CA-2003-04 MS-SQL Server Worm.http://www.cert.org/advisories/CA-2003-04.html., 2003.
[CER03b] CERT Advisory CA-2003-20 W32/Blaster Worm.http://www.cert.org/advisories/CA-2003-20.html., 2003.
[CGKP11] Juan Caballero, Chris Grier, Christian Kreibich, and Vern Paxson. Measuringpay-per-install: The commoditization of malware distribution. In Proceedings ofthe 20th USENIX Security Symposium, pages 187–202, San Francisco, CA, USA,August 8 - 12 2011. USENIX Association.
[CKV10] Marco Cova, Christopher Kruegel, and Giovanni Vigna. Detection and analysisof drive-by-download attacks and malicious javascript code. In Proceedings of the19th Annual World Wide Web Conference (WWW), pages 281–290. ACM, April26 - 30 2010.
[Cut11] Matt Cutts. Google search and search engine spam.http://googleblog.blogspot.com/2011/01/google-search-and-search-engine-spam.html, January 2011.
[Dru11] Drupal. http://drupal.org/, September 2011.
[Dun11] Ken Dunham, February 2011. Private Communication.
75
Chapter 7. Bibliography
[Fan11] Fantomas spiderspy. http://searchbotbase.com/, September 2011.
[FGM+99] R. Fielding, J. Gettys, J. Mogul, H. Frystyk, L. Masinter, P. Leach,and T. Berners-Lee. Rfc 2616, hypertext transfer protocol – http/1.1.http://www.rfc.net/rfc2616.html, 1999.
[FPPS07] Jason Franklin, Adrian Perrig, Vern Paxson, and Stefan Savage. An inquiry intothe nature and causes of the wealth of Internet miscreants. In Proceedings of the2007 ACM Conference on Computer and Communications Security, pages 375–388, October 28-31 2007.
[Gen11] Gentoo linux. http://www.gentoo.org/, September 2011.
[GNU11] Gnu wget. http://www.gnu.org/software/wget/, September 2011.
[Goo11] http://www.google.com/intl/gn/help/operators.html, June 2011.
[Her11] Heretrix. http://crawler.archive.org/, September 2011.
[HK10] Fraser Howard and Onur Komili. Poisoned search results: How hackers have au-tomated search engine poisoning attacks to distribute malware. Sophos TechnicalPapers, March 2010.
[How10] Fraser Howard. Malware with your mocha? obfuscation and anti-emulation tricksin malicious javascript. Sophos Technical Papers, September 2010.
[jsu11] jsunpack-n: a generic javascript unpacker. https://code.google.com/p/jsunpack-n/, September 2011.
[JYX+11] John John, Fang Yu, Yinglian Xie, Arvind Krishnamurthy, and Martin Abadi.Heat-seeking honeypots: design and experience. In Proceedings of the 20th AnnualWorld Wide Web Conference (WWW), pages 207–216, Hyderabad, India, March28 - April 1 2011.
[KR07] James F. Kurose and Keith W. Ross. Computer Networking: A Top-Down Ap-proach (4th Edition). Addison Wesley, 4 edition, 2007.
[KZRB11] Onur Komili, Kyle Zeeuwen, Matei Ripeanu, and Konstantin Beznosov. Strategiesfor Monitoring Fake AV Distribution Networks. In Virus Bulletin 2011. VirusBulletin, October 5 -7 2011.
[Lin11] Linode. http://linode.com/, September 2011.
[MBGL06] Alexander Moshchuk, Tanya Bragin, Steven D. Gribble, and Henry M. Levy. Acrawler-based study of spyware in the web. In Proceedings of the Network andDistributed System Security Symposium (NDSS), pages 17–33, 2006.
[Mes11] Apache QPID: Open Source AMQP Messaging. Apache qpid: Open source AMQPmessaging. http://qpid.apache.org/, September 2011.
[MIT11] MITRE. CWE-89: Improper Neutralization of Special Elements used in an SQLCommand. http://cwe.mitre.org/data/definitions/89.html, 2011.
[MYS11] Mysql. http://www.mysql.com/, September 2011.
76
Chapter 7. Bibliography
[Net11] Netcraft june 2011 web server survey. http://news.netcraft.com/archives/category/web-server-survey/, June 2011.
[Nod11] Node.js. http://nodejs.org/, September 2011.
[NWC+07] Yuan Niu, Yi-Ming Wang, Hao Chen, Ming Ma, and Francis Hsu. A quantitativestudy of forum spamming using context-based analysis. In Proceedings of the 14thAnnual Network and Distributed System Security Symposium (NDSS), pages 79–92, San Diego, CA, February 28 - March 2, 2007.
[PH08] Niels Provos and Thorsten Holz. Virtual Honeypots - From Botnet Tracking toIntrusion Detection. Addison-Wesley, 2008.
[PMM+07] Niels Provos, Dean McNamee, Panayiotis Mavrommatis, Ke Wang, and NagendraModadugu. The ghost in the browser analysis of web-based malware. In Proceedingsof the first conference on First Workshop on Hot Topics in Understanding Botnets,Berkeley, CA, USA, 2007. USENIX Association.
[PMRM08] Niels Provos, Panayiotis Mavrommatis, Moheeb Abu Rajab, and Fabian Monrose.All your iFRAMEs point to us. In USENIX Security Symposium, pages 1–16.USENIX Association, 2008.
[Pro11] Project sikuli. http://sikuli.org/, September 2011.
[Puz11] Alen Puzic. Blackhole exploit kit. DV Labs Blog, April 2011.
[Rad09] Deb Radcliff. The cybercriminal underground: Commercial sophistication. SCMagazine, April 2009.
[RBM+10] Moheeb Abu Rajab, Lucas Ballard, Panayiotis Marvrommatis, Niels Provos, andXin Zhao. The Nocebo effect on the web: An analysis of fake anti-virus dis-tribution. In Proceedings of the 3rd USENIX conference on Large-scale exploitsand emergent threats: botnets, spyware, worms, and more, LEET’10, pages 17–25.USENIX Association, April 28-30 2010.
[Sam09] Dmitry Samossseiko. The partnerka - what is it, and why should you care? InVirus Bulletin. Virus Bulletin, September 23-25 2009.
[SAN09] Sans top cyber security risks. http://www.sans.org/top-cyber-security-risks,September 2009.
[SASC10] Jack W. Stokes, Reid Andersen, Christian Seifert, and Kumar Chellapilla. Webcop:locating neighborhoods of malware on the web. In Proceedings of the 3rd USENIXconference on Large-scale exploits and emergent threats: botnets, spyware, worms,and more, LEET’10, pages 34–41, San Jose, CA, USA, April 28-30 2010. USENIXAssociation.
[SGAK+11] B. Stone-Gross, R. Abman, R. Kemmerer, C. Kruegel, D. Steigerwald, and G. Vi-gna. The Underground Economy of Fake Antivirus Software. In Proceedings of theWorkshop on Economics of Information Security (WEIS), George Mason Univer-sity, USA, June 14 - 15 2011.
77
Chapter 7. Bibliography
[She08] Ryan Sherstobitoff. Server-side polymorphism: Crime-ware as a service model(CaaS). Information Systems Security Association Journal, 6(5), 2008.
[Sob11] Julien Sobrier. Fake AV vs. zscalar. http://research.zscaler.com/2011/04/fake-av-vs-zscaler.html, April 2011.
[Sop11] Sophoslabs. http://sophos.com/, 2011.
[Tac11] Tachyon detection grid. http://memoryalpha.org/en/wiki/Tachyon detection grid,September 2011.
[Tar11] Tarpit. http://en.wikipedia.org/wiki/Tarpit (networking), April 2011.
[TCP11] Tcpdump and libpcap. http://www.tcpdump.org/, September 2011.
[The11] The perl programing language. http://www.perl.org/, September 2011.
[Vil11] Nart Villeneuve. Now exploiting: Phoenix exploit kit version 2.5.http://blog.trendmicro.com/now-exploiting-phoenix-exploit-kit-version-2-5/,February 2011.
[Vir11] Virtual box. http://www.virtualbox.org/, September 2011.
[WBJ+06] Yi-Min Wang, Doug Beck, Xuxian Jiang, Roussi Roussev, Chad Verbowski, ShuoChen, and Samuel T. King. Automated web patrol with strider honeymonkeys:Finding web sites that exploit browser vulnerabilities. In Proceedings of the Net-work and Distributed System Security Symposium (NDSS), pages 35–49, 2006.
[WD05] Baoning Wu and Brian D. Davison. Cloaking and redirection: A preliminary study.In In Proceesdings of the First International Workshop on Adversarial InformationRetrieval on the Web (AIRWeb), Chiba, Japan, May 10 2005.
[WD06] Baoning Wu and Brian D. Davison. Detecting semantic cloaking on the web.In Proceedings of the 15th Annual World Wide Web Conference (WWW), pages819–828, Edinburough, Scotland, May 23 - 26 2006.
[Web11] Webmasters cloaking forum. http://www.webmasterworld.com/forum24/,September 2011.
[Woo11] Mike Wood. Turning scareware devious distribution tactics into practicalprotection mechanisms. http://nakedsecurity.sophos.com/2011/02/14/scareware-distribution-tactics-practical-protection-mechanisms/, February 2011.
[Wor11] Wordpress. http://wordpress.org/, September 2011.
[XYA+08] Yinglian Xie, Fang Yu, Kannan Achan, Rina Panigrahy, Geoff Hulten, and IvanOsipkov. Spamming botnets: signatures and characteristics. In Proceedings of theACM SIGCOMM 2008 conference on Data communication, pages 171–182, 2008.
[ZRB11] Kyle Zeeuwen, Matei Ripeanu, and Konstantin Beznosov. Improving MaliciousURL Re-Evaluation Scheduling Through an Empirical Study of Malware DownloadCenters. In WebQuality 2011. ACM, April 28 2011.
78
Chapter 7. Bibliography
[ZSSL11] Junjie Zhang, Christian Seifert, Jack W. Stokes, and Wenke Lee. ARROW: Gen-erating signatures to detect drive-by downloads. In Proceedings of the 20th AnnualWorld Wide Web Conference (WWW), pages 187–196, Hyderabad, India, March28 - April 1 2011.
79
Appendix A
Appendix
A.1 Tachyon Detection Grid Architecture
To study the behaviour of malware distribution networks over time, I built a framework that
supported multiple distributed honey clients and pluggable scheduling and data analysis com-
ponents. I named the framework TDG, which is a geeky Star Trek reference28. The TDG
system consists of a single central server and multiple clients that execute instructions from the
server. The system was implemented in Perl 5.8 [The11] running on Gentoo Linux [Gen11].
All major components were implemented as objects. The central server consists of persistent
perl processes that communicate with each other using an Apache QPID [Mes11] message bro-
ker. Persistent data storage is realized using MySQL [MYS11] for relational data storage and
a REST based key/value store implemented using Node.js [Nod11]. The architecture diagram
from Section 4.1 is reproduced in Figure A.1 for easier reference. Section A.1.1 lists the con-
ceptual components of the system and presents their responsibilities. Section A.1.2 describes
the system events and how these events propagate through the components of the system.
A.1.1 System Components
Experiments
The experiment object is a high level abstraction that specifies system behaviour over a period
of time. An example experiment definition is show in Figure A.2. An experiment defines a set
of URLs to study, specifies the period over which to study these URLs, and defines one or more
downloaders to repeatedly retrieve the URLs.
28In StarTrek: The Next Generation, the Federation deploys a Tachyon Detection Grid to detect cloakedRomulan vessels [Tac11]. My initial research objective was to study the use of cloaking by malware networks,and so a name was given to a bunch of code.
80
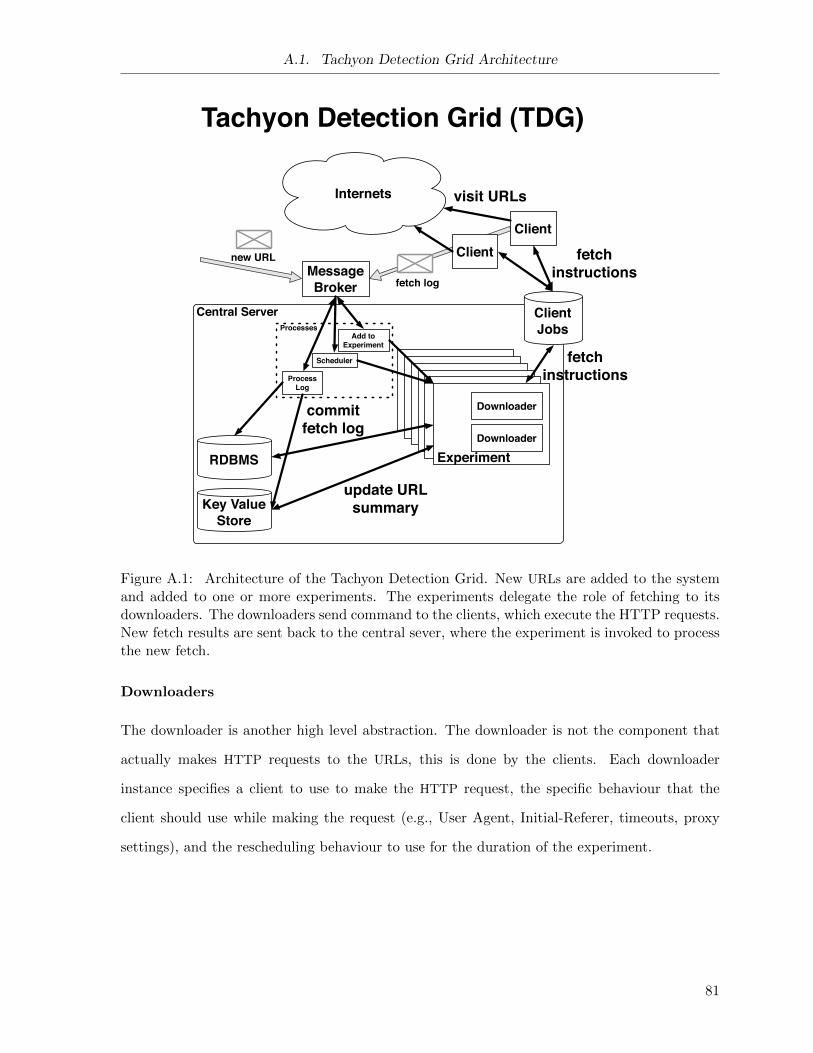
A.1. Tachyon Detection Grid Architecture
Central ServerProcesses
Internets
ClientClient
fetch instructions
Key Value Store
Process Log
RDBMS
Message Broker
Client Jobs
update URL summary
visit URLs
Add to Experiment
Scheduler
ExperimentDownloader
Downloader
fetch instructions
fetch log
new URL
commit fetch log
Tachyon Detection Grid (TDG)
Figure A.1: Architecture of the Tachyon Detection Grid. New URLs are added to the systemand added to one or more experiments. The experiments delegate the role of fetching to itsdownloaders. The downloaders send command to the clients, which execute the HTTP requests.New fetch results are sent back to the central sever, where the experiment is invoked to processthe new fetch.
Downloaders
The downloader is another high level abstraction. The downloader is not the component that
actually makes HTTP requests to the URLs, this is done by the clients. Each downloader
instance specifies a client to use to make the HTTP request, the specific behaviour that the
client should use while making the request (e.g., User Agent, Initial-Referer, timeouts, proxy
settings), and the rescheduling behaviour to use for the duration of the experiment.
81
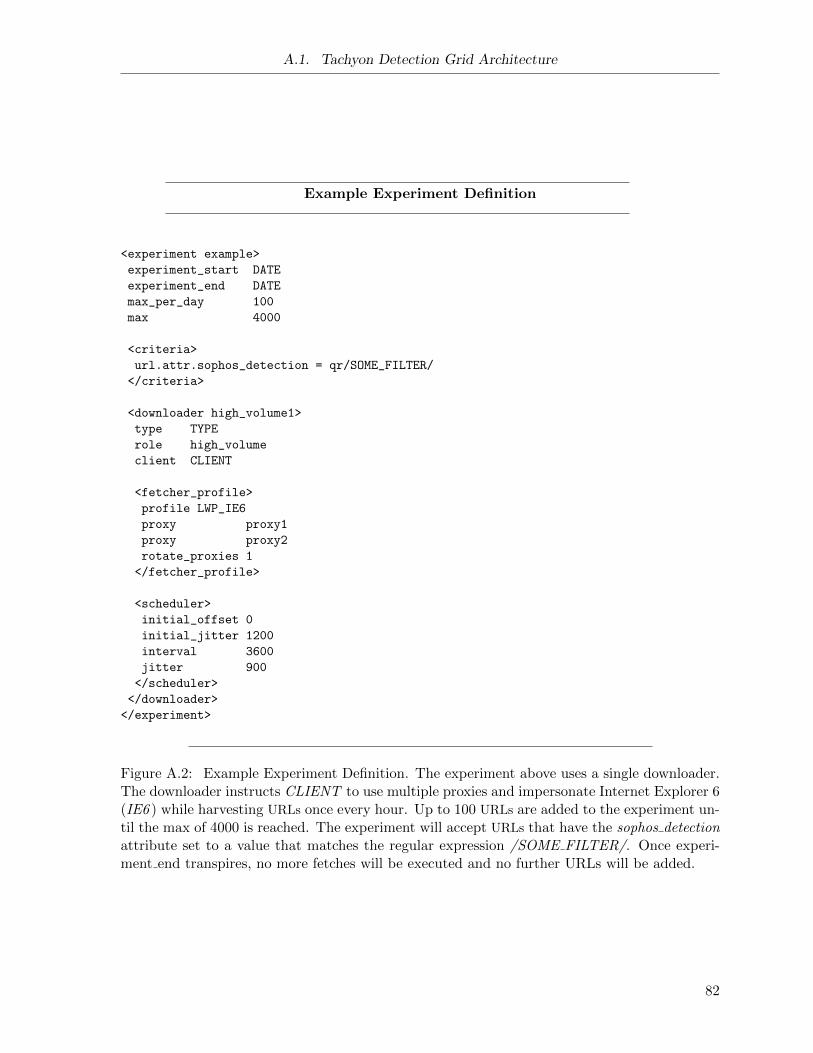
A.1. Tachyon Detection Grid Architecture
Example Experiment Definition
<experiment example>
experiment_start DATE
experiment_end DATE
max_per_day 100
max 4000
<criteria>
url.attr.sophos_detection = qr/SOME_FILTER/
</criteria>
<downloader high_volume1>
type TYPE
role high_volume
client CLIENT
<fetcher_profile>
profile LWP_IE6
proxy proxy1
proxy proxy2
rotate_proxies 1
</fetcher_profile>
<scheduler>
initial_offset 0
initial_jitter 1200
interval 3600
jitter 900
</scheduler>
</downloader>
</experiment>
Figure A.2: Example Experiment Definition. The experiment above uses a single downloader.The downloader instructs CLIENT to use multiple proxies and impersonate Internet Explorer 6(IE6 ) while harvesting URLs once every hour. Up to 100 URLs are added to the experiment un-til the max of 4000 is reached. The experiment will accept URLs that have the sophos detectionattribute set to a value that matches the regular expression /SOME FILTER/. Once experi-ment end transpires, no more fetches will be executed and no further URLs will be added.
82
A.1. Tachyon Detection Grid Architecture
URL State
One URL state object is maintained for each downloader-URL pair. That is, if an experiment
has three downloaders and a URL is added to that experiment, the TDG will maintain three URL
states for the URL. Maintaining separate URL states for each downloader allows us to detect
when one downloader is being blacklisted. Example URL summaries are provided in Figure A.3.
The URL summary contains a historical summary of the fetch results and state transitions over
the course of the experiment. The URL state model is an important component of the system
that facilitates analysis of URLs. These states are used for several proposed optimizations,
which are discussed in Section 3.1.
Fetch Log
Every time a client fetches a URL, a Fetch Log object is created by the client and processed
by the central server. The fetch log contains a list of all the URLs visited during a fetch, all
URL relationships, a snapshot of the DNS information for each URL visited, and a link to the
content retrieved from each URL.
Clients
The clients receive fetch instructions from the central server and perform HTTP get requests to
the server. The TDG is agnostic of the client implementation details. Any client that can: 1)
retrieve commands from a MySQL server and 2) transfer files via SSH push or pull operations,
can be used by the TDG. This flexibility allowed me to quickly add a HIHC late in the results
gathering phase to test new hypotheses. Two honey clients are used to generate the results
presented in this paper:
Low Interaction Honey Client (LIHC)
The LIHC is implemented using a wrapped version of the Perl WWW Library (LWP) package.
Notable feature additions include the ability to interpret and follow HTTP redirects, and modify
HTTP headers such as the User-Agent and Referer. The generation of the fetch log was trivial
given the client is implemented for this project and I control the HTTP client code base - this is
83
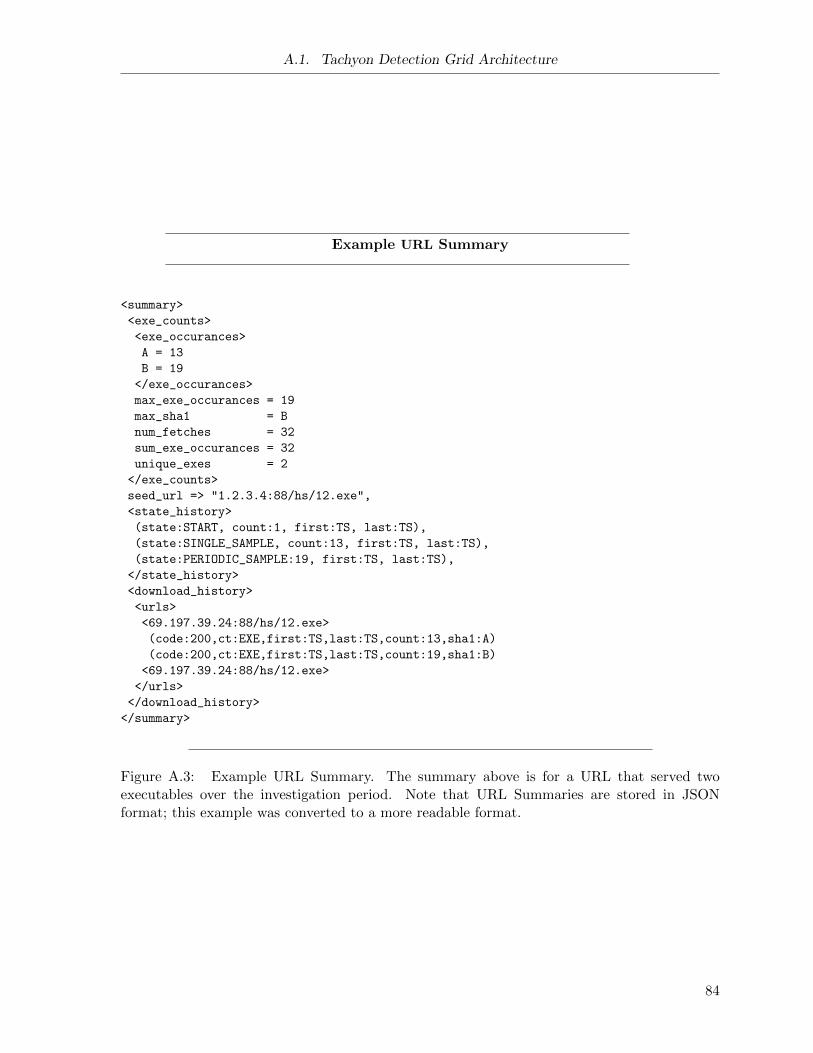
A.1. Tachyon Detection Grid Architecture
Example URL Summary
<summary>
<exe_counts>
<exe_occurances>
A = 13
B = 19
</exe_occurances>
max_exe_occurances = 19
max_sha1 = B
num_fetches = 32
sum_exe_occurances = 32
unique_exes = 2
</exe_counts>
seed_url => "1.2.3.4:88/hs/12.exe",
<state_history>
(state:START, count:1, first:TS, last:TS),
(state:SINGLE_SAMPLE, count:13, first:TS, last:TS),
(state:PERIODIC_SAMPLE:19, first:TS, last:TS),
</state_history>
<download_history>
<urls>
<69.197.39.24:88/hs/12.exe>
(code:200,ct:EXE,first:TS,last:TS,count:13,sha1:A)
(code:200,ct:EXE,first:TS,last:TS,count:19,sha1:B)
<69.197.39.24:88/hs/12.exe>
</urls>
</download_history>
</summary>
Figure A.3: Example URL Summary. The summary above is for a URL that served twoexecutables over the investigation period. Note that URL Summaries are stored in JSONformat; this example was converted to a more readable format.
84
A.1. Tachyon Detection Grid Architecture
not the case for the HIHC.29 This client does not follow HTML or JS redirects, and is therefore
limited to the study of URLs that directly host malicious binary executables. The bulk of the
results presented are generated by this client.
High Interaction Honey Client (HIHC)
The HIHC is implemented using Virtual Box [Vir11] running a Windows XP2 guest image. An
instance of Firefox is controlled using VBoxManage commands and directed to visit URLs. All
redirection and content interpretation is handled by Firefox, thus the resulting fetch log is very
close to the use experience when visiting the URL. Human interaction with the web server is
simulated using Sikuli [Pro11], a software for automating human computer interaction using
images.
Generation of the fetch log is a more complicated task compared to the LIHC because I
cannot easily modify Firefox to generate this data. To generate the fetch log, I use tcpdump
[TCP11] to capture all TCP/IP traffic generated by the Windows guest image, and then process
the resulting packet capture file using a modified version of jsunpack [jsu11].30 The HIHC is
used to harvest known landing pages in Fake AV distribution networks. These landing pages
are initially discovered by processing feedback from Sophos product feedback.
A.1.2 System Events
The components of the central server are organized in a hierarchical structure with the exper-
iment object at the top. Experiments contain one or more downloaders, which contain one
scheduling component and are linked to one client. The main scheduling process starts by
instantiating all experiments, then enters an event processing loop. When an event arrives, via
the QPID messaging broker, the event will either be passed to every experiment or to a specific
experiment, depending on the type of event. Both the experiment and downloader objects have
handlers for each event type. The events propagate down the hierarchical structure from the
experiment down to the downloaders. The different event types are discussed in the following
subsections.
29Firefox is the browser used in the HIHC. Modifying Firefox is a more complex task than modifying a smallPerl code base.
30The modifications to jsunpack were minor; I added routines at the end of the execution to write the URLto URL and URL to file relationships to a file.
85
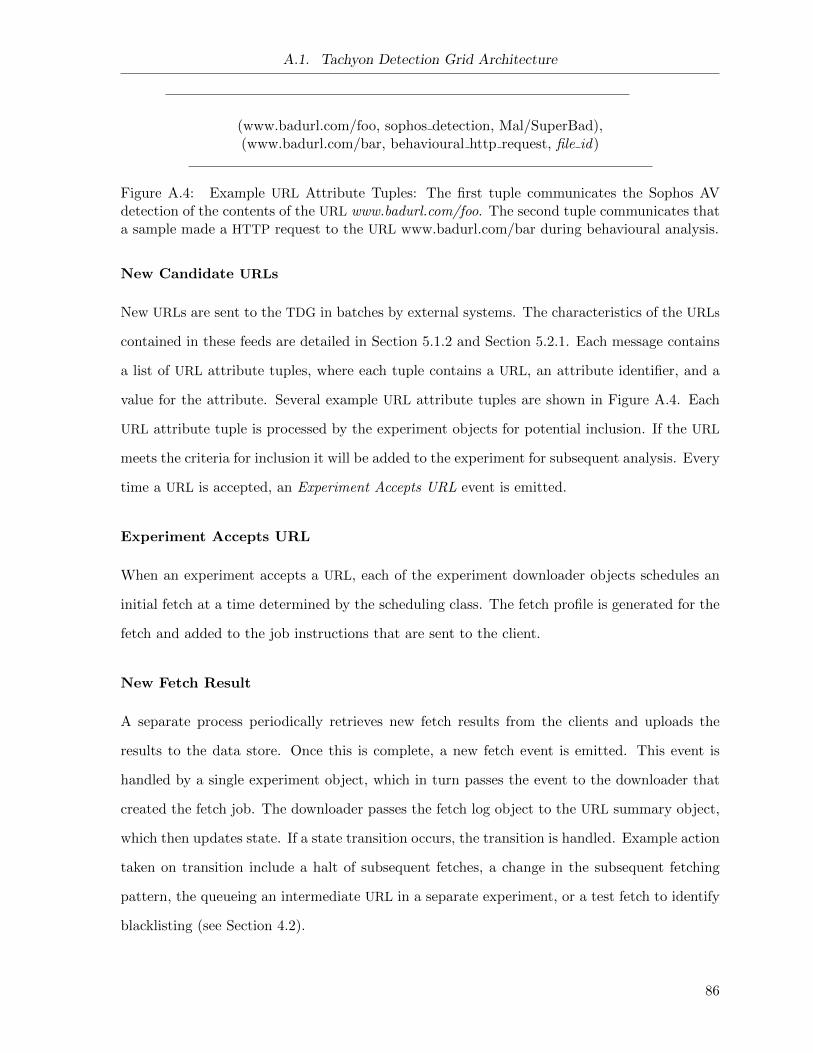
A.1. Tachyon Detection Grid Architecture
(www.badurl.com/foo, sophos detection, Mal/SuperBad),(www.badurl.com/bar, behavioural http request, file id)
Figure A.4: Example URL Attribute Tuples: The first tuple communicates the Sophos AVdetection of the contents of the URL www.badurl.com/foo. The second tuple communicates thata sample made a HTTP request to the URL www.badurl.com/bar during behavioural analysis.
New Candidate URLs
New URLs are sent to the TDG in batches by external systems. The characteristics of the URLs
contained in these feeds are detailed in Section 5.1.2 and Section 5.2.1. Each message contains
a list of URL attribute tuples, where each tuple contains a URL, an attribute identifier, and a
value for the attribute. Several example URL attribute tuples are shown in Figure A.4. Each
URL attribute tuple is processed by the experiment objects for potential inclusion. If the URL
meets the criteria for inclusion it will be added to the experiment for subsequent analysis. Every
time a URL is accepted, an Experiment Accepts URL event is emitted.
Experiment Accepts URL
When an experiment accepts a URL, each of the experiment downloader objects schedules an
initial fetch at a time determined by the scheduling class. The fetch profile is generated for the
fetch and added to the job instructions that are sent to the client.
New Fetch Result
A separate process periodically retrieves new fetch results from the clients and uploads the
results to the data store. Once this is complete, a new fetch event is emitted. This event is
handled by a single experiment object, which in turn passes the event to the downloader that
created the fetch job. The downloader passes the fetch log object to the URL summary object,
which then updates state. If a state transition occurs, the transition is handled. Example action
taken on transition include a halt of subsequent fetches, a change in the subsequent fetching
pattern, the queueing an intermediate URL in a separate experiment, or a test fetch to identify
blacklisting (see Section 4.2).
86
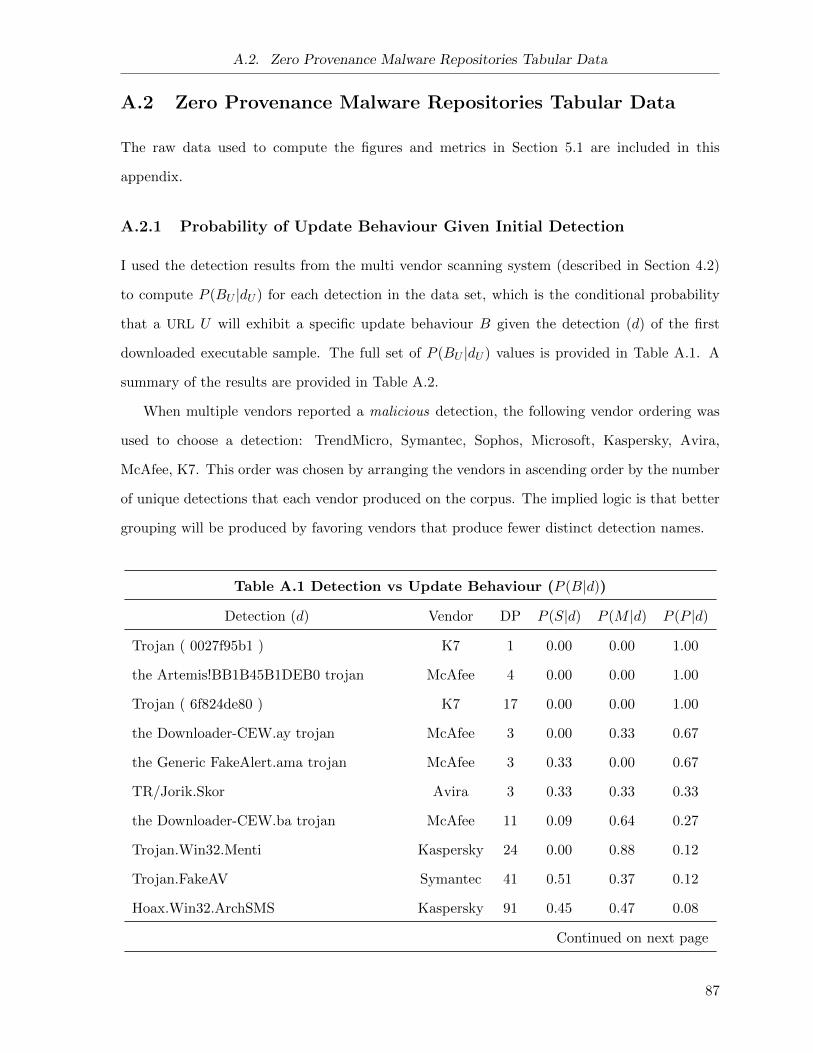
A.2. Zero Provenance Malware Repositories Tabular Data
A.2 Zero Provenance Malware Repositories Tabular Data
The raw data used to compute the figures and metrics in Section 5.1 are included in this
appendix.
A.2.1 Probability of Update Behaviour Given Initial Detection
I used the detection results from the multi vendor scanning system (described in Section 4.2)
to compute P (BU |dU ) for each detection in the data set, which is the conditional probability
that a URL U will exhibit a specific update behaviour B given the detection (d) of the first
downloaded executable sample. The full set of P (BU |dU ) values is provided in Table A.1. A
summary of the results are provided in Table A.2.
When multiple vendors reported a malicious detection, the following vendor ordering was
used to choose a detection: TrendMicro, Symantec, Sophos, Microsoft, Kaspersky, Avira,
McAfee, K7. This order was chosen by arranging the vendors in ascending order by the number
of unique detections that each vendor produced on the corpus. The implied logic is that better
grouping will be produced by favoring vendors that produce fewer distinct detection names.
Table A.1 Detection vs Update Behaviour (P (B|d))
Detection (d) Vendor DP P (S|d) P (M |d) P (P |d)
Trojan ( 0027f95b1 ) K7 1 0.00 0.00 1.00
the Artemis!BB1B45B1DEB0 trojan McAfee 4 0.00 0.00 1.00
Trojan ( 6f824de80 ) K7 17 0.00 0.00 1.00
the Downloader-CEW.ay trojan McAfee 3 0.00 0.33 0.67
the Generic FakeAlert.ama trojan McAfee 3 0.33 0.00 0.67
TR/Jorik.Skor Avira 3 0.33 0.33 0.33
the Downloader-CEW.ba trojan McAfee 11 0.09 0.64 0.27
Trojan.Win32.Menti Kaspersky 24 0.00 0.88 0.12
Trojan.FakeAV Symantec 41 0.51 0.37 0.12
Hoax.Win32.ArchSMS Kaspersky 91 0.45 0.47 0.08
Continued on next page
87
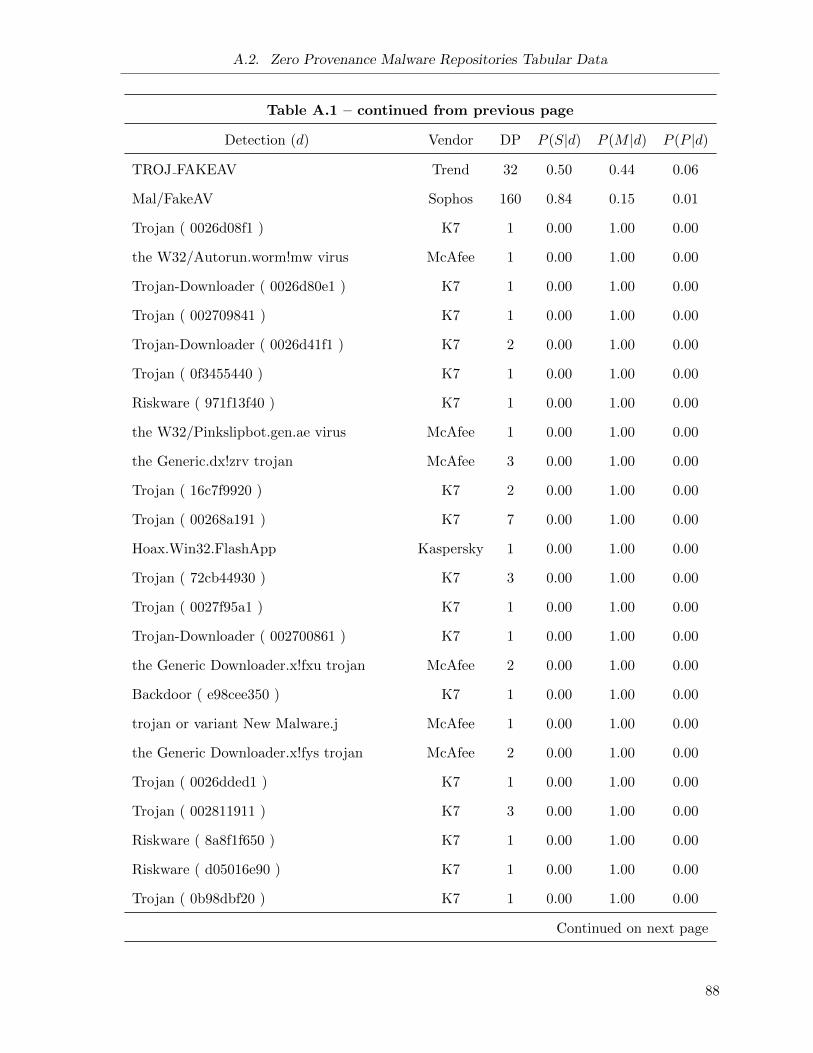
A.2. Zero Provenance Malware Repositories Tabular Data
Table A.1 – continued from previous page
Detection (d) Vendor DP P (S|d) P (M |d) P (P |d)
TROJ FAKEAV Trend 32 0.50 0.44 0.06
Mal/FakeAV Sophos 160 0.84 0.15 0.01
Trojan ( 0026d08f1 ) K7 1 0.00 1.00 0.00
the W32/Autorun.worm!mw virus McAfee 1 0.00 1.00 0.00
Trojan-Downloader ( 0026d80e1 ) K7 1 0.00 1.00 0.00
Trojan ( 002709841 ) K7 1 0.00 1.00 0.00
Trojan-Downloader ( 0026d41f1 ) K7 2 0.00 1.00 0.00
Trojan ( 0f3455440 ) K7 1 0.00 1.00 0.00
Riskware ( 971f13f40 ) K7 1 0.00 1.00 0.00
the W32/Pinkslipbot.gen.ae virus McAfee 1 0.00 1.00 0.00
the Generic.dx!zrv trojan McAfee 3 0.00 1.00 0.00
Trojan ( 16c7f9920 ) K7 2 0.00 1.00 0.00
Trojan ( 00268a191 ) K7 7 0.00 1.00 0.00
Hoax.Win32.FlashApp Kaspersky 1 0.00 1.00 0.00
Trojan ( 72cb44930 ) K7 3 0.00 1.00 0.00
Trojan ( 0027f95a1 ) K7 1 0.00 1.00 0.00
Trojan-Downloader ( 002700861 ) K7 1 0.00 1.00 0.00
the Generic Downloader.x!fxu trojan McAfee 2 0.00 1.00 0.00
Backdoor ( e98cee350 ) K7 1 0.00 1.00 0.00
trojan or variant New Malware.j McAfee 1 0.00 1.00 0.00
the Generic Downloader.x!fys trojan McAfee 2 0.00 1.00 0.00
Trojan ( 0026dded1 ) K7 1 0.00 1.00 0.00
Trojan ( 002811911 ) K7 3 0.00 1.00 0.00
Riskware ( 8a8f1f650 ) K7 1 0.00 1.00 0.00
Riskware ( d05016e90 ) K7 1 0.00 1.00 0.00
Trojan ( 0b98dbf20 ) K7 1 0.00 1.00 0.00
Continued on next page
88
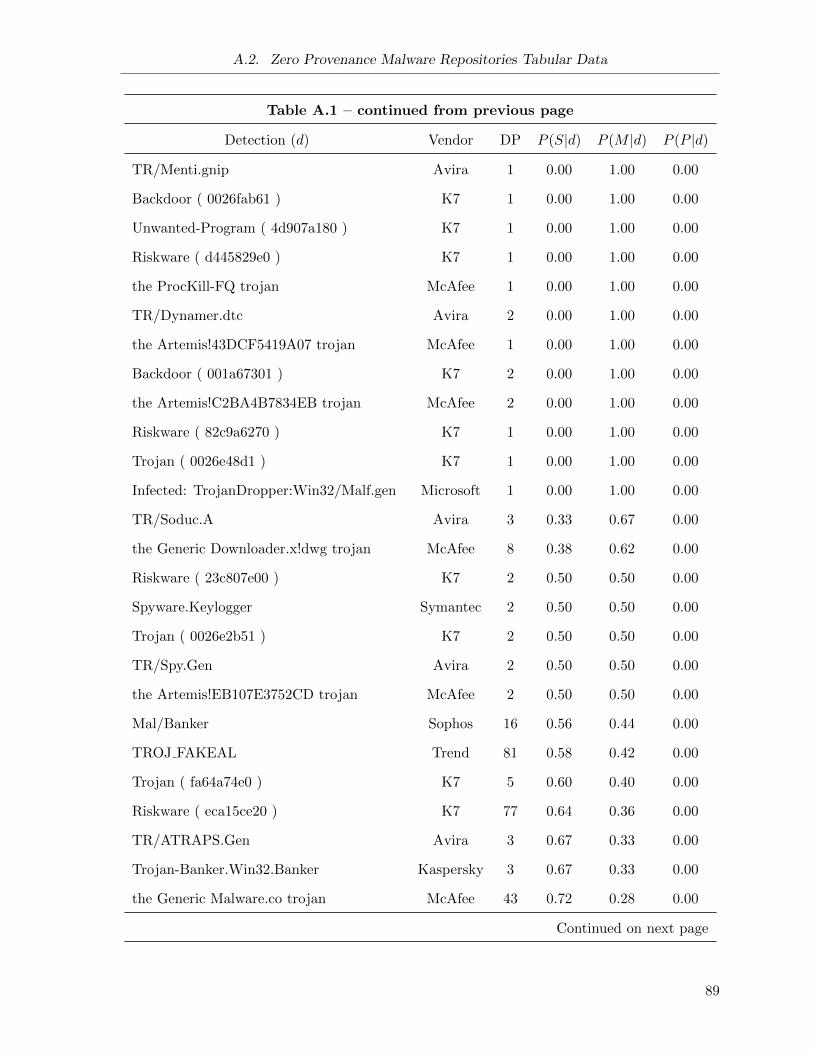
A.2. Zero Provenance Malware Repositories Tabular Data
Table A.1 – continued from previous page
Detection (d) Vendor DP P (S|d) P (M |d) P (P |d)
TR/Menti.gnip Avira 1 0.00 1.00 0.00
Backdoor ( 0026fab61 ) K7 1 0.00 1.00 0.00
Unwanted-Program ( 4d907a180 ) K7 1 0.00 1.00 0.00
Riskware ( d445829e0 ) K7 1 0.00 1.00 0.00
the ProcKill-FQ trojan McAfee 1 0.00 1.00 0.00
TR/Dynamer.dtc Avira 2 0.00 1.00 0.00
the Artemis!43DCF5419A07 trojan McAfee 1 0.00 1.00 0.00
Backdoor ( 001a67301 ) K7 2 0.00 1.00 0.00
the Artemis!C2BA4B7834EB trojan McAfee 2 0.00 1.00 0.00
Riskware ( 82c9a6270 ) K7 1 0.00 1.00 0.00
Trojan ( 0026e48d1 ) K7 1 0.00 1.00 0.00
Infected: TrojanDropper:Win32/Malf.gen Microsoft 1 0.00 1.00 0.00
TR/Soduc.A Avira 3 0.33 0.67 0.00
the Generic Downloader.x!dwg trojan McAfee 8 0.38 0.62 0.00
Riskware ( 23c807e00 ) K7 2 0.50 0.50 0.00
Spyware.Keylogger Symantec 2 0.50 0.50 0.00
Trojan ( 0026e2b51 ) K7 2 0.50 0.50 0.00
TR/Spy.Gen Avira 2 0.50 0.50 0.00
the Artemis!EB107E3752CD trojan McAfee 2 0.50 0.50 0.00
Mal/Banker Sophos 16 0.56 0.44 0.00
TROJ FAKEAL Trend 81 0.58 0.42 0.00
Trojan ( fa64a74e0 ) K7 5 0.60 0.40 0.00
Riskware ( eca15ce20 ) K7 77 0.64 0.36 0.00
TR/ATRAPS.Gen Avira 3 0.67 0.33 0.00
Trojan-Banker.Win32.Banker Kaspersky 3 0.67 0.33 0.00
the Generic Malware.co trojan McAfee 43 0.72 0.28 0.00
Continued on next page
89
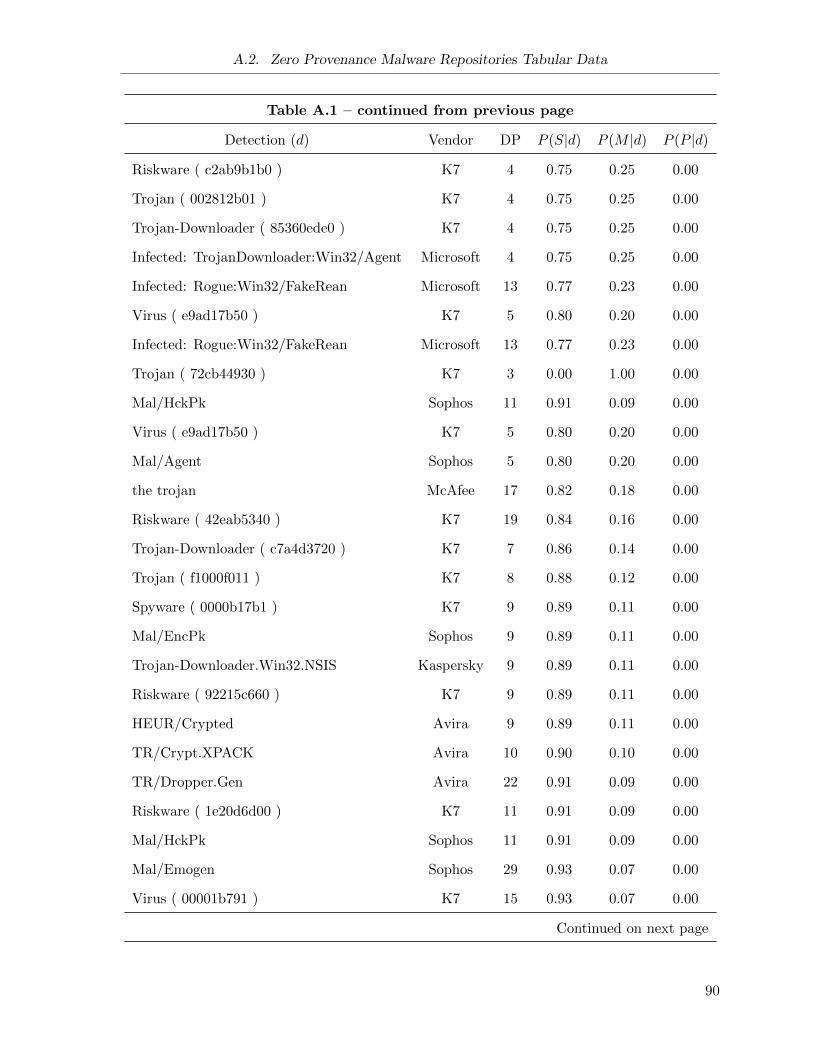
A.2. Zero Provenance Malware Repositories Tabular Data
Table A.1 – continued from previous page
Detection (d) Vendor DP P (S|d) P (M |d) P (P |d)
Riskware ( c2ab9b1b0 ) K7 4 0.75 0.25 0.00
Trojan ( 002812b01 ) K7 4 0.75 0.25 0.00
Trojan-Downloader ( 85360ede0 ) K7 4 0.75 0.25 0.00
Infected: TrojanDownloader:Win32/Agent Microsoft 4 0.75 0.25 0.00
Infected: Rogue:Win32/FakeRean Microsoft 13 0.77 0.23 0.00
Virus ( e9ad17b50 ) K7 5 0.80 0.20 0.00
Infected: Rogue:Win32/FakeRean Microsoft 13 0.77 0.23 0.00
Trojan ( 72cb44930 ) K7 3 0.00 1.00 0.00
Mal/HckPk Sophos 11 0.91 0.09 0.00
Virus ( e9ad17b50 ) K7 5 0.80 0.20 0.00
Mal/Agent Sophos 5 0.80 0.20 0.00
the trojan McAfee 17 0.82 0.18 0.00
Riskware ( 42eab5340 ) K7 19 0.84 0.16 0.00
Trojan-Downloader ( c7a4d3720 ) K7 7 0.86 0.14 0.00
Trojan ( f1000f011 ) K7 8 0.88 0.12 0.00
Spyware ( 0000b17b1 ) K7 9 0.89 0.11 0.00
Mal/EncPk Sophos 9 0.89 0.11 0.00
Trojan-Downloader.Win32.NSIS Kaspersky 9 0.89 0.11 0.00
Riskware ( 92215c660 ) K7 9 0.89 0.11 0.00
HEUR/Crypted Avira 9 0.89 0.11 0.00
TR/Crypt.XPACK Avira 10 0.90 0.10 0.00
TR/Dropper.Gen Avira 22 0.91 0.09 0.00
Riskware ( 1e20d6d00 ) K7 11 0.91 0.09 0.00
Mal/HckPk Sophos 11 0.91 0.09 0.00
Mal/Emogen Sophos 29 0.93 0.07 0.00
Virus ( 00001b791 ) K7 15 0.93 0.07 0.00
Continued on next page
90
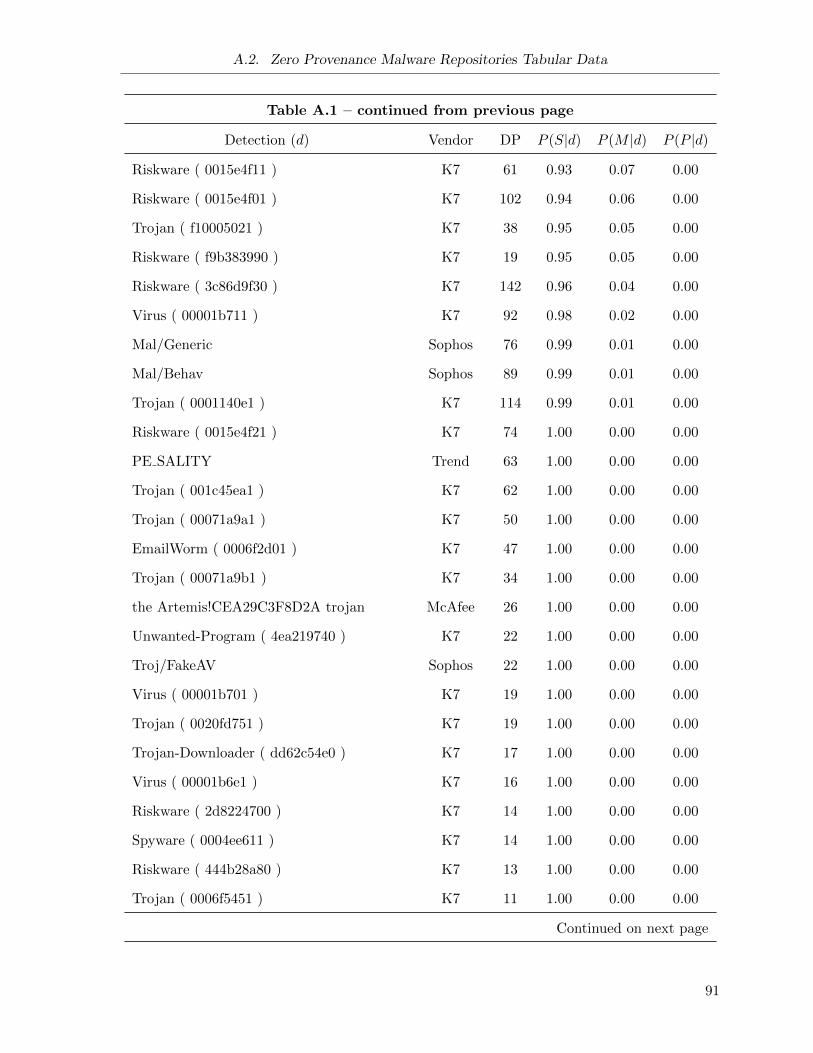
A.2. Zero Provenance Malware Repositories Tabular Data
Table A.1 – continued from previous page
Detection (d) Vendor DP P (S|d) P (M |d) P (P |d)
Riskware ( 0015e4f11 ) K7 61 0.93 0.07 0.00
Riskware ( 0015e4f01 ) K7 102 0.94 0.06 0.00
Trojan ( f10005021 ) K7 38 0.95 0.05 0.00
Riskware ( f9b383990 ) K7 19 0.95 0.05 0.00
Riskware ( 3c86d9f30 ) K7 142 0.96 0.04 0.00
Virus ( 00001b711 ) K7 92 0.98 0.02 0.00
Mal/Generic Sophos 76 0.99 0.01 0.00
Mal/Behav Sophos 89 0.99 0.01 0.00
Trojan ( 0001140e1 ) K7 114 0.99 0.01 0.00
Riskware ( 0015e4f21 ) K7 74 1.00 0.00 0.00
PE SALITY Trend 63 1.00 0.00 0.00
Trojan ( 001c45ea1 ) K7 62 1.00 0.00 0.00
Trojan ( 00071a9a1 ) K7 50 1.00 0.00 0.00
EmailWorm ( 0006f2d01 ) K7 47 1.00 0.00 0.00
Trojan ( 00071a9b1 ) K7 34 1.00 0.00 0.00
the Artemis!CEA29C3F8D2A trojan McAfee 26 1.00 0.00 0.00
Unwanted-Program ( 4ea219740 ) K7 22 1.00 0.00 0.00
Troj/FakeAV Sophos 22 1.00 0.00 0.00
Virus ( 00001b701 ) K7 19 1.00 0.00 0.00
Trojan ( 0020fd751 ) K7 19 1.00 0.00 0.00
Trojan-Downloader ( dd62c54e0 ) K7 17 1.00 0.00 0.00
Virus ( 00001b6e1 ) K7 16 1.00 0.00 0.00
Riskware ( 2d8224700 ) K7 14 1.00 0.00 0.00
Spyware ( 0004ee611 ) K7 14 1.00 0.00 0.00
Riskware ( 444b28a80 ) K7 13 1.00 0.00 0.00
Trojan ( 0006f5451 ) K7 11 1.00 0.00 0.00
Continued on next page
91
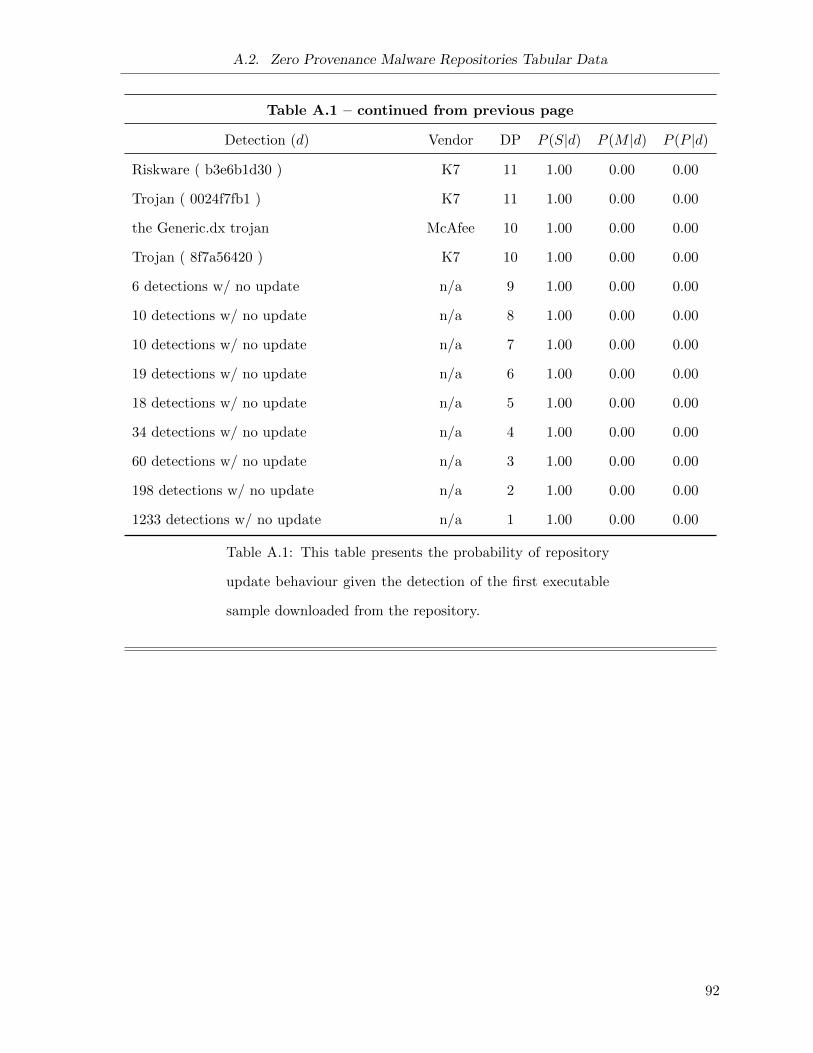
A.2. Zero Provenance Malware Repositories Tabular Data
Table A.1 – continued from previous page
Detection (d) Vendor DP P (S|d) P (M |d) P (P |d)
Riskware ( b3e6b1d30 ) K7 11 1.00 0.00 0.00
Trojan ( 0024f7fb1 ) K7 11 1.00 0.00 0.00
the Generic.dx trojan McAfee 10 1.00 0.00 0.00
Trojan ( 8f7a56420 ) K7 10 1.00 0.00 0.00
6 detections w/ no update n/a 9 1.00 0.00 0.00
10 detections w/ no update n/a 8 1.00 0.00 0.00
10 detections w/ no update n/a 7 1.00 0.00 0.00
19 detections w/ no update n/a 6 1.00 0.00 0.00
18 detections w/ no update n/a 5 1.00 0.00 0.00
34 detections w/ no update n/a 4 1.00 0.00 0.00
60 detections w/ no update n/a 3 1.00 0.00 0.00
198 detections w/ no update n/a 2 1.00 0.00 0.00
1233 detections w/ no update n/a 1 1.00 0.00 0.00
Table A.1: This table presents the probability of repository
update behaviour given the detection of the first executable
sample downloaded from the repository.
92
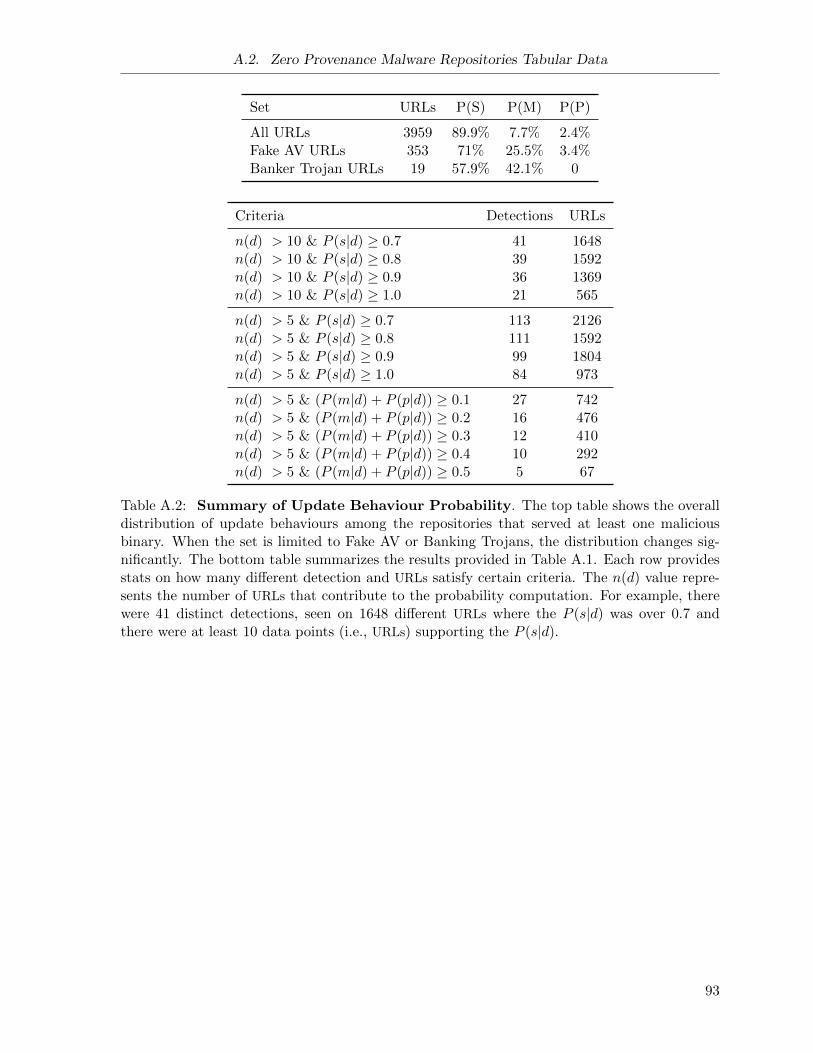
A.2. Zero Provenance Malware Repositories Tabular Data
Set URLs P(S) P(M) P(P)
All URLs 3959 89.9% 7.7% 2.4%Fake AV URLs 353 71% 25.5% 3.4%Banker Trojan URLs 19 57.9% 42.1% 0
Criteria Detections URLs
n(d) > 10 & P (s|d) ≥ 0.7 41 1648n(d) > 10 & P (s|d) ≥ 0.8 39 1592n(d) > 10 & P (s|d) ≥ 0.9 36 1369n(d) > 10 & P (s|d) ≥ 1.0 21 565
n(d) > 5 & P (s|d) ≥ 0.7 113 2126n(d) > 5 & P (s|d) ≥ 0.8 111 1592n(d) > 5 & P (s|d) ≥ 0.9 99 1804n(d) > 5 & P (s|d) ≥ 1.0 84 973
n(d) > 5 & (P (m|d) + P (p|d)) ≥ 0.1 27 742n(d) > 5 & (P (m|d) + P (p|d)) ≥ 0.2 16 476n(d) > 5 & (P (m|d) + P (p|d)) ≥ 0.3 12 410n(d) > 5 & (P (m|d) + P (p|d)) ≥ 0.4 10 292n(d) > 5 & (P (m|d) + P (p|d)) ≥ 0.5 5 67
Table A.2: Summary of Update Behaviour Probability. The top table shows the overalldistribution of update behaviours among the repositories that served at least one maliciousbinary. When the set is limited to Fake AV or Banking Trojans, the distribution changes sig-nificantly. The bottom table summarizes the results provided in Table A.1. Each row providesstats on how many different detection and URLs satisfy certain criteria. The n(d) value repre-sents the number of URLs that contribute to the probability computation. For example, therewere 41 distinct detections, seen on 1648 different URLs where the P (s|d) was over 0.7 andthere were at least 10 data points (i.e., URLs) supporting the P (s|d).
93
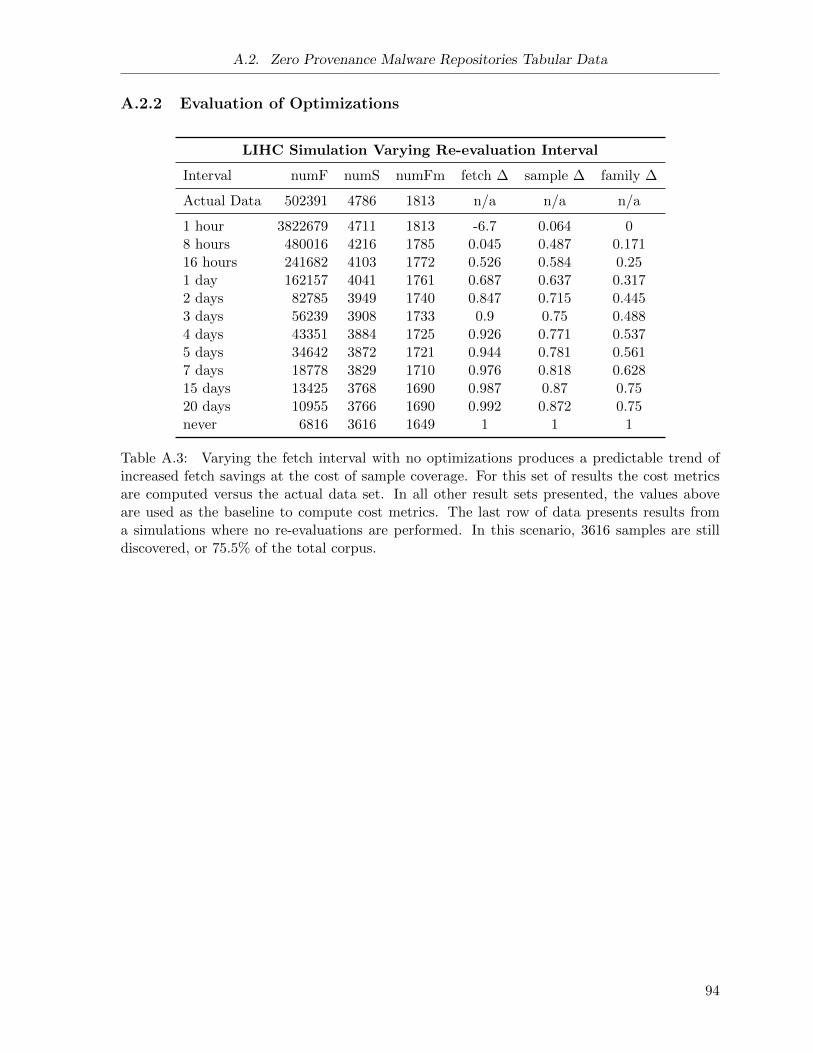
A.2. Zero Provenance Malware Repositories Tabular Data
A.2.2 Evaluation of Optimizations
LIHC Simulation Varying Re-evaluation Interval
Interval numF numS numFm fetch ∆ sample ∆ family ∆
Actual Data 502391 4786 1813 n/a n/a n/a
1 hour 3822679 4711 1813 -6.7 0.064 08 hours 480016 4216 1785 0.045 0.487 0.17116 hours 241682 4103 1772 0.526 0.584 0.251 day 162157 4041 1761 0.687 0.637 0.3172 days 82785 3949 1740 0.847 0.715 0.4453 days 56239 3908 1733 0.9 0.75 0.4884 days 43351 3884 1725 0.926 0.771 0.5375 days 34642 3872 1721 0.944 0.781 0.5617 days 18778 3829 1710 0.976 0.818 0.62815 days 13425 3768 1690 0.987 0.87 0.7520 days 10955 3766 1690 0.992 0.872 0.75never 6816 3616 1649 1 1 1
Table A.3: Varying the fetch interval with no optimizations produces a predictable trend ofincreased fetch savings at the cost of sample coverage. For this set of results the cost metricsare computed versus the actual data set. In all other result sets presented, the values aboveare used as the baseline to compute cost metrics. The last row of data presents results froma simulations where no re-evaluations are performed. In this scenario, 3616 samples are stilldiscovered, or 75.5% of the total corpus.
94
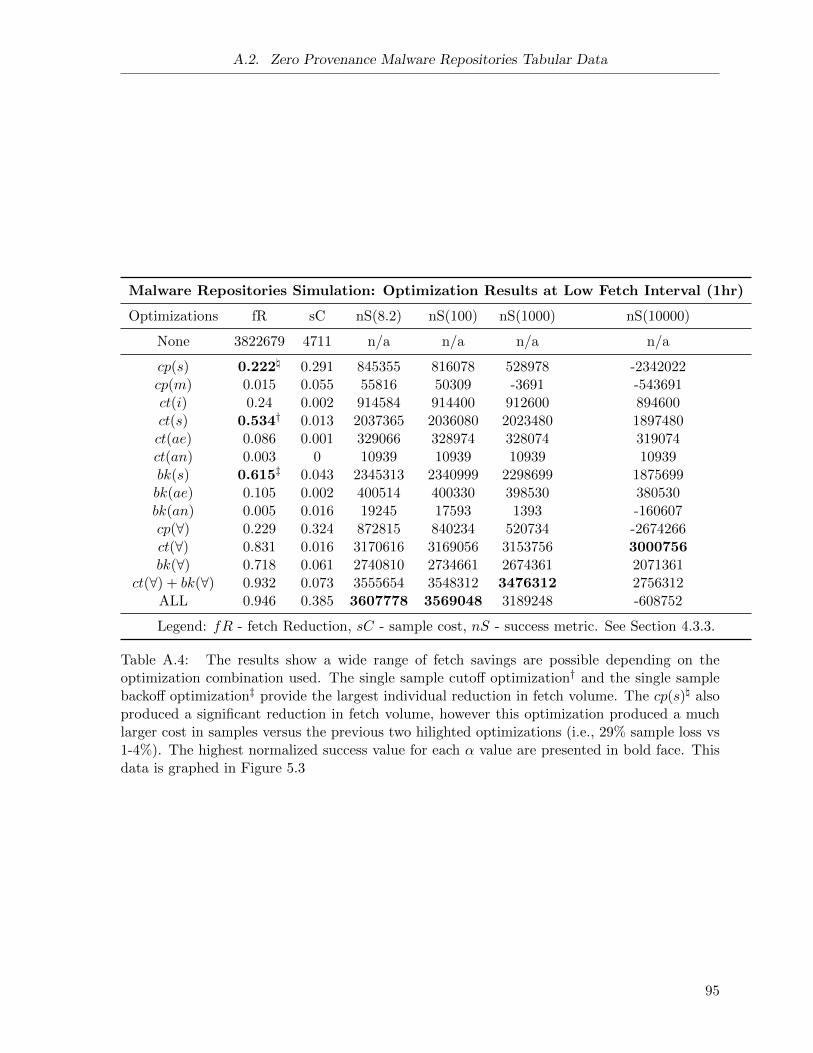
A.2. Zero Provenance Malware Repositories Tabular Data
Malware Repositories Simulation: Optimization Results at Low Fetch Interval (1hr)
Optimizations fR sC nS(8.2) nS(100) nS(1000) nS(10000)
None 3822679 4711 n/a n/a n/a n/a
cp(s) 0.222\ 0.291 845355 816078 528978 -2342022cp(m) 0.015 0.055 55816 50309 -3691 -543691ct(i) 0.24 0.002 914584 914400 912600 894600ct(s) 0.534† 0.013 2037365 2036080 2023480 1897480ct(ae) 0.086 0.001 329066 328974 328074 319074ct(an) 0.003 0 10939 10939 10939 10939bk(s) 0.615‡ 0.043 2345313 2340999 2298699 1875699bk(ae) 0.105 0.002 400514 400330 398530 380530bk(an) 0.005 0.016 19245 17593 1393 -160607cp(∀) 0.229 0.324 872815 840234 520734 -2674266ct(∀) 0.831 0.016 3170616 3169056 3153756 3000756bk(∀) 0.718 0.061 2740810 2734661 2674361 2071361
ct(∀) + bk(∀) 0.932 0.073 3555654 3548312 3476312 2756312ALL 0.946 0.385 3607778 3569048 3189248 -608752
Legend: fR - fetch Reduction, sC - sample cost, nS - success metric. See Section 4.3.3.
Table A.4: The results show a wide range of fetch savings are possible depending on theoptimization combination used. The single sample cutoff optimization† and the single samplebackoff optimization‡ provide the largest individual reduction in fetch volume. The cp(s)\ alsoproduced a significant reduction in fetch volume, however this optimization produced a muchlarger cost in samples versus the previous two hilighted optimizations (i.e., 29% sample loss vs1-4%). The highest normalized success value for each α value are presented in bold face. Thisdata is graphed in Figure 5.3
95
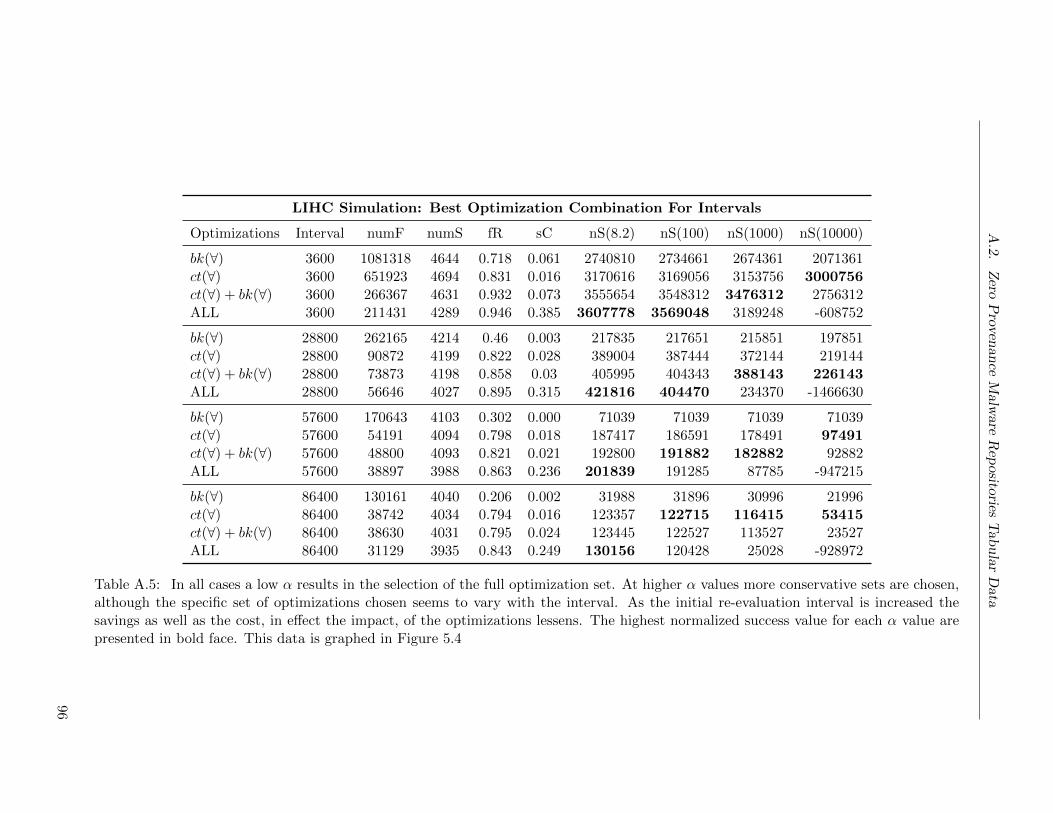
A.2.
Zero
Proven
ance
Malw
areRep
ositoriesTab
ular
Data
LIHC Simulation: Best Optimization Combination For Intervals
Optimizations Interval numF numS fR sC nS(8.2) nS(100) nS(1000) nS(10000)
bk(∀) 3600 1081318 4644 0.718 0.061 2740810 2734661 2674361 2071361ct(∀) 3600 651923 4694 0.831 0.016 3170616 3169056 3153756 3000756ct(∀) + bk(∀) 3600 266367 4631 0.932 0.073 3555654 3548312 3476312 2756312ALL 3600 211431 4289 0.946 0.385 3607778 3569048 3189248 -608752
bk(∀) 28800 262165 4214 0.46 0.003 217835 217651 215851 197851ct(∀) 28800 90872 4199 0.822 0.028 389004 387444 372144 219144ct(∀) + bk(∀) 28800 73873 4198 0.858 0.03 405995 404343 388143 226143ALL 28800 56646 4027 0.895 0.315 421816 404470 234370 -1466630
bk(∀) 57600 170643 4103 0.302 0.000 71039 71039 71039 71039ct(∀) 57600 54191 4094 0.798 0.018 187417 186591 178491 97491ct(∀) + bk(∀) 57600 48800 4093 0.821 0.021 192800 191882 182882 92882ALL 57600 38897 3988 0.863 0.236 201839 191285 87785 -947215
bk(∀) 86400 130161 4040 0.206 0.002 31988 31896 30996 21996ct(∀) 86400 38742 4034 0.794 0.016 123357 122715 116415 53415ct(∀) + bk(∀) 86400 38630 4031 0.795 0.024 123445 122527 113527 23527ALL 86400 31129 3935 0.843 0.249 130156 120428 25028 -928972
Table A.5: In all cases a low α results in the selection of the full optimization set. At higher α values more conservative sets are chosen,although the specific set of optimizations chosen seems to vary with the interval. As the initial re-evaluation interval is increased thesavings as well as the cost, in effect the impact, of the optimizations lessens. The highest normalized success value for each α value arepresented in bold face. This data is graphed in Figure 5.4
96
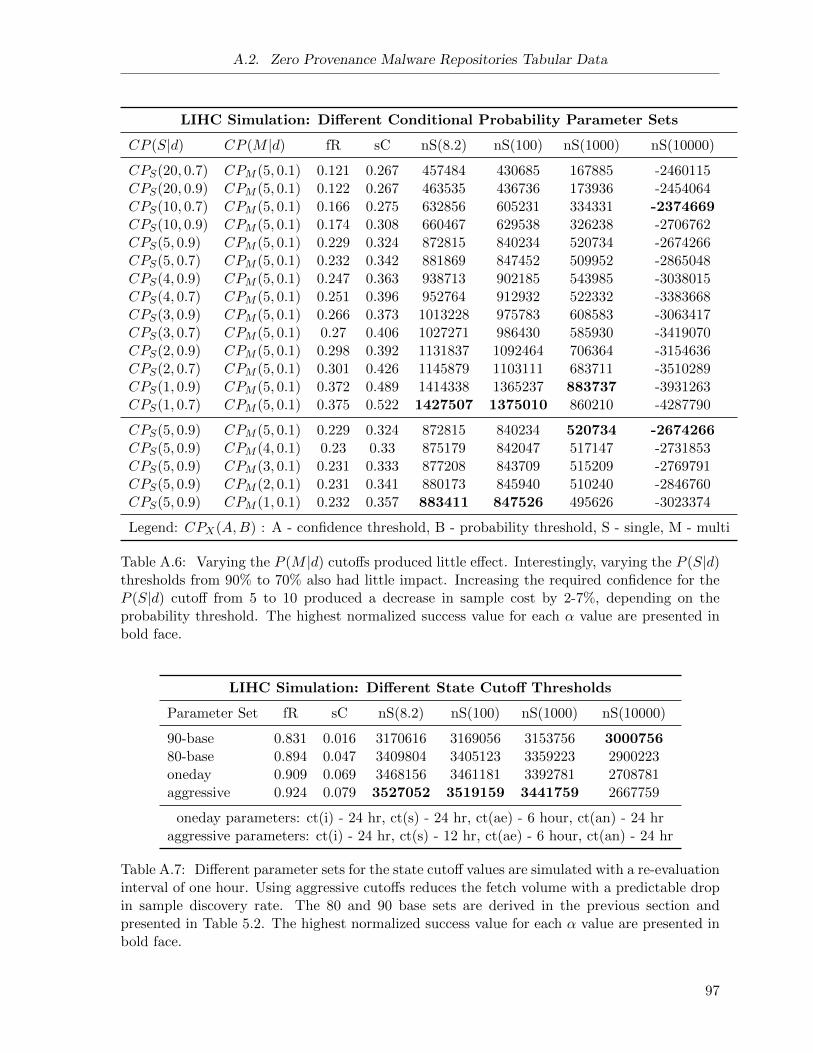
A.2. Zero Provenance Malware Repositories Tabular Data
LIHC Simulation: Different Conditional Probability Parameter Sets
CP (S|d) CP (M |d) fR sC nS(8.2) nS(100) nS(1000) nS(10000)
CPS(20, 0.7) CPM (5, 0.1) 0.121 0.267 457484 430685 167885 -2460115CPS(20, 0.9) CPM (5, 0.1) 0.122 0.267 463535 436736 173936 -2454064CPS(10, 0.7) CPM (5, 0.1) 0.166 0.275 632856 605231 334331 -2374669CPS(10, 0.9) CPM (5, 0.1) 0.174 0.308 660467 629538 326238 -2706762CPS(5, 0.9) CPM (5, 0.1) 0.229 0.324 872815 840234 520734 -2674266CPS(5, 0.7) CPM (5, 0.1) 0.232 0.342 881869 847452 509952 -2865048CPS(4, 0.9) CPM (5, 0.1) 0.247 0.363 938713 902185 543985 -3038015CPS(4, 0.7) CPM (5, 0.1) 0.251 0.396 952764 912932 522332 -3383668CPS(3, 0.9) CPM (5, 0.1) 0.266 0.373 1013228 975783 608583 -3063417CPS(3, 0.7) CPM (5, 0.1) 0.27 0.406 1027271 986430 585930 -3419070CPS(2, 0.9) CPM (5, 0.1) 0.298 0.392 1131837 1092464 706364 -3154636CPS(2, 0.7) CPM (5, 0.1) 0.301 0.426 1145879 1103111 683711 -3510289CPS(1, 0.9) CPM (5, 0.1) 0.372 0.489 1414338 1365237 883737 -3931263CPS(1, 0.7) CPM (5, 0.1) 0.375 0.522 1427507 1375010 860210 -4287790
CPS(5, 0.9) CPM (5, 0.1) 0.229 0.324 872815 840234 520734 -2674266CPS(5, 0.9) CPM (4, 0.1) 0.23 0.33 875179 842047 517147 -2731853CPS(5, 0.9) CPM (3, 0.1) 0.231 0.333 877208 843709 515209 -2769791CPS(5, 0.9) CPM (2, 0.1) 0.231 0.341 880173 845940 510240 -2846760CPS(5, 0.9) CPM (1, 0.1) 0.232 0.357 883411 847526 495626 -3023374
Legend: CPX(A,B) : A - confidence threshold, B - probability threshold, S - single, M - multi
Table A.6: Varying the P (M |d) cutoffs produced little effect. Interestingly, varying the P (S|d)thresholds from 90% to 70% also had little impact. Increasing the required confidence for theP (S|d) cutoff from 5 to 10 produced a decrease in sample cost by 2-7%, depending on theprobability threshold. The highest normalized success value for each α value are presented inbold face.
LIHC Simulation: Different State Cutoff Thresholds
Parameter Set fR sC nS(8.2) nS(100) nS(1000) nS(10000)
90-base 0.831 0.016 3170616 3169056 3153756 300075680-base 0.894 0.047 3409804 3405123 3359223 2900223oneday 0.909 0.069 3468156 3461181 3392781 2708781aggressive 0.924 0.079 3527052 3519159 3441759 2667759
oneday parameters: ct(i) - 24 hr, ct(s) - 24 hr, ct(ae) - 6 hour, ct(an) - 24 hraggressive parameters: ct(i) - 24 hr, ct(s) - 12 hr, ct(ae) - 6 hour, ct(an) - 24 hr
Table A.7: Different parameter sets for the state cutoff values are simulated with a re-evaluationinterval of one hour. Using aggressive cutoffs reduces the fetch volume with a predictable dropin sample discovery rate. The 80 and 90 base sets are derived in the previous section andpresented in Table 5.2. The highest normalized success value for each α value are presented inbold face.
97
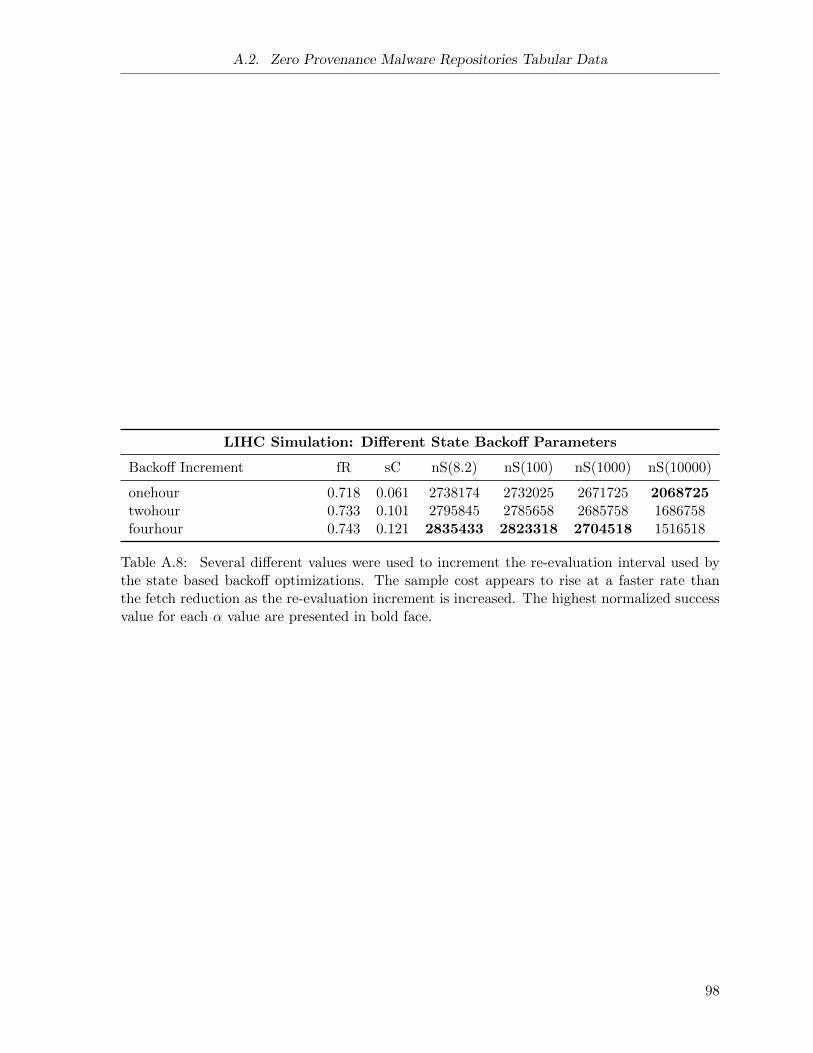
A.2. Zero Provenance Malware Repositories Tabular Data
LIHC Simulation: Different State Backoff Parameters
Backoff Increment fR sC nS(8.2) nS(100) nS(1000) nS(10000)
onehour 0.718 0.061 2738174 2732025 2671725 2068725twohour 0.733 0.101 2795845 2785658 2685758 1686758fourhour 0.743 0.121 2835433 2823318 2704518 1516518
Table A.8: Several different values were used to increment the re-evaluation interval used bythe state based backoff optimizations. The sample cost appears to rise at a faster rate thanthe fetch reduction as the re-evaluation increment is increased. The highest normalized successvalue for each α value are presented in bold face.
98
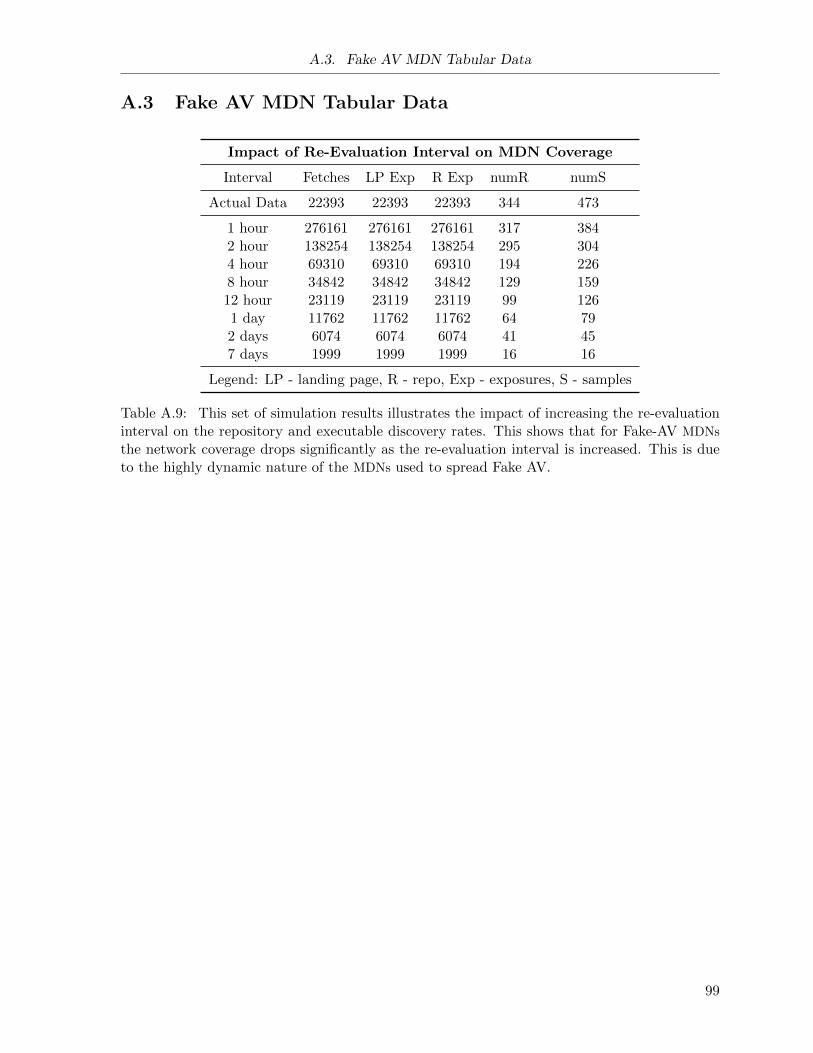
A.3. Fake AV MDN Tabular Data
A.3 Fake AV MDN Tabular Data
Impact of Re-Evaluation Interval on MDN Coverage
Interval Fetches LP Exp R Exp numR numS
Actual Data 22393 22393 22393 344 473
1 hour 276161 276161 276161 317 3842 hour 138254 138254 138254 295 3044 hour 69310 69310 69310 194 2268 hour 34842 34842 34842 129 15912 hour 23119 23119 23119 99 1261 day 11762 11762 11762 64 792 days 6074 6074 6074 41 457 days 1999 1999 1999 16 16
Legend: LP - landing page, R - repo, Exp - exposures, S - samples
Table A.9: This set of simulation results illustrates the impact of increasing the re-evaluationinterval on the repository and executable discovery rates. This shows that for Fake-AV MDNs
the network coverage drops significantly as the re-evaluation interval is increased. This is dueto the highly dynamic nature of the MDNs used to spread Fake AV.
99
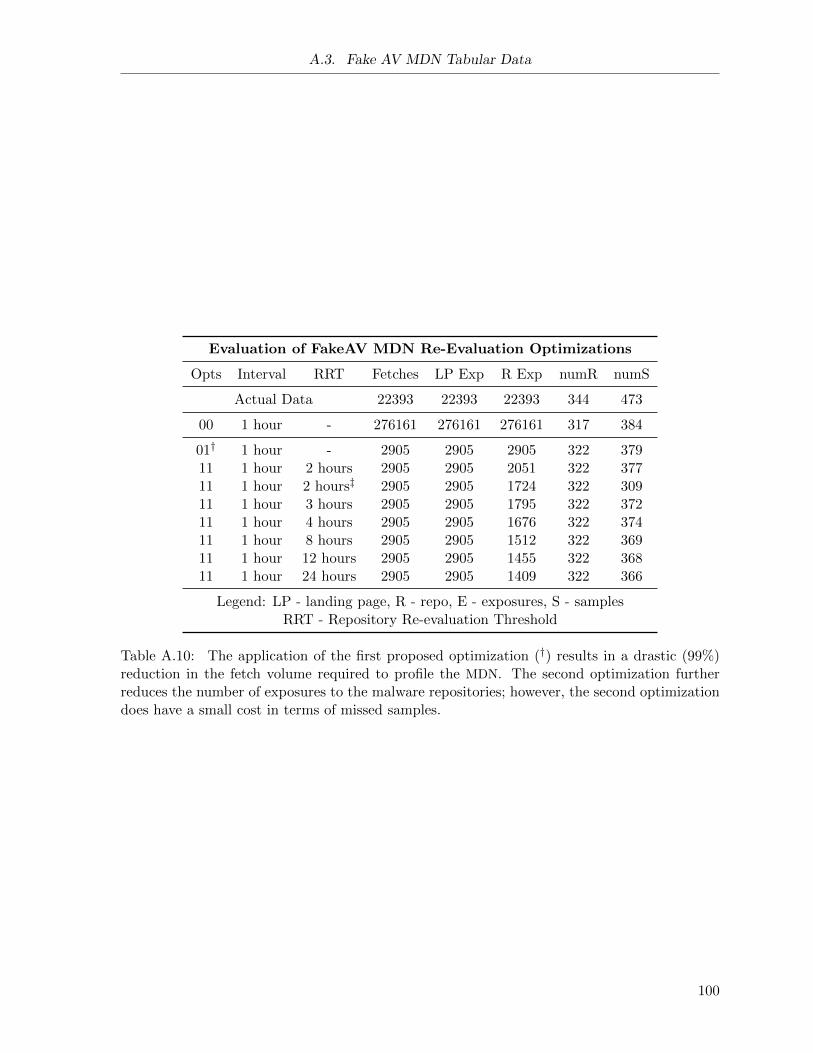
A.3. Fake AV MDN Tabular Data
Evaluation of FakeAV MDN Re-Evaluation Optimizations
Opts Interval RRT Fetches LP Exp R Exp numR numS
Actual Data 22393 22393 22393 344 473
00 1 hour - 276161 276161 276161 317 384
01† 1 hour - 2905 2905 2905 322 37911 1 hour 2 hours 2905 2905 2051 322 37711 1 hour 2 hours‡ 2905 2905 1724 322 30911 1 hour 3 hours 2905 2905 1795 322 37211 1 hour 4 hours 2905 2905 1676 322 37411 1 hour 8 hours 2905 2905 1512 322 36911 1 hour 12 hours 2905 2905 1455 322 36811 1 hour 24 hours 2905 2905 1409 322 366
Legend: LP - landing page, R - repo, E - exposures, S - samplesRRT - Repository Re-evaluation Threshold
Table A.10: The application of the first proposed optimization (†) results in a drastic (99%)reduction in the fetch volume required to profile the MDN. The second optimization furtherreduces the number of exposures to the malware repositories; however, the second optimizationdoes have a small cost in terms of missed samples.
100
A.4. Blacklisting Case Studies
A.4 Blacklisting Case Studies
The LIHC study of repositories did not show any sign of closed loop blacklisting systems (i.e.,
a fully automated process to identify and block researcher IPs); however, I did observe several
malware servers blacklist my honey clients.
The examples below were identified automatically by the TDG by monitoring for unexpected
differences in URL state between different downloaders used to monitor malware repositories.
The downloaders operate on different IP addresses and have very different download frequencies.
The assumption is that not all downloaders will be simultaneously blacklisted, and the high
volume downloaders will be blacklisted first. As discussed in Section 4.2, once a potential case
of blacklisting is discovered, a reserve downloader (i.e., a downloader using idle IP addresses)
issues a HTTP request to determine the true state of the repository. I found that this eliminated
most of the false positives caused by this method of blacklisting identification; in the new data
captured after April 2011 (after DB purge) 182 URLs triggered the initial blacklisting alarm, 161
were discarded after the reserve fetcher received negative results. Of the 21 cases that remained
there were several interesting cases; these are documented below. Note that in only one case
is there definitive evidence of blacklisting; all other cases are circumstantial at best. They are
included to illustrate some of the challenges that arise when trying to pinpoint incidents of
blacklisting.
A.4.1 Reactive Blacklisting of a Client IP - ZBot
In this example a MDN serves executables to multiple clients - one high volume and several low
volume - fetching successfully for a week and then the high volume client is blacklisted. The
details are presented below:
From January 26 - Feb 2, 2011 an MDN was studied that spread over 100 IPs hosting at
least three .ru domains and one .in domain serving executables at /au.exe (and one other path),
confirmed to be Zbot variants. The domains had similar WHOIS traits including registration
date and stated nameserver31. The high volume client downloaded the executables 1500 times.
Within a 10 minute period all IPs in the MDN servers began denying all requests from the high
31The nameservers were ns[1|2].laptoptamer.net, a reference to a botherder.
101
A.4. Blacklisting Case Studies
volume client. Executables were downloaded from the same URLs using low volume clients for
as long as 30 hours after the alleged blacklisting event.
A.4.2 Assigning a single sample to each client IP - Swizzor
In essence this malware family was assigning a specific sample to each visiting client, and then
responding to all requests from known clients with the original chosen sample. If two clients
visit one of these servers, each client will get a different sample (e.g., A and B). All subsequent
requests from client 1 will result in a download of sample A, and all subsequent requests from
client 2 will result in a download of sample B. I speculate that this is a deliberate technique
intended to limit the ability of a security researcher to collect a large corpus of samples from
the swizzor family of malware. This countermeasure is different from traditional blacklisting in
that it does not rely on identification of security honey clients in order to protect the malicious
samples. The details are presented below.
In January 2011 four different malware repositories with a similar URL structure (< IP >
/path.int? < query >) were fetched over 2000 times by LIHCs over a week long period. There
were two clients being used (C1 and C2), each with a different IP address. Three of the malware
servers consistently served sample A to C1 and B to C2. The fourth server consistently served
sample C to C1 and sample D to C2.
A.4.3 Planet Lab Block
Between May 30, 2011 and June 1, 2011, the TDG studied 10 URLs from the domain 3-a.net,
with similar subdomain and path parameters. 3-a.net is a dynamic DNS provider that simply
redirects requests to another domain. Requests to 3-a.net from linode servers resulted in a
HTTP 500 (connection refused) with no redirects. Requests to 3-a.net from any planetlab
proxy resulted in a HTTP 302 redirect to the planetlab abuse page (http://planetflow.planet-
lab.org). Upon time of investigation the sites were all down so further investigation was not
possible.
102
A.5. Survey Question and Answer
A.4.4 Inconsistent DNS Responses
Between May 29, 2011 and June 1, 2011, the TDG studied URLs from the domain videotech-
pro.in, with similar path parameters. For one high volume linode HTTP client, the domain
resolved to 66.45.243.36 and the server responded with polymorphic malicious samples of un-
known family. During the same period, seven other clients received DNS responses indicating
the server was hosted on IP address 7.7.7.7 (which is registered by the U.S Department of
Defense). All requests to 7.7.7.7 failed as there is no route to the IP address 7.7.7.7. Several
other domains, (smallsrv.com, duote.com.cn, 3ddown.com) exhibit similar inconsistent DNS
resolution results, however no strong conclusions can be drawn without further investigation.
Unfortunately, the temporal nature of DNS and malware repositories makes further investiga-
tion of these domains infeasible.
A.4.5 Negative Responses to High Volume Client
The URL yy.lovegua.com:12345/windosys.exe was studied for 5 days in early June. One high
volume linode server received HTTP 500 (connection refused) for the full duration of study.
Seven other clients were able to download malicious executable content for the duration of the
study period.
A.5 Survey Question and Answer
A survey was sent out to get a seed value for the α parameter (see Section 4.3). Members of
SophosLabs were asked the following question: “How many fetches would you spend to get a
single sample we have not seen before?”. The full survey question, which was sent over email,
is included below:
I would like to conduct a very brief
survey to help choose a number in my
research that is highly subjective.
Try not to think too hard, and any
answer over 10 words will be thrown in the garbage.
103
A.5. Survey Question and Answer
I would be blessed if you all responded ASAP.
The question:
How many fetches would you spend to
get a single sample we have not seen before?
Examples of unacceptable answers:
Well you see Kyle that depends on:
blah blah lbahalabh lblah
Examples of acceptable answers:
X, where X is a positive integer.
Thanks,
You are all highly talented individuals
and I appreciate your feedback.
Kyle
The results of the survey are presented in Table A.11 in chronological order of response
with any comments included. The average was 8.2 with a standard deviation of 11.9. My initial
guess was 100, based on the first success formula I used:
S = 100× numS + 1000× numFm− numF (A.1)
Note that I do not include my initial guess in the computed average. Any incidents of
anchoring, that is, a survey response that was sent to the entire group before they could answer
- clearly I should used a proper opaque survey tool instead of email - are noted in the Table.
104
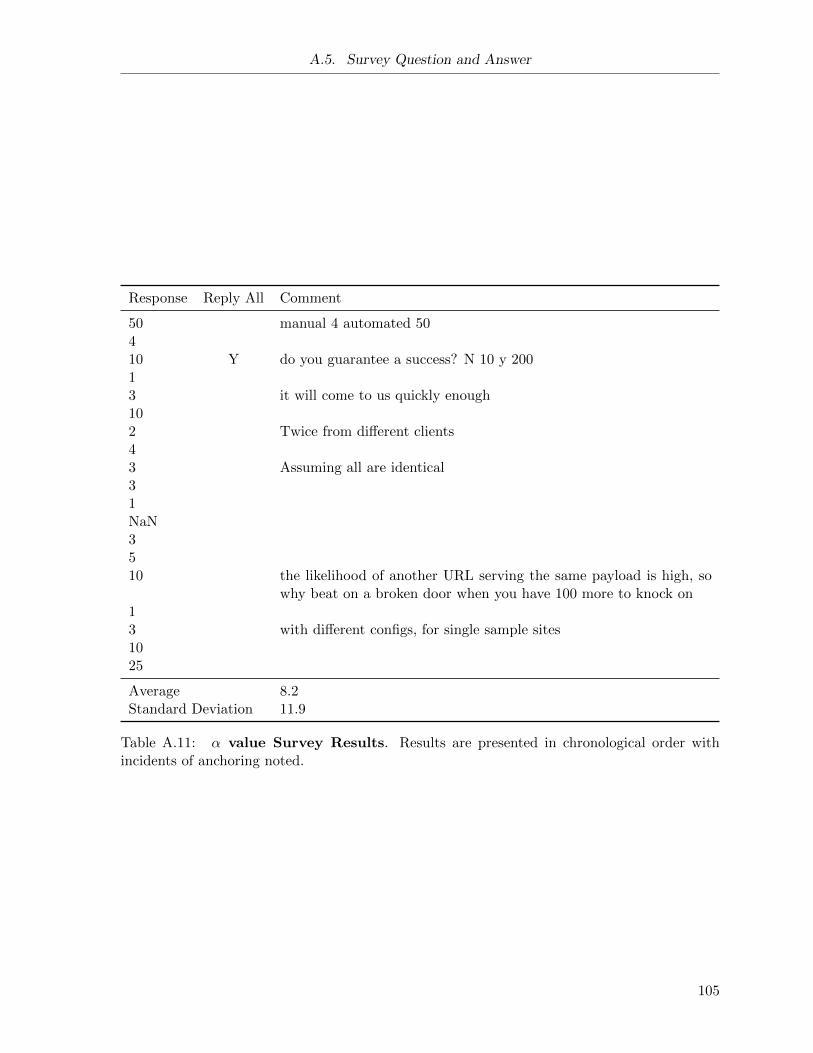
A.5. Survey Question and Answer
Response Reply All Comment
50 manual 4 automated 50410 Y do you guarantee a success? N 10 y 20013 it will come to us quickly enough102 Twice from different clients43 Assuming all are identical31NaN3510 the likelihood of another URL serving the same payload is high, so
why beat on a broken door when you have 100 more to knock on13 with different configs, for single sample sites1025
Average 8.2Standard Deviation 11.9
Table A.11: α value Survey Results. Results are presented in chronological order withincidents of anchoring noted.
105