optimizing mobile for your future students: findings from the 2016 social admissions report
TRANSCRIPT
TL05: Op)mizing Mobile for Your Future Students: Findings from the 2016 Social Admissions Report
• Brian Niles, TargetX, CA • Gil Rogers, Chegg, CA

Social media isn’t new. This year’s study updates key data but shiJs focus to emerging resources and influencers. This year’s valuable yet oJen misunderstood asset is mobile technology. As always, there is a balance between being an early adopter and being strategic and focused on your goals.
Why We Do This Survey

Invita8ons emailed to high school students registered to Chegg
• October 2015
• Past Social Admissions Reports fielded in: Q2 2015 | Q4 2014 |Q2 2014 Q4 2013 | Q1 2013 | Q2 2012
• Trends highlighted throughout the presenta8on
Survey
Insight into how students use, and are influenced by, digital tools, mobile technology and social media when researching and evalua8ng ins8tu8ons
Background
Methodology
High school seniors and college freshmen
• 1,926 surveys completed this cycle (over 7,000 total)
• Weighted data to 42% male, 58% female
Audience
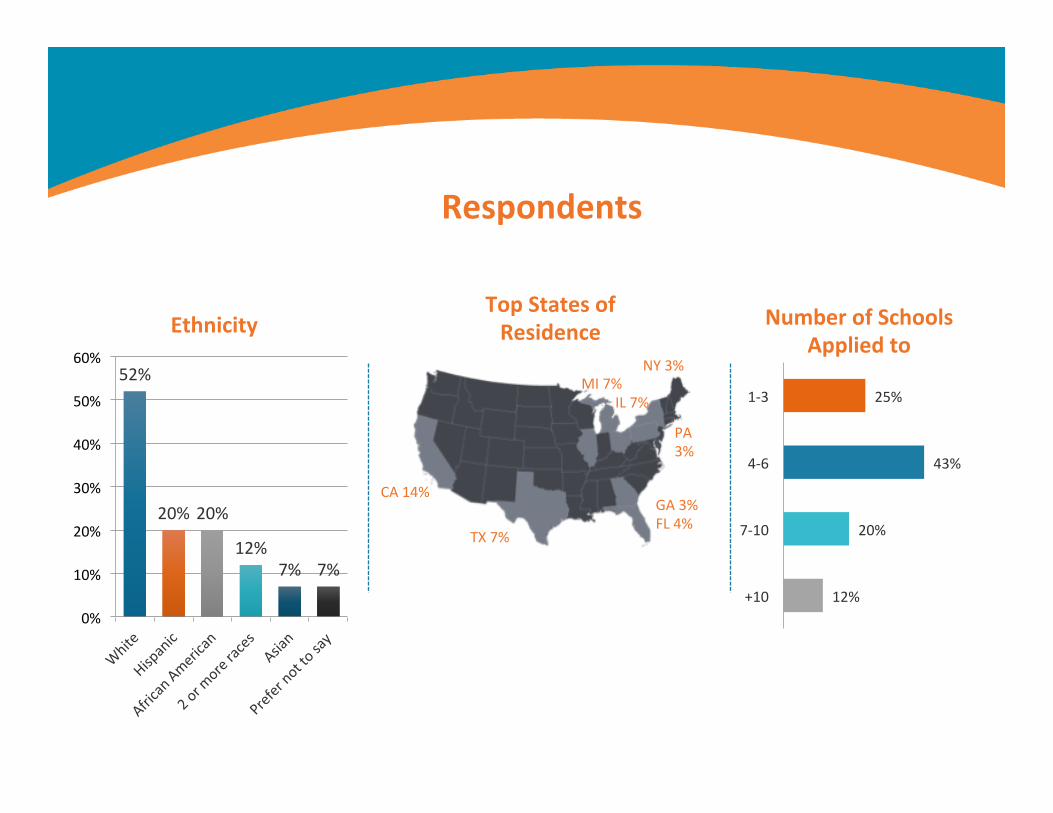
52%
20% 20%
12% 7% 7%
0%
10%
20%
30%
40%
50%
60%
Ethnicity
Respondents
25%
43%
20%
12%
1-‐3
4-‐6
7-‐10
+10
Number of Schools Applied to
CA 14% GA 3% FL 4%
MI 7% NY 3%
PA 3%
TX 7%
Top States of Residence
IL 7%

Mobile From Recruitment Through Enrollment

86% of young adults (ages 18-‐29) own a mobile smartphone
9 out of 10 young adults use social media
Half of young adults who own a smartphone also use messaging apps
Mobile provides the most effec)ve way to reach and communicate with students
Mobile Technology & Today’s Students

0%!
10%!
20%!
30%!
40%!
50%!
60%!
70%!
80%!
90%!
Watched video from college
Watched video from student
Read a student blog
Searched for specific hashtag
Posted ques8on to college rep on
sm
Posted ques8on to student on sm
Tweeted with specific hashtag
Par8cipated in live chat
Peeked at a specific school on
YkYak
Past 24 hours! Past week! Past month or longer!
81%!
45%! 42%!
32%!
20%! 20%! 19%! 19%!
9%!
4 in 5 have watched a
video from a college
Connec)ng with Colleges
How oaen have you done the following during your college research process?

Email, 69%
Social Media, 4%
Call, 12%
Live Chat, 4%
Text, 8%
Messaging App, 3%
Email Preferred Communica)on on Mobile
How do you most prefer to communicate with college admissions on your mobile device?

71%!
32%!26%!
7%! 5%!1%!
Kik GroupMe WhatsApp Whisper WeChat FireChat
Messaging Apps Are So Popular
7 in 10 have used KIK
Have you used any of the following messaging apps?
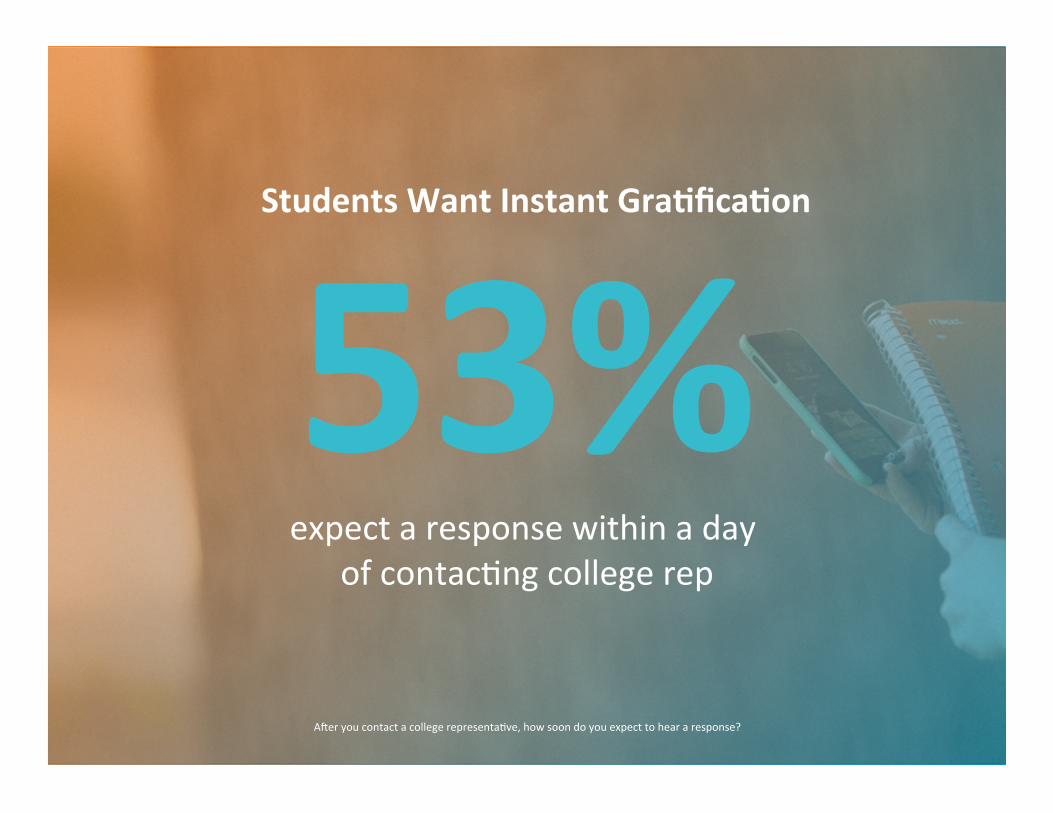
53% expect a response within a day
of contac8ng college rep
Aaer you contact a college representa8ve, how soon do you expect to hear a response?
Students Want Instant Gra)fica)on

93% agree “I would like to receive communica)on from
college admissions tailored specifically to me.”
Students Want Personalized Communica)on

47% Laptop
37% Smartphone or Tablet 13%
Desktop
Primary Device to Research Colleges
#socadm16 Which device do you primarily use to research colleges?

82%
37% 37%
19% 15%
12% 6%
Visited college website
Scheduled campus visit
Taken virtual campus tour
Downloaded na8ve app from college
Asked ques8on on social media
Texted with college rep
Live chat with college rep
Admissions Ac)ons Completed on Mobile
Which of the following have you done on a mobile device when considering which colleges to apply to or where to enroll?

4 in 5 visit college websites
1 in 5 download na8ve apps
Admissions Ac)ons Completed on Mobile
Which of the following have you done on a mobile device when considering which colleges to apply to or where to enroll?

Your ins)tu)on’s website is the first marke8ng tool to
airact and engage prospec8ve students.
Mobile Browsing vs. Mobile Apps
Mobile browsing is a key element during the discovery phase of
college search.
Mobile apps accelerate engagement with your ins8tu8on once students have demonstrated interest.
Na)ve apps are used most during decision phase of the college choice process.

Once a day, 21%!
Once a week, 36%!
Once a month, 14%!
Every once in a while,
29%!
Frequency of College Website Visits
16%!
64%!
14%!7%!
Quality of Mobile Experience
Your Website Must Be Mobile Op)mized
How frequently do you visit college websites on a mobile browser? How would you rate your mobile experience interac8ng with college websites?

73%!66%!
54%! 54%! 53%!
Updates on admissions info
Learn about college-specific info
Submit an application Communicate with college rep
Take a virtual campus tour
Students Download Na)ve Apps
Half of Students would download app to communicate
For what purpose would you download a na8ve app from a college?

University-‐Branded Mobile App

85%
35%
5%
College Website Common App Other
Submijng Apps on Their Phone
12% submiied an
applica8on through mobile
Did you submit a college applica8on on a mobile device? Which methods best describe how you submiied a college applica8on on your mobile device?
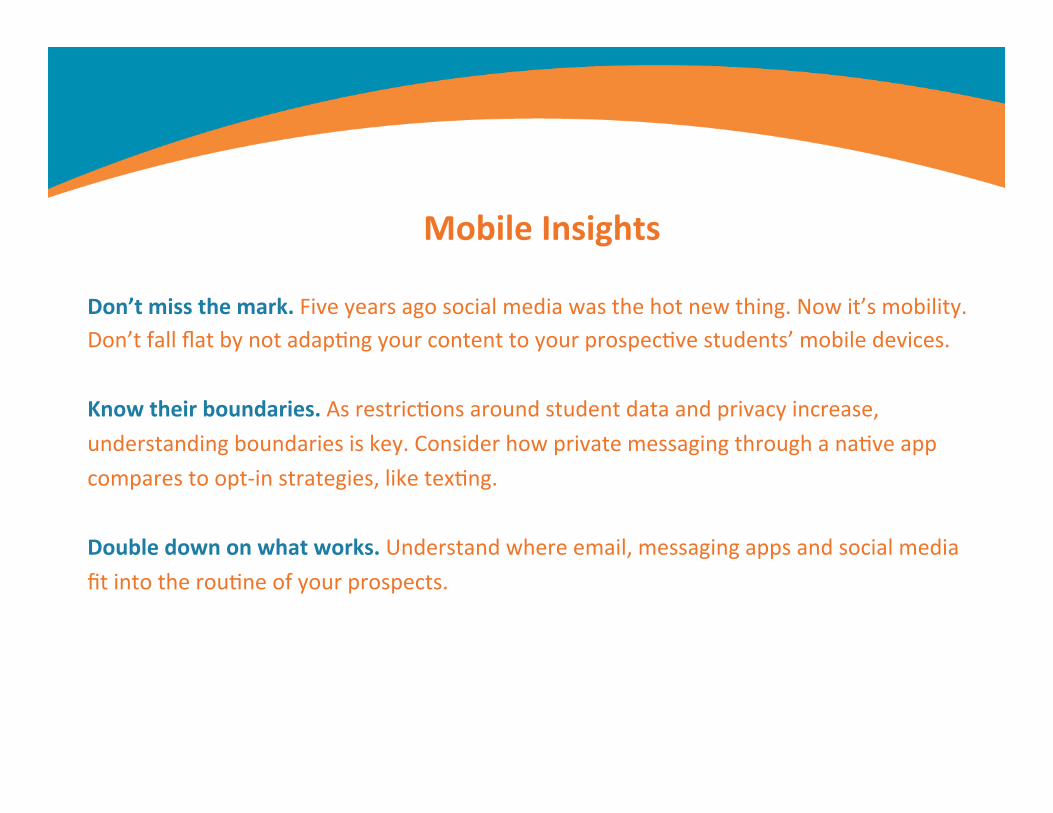
Don’t miss the mark. Five years ago social media was the hot new thing. Now it’s mobility. Don’t fall flat by not adap8ng your content to your prospec8ve students’ mobile devices.
Know their boundaries. As restric8ons around student data and privacy increase, understanding boundaries is key. Consider how private messaging through a na8ve app compares to opt-‐in strategies, like tex8ng.
Double down on what works. Understand where email, messaging apps and social media fit into the rou8ne of your prospects.
Mobile Insights

Digital for Discovery

60% indicated using at least one of these sites
Informa)ve Social
Specialized
nearly
Segmen)ng Digital Tools
Which of the following online resources have you used to research colleges?

87%!81%!
75%!
63%! 60%! 59%!
Information about college (e.g., specific
majors)
Scholarship information
Admissions information
Information about life on campus
College ratings Financial aid
What types of content do you look for on these sites?
Students in Discovery Mode

15%!
19%!
29%!
49%!
26%!
35%!
40%!
35%!
40%!
34%!
27%!
15%!
19%!
7%!
3%!
2%!
0% 10% 20% 30% 40% 50% 60% 70% 80% 90% 100%
Social media sites
Ranking sites (e.g., US News and World Report)
College review and scholarship sites (e.g., Chegg, Niche)
College and university sites
Extremely useful Very useful Somewhat useful Not very useful How useful were the following types of sites during your college research? #socadm16
69% say very to extremely useful
41% say very to extremely useful
Most Useful for College Research
How useful were the following types of sites during your college research?
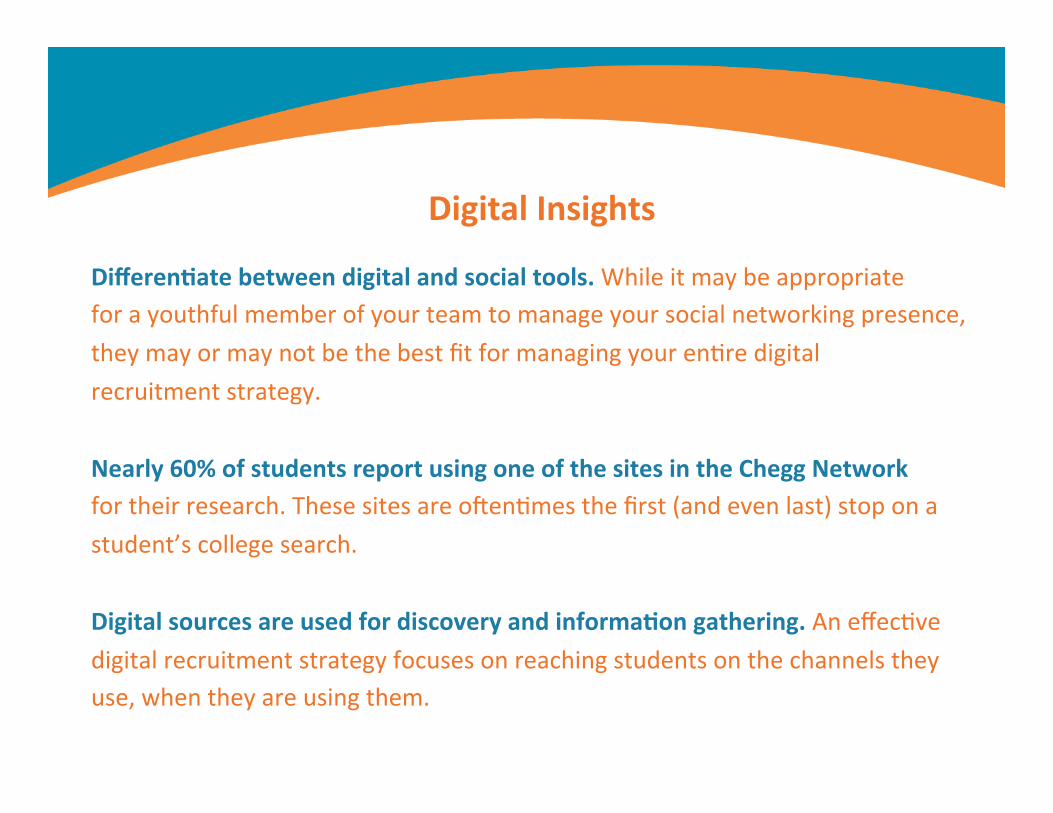
Differen)ate between digital and social tools. While it may be appropriate for a youthful member of your team to manage your social networking presence, they may or may not be the best fit for managing your en8re digital recruitment strategy. Nearly 60% of students report using one of the sites in the Chegg Network for their research. These sites are oaen8mes the first (and even last) stop on a student’s college search. Digital sources are used for discovery and informa)on gathering. An effec8ve digital recruitment strategy focuses on reaching students on the channels they use, when they are using them.
Digital Insights

Social for Decision

8%!
34%!
32%!
56%!
49%!
6%!
9%!
18%!
10%!
15%!
11%!
7%!
10%!
5%!
7%!
13%!
8%!
8%!
4%!
4%!
14%!
9%!
11%!
6%!
6%!
49%!
34%!
21%!
20%!
19%!
0% 10% 20% 30% 40% 50% 60% 70% 80% 90% 100%
Twiier
Snapchat
Mul8ple 8mes a day Once a day Once a week Once a month Every once in a while Never
Frequency of Social Media Usage
How oaen do you use the following social media websites?

48%
87%
51%
31% 33%
64% 63%
82%
54%
37%
26%
81% 80% 79%
66%
51%
39%
Instagram Snapchat Facebook Twiier Pinterest Tumblr
2013 2014 2015
Trended Social Media Usage increased growth by
percentage points
17
Year over year comparison: How oaen do you use the following social media websites?
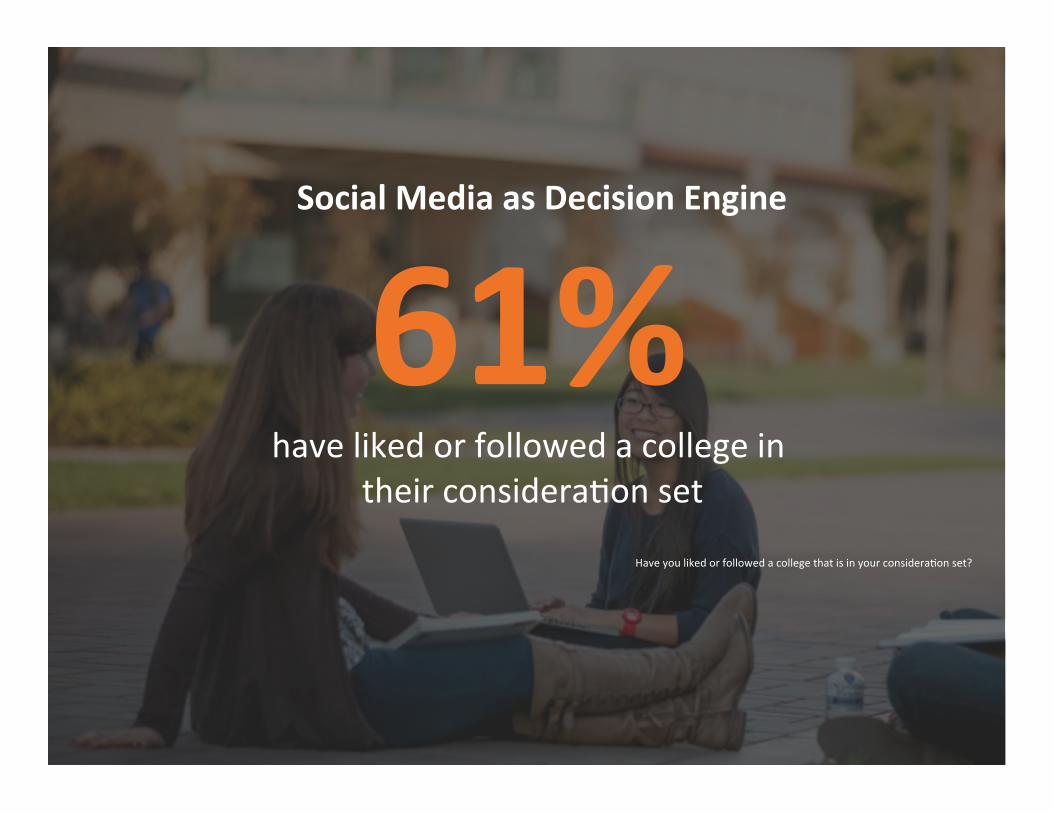
Social Media as Decision Engine
61% have liked or followed a college in
their considera8on set Have you liked or followed a college that is in your considera8on set?

1 in 2 use social media deciding where to enroll
4 in 5 say social media conversa8on influenced
their enrollment decisions
Social Media as Decision Engine

Visual-‐First Apps Used Most
4%!
18%!
16%!
15%!
22%!
14%!
5%!
8%!
11%!
12%!
12%!
11%!
5%!
7%!
9%!
16%!
13%!
14%!
9%!
5%!
7%!
9%!
7%!
13%!
12%!
12%!
15%!
16%!
16%!
19%!
65%!
50%!
42%!
32%!
30%!
29%!
0% 10% 20% 30% 40% 50% 60% 70% 80% 90% 100%
Snapchat
YouTube
Multiple times a day Once a day Once a week Once a month Every once in a while Never
#socadm16
Has used ever: Vine 26%
YikYak 20%
LinkedIn 17%
How oaen do you use the following social media sites during college research?

41%
58%
19%
6%
49%
28%
60%
31%
14%
62%
48%
67%
46%
26% 20%
71% 70% 67%
56%
48%
21%
YouTube Instagram Facebook Twiier Snapchat Pinterest
2012 2013 2014 2015
Increased Growth and Fragmenta)on
1 in 2 use 5+ planorms
Year over year comparison: How oaen do you use the following social media sites during college research?

Social is Mobile: 89% of students access social media on a mobile device. Know your networks: Facebook s8ll isn’t dead, but video and visual-‐first planorms con8nue to gain ground. This age group understands intui8vely how to filter inauthen8c, brand-‐heavy messaging. Make students your story.
Social is fragmented: Students today use mul8ple planorms to find and engage with you and your students on social media. It’s important to priori8ze your 8me accordingly.
Social Insights

Thank you
• Gil Rogers, Chegg, CA • [email protected]
• Brian Niles, TargetX, CA • [email protected]