optimizing material project/presentation name recovery ... · project/presentation name ... case...
TRANSCRIPT

Project/Presentation NameName and title of project manager/presenter
1
ADD DATE
Optimizing Material Recovery FacilitiesMeasuring and Maximizing Sorting Efficiencies
A&WMA and ONEIA 2015 Waste ConferenceBy: Neil Menezes, Reclay StewardEdge Inc.

2
Reclay StewardEdge
� Our principals have over 20 years of experience in the sustainability and recycling field
� Instrumental in the design and implementation of the Blue Box recycling program, in Ontario and worldwide
� We help our clients make bold and strategic decisions to positively impact circular material flows and be at the forefront of change
� Work with municipal and private sector to realize their goals for operating an efficient recycling systems

3
The Changing Recycling Market

4
5
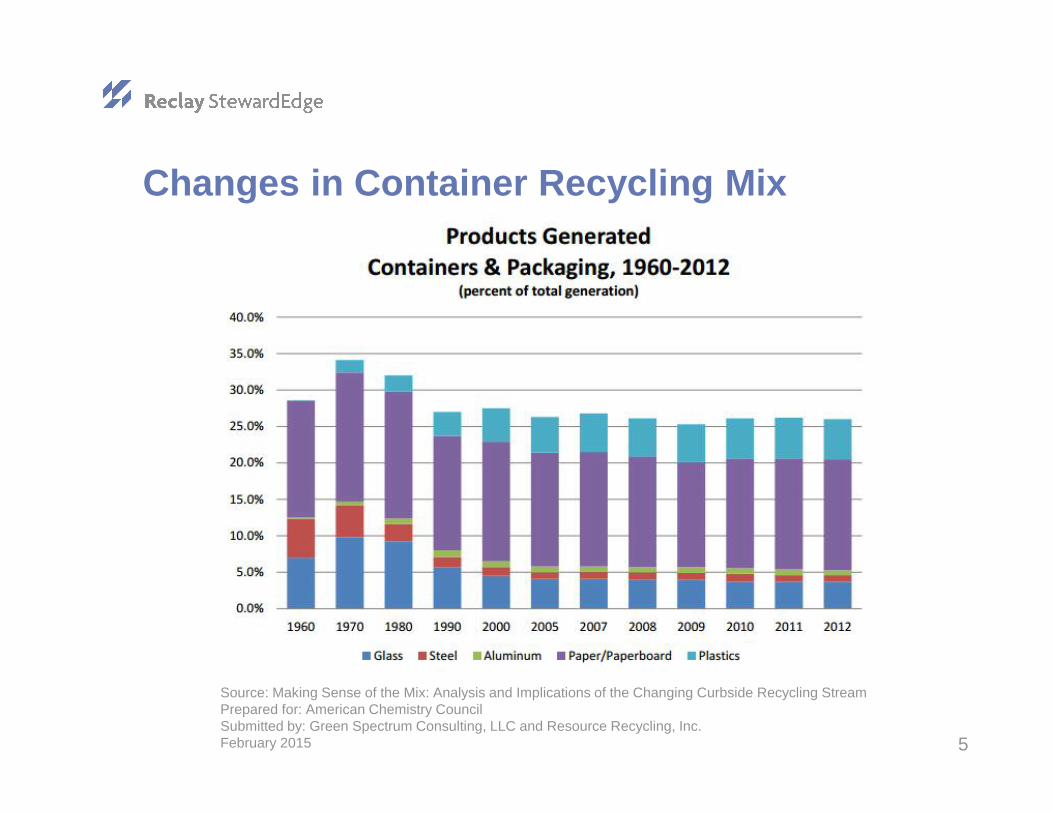
Changes in Container Recycling Mix
Source: Making Sense of the Mix: Analysis and Implications of the Changing Curbside Recycling StreamPrepared for: American Chemistry CouncilSubmitted by: Green Spectrum Consulting, LLC and Resource Recycling, Inc.February 2015

6
Changes in Paper Recycling Mix
Source: Making Sense of the Mix: Analysis and Implications of the Changing Curbside Recycling StreamPrepared for: American Chemistry CouncilSubmitted by: Green Spectrum Consulting, LLC and Resource Recycling, Inc.February 2015

7
Lightweighting of Packaging
Replace original package with lighter weight alternative (e.g. from glass to plastics)
Cut the amount of material used (e.g. thinning of PET bottles and aluminum cans)

8
Example of Lightweighting – Evolution of Laundry Detergent
9
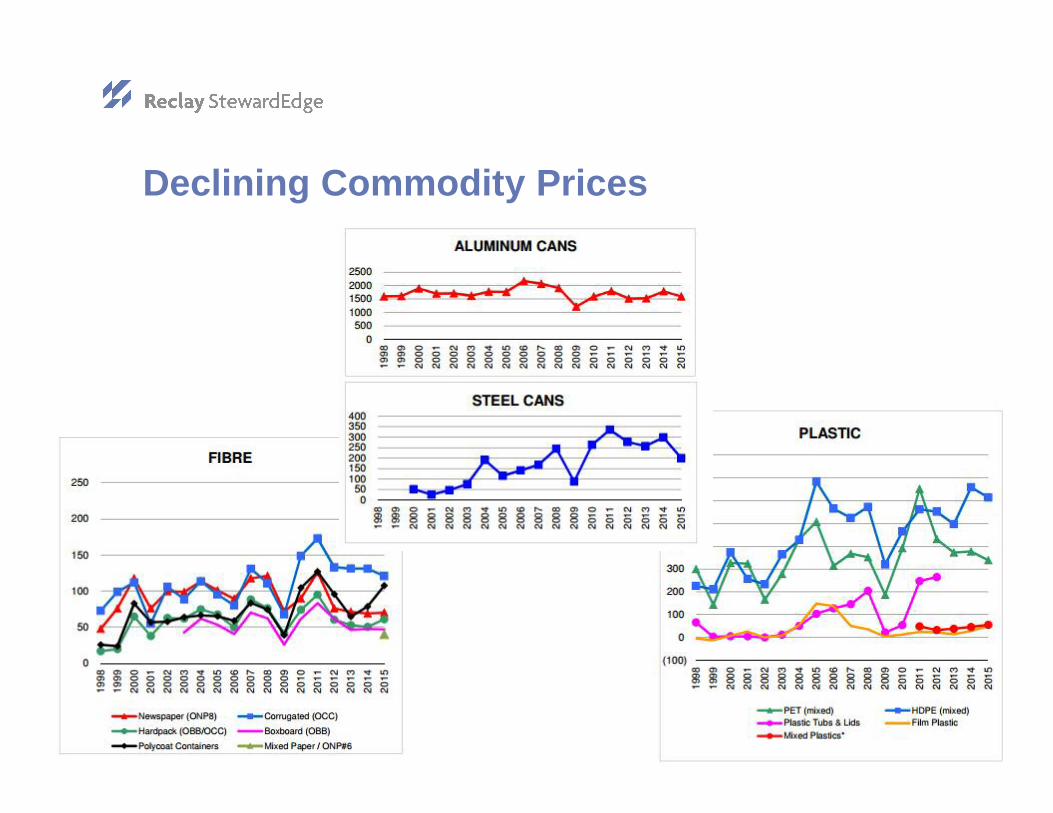
Declining Commodity Prices

10
Green Fence
� Difficult to move loads with slightly higher contamination rates
� Municipalities forced to hire additional sort staff and/or invest in equipment to meet China’s new commodity specifications
0 2 4 6 8 10
2014
2013
2012
2011
2010
2009
China’s Waste Plastic ImportsIn million metric tons

11
Evolving with Recycling Market Changes

12
Current MRF Performance Measure
ResidueONP Aluminum PETInbound
Marketed Materials(Outbound)

13
MRF Optimization� Optimization study evaluates the performance of the entire line, including
all equipment and manual sort stations.
� Includes analysis of:
� Tip floor composition
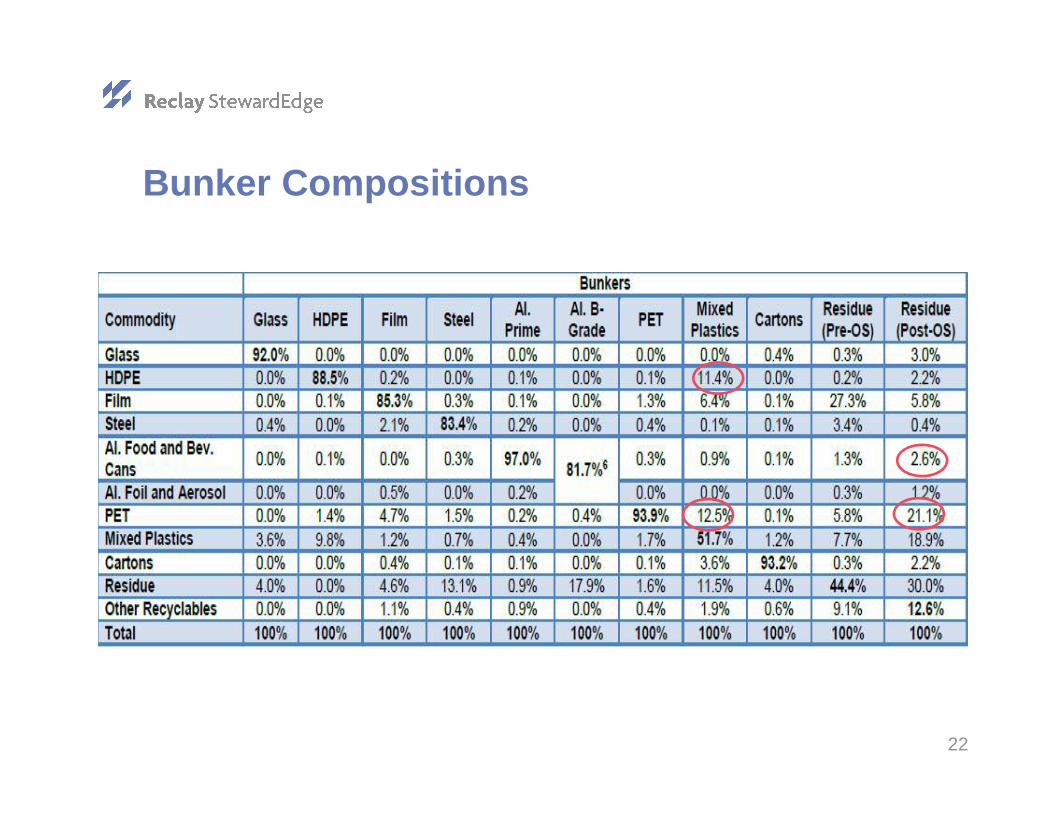
� Bunker composition
� Residue rates
� Efficiency rates
� Purity rates

14
Benefits of MRF Optimization
� Maximize capture rates by pinpointing areas of improvement
� Optimize operating costs and revenues
� Validate the composition of incoming/outgoing materials

15
Case Study: City of Hamilton MRF Optimization

City of Hamilton MRF Optimization Study
� Dual Stream facility processing 45,000 tonnes annually; analysis of container line only
� Project Team consisted of Reclay StewardEdge and Stantec
� Objectives:
� Evaluate performance of container line
� Evaluate performance of glass clean-up system
� Determine value of materials within the post-optical residue
� Provide recommendations on cost and improvement options to enhance efficiency and effectiveness of container line

17
Methodology
Walkthrough of facility

18
Methodology Continued
18
Loading the infeed
Clearing lines before tests Emptying bunkers before tests Tarp to capture glass
Bags to capture material flow Observation point during tests
Collecting and weighing tip floor samples
Sorting material
19
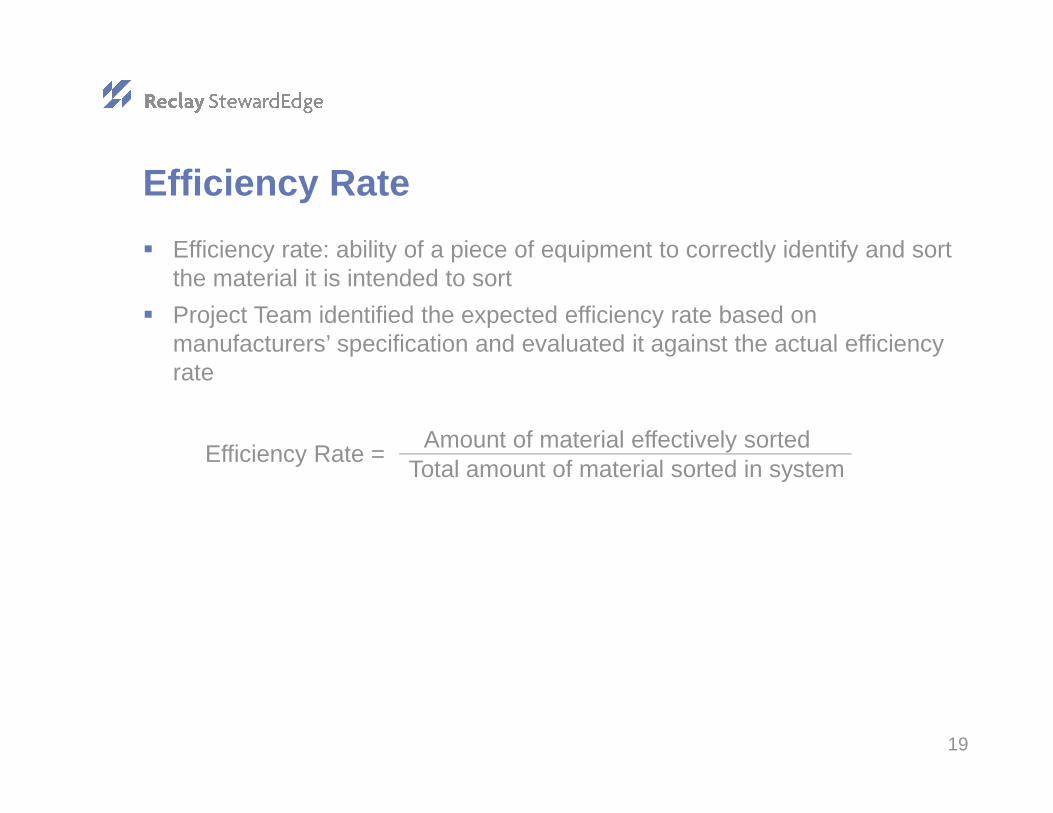
Efficiency Rate
� Efficiency rate: ability of a piece of equipment to correctly identify and sort the material it is intended to sort
� Project Team identified the expected efficiency rate based on manufacturers’ specification and evaluated it against the actual efficiency rate
Amount of material effectively sortedTotal amount of material sorted in system
Efficiency Rate =

20
Purity Rate
� Purity Rate: amount of targeted materials sorted/ejected divided by the total amount of materials sorted/ejected by the equipment
� Equipment with high purity rates that meet market specifications do not need further QC; equipment that does not meet market specifications requires additional QC/sorting prior to being sent to market
Amount of material targeted for ejectionTotal amount of material ejected by equipment
Purity Rate =

21
Inbound Composition (by weight)
22
Bunker Compositions

23
Material Capture Rates

24
City of Hamilton’s Equipment PerformanceEquipment Description/Purpose
Expected Efficiency (%)
Actual Efficiency (%)
Actual Purity (%)
Fine ScreenSeparates glass from inbound material before it reaches main sort line
N/A 98% 85%
ORSE Screen Separates glass from all other light-weight materials 98%
Glass 100% 92%
Other non-glass materials 56% 100%
Eddy Current (Aluminum Station 3)Removes non-ferrous, aluminum containers from the glass/fines
98% 71% 100%
Bag Breaker Large bags Rips bags of sealed recyclables to be reintroduced into the sort line
95% of all bags99% N/A
Bag Breaker Small bags 55% N/A
Film Grabber Removes plastic film from main sort line 30% 0% 0%
Magnet (steel) Food and beverage cansRemoves ferrous metals from main sort line 98%
98%83%
Magnet (steel) Aerosols containers 100%
Eddy Current: Food and beverage cans Removes non-ferrous, aluminum containers from the sort line
98%86%
88%Eddy Current: Foil, trays and aerosols 68%
Optical Sorter
#1 PET bottles, jugs and jars
Dual-eject optical sorter; first eject on PET containers; second eject on mixed plastics & polycoat
90-98%
77%91%
#1 PET thermoforms 84%
Gable top cartons 89%
57%
Aseptic cartons 85%
Ice cream containers 79%
#3 PVC bottles and jars 39%
#4, #5, #6, and #7 rigid plastic packaging
63%

25
City of Hamilton’s Manual Sorting Performance
Sort Station/Target Material Description Efficiency Rate
Manual Sort #1 Positive manual sorts on targeted materialsOversized plastics (5) N/A
Residue (6) 1.4%HDPE (7 & 9) 81.3%
Manual Sort #2 Positive manual sorts on targeted materialsFibre (10) 16.9%
Oversized PET (11) 100%Film (12) 55.8%
Residue (13) 33.7%
Manual Sort Aluminum Quality Control
Aluminum foil, trays and aerosols (16) Positive manual sort on "B" grade aluminum 97.7%Anything but aluminum (17) Positive manual sort on non-aluminum materials 55.2%
Manual Sort Optical Sorter PET Quality Control
Positive manual sorts on targeted materials
Polycoat (18)Gable top cartons 55.0%
Aseptic cartons 31.1%Ice cream containers 66.5%
Residue (19) 24.8%Aluminum cans (20) 41.9%Mixed Plastics (27) 17.7%
Manual Sort Optical Sorter Mixed Plastics/Polycoat Quality Control
Positive manual sorts on targeted materials
Aluminum cans (24) 21.8%Residue (25) 35.9%Polycoat (26)
Gable top cartons 91.9%Aseptic cartons 61.9%
Ice cream containers 56.0%

26
Handling of Plastic Film
Key Findings – Areas for Improvement
� Film is a common problem in MRFs� Wraps around other materials� Impedes the ability of manual and mechanical sort stations to complete
their duties efficiently� This has created a spin-off project to review cost implications for sorting
film through the curbside program as well as alternative collection methods

27
Missed Capture of HDPE Containers
Key Findings – Areas for Improvement
� HDPE is manually sorted at first two manual sorting stations, remaining HDPE ends up in mixed plastics or post-optical residue
� Manual sorters at these stations are also responsible for sorting film� Approximately 20% of HDPE were being missed due to large amounts of
plastic film� It is estimated a loss of $50,000 - $55,000 annually from missed capture of
HDPE

28
Missed Capture of Aluminum Containers
Key Findings – Areas for Improvement
� Majority of materials passing through eddy current are plastics� High burden depth and volumes of material pose a challenge for eddy
current to effectively remove aluminum cans� Estimated loss of $155,000 - $165,000 in revenue from missed aluminum

29
Optical Sorter Configuration
Key Findings – Areas for Improvement
� Optical sorter is over-worked as it is required to sort more than optimal amount of material that passes through it
� Dual-eject optical sorters generally have lower efficiency rates as materials ejected by the second valve are 1/3 as effective as the first valve.
� Estimated loss of $150,000 for missed PET, mixed plastics & polycoat

30
Optical Sorter Residue
Key Findings – Areas for Improvement
� Study determined actual residue accounts for about 30% of the post-optical residue stream
� Almost 9% aluminum cans, 21% PET containers, 27% mixed plastics� If the City were to capture these materials, it could achieve a net benefit of
$53,000
Steel container
Mixed plastics
PET bottles
Post-optical Sorter Residue

31
Recommendations
� Evaluate Alternative Methods for Managing Plastic Film
� Recommended the City conduct a cost-benefit analysis of collecting plastic film from curbside program vs. other collection alternatives
� Repurpose Existing Optical Sorter and Add Second Optical
� Second optical sorter will alleviate some of the burden at the front-end manual stations (e.g.: HDPE)

32
Summary
� Inbound materials have changed drastically since many MRFs have been constructed
� Depending on the age of the facility, it may be difficult to retrofit buildings
� Conducting a mass balance of only tip-floor audits and outbound tonnages provide good information, but don’t show the full picture
� MRF Optimization studies can be used to:
� Improve efficiencies
� Lower operational costs
� Increase revenue
� Reduce supply chain risk

Thank you!
Neil Menezes26 Wellington Street East, Ste. 601,Toronto, ON M5E 1S2Phone: 416-644-8349E-Mail [email protected]