optimization of wireless access point placement in realistic urban heterogeneous...
TRANSCRIPT
Optimization of Wireless Access Point Placement in
Realistic Urban Heterogeneous Networks
Yicheng Lin and Wei Yu
Department of Electrical and Computer Engineering
University of Toronto, Toronto, Ontario, Canada
Email: {ylin, weiyu}@comm.utoronto.ca
Yves Lostanlen
Wireless Expertise and Research Centre
Siradel American Office, Toronto, Ontario, Canada
Email: [email protected]
Abstract—The placement of the access points (APs) has asignificant impact on the wireless system performance, especiallyfor irregular heterogeneous networks with hierarchical APs suchas macro/micro base-stations, pico-stations, and femto-stations.Traditional system modeling and optimization are based on theregular 2D hexagonal cellular topology and a set of predefinedlarge-scale propagation models, which is highly abstract and maybe inaccurate. This paper considers the AP placement optimiza-tion problem in realistic deployment environments, where radio-wave propagation characteristics are accurately modeled usingray-tracing techniques. Toward this end, this paper proposesa novel concept of area proportional fairness utility for theentire network under a given user geographic distribution, andproposes an iterative method to optimize the placement of theAPs for utility improvement while taking into account the mutualinterference between the APs. The significant benefit of theplacement optimization is shown in a numerical experimentconducted in a realistic Chicago downtown topology, whereplacement optimization is shown to improve the sum rate byup to 40%.
I. INTRODUCTION
Future wireless networks are characterized by ubiquitous
coverage and significantly higher data rates in comparison
to the current conventionally deployed cellular networks. To
achieve this goal, wireless operators are increasingly augment-
ing the traditional regular planned hexagonal wireless cellular
topology with irregular heterogeneous infrastructure which
may include hierarchical access points (APs), such as micro-,
pico-, femto-, and relay-stations in addition to the conventional
macro base-stations [1], [2]. In doing so, the wireless service
providers are now facing new challenges in configuring such
a multi-tier topology and in optimizing the placement of these
lower-power nodes in realistic deployment scenarios.
Several issues need to be considered when planning for the
deployment of the APs. In a dense urban area with various
of artificial and natural structures (e.g., buildings, vegetation),
the distance-dependent wireless signal attenuation law is no
longer accurate because of the reflection and diffraction of the
transmitted signals. Second, the average user traffic varies in
different area, thus different levels of coverage are required
in different parts of the network. In addition, the APs are
typically deployed with maximal frequency reuse, so the place-
ment of APs greatly affect the mutual inter-node interference.
A good AP placement strategy must consider all the above
factors. The optimal placement of APs is expected to have a
significant impact on the overall performance of the network.
This paper addresses the AP placement optimization prob-
lem for the heterogenous network, and makes two main
contributions to the state-of-the-art. First, this paper proposes
a network utility metric that takes into account both the user
geographical distribution throughout the network and the fair
allocation of radio resources among the users. The proposed
concept of area proportional fairness utility is easily com-
putable, and can therefore be used as the objective function of
an iterative method for AP placement optimization. Second,
this paper utilizes realistic channel models obtained via an
accurate 3D ray-tracing characterization of electromagnetic
wave propagation. These models allow the effectiveness of
AP placement optimization to be quantified in an actual
deployment, while accounting for the mutual interference
between the APs. Using an actual urban propagation model
in downtown Chicago, the simulation results of this paper
show that significant improvements in both the throughput
and network utility can be obtained with intelligent placement
of APs in a heterogenous network. To the best of authors’
knowledge, this is the first concrete characterization of the
benefit of AP placement optimization in a realistic scenario.
The site placement problem has been studied for many
different scenarios in the literature, e.g., the distributed antenna
systems (DAS) [3], [4], [5], the wireless relay networks
[6], [7], [8], and the wireless sensor networks (WSN) [9],
[10], [11]. Some of these studies on site placement impose
restrictions on the network topology, e.g., linear cell structure
[3], even site deployment on a circle [4], identical relative site
positions in each cell [5], which, although make the model
amendable to algorithmic development, are not realistic in
practices. In particular, in [6], [7], [8], [11], relays cannot be
placed anywhere but in a set of pre-defined candidate positions
due to physical restrictions, which results in integer constraints
on the location parameter. The present paper formulates a
more general problem where the APs can be placed anywhere
within the considered area, (although our algorithm can also
be applied to the case where restrictions to candidate positions
are imposed).
In the site placement literature for WSN (e.g., [9], [10],
[11]), a common assumption is that the relay and base-station
nodes are deployed in proper locations for aggregation and
fusion of the data, which are captured by sensor nodes with
Globecom 2012 - Wireless Communications Symposium
978-1-4673-0921-9/12/$31.00 ©2012 IEEE 5185

macro
pico
user
macro
pico
pico
user
user
user
user
user
user
Fig. 1. An example of heterogeneous network
fixed locations throughout the designated area. This is in
contrast to the wireless access network model considered in
the present paper, where users are not fixed (due to mobility),
thus the AP site locations need to be optimized for the given
user distribution.
Finally, almost all existing works (with an exception of [5])
ignore inter-node interferences by either assuming a noise-
limited environment or frequency reuse. In contrast, this paper
assumes maximal reuse of resources among the APs in a
dense urban scenario. This is a crucial consideration which
significantly affects the interference pattern and therefore the
optimal placement of APs in the network.
The AP placement problem can be formulated with various
objectives (e.g., capacity enhancement, network lifetime max-
imization, power minimization, node number minimization).
This paper proposes to use an area proportional fairness
utility as the optimization objective function for the placement
problem, which is defined in accordance with the standard
fairness criterion used for resource allocation and scheduling.
The area proportional fairness utility is a function of the
users distribution, the transmitter spatial location, and the
propagation environment. The computation of this utility can
be facilitated by constructing a quantized grid in the con-
sidered area with sufficient resolution, where the radio-wave
propagation from any AP to the test points in the grid can be
computed in a deterministic way using ray-tracing prediction
software such as the Volcano Lab [12]. We propose to optimize
the placement of the APs from a given initial spatial locations
to improve the utility in an iterative manner.
This rest of the paper is organized as follows. The general
AP placement problem is formulated in Section II, where the
concept of area proportional fairness utility is proposed and a
quantized grid model is used to approximate and facilitate the
computation of such utility in a realistic scenario. In Section
III, an iterative algorithm is proposed to optimize the AP
spatial locations. Results of numerical experiment are given
in Section IV and conclusion is drawn in Section V.
II. SYSTEM MODEL AND PROBLEM FORMULATION
Fig. 1 shows a two-tiered wireless heterogeneous network,
where multiple macro-stations and pico-stations are deployed
within the area to serve their designated users. Both the macro-
and pico-stations have dedicated backhauls and signaling chan-
nels so that they can handle independent traffic, but may have
different level of power and height and thus different coverage
areas. From the operators’ point of view, macro-stations are
more regularly deployed to provide a basic ubiquitous cover-
age, and pico-stations may be irregularly deployed to extend
coverage and further boost the system capacity.
A. Area Proportional Fairness Utility
For a fixed set of AP placement, we would like to quantify
the performance of the network using a network-wide utility
function that takes into account both the user density and fair
allocation of resources. Toward this goal, we define an area
proportional fairness utility as follows.
Denote the considered area as S, and the number of APs
and mobile users within this area as K and M , respectively.
The total available resource blocks (e.g., frequency and time)
for AP k is Nk. Each user is associated with one AP according
to a maximum received power metric. Thus the covered zone
of AP k ∈ {1, ..., K}, denoted as Sk ⊂ S, has an area of
|Sk| =
∫∫
S
1
(
P(x,y)k > P
(x,y)l,∀l 6=k
)
dxdy (1)
where 1(·) is the indicator function, and P(x,y)k is the measured
received power from AP k at the coordinate (x, y). Note that
P(x,y)k corresponds to the narrow-band response containing
only the large-scale fading components (pathloss and shadow-
ing). At the coordinate (x, y) which is covered by AP k, the
average signal-to-interference ratio (SIR) can be approximated
as follows (ignoring the noise):
η(x,y)k =
P(x,y)k
∑
l 6=k P(x,y)l
(2)
Let δ(x,y) be the density of 2D user distribution at coordinate
(x, y). The average number of users covered by AP k can be
computed as:
Mk =
∫∫
Sk
δ(x,y)dxdy
=
∫∫
S
1
(
P(x,y)k > P
(x,y)l,∀l 6=k
)
δ(x,y)dxdy (3)
For uniform user distribution, the number of associated users
of any AP is proportional to its coverage, i.e., Mk ∝ |Sk|.To ensure that each user has a fair allocation of resources,
we now assume all the associated users for a particular AP
to have the same channel access probability, i.e., each AP
allocates equal resources Nk/Mk to each of its users. This
can be achieved for example by round-robin scheduling. This
is also valid for proportional fairness scheduling if users have
homogeneous small-scale fading statistics [13].
In a fully reused network where Nk = N , ∀k, we normalize
the per-user resource to be 1/Mk, and define the density of
utility at the coordinate (x, y) covered by the AP k as the
logarithm of the normalized average user rate:
U(x,y)k = δ(x,y) log
{
1
Mk
log2
(
1 + η(x,y)k /Γ
)
}
(4)
5186

where Γ = − ln (5BER) /1.5 is the SNR gap. The total area
proportional fairness utility is then:
U =∑
kUk =
∑
k
∫∫
Sk
U(x,y)k dxdy
=∑
k
∫∫
S
1
(
P(x,y)k > P
(x,y)l,∀l 6=k
)
δ(x,y)
× log
{
1
Mk
log2
(
1 + η(x,y)k /Γ
)
}
dxdy. (5)
This utility captures the performance of the entire network
under standard fairness scheduling criterion. The main idea of
this paper is that this utility is a function of the AP spatial
locations, can thus be used for the optimization of the AP
placement.
B. Realistic Propagation Modeling in Urban Scenario
For a given user density distribution, the network utility
(5), which is based on (2) and (3), is only a function of
the narrow-band received power P(x,y)k . In traditional wireless
propagation models, the received power can be computed from
pathloss and shadowing models given the transmitter location
and power. The pathloss and shadowing models, however,
can be highly inaccurate in actual urban deployments, where
reflection and diffraction of the signals have significant impact.
This paper adopts a much more realistic ray-tracing-based
multipath radio-wave propagation model based on real-world
geographic information. Such models are indispensable in the
proper optimization of AP placement.
We have conducted an experimental measurement of the
realistic received power map in the Chicago downtown envi-
ronment, as is shown in Fig. 2. The black hexagonal edges are
the imaginary cell borders. The blocks model different types
of urban structures (e.g., building, bridge), each with distinct
physical attenuation properties. Each structure is characterized
by a polygon and its associated height information. Macro-
stations are deployed outdoors in regular hexagonal grid
points, which can be either at the street level or at a rooftop.
The 3D transmit radiation pattern is used. The colors represent
the maximum received signal power in dBm (from one of the
macro-stations) on each pixel of the map at a height of 1.5
meters. It is observed that the greater received signal strength
can be found on the streets, while the receivers within the
structures experience low power due to the penetration loss.
C. A Quantized Grid Approach
To enable the calculation of the area proportional fair-
ness utility (5), we quantize the 2D receiver area S into a
rectangular grid of test points. Each test point represents a
possible receiver location, for which the radio propagation
characteristics can be computed. For each AP, we can compute
the propagation from its transmitter to this defined area. For
each test point in the grid, measurements from all K APs can
then be collected. In practice, the measurements from each AP
can be stored in a matrix, with entries corresponding to the test
points in the grid. For the K APs, a total of K matrices (with
the same dimension if all APs have the same receiver area S
Fig. 2. The received signal power (dBm) in the Chicago downtown, wherethe x- and y-coordinates are measured in meters.
and quantization resolution) can be formed. The measurements
can be:
• Narrow-band received power which contains all the large-
scale fading effect, i.e., pathloss and shadowing, but
combines all the signals coming from different paths;
• Wide-band response which contains the frequency-
selective fading. This is computed by the ray-tracing
techniques considering the reflection and diffraction of
the signal in a realistic urban environment.
In this paper, the area proportional fairness utility is computed
as a function of the narrow-band received power. Subsequently,
wide-band response is used for throughput evaluation.
If the coordinate (x, y) is quantized with index (i, j), the
received power from AP k at this coordinate is efficiently
computed as P(i,j)k , and similarly for the SIR η
(i,j)k , the utility
density U(i,j)k , and the user density δ(i,j) = δ(x,y)s2, where s
is the width of the grid pixels. The area proportional fairness
utility (5) can now be rewritten as:
U =∑
k
∑
(i,j)∈Sk
δ(i,j) log
log2
(
1 + η(i,j)k /Γ
)
∑
(i,j)∈Skδ(i,j)
(6)
where Sk is the quantized coverage of the AP k:
Sk ={
(i, j)|P(i,j)k > P
(i,j)l,∀l 6=k
}
(7)
In the next section, we develop an algorithm to deploy the
APs at places to optimize the above utility.
III. UTILITY BASED AP PLACEMENT
With a fixed radiation pattern, power, and geographical
information, the area proportional fairness utility is determined
by the spatial locations of the APs. The spatial location
Lk = (xk, yk, zk) contains both the 2D coordinates and the
5187

height information zk of the transmitter. In this paper, we
consider outdoor transmitters which can be either tower-based
or rooftop-based. We set the reference height H(x,y)ref for any
coordinate (x, y) to be either 0 if it is not within any structure,
or the height of the highest structure covering that coordinate.
The height of the AP k at coordinate (xk, yk) is set as:
zk = max(
Htower, H(xk,yk)ref + Hrooftop
)
(8)
where Htower is the absolute height of the AP transmitter if
it is tower-based, and Hrooftop is the relative height of the
transmitter above the rooftop of the structure it overlaps.
Equation (8) guarantees that the transmitter is placed at least
Hrooftop meters higher than the rooftop, and is at least higher
than the absolute tower height Htower. Note that the APs can
be placed at arbitrarily coordinates and are not limited to the
quantized test points.
We propose to iteratively adjust the spatial location of the
APs, ensuring that each step of the algorithm improves the
area proportional fairness utility. The algorithm starts at some
initial AP placement which are planned by the operator, and
proceeds sequentially and repeatedly for all the APs within
the considered area, where the AP is updated to a neighboring
candidate location each time. The iteration terminates until no
further utility improvement can be found.
To compute the area proportional fairness utility (6), we
need to first compute all the received power matrices over
the considered area for all the APs given a set of input
parameters. Algorithm 1 summarizes the procedure to obtain
such a received power matrix along with the spatial location
of a AP k.
Algorithm 1: Compute the spatial location Lk and the
received power matrix Pk for the AP k with coordinate
(xk, yk).
1) Find the reference height H(xk,yk)ref of the coordinate
(xk, yk) by first determining whether it is within any of
the structures defined by polygons. This is a 2D point-in-
polygon (PIP) problem. Given the vertex coordinates of a
polygon, the PIP problem can be efficiently solved by the
ray-intersection algorithm [14] with a time complexity in
the order of the number of edges of that polygon.
2) Set the height zk of the AP k as in (8).
3) Use ray-tracing techniques to compute the received power
matrix Pk =[
P(i,j)k
]
i,jfor the AP k over the test points
(i, j) ∈ S with the spatial location Lk = (xk, yk, zk).
Using the received power matrices from Algorithm 1, the
initial utility can now be computed as in (6) and expressed as
a function of the AP spatial locations, U (L1...Lk...LK). The
iterative placement optimization algorithm can now be carried
out as in Algorithm 2 below.
Algorithm 2: Iterative placement optimization of the APs
with initial spatial location L1...LK .
1) Fixing the spatial locations of all other APs l 6= k at the
current stage and compute their power matrix Pl, do the
following for the AP k:
a) Search for V candidate neighboring coordinates(
x(v)k , y
(v)k
)
, 1 ≤ v ≤ V , around the current coordinate
(xk, yk) within a given radius.
b) Follow Algorithm 1 to get the spatial location L(v)k and
the power matrix P(v)k for each candidate coordinate.
c) For each candidate v, compute the area proportional
fairness utility U(
L1...L(v)k ...LK
)
as in (6).
d) Update the AP k to the candidate spatial location
Lk = L(v̂)k with maximal positive utility increment v̂ =
argmaxv
{
U(
L1...L(v)k ...LK
)
− U (L1...Lk...LK)}
.
2) Turn to the AP k + 1 for placement optimization by
repeating the above steps. Return to AP 1 after AP K .
Terminate the algorithm when no further positive utility
improvement can be found for all APs.
The above procedure is essentially greedy, with complexity
scaled as O(KV ) in each iteration. Physical constraints should
be imposed such that the APs are not put at any infeasible
places, e.g., inside a river. No lower bound on the inter-
node distance [11] is needed since the enlarged interference
would decrease the utility and thus repel the nodes from
being too close to each other. In practice, due to the limited
3D geographical information and the computational burden,
the total coverage of a wireless service provider should be
partitioned into computable clusters. The algorithm is off-line
and needs only to be implemented once for a given topology
and user distribution.
IV. NUMERICAL EXPERIMENT
In this section, we optimize the AP placement using the
proposed algorithm in a Chicago downtown deployment as in
Fig. 2 with an inter-site distance about 500m, corresponding
to the typical dense urban scenario with about 21 hexagonal
sectors. The carrier frequency is 2GHz. The receiver area Smeasured for all APs is rectangular with dimension 600m
by 550m, containing the central three sectors in Fig. 2.
The APs outside this area are not considered for placement
optimization, but nevertheless generate an interference pattern.
The grid has a 5m quantization resolution, i.e., s = 5. The
receiver height at each test point is set to be 1.5 meters,
which is the height of typical pedestrian’s phone. We assume
that regular macro-stations have already been deployed with
directional 3D antenna and 46dBm transmit power, whereas
the omni pico-stations with 30dBm power are to be placed
to further enhance the system performance. Initially, the pico-
stations are placed evenly on a circle which is 2/3 radius away
from the macro-station in each cell. The height of macro and
pico-stations are set to:
zk =
max(
32, H(xk,yk)ref + 2
)
for macro (9a)
max(
5, H(xk,yk)ref + 1
)
for pico (9b)
For simplicity, the user distribution density is assumed to be
a unit constant in our evaluation, i.e., δ(i,j) = 1.
5188
(a)
(b)
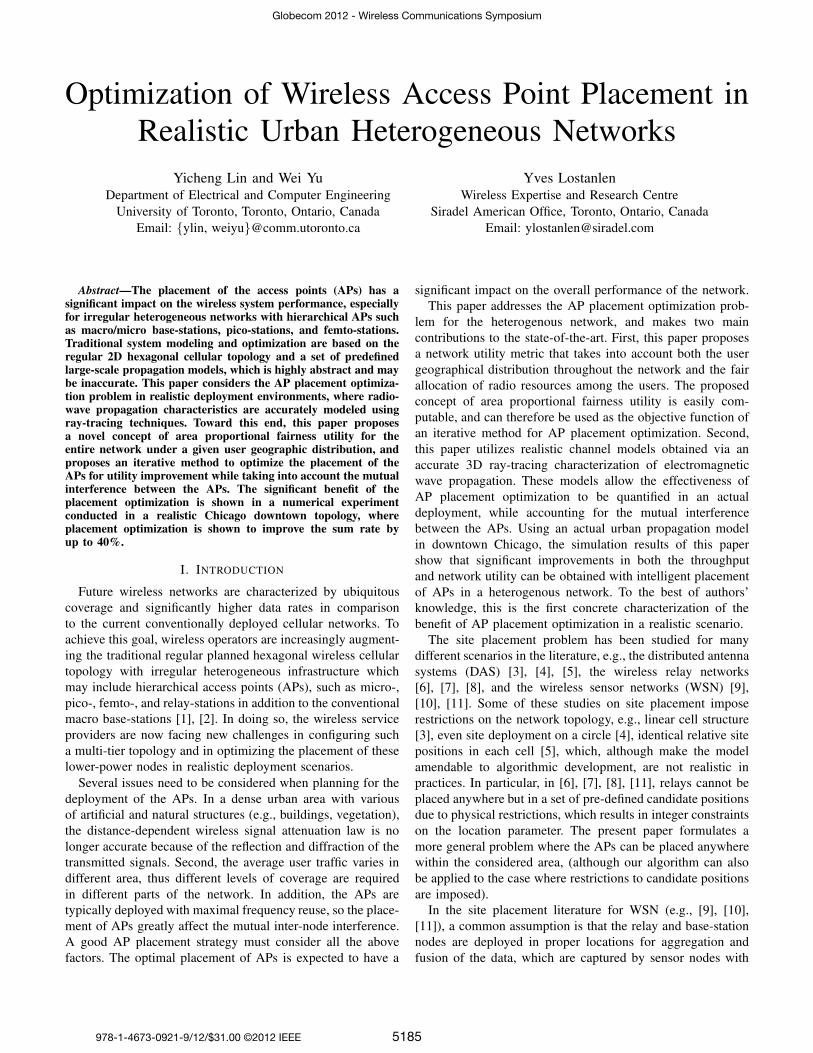
Fig. 3. The trajectory of the pico-stations during the optimization process,where the solid black dots are the final placement of the pico-stations. (a) 1pico-station per sector. (b) 2 pico-stations per sector.
A. The Trajectory of the Access Points
We adopt the following approach in our experiment for step
1a) of Algorithm 2. Each AP searches on a circle with radius
t = 5m from its current coordinate with 8 evenly distributed
directions to find V = 8 candidate neighboring coordinates.
Follow steps 1b) to 1d) to find a candidate spatial location to
update. If no positive utility increment can be found, increase
the search radius t by 5m each time up to 30m, and repeat
step 1a) to 1d) again until positive utility can be found.
Fig. 3 shows the trajectory of the pico-stations within the
placement optimization process. The solid black dots are the
final placement of pico-stations. The color bar represents the
received power from macro-stations (in dBm). It is interesting
0 10 20 30 40 50 60 70 80 90
−6.6
−6.5
−6.4
−6.3
−6.2
−6.1
x 104
Number of Iterations
Are
a P
rop
ort
ion
al F
airn
ess U
tilit
y
1−pico/sector
2−pico/sector
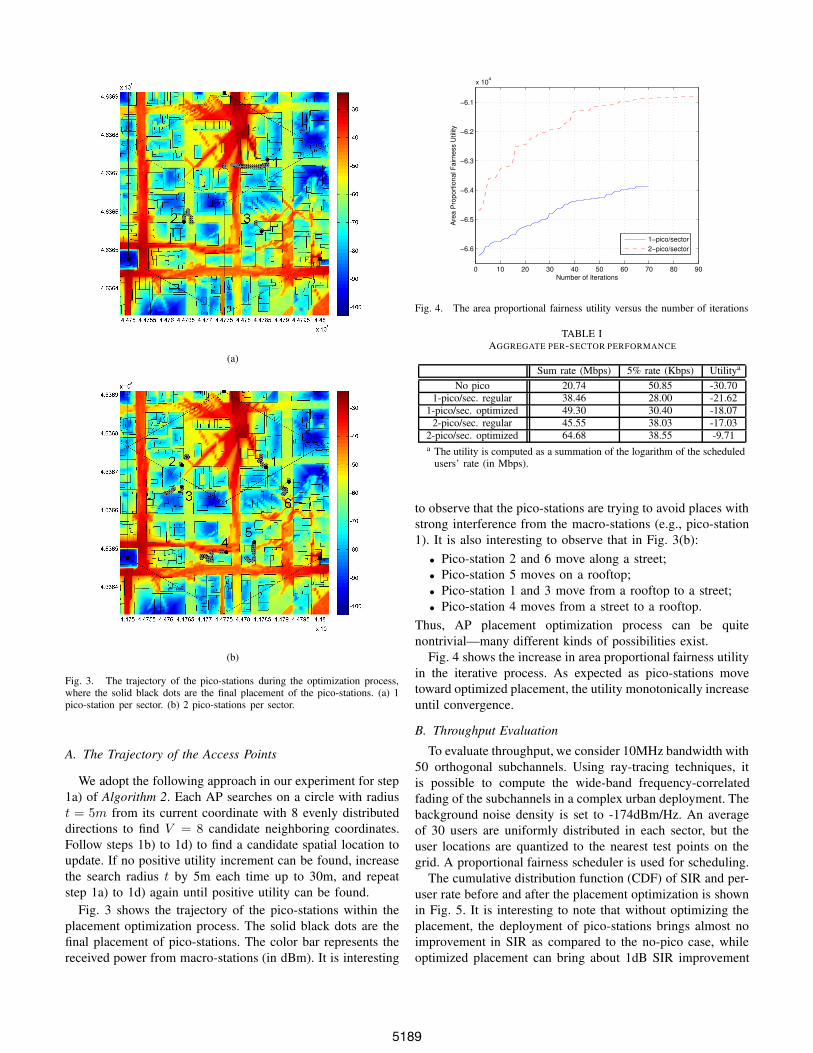
Fig. 4. The area proportional fairness utility versus the number of iterations
TABLE IAGGREGATE PER-SECTOR PERFORMANCE
Sum rate (Mbps) 5% rate (Kbps) Utilitya
No pico 20.74 50.85 -30.70
1-pico/sec. regular 38.46 28.00 -21.62
1-pico/sec. optimized 49.30 30.40 -18.07
2-pico/sec. regular 45.55 38.03 -17.03
2-pico/sec. optimized 64.68 38.55 -9.71
a The utility is computed as a summation of the logarithm of the scheduledusers’ rate (in Mbps).
to observe that the pico-stations are trying to avoid places with
strong interference from the macro-stations (e.g., pico-station
1). It is also interesting to observe that in Fig. 3(b):
• Pico-station 2 and 6 move along a street;
• Pico-station 5 moves on a rooftop;
• Pico-station 1 and 3 move from a rooftop to a street;
• Pico-station 4 moves from a street to a rooftop.
Thus, AP placement optimization process can be quite
nontrivial—many different kinds of possibilities exist.
Fig. 4 shows the increase in area proportional fairness utility
in the iterative process. As expected as pico-stations move
toward optimized placement, the utility monotonically increase
until convergence.
B. Throughput Evaluation
To evaluate throughput, we consider 10MHz bandwidth with
50 orthogonal subchannels. Using ray-tracing techniques, it
is possible to compute the wide-band frequency-correlated
fading of the subchannels in a complex urban deployment. The
background noise density is set to -174dBm/Hz. An average
of 30 users are uniformly distributed in each sector, but the
user locations are quantized to the nearest test points on the
grid. A proportional fairness scheduler is used for scheduling.
The cumulative distribution function (CDF) of SIR and per-
user rate before and after the placement optimization is shown
in Fig. 5. It is interesting to note that without optimizing the
placement, the deployment of pico-stations brings almost no
improvement in SIR as compared to the no-pico case, while
optimized placement can bring about 1dB SIR improvement
5189

-5 0 5 10 15 20 250.0
0.1
0.2
0.3
0.4
0.5
0.6
0.7
0.8
0.9
1.0C
umul
ativ
e D
istri
butio
n Fu
nctio
n
Signal-to-Interference Ratio (dB)
no pico 1-pico/sector regular 1-pico/sector optimized 2-pico/sector regular 2-pico/sector optimized
(a)
0 1 2 3 4 50.0
0.1
0.2
0.3
0.4
0.5
0.6
0.7
0.8
0.9
1.0
Cum
ulat
ive
Dis
tribu
tion
Func
tion
Per-User Rate (Mbps)
no pico 1-pico/sector regular 1-pico/sector optimized 2-pico/sector regular 2-pico/sector optimized
(b)
Fig. 5. The cumulative distribution function (CDF) before and after the AP placement optimization. (a) Signal-to-interference ratio (SIR). (b) Per-user rate.
at the 50% range. Thus, without placement optimization, the
benefit of pico-cell deployment comes solely from the fact
that pico-stations offload users from the macro-station, thus
each user gets proportionally more resources. Note that after
the placement optimization, the 1-pico/sector case actually
has better SIR than 2-pico/sector case. This is because more
interference is present in a network with more pico-stations
deployed. Differing from the SIR case, the deployment of 1
or more pico-sites per sector has a positive impact on the rates.
Fig. 5(b) shows that significant improvement in terms of the
user-rate CDF can be obtained from placement optimization.
The aggregate per-sector performance in listed in Table I
further confirms the importance of the AP placement. The
utility here is the conventional proportional fairness metric,
computed with the average transmitted user rates. With opti-
mized placement, the sum rate can be improved by about 28%
and 40% for 1-pico/sector and 2-pico/sector case, respectively.
Note that the cell edge 5% rate actually decreases when pico-
stations are added to the network. This is due to the rise in
interference when pico-stations are deployed. The proposed
algorithm alleviates the cell edge deterioration.
V. CONCLUSIONS
This paper considers the AP placement optimization prob-
lem for irregular heterogeneous wireless networks. We show
that geographical information and 3D ray-tracing techniques
are necessary for realistic evaluation of the heterogeneous
network performance, and that placement optimization can
bring significant benefit to the overall network performance,
improving the sum rate by 40% in a realistic urban envi-
ronment. The key ingredients of the proposed approach are
an accurate radio propagation model integrating geographical
structures and 3D spatial locations for the APs, a novel concept
of area proportional fairness utility that accounts for both
user distribution and fair resource allocation, and an iterative
algorithm for optimizing the spatial locations of the AP based
on the proposed utility function while accounting for mutual
interference.
REFERENCES
[1] A. Khandekar, N. Bhushan, J. Tingfang, and V. Vanghi, “LTE-Advanced:Heterogeneous networks,” in Proc. European Wireless Conf., Apr. 2010,pp. 978–982.
[2] S. Parkvall, A. Furuskar, and E. Dahlman, “Evolution of LTE towardIMT-Advanced,” IEEE Commun. Magazine, vol. 49, no. 2, pp. 84–91,Feb. 2011.
[3] Y. Shen, Y. Tang, T. Kong, and S. Shao, “Optimal antenna location forstbc-ofdm downlink with distributed transmit antennas in linear cells,”IEEE Commun. Lett., vol. 11, no. 5, pp. 387–389, May 2007.
[4] X. Wang, P. Zhu, and M. Chen, “Antenna location design for generalizeddistributed antenna systems,” IEEE Commun. Lett., vol. 13, no. 5, pp.315–317, May 2009.
[5] S. Firouzabadi and A. Goldsmith, “Downlink performance and capacityof distributed antenna systems,” Arxiv preprint arXiv:1109.2957, 2011.
[6] A. So and B. Liang, “Enhancing wlan capacity by strategic placementof tetherless relay points,” IEEE Trans. Mobile Comput., vol. 6, no. 5,pp. 522–535, May 2007.
[7] B. Lin, P. Ho, L. Xie, X. Shen, and J. Tapolcai, “Optimal relay stationplacement in broadband wireless access networks,” IEEE Trans. Mobile
Comput., vol. 9, no. 2, pp. 259–269, Feb. 2010.[8] H. Lu, W. Liao, and F. Lin, “Relay station placement strategy in IEEE
802.16j WiMAX networks,” IEEE Trans. on Commun., vol. 59, no. 1,pp. 151–158, Jan. 2011.
[9] J. Pan, L. Cai, Y. Hou, Y. Shi, and S. Shen, “Optimal base-stationlocations in two-tiered wireless sensor networks,” IEEE Trans. Mobile
Comput., vol. 4, no. 5, pp. 458–473, Sept. 2005.[10] Y. Hou, Y. Shi, H. Sherali, and S. Midkiff, “On energy provisioning
and relay node placement for wireless sensor networks,” IEEE Trans.
Wireless Commun., vol. 4, no. 5, pp. 2579–2590, Sept. 2005.[11] D. Yang, S. Misra, X. Fang, G. Xue, and J. Zhang, “Two-tiered
constrained relay node placement in wireless sensor networks: Compu-tational complexity and efficient approximations,” IEEE Trans. Mobile
Comput., no. 99, pp. 1–14, Jun. 2011.[12] Y. Corre and Y. Lostanlen, “Three-dimensional urban EM wave prop-
agation model for radio network planning and optimization over largeareas,” IEEE Trans. Veh. Technol., vol. 58, no. 7, pp. 3112–3123, Sept.2009.
[13] J. Holtzman, “Asymptotic analysis of proportional fair algorithm,” inProc. IEEE Int. Symp. Personal, Indoor and Mobile Radio Commun.
(PIMRC), vol. 2, Sept. 2001, pp. 33–37.[14] C. Huang and T. Shih, “On the complexity of point-in-polygon algo-
rithms,” Computers & Geosciences, vol. 23, no. 1, pp. 109–118, 1997.
5190