optimization of the performance of down-draft biomass
TRANSCRIPT

1
Optimization of the performance ofdown-draft biomass gasifier installedat National Engineering Research &
Development (NERD) Centre of Sri Lanka
Duleeka Gunarathne

2
Master of Science Thesis EGI 2012:
004 MSC EKV 868
Optimization of the performance of down-draft biomass gasifier installed at NationalEngineering Research & Development(NERD) Centre of Sri Lanka
Duleeka Gunarathne
Approved
Date
Examiner
Prof. Torsten Fransson
Supervisor
OUSL:
Ms.Sumudu Jatunarachchi
Dr. Nihal Senanayake
KTH: Mr. Bo Wei
Commissioner Contact person
Abstract
Using biomass gasification to produce combustible gas is one of the promising sustainable energy optionsavailable for many countries. At present, a few small scale community based power generation systemsusing biomass gasifiers are in operation in Sri Lanka. However, due to the lack of proper knowledge, thesesystems are not being operated properly in full capacity. This stands as an obstacle for further expansionof the use of gasifier technology.
The objective of this study was to identify the most influential parameters related to fuel wood gasificationwith a down draft gasifier in order to improve the gasification processes.
A downdraft gasifier of 10kW electrical capacity was used to study the effect of equivalent ratio (Actual airfuel ratio to Stoicheometric air fuel ratio: ER) on the specific gas production, the heating value of gasproduced and the cold gas efficiency using three throat diameters (125mm, 150mm and 175mm). Six trialswere carried out for each throat diameter by varying the supply air flow to change the ER. The gassamples were tested for their compositions under steady state operating conditions. Using mass balancesfor C and N, the cold gas efficiencies, calorific values and the specific gas production rates weredetermined.
The results showed that with all throat diameters the calorific value of gas reduced with the increase ofER. The cold gas efficiency reduced with ER in a similar trend for all three throat diameters. The specificgas production increased with ER under all throat diameters.
Calorific value and specific gas production are changing inversely proportional manner. The ER to beoperated is depends on the type of application of the gas produced and engine characteristics. When alarge heat is required, low ER is to be used in which gas production is less. In the opposite way, when alarge amount of gas is needed, higher value of ER is recommended.
Keywords: Renewable Energy, Biomass Gasification, Downdraft Gasifier

3
Table of Contents
Abstract ...........................................................................................................................................................................2Chapter 1: Introduction................................................................................................................................................7
1.1 Background .........................................................................................................................................................81.2 Objectives............................................................................................................................................................81.3 Specifications of the gasification system at NERD Center.........................................................................9
Chapter 2: Literature Review.....................................................................................................................................112.1 Gasifier Fuels....................................................................................................................................................112.2 Gasification Agents..........................................................................................................................................122.3 Gasification Process ........................................................................................................................................122.4 Gasifier Designs ...............................................................................................................................................132.5 Throat ................................................................................................................................................................162.6 Equivalence ratio (ER)....................................................................................................................................172.7 Gasifier Applications.......................................................................................................................................172.8 Gas Cleaning and Cooling..............................................................................................................................182.9 Safety Aspects...................................................................................................................................................18
Chapter 3: Methodology.............................................................................................................................................193.1 Materials.............................................................................................................................................................193.2 Procedure ..........................................................................................................................................................193.3 Equipment.........................................................................................................................................................20
Chapter 4: Theoretical Framework...........................................................................................................................214.1 Lower Heating Value of Fuel Wood.............................................................................................................214.2 Specific gas production - Gas to Fuel Ratio (G/F)....................................................................................214.3 Specific air consumption - Air to Gas Ratio (A/G)...................................................................................224.4 Equivalent Ratio (ER) .....................................................................................................................................234.5 Lower Heating Value of Gas .........................................................................................................................234.6 Gasification Efficiency ....................................................................................................................................23
Chapter 5: Results and Analysis ................................................................................................................................245.1 Fuel properties..................................................................................................................................................24
5.2 Producer Gas Compositions..........................................................................................................................245.3 Speciman calculations......................................................................................................................................255.3.1 Calculation of Lower Heating Value of Fuel Wood ...............................................................................25
5.3.2 Calculation of Air to Gas Ratio..................................................................................................................26
5.3.3 Calculation of Gas to Fuel Ratio................................................................................................................26
5.3.4 Calculation of Equivalent Ratio..................................................................................................................26
5.3.5 Calculation of Lower Heating Value of Gas ............................................................................................27
5.3.6 Calculation of Efficiency of Gasification..................................................................................................28
5.4 Analysis of parameters ....................................................................................................................................28

4
5.4.1 Variation of parameters for different throat diameters ..........................................................................28
5.4.2 Comparison of performance.......................................................................................................................34
5.4.3 Gas composition and calorific value ranges at different throat diameters ..........................................36
Chapter 6: Discussion and Conclusions ..................................................................................................................37Bibliography .................................................................................................................................................................42Annexure 1: Comparison of gas compositions ......................................................................................................42Annexure 2: Comparison of char – ash generation ...............................................................................................42Annexure 3: Thermal efficiency of the gasifier.......................................................................................................50
5
List of Figures
Fig.1.1: 4kWe gasifier in operation.............................................................................................................................8
Fig.1.2: Gasifier at NERD Center ..............................................................................................................................9
Fig.1.3: Layout of the gasifier system at NERD Center .......................................................................................10
Fig. 2.1 Schematic diagram of a updraft gasifier (FAO, 1986).............................................................................14
Fig.2.2: Schematic Diagram of a Downdraft gasifier (FAO, 1986) .....................................................................15
Fig.2.3: Fluidized bed gasifier (FAO, 1986) ............................................................................................................15
Fig.2.4: Different throat arrangements (FAO, 1986).............................................................................................16
Fig.3.1: Wood chip preparation.................................................................................................................................19
Fig. 3.2: Throat of the gasifier ...................................................................................................................................19
Fig. 3.3: Gas sampling.................................................................................................................................................20
Fig. 3.4: Pressure measurement.................................................................................................................................20
Fig. 3.5: Gas chromatograph .......................................................................................................................20Fig. 5.1: Variation of calorific value of gas with ER for throat diameter 125mm ............................................29
Fig. 5.2: Variation of specific gas production with ER for throat diameter 125mm........................................29
Fig. 5.3: Variation of cold gas efficiency with ER for throat diameter 125mm ................................................30
Fig. 5.4: Variation of calorific value of gas with ER for throat diameter 150mm ............................................29
Fig. 5.5: Variation of specific gas production with ER for throat diameter 150mm........................................31
Fig. 5.6: Variation of cold gas efficiency with ER for throat diameter 150mm ................................................32
Fig. 5.7: Variation of calorific value of gas with ER for throat diameter 175mm ............................................29
Fig. 5.8: Variation of specific gas production with ER for throat diameter 175mm........................................33
Fig. 5.9: Variation of cold gas efficiency with ER for throat diameter 175mm ................................................33
Fig. 5.10: Calorific value of gas at different throat diameters ..............................................................................34
Fig. 5.11: Specific gas production at different throat diameters ..........................................................................34
Fig. 5.12: Cold gas efficiency at different throat diameters ..................................................................................35
Fig. 6.1: Variation of producer gas temperature before and after cooling with time .......................................39
Fig. A1.1: Variation of composition of gas with ER for throat diameter 125 mm .........................................43
Fig. A1.2: Variation of composition of gas with ER for throat diameter 150 mm .........................................44
Fig. A1.3: Variation of composition of gas with ER for throat diameter 175 mm .........................................44
Fig. A1.4: Variation of hydrocarbon content of gas with ER for throat diameter 125 mm ..........................45
Fig. A1.5: Variation of hydrocarbon content of gas with ER for throat diameter 150 mm ..........................45
Fig. A1.6: Variation of hydrocarbon content of gas with ER for throat diameter 175 mm ..........................46
Fig. A1.7: Variation of LHV of producer gas with THC......................................................................................47
Fig. A2.1: Variation of char-ash generation with ER for throat diameter 125 mm..........................................48
Fig. A2.2: Variation of char-ash generation with ER for throat diameter 150 mm..........................................48
Fig. A2.3: Variation of char-ash generation with ER for throat diameter 175 mm..........................................49
Fig. A3.1: Flame obtained with producer gas .........................................................................................................50

6
List of Tables
Table 2.1: Variation of gas composition with different gasification agents .......................................................12
Table 2.2: Gas composition of a typical downdraft gasifier .................................................................................13
Table 5.1: Measured properties of rubber wood...................................................................................................24
Table 5.2: Producer gas composition for throat diameter: 125mm ....................................................................24
Table 5.3: Producer gas composition for throat diameter: 150mm ....................................................................25
Table 5.4: Producer gas composition for throat diameter: 175mm ....................................................................25
Table 5.5: Producer gas composition and calorific value......................................................................................27
Table 5.6: Variation of parameters with ER for throat diameter 125mm..........................................................28
Table 5.7: Variation of parameters with ER for throat diameter 150mm........................................................288
Table 5.8: Variation of parameters with ER for throat diameter 175mm..........................................................29
Table 5.9: Comparison of performance at different throat diameters................................................................35
Table 5.10: Gas composition ranges obtained with different throat diameters ..............................................365
Table 5.11: Gas composition with 50% reduced chip size for 125mm throat diameter ...............................366
Table 6.1: Proximate analysis of different wood types..........................................................................................37
Table 6.2: Comparison of performance with literature values .............................................................................38
Table 6.3: Char-ash generation data .........................................................................................................................40
7
Chapter 1: Introduction
The current status of the world’s energy consumption and energy mix, the continuous growth of theworld population from 6.8 to about 9 billion by 2050, and today’s still growing global primary energydemand from 11730 MToe in 2006 to 17014 MToe in 2030 will inevitably lead to a conflict between ahappy planet (stable ecosystems, clean environment) and a happy world population. When considering4421 MToe of energy demand for world power generation in 2006, 74% of energy came from nonrenewable sources like coal, oil and gas. This has lead 11435 Mt CO2 emissions in 2006 only due to powergeneration. Thus, the question arises how the world’s unceasing demand for energy can be reconciledwith the absolute necessity to preserve the integrity of the biosphere (IEA, 2008). Evidence suggests thatconventional oil production has a limited capacity to meet growing demand, and most additional demandwill have to be met by unconventional sources. Since the globe is turning towards the sustainabledevelopment, renewable energy technologies are getting more attention from all the people these days.Depletion of fossil fuels and increasing the climate change, have resulted in this dramatic change(Bergerson and Keith, 2006).
Sri Lanka depends heavily on the imported fossil fuels for industrial use and electricity power generation.Even though the country has several hydropower plants in some years fossil fuel is used to supplementthe electrical power demand. The electricity generation increased by 8.4 per cent to 10,714 GWh in 2010due to the growth in economic activities. The share of hydro power in total power generation was only39.3% which was 52.6% in the previous year reflecting the changes in rainfall in catchment areas (CBSL,2010).
Further, in the areas of low population densities and under difficult -to -reach geographical conditions, itis not economically feasible to extend the national electricity grid to the entire population in Sri Lanka.Therefore, the power requirements of this un-served remote people have to be met by means of off-gridtechnologies, which also contribute to preserve the environment. Basically there are four options availablefor off-grid power generation in Sri Lanka, namely hydro power, solar power, wind power and dendro(biomass) power. The large capacity hydro power generation has reached the full potential and also itdoes not provide solution power demand of isolated and difficult-to-reach areas.
Micro hydro schemes are the least cost technology but that is limited to hilly and wet areas due togeographical and climate conditions required. Solar power systems are limited due to high cost involved.Wind energy systems are less feasible due to unavailability of required wind speed throughout the year.Therefore, most suitable option for Sri Lankan dry zones with bare lands for biomass plantation and whocan not afford too much money for solar panels is dendro power schemes.
Biomass gasification is a promising renewable energy technology for supplying thermal energy andgenerating electric power. It is vital to use biomass for stand alone power generation in remote areaswhere the national grid is not available. Unlike thermal applications, power generation demands low tarproducer gas which in turn prefer down-draft gasifier, as down-draft gasifier generally produce lowparticulate and low-tar gas.
This study was carried out to study the effects of throat diameter and air-fuel ratio on the gasifierperformance. Further the study aimed at identifying practical difficulties on the operation of downdraftgasifiers.

8
1.1 Background
At present, a few small scale community utilizing biomass gasifiers are in operation in Sri Lanka. Due tolack of proper understanding these systems are not operated in full capacity and difficulties arise duringthe expansion of the gasifier technology. One such a system of 4kW capacity is shown in Fig. 1.1. Abarrier in popularizing this type of technology is higher capital cost involved in such imported gasificationsystems.
Fig.1.1: 4kWe gasifier in operation
One of the functions of the National Engineering Research and Development (NERD) Center, a semi-government establishment dedicated to engineering research in Sri Lanka, is to carry out research &development activities on renewable energy technologies. Amongst other renewable power generationoptions, gasification technology is main area the NERD center has been conducting developmentactivities. This study was undertaken as a part of these development activities.
1.2 Objectives
1. To investigate the effect of air-fuel ratio and throat diameter on the performance of downdraftbiomass gasifier in terms of;calorific vale of gasspecific gas production rate andcold gas efficiency
2. Identifying practical difficulties on the operation of downdraft gasifiers.

9
1.3 Specifications of the gasification system at NERD Center
The gasifier installed (Fig.1.2) at the NERD Center has the following specifications.
Electrical capacity = 10 - 12 kW
Thermal capacity = 50 - 60 kW
Hopper capacity = 180 - 200 kg
Allowed maximum chip wood size = 2 inches
Allowed maximum moisture content of fuel = 20%
Air nozzle diameter = 28 mm
Number of air nozzles = 3
Fig.1.2: Gasifier at NERD Center
This system consist of gas cleaning and cooling system including two cyclone separators, indirect gascooler, water separator, sawdust filters and a bag filter prior to coupling to a Natural gas engine generatorwith 20kW electrical capacity. The complete layout diagram of the gasification process is shown in Fig.1.3.

10
Fig.1.3: Layout of the gasifier system at NERD Center
Gas
Gasifier Cycloneseparators
Cooler Waterseparator
Suctionblower
Enginegenerator
Air
Wood chips
Sawdustfilter
Bagfilter
Flare

11
Chapter 2: Literature Review
Gasification is a high temperature chemical process in which solid biomass fuel reacts with a limited supply ofair to completely convert all the carbonaceous material into the fuel gas. Thus thermo chemical characteristicsof biomass play a major role in the selection of the design and performance of gasification system (Iyer et.al,2002). This combustible gas is composed of Hydrogen, Carbon Monoxide, Methane and a very small amountof heavy hydrocarbons.
2.1 Gasifier Fuels
Charcoal, wood, wood residues, agricultural residues and peat are some biomass fuels commonly used forgasification. Chemical, physical and morphological property differences of these fuels demand differentgasification technologies or gasifier designs in order to smooth functioning of the system.
The most important fuel properties can be identified as follows for stable and efficient operation of a gasifierwith low pressure drop and production of high quality gas.
a) Moisture content
High moisture content of fuel reduces the thermal efficiency of gasifier since some heat is wasted for drivingoff the moisture which is otherwise used in reduction phase in converting thermal energy in to chemicalenergy or heating value of gas.
b) Volatile matter content
High volatile matter content of fuel demands special design of gasifier or cleaning system in order to removetars from producer gas when used in engine applications.
c) Ash content
Melting or agglomeration of ash results in slagging or clinker formation. This adds much labour work andalso excessive tar formation or blocking the gasifier with the risk of explosion even.
The use of moving grates has added the advantage of ability to operation with fuels having high ash contentwithout slogging problem.
d) Bulk density
Fuels with high bulk density contain high energy content per unit volume and also require less space in fuelhopper. When the bulk density of fuel is low, it is difficult to flow under gravity and this result in low heatingvalue of gas.
To overcome limitations of above fuel properties, suitable pretreatment of fuel is desired. Generallypretreatment involves mechanical chipping for size reduction, screening to ensuring uniform size distribution,drying for moisture removal and densification for low bulk density fuels.

12
2.2 Gasification Agents
Gasification agent is the means of supplying oxygen in to the gasifier.
a) Air gasification
Most common method of gasification is using air as gasification agent. This method is straight forward andvery simple, requiring less capital and operating cost. However presence of inert Nitrogen in air dilutes thegas and hence lowers the calorific value per unit volume of gas.
b) Oxygen gasification
Oxygen gasification can be achieved by removing Nitrogen from air prior to supplying to the gasifier. Thisinvolves some additional cost, but avoids previously mentioned gas dilution problem and results in mediumlevel of energy content of gas per unit volume.
c) Steam gasification
This is highly endothermic process. The heat needed should be supplied by external heat source or by partialoxidation of fuel. Partial oxidation of fuel is achieved by mixing steam with air or oxygen. This methodproduces gas with higher energy content compared to previous methods.
d) High temperature air/steam gasification
This novel method, with increase of physical enthalpy of gasification agent, ensures economical andenvironmental benefits over above all methods and attracts more attention nowadays.
Average product gas composition (vol. %) with different gasification agents are given in Table 2.1(Zuberbuhler, 2005)
Table 2.1: Variation of gas composition with different gasification agentsGasification agent H2% CO% CH4% CO2% N2% H2:CO
Air 15 20 2 15 48 0.75Oxygen 40 40 0 20 0 1Steam 40 25 8 25 2 1.6
2.3 Gasification Process
Basically four distinguishable stages are occurring inside a gasifier.
a) DryingFuel is introduced at the top of the gasifier and drying of this biomass fuel is taking place at the top mostsection of the gasifier with the aid of heat transferred from lower part of the gasifier.
Resulting water vapor together with water vapor formed at combustion zone, partly lead to production ofhydrogen and remaining is going with producer gas.
b) PyrolysisDry biomass then undergoes an endothermic reaction called pyrolysis which decomposes the biomass fuelreleasing its volatile materials in liquid and gaseous forms. The remaining is called char.
c) Combustion/OxidationAt the level where oxygen is introduced to the gasifier, highly exothermic oxidation reactions are happened.
C+O2 CO2

13
2H + ½ O2 H2O
d) Reduction
Oxidation products undergo several reduction processes converting sensible heat of the gases and charcoal into chemical energy of the producer gas as follows.
C + CO2 2CO
C + H2O CO + H2
CO + H2O CO2 + H2
C + 2H2 CH4
CO + 3H2 CH4 + H2O
CO2 + 4H2 CH4 + 2H2O
Ashes result from gasification is then removed by a rotating grate at the bottom and producer gas is obtainedat a position depending on the type of the design.
According to the literature (FAO, 1986), average composition of producer gas is given in Table 2.2.
Table 2.2: Gas composition of a typical downdraft gasifierComponent Composition
N2 50-54%
CO 17-22%
CO2 9-15%
H2 12-20%
CH4 2-3%
Calorific value(MJ/Nm3) 5-5.9
2.4 Gasifier Designs
a) Fixed bed gasifier
In this type of gasifier, air and gas pass up or down through a bed of solid fuel. These are the simplest type ofgasifier and hence suitable for small scale applications.
According to the pathway of air and gas, fixed bed gasifier are further divided in to two categories.

14
1) Updraft gasifier
This type is mainly used for coal and charcoal gasification which are non volatile. Higher tar productionhinders the application of this type in high volatile fuels if clean gas is required.
Fig. 2.1 Schematic diagram of a updraft gasifier (FAO, 1986)
However, there are several advantages of this type including simplicity, low gas exit temperature due tointernal heat exchange and higher efficiency.
2) Downdraft gasifier
According to the design, the tarry pyrolysis products are passed through the glowing bed of char coal and taris cracked in to gaseous products including CO2, CO, H2 and CH4. Hence, this type is suitable for highlyvolatile fuels such as wood, for producing gas with low tar content.
Therefore, this type is very much suitable for power generation applications which require clean gas.
However, several drawbacks of this type of systems can be identified as limitation to operation with lowdensity fuels due to flow problems and excessive pressure drop, slogging of ash and lower efficiencycompared to updraft type due to lack of internal heat exchange.

15
Fig.2.2: Schematic Diagram of a Downdraft gasifier (FAO, 1986)
b) Fluidized bed gasifier
This type is more suitable for large scale applications and for feed stocks with small particle size. In thisdesign, air passes through a great at a velocity enough to fluidize the particles above the grate. Gasifierdiameter is increased above the bed of particle causing reduction of air velocity in order to re-circulate theparticles within the bed.
Fig.2.3: Fluidized bed gasifier (FAO, 1986)

16
2.5 Throat
An oxidation zone is formed at the level where air is introduced. Oxidation reactions are highly exothermicand result in a temperature rise up to 1200 - 1500 °C.
Apart from heat generation, another important function of the oxidation zone is to oxidize all condensableproducts from the pyrolysis zone. In order to achieve this, the temperature distribution should be even andcold spots should be avoided in the oxidation zone. Air inlet velocity and the gasifier geometry play animportant role on this.
Basically there are two methods to obtain an even temperature distribution at the oxidation zone. Onemethod to reduce the cross-sectional area at a certain height of the gasifier is known as "throat". To spreadthe air inlet nozzles over the circumference of the throat or using a central air inlet with a spraying device isanother method.
Several configuration are available incorporate the function of throat in gasifier as shown in Fig. 2.4.
Fig.2.4: Different throat arrangements (FAO, 1986)
Due to high temperature at throat, tar could be thermally cracked (Coovattanachai, 1989). The throateddowndraft gasifier is generally used for gasification of woody biomass of uniform sizes and shapes (blocks) asthey flow smoothly through the constricted hearth. The operation of this type of gasifiers is very sensitive tofeedstock size and quality. (Chopra and Jain, 2007)

17
The throat diameter has an effect on the conversion efficiency of the gasifier and it has been reported thatsmaller throat diameters give higher conversions efficiency and vise versa. This is because the throats withlarger diameters decrease the temperature due to divergent effect and hence the reaction rate. The efficiencyalso has been found to increase with the distance from the top reduction zone to the throat location andsmall throats need longer gasification (Siva Kumar et al., 2008).
The throat angle also affects the gasifier conversion efficiency and small angles give higher conversionefficiencies and vise versa due to diverging effect of large angles. However, small angles require longreduction zones (Siva Kumar et al., 2008).
2.6 Equivalence ratio (ER)
Equivalence ratio is the ratio of actual air-fuel ratio to the stoicheometric air-fuel ratio. The theoreticalgasification occurs between ER values of 0.19-0.43 (Zainal et. al, 2002). The theoretical optimum point forgasification is near 0.25 ER. Below 0.25, char is remaining and some energy losses through char. At higherER, some gas is burned and the temperature inside the gasifier increases. At ER = 0.25 all the char isconverted into producer gas giving the highest energy of the producer gas.
Studies have been reported on how the performance of gasifier varies with equivalent ratio (Zainal et. al, 2002,Pratik et. al, 2009 and Ummadisingu et. al, 2010). In these studies they have studied the change of gas calorificvalue, cold gas efficiency and gas production rate with equivalent ratio. The calorific value was found to beincreasing with the ER, but tends to reduce after a certain critical value. Cold gas efficiency varies in the samepattern giving maximum at maximum calorific value. On the other hand, gas production rate per unit weightof biomass was found to be increasing with ER.
The experimental observations of Sharma, 2011 concludes that any factor results in higher reactiontemperatures due to energetics of gasification reactions (increase of air/fuel ratio) or operating conditions(increase of gas flow rate) gives better gasifier performance.
2.7 Gasifier Applications
Applications of gasification are divided into two categories.
a) Thermal Applications
Due to direct burning of gas, thermal applications does not demand so clean gas and hence, can be operatedwith high tar and dust content without much post cleaning. Efficiency of thermal application of gasification isin the range of 90% according to the literature.
b) Engine Applications
Spark ignition engines normally fuelled with gasoline or kerosene can be totally operated with producer gaswithout doing any engine modification. However, diesel engines must be converted by reducing thecompression ratio and installing spark ignition system in order to run on producer gas alone. But, up to 90%of Producer gas can be achieved by duel fuel mode of diesel engines without any modifying the engine.
Not like in thermal applications, engine applications require much clean low tar gas in order to ensureproper functioning of the engine generator systems. Efficiency of such systems lies between 60-75%according to the literature.

18
c) Mobile applications
Down-draught gasifiers fuelled by wood or charcoal can be used to power cars, lorries, buses, trains, boatsand also ships. However mobile applications have some difficulties compared to stationary units. Theconstruction needs to be as light as possible. Since mobile applications tend to operate with large variationsin gasifier load, tar formation and clogging of cooler and cleaners and engines can be happen. Whether it iseconomical to use gasifier fuelled transport vehicles with these difficulties depend on the local situation,especially on the cost and availability of petrol and diesel. However, applications on trains and boats may havefewer difficulties with weight and load variation.
2.8 Gas Cleaning and Cooling
Gas cooling prior to engine application is very much essential for improving volumetric efficiency and alsofor condensing tarry liquids. Direct wet scrubbing and indirect water cooling are possible two methods whichare commonly used. Heat exchanger can also be used to preheat incoming air while cooling down theproducer gas.
Gas cleaning systems basically include cyclone separators, biomass filters and or bag filters for dust removaland water separators for possible water droplet removal after gas cooling.
2.9 Safety Aspects
a) Carbon Monoxide poisoning
Carbon Monoxide, the main component of producer gas, reduces oxygen transport to the tissues by tyinghemoglobin in the blood. The results are headache, nausea, dizziness, irritability and even death.
The threshold limit value (TLV) of Carbon Monoxide in United State is 50 ppm in work place for 8 hoursand the short term exposure limit (STEL) is 400 ppm.
There are several safety precautions has been taken in this particular gasifier in order to minimize CarbonMonoxide poisoning.
1. Since the gasifier system operate at negative pressure, if there is any leak, instead of expelling CarbonMonoxide into the work area, it draws air in to the system.
2. The gasifier system installed at an open building ensuring adequate ventilation. It can also beequipped with alarming system for signaling high concentration of Carbon Monoxide in the ambient.
b) Fire/explosion hazard
The gasifiers are associated with high risk of fire and explosion hazards.
When the hopper lid is opened for filling the fuel, gases inside the gasifier comes out and can igniteflammable materials nearby. When introducing flame for starting the gasifier, care should be taken forpreventing explosions since flammable gases may be trapped inside the gasifier.
There are several operating practices that should be followed in order to ensure fire and explosion hazards areminimized.
1. Turning on the suction blower before igniting the gasifier for removing flammable gases inside.
2. Avoid looking into the ignition opening when introducing flame.
3. If the hopper lid is tightly fit, the gasifier is equipped with pressure relief valve.

19
Chapter 3: Methodology
3.1 Materials
Fuel wood chips with approximate volume of 25cm3, made out of rubber tree cuts were used.
Fig.3.1: Wood chip preparation
3.2 Procedure
Fuel wood properties were determined as follows.
Bulk density – By measuring mass of a known volumeCalorific value – By means of bomb calorimeterMoisture content – By oven method and by using a moisture balanceComposition – By ASTM standard test method for proximate analysis
Experimental trials were carried out using three sizes of throat diameters. The throat diameters used were125mm, 150mm and 175mm. For each size of throat, 6 experimental trails were done with different settingsof air supply in order to vary the Equivalence Ratio (see section 4.4). Air supply rate was changed by manuallyadjusting supply valves.
Fig. 3.2: Throat of the gasifier
After about half an hour in stabilized condition of the gasification, three samples of producer gas werecollected and the compositions were analyzed. An average was taken for further calculations.

20
Pressure readings were taken at Gas cooler, Water separator, Sawdust filter and bag filter with manometersinstalled at these locations. When the pressure was considerably dropping at a certain cleaning part, necessaryactions were taken in order to clean that part for reducing blockage.
Fig. 3.3: Gas sampling Fig. 3.4: Pressure measurement
Temperature readings at following points were measured with K- type thermocouples coupled to atemperature data logger.
a. Gas leaving the gasifierb. After gas coolingc. At the gas sampling portd. Ambient temperature
Other than above parameters, amount of char-ash removed in each run and calorific value of char-ash werealso measured in order to calculate the char-ash losses.
3.3 Equipment
The gasifier installed at the NERD Center was used in the study (see section 1.2 for specifications).Following equipment was used for taking measurements.
Weighing balance for weighing fuel wood and char-ashMoisture balance for measuring moisture content of woodAnalytical balance, electric oven, muffle furnace and desiccator for proximate analysis of woodBomb calorimeter for measuring calorific value of wood and char-ashTemperature data logger and thermocouple wires for measuring temperaturesPulse pump for gas samplingGas chromatograph for analyzing producer gas composition
Fig. 3.5: Gas chromatograph

21
Chapter 4: Theoretical Framework
4.1 Lower Heating Value of Fuel Wood
Bomb calorimeter measures the Higher Heating Value (HHV). The LHV is computed using the followingequation.
…………………………………………………………..………..(4.1)
(SERI, 1988)
The measurement of fuel consumption and gas flow is difficult, have low accuracy and have higher risk. It ispossible to calculate cold gas efficiency without measuring the fuel consumption and gas flow, by means of Cand N balance by Modified loss method A-4 (Huisman G.H., 2001), if the analysis of wood and compositionof gas are known. This method was used here because measured fuel consumption rate seems to beinaccurate.
4.2 Specific gas production - Gas to Fuel Ratio (G/F)
In order to determine the Producer Gas to Fuel Ratio (G/F) carbon balance is used.
Using Carbon balance;
Assuming carbon in char-ash and tar is negligible compared to carbon in the producer gas;
……………………………………………………………………………………. (4.2)
Mass percentage of carbon in dry fuel wood is taken as 52.2% (FAO, 1986).
………………………………………………………………………………. (4.3)

22
From (4.2) and (4.3);
……………………………………………………………………………… (4.4)
Volumetric fraction of carbon in the producer gas is computed as follows:
………………………………………………………………………………. (4.5)
From (4.3) and (4.4);
4.3 Specific air consumption - Air to Gas Ratio (A/G)
In order to determine the Air flow to Gas flow (A/G) nitrogen balance is used.
Using Nitrogen balance
Assuming nitrogen in fuel is very small compared to the nitrogen in air;
………………………………………………………………………….(4.7)
Taking volumetric fraction of nitrogen in air as 0.79;
………………………………………………………………………(4.8)
Where A= Supply air flow rate (m3/h)
From (4.7) and (4.8);
……………………………………………………………………….(4.9)

23
Volumetric fraction of nitrogen in the gas is obtained from the gas composition.
……………………………………………………………………....(4.10)
From (4.9) and (4.10);
4.4 Equivalent Ratio (ER)
Equivalent Ratio reflects the combined effect of air flow rate and fuel flow rate. This is defined as the ratio ofoperating air-fuel ratio to Stoicheometric air-fuel ratio.
Stoicheometric air-fuel ratio is taken as 6.36 kg of air per kg of wood (SERI, 1988)
4.5 Lower Heating Value of Gas
Lower Heating value (LHV) of producer gas is determined from the chemical composition of the gas andLHV of individual components.
4.6 Gasification Efficiency

24
Chapter 5: Results and Analysis
5.1 Fuel properties
Table 5.1 summarizes the measured properties of fuel wood used in the study.
Table 5.1: Measured properties of rubber woodProperty Wet basis Dry basis
Type Rubber
Chip size (cm3) 25
Bulk density (kg/m3) 332 286
HHV (MJ/kg) 16.65 19.36
Moisture content (%) 14 16
Volatile matter content (%) 75.73 88.06
Fixed carbon content (%) 9.45 10.99
Ash content (%) 0.82 0.95
5.2 Producer Gas Compositions
Producer gas compositions for different throat diameters are given in the Tables 5.2, 5.3 and 5.4. More etailedanalysis is given in Annexure 1.
Table 5.2: Producer gas composition for throat diameter: 125mm
Air flowsetting N2% H2 % CH4 % CO % C2H4% C2H6% CO2% Other%
1 49.90 12.77 1.87 19.48 0.19 0.04 11.62 4.13
2 51.94 11.89 2.06 19.92 0.17 0 11.89 2.13
3 51.96 11.91 2.15 19.09 0.24 0 12.12 2.53
4 51.93 12.35 1.97 18.29 0.13 0 12.87 2.47
5 52.44 10.83 1.66 18.83 0.14 0 11.83 4.26
6 55.18 8.79 1.56 18.12 0.20 0.05 12.19 3.90

25
Table 5.3: Producer gas composition for throat diameter: 150mm
Air flowsetting N2% H2 % CH4 % CO % C2H4% C2H6% CO2% Other%
1 49.51 15.15 2.19 17.01 0.31 0 13.69 2.15
2 50.05 13.69 2.19 18.70 0.26 0 12.23 2.87
3 50.53 12.83 1.96 18.41 0.34 0 11.96 3.97
4 50.31 13.27 1.66 17.34 0.29 0 12.29 4.84
5 50.27 12.61 1.61 16.64 0.28 0 11.38 7.21
6 51.36 12.93 1.55 14.61 0.22 0 12.33 7.00
Table 5.4: Producer gas composition for throat diameter: 175mmAir
flowsetting
N2% H2 % CH4 % CO % C2H4% C2H6% CO2% Other%
1 52.36 11.62 2.34 19.00 0.19 0 12.48 2.01
2 50.74 12.55 1.41 15.15 0.47 0 12.81 6.87
3 50.31 12.68 2.12 19.57 0.21 0.07 11.59 3.44
4 54.17 10.53 1.52 16.23 0.22 0 11.89 5.43
5 56.77 8.52 1.71 17.23 0.17 0 11.59 4.00
6 55.28 9.52 1.89 16.22 0.17 0.09 14.24 2.58
5.3 Speciman calculations
5.3.1 Calculation of Lower Heating Value of Fuel Wood
From equation (4.1),
Lower heating value of fuel wood can be calculated as follows.
For the following calculations, readings of throat diameter: 125mm, air flow setting: 1 was used.
26
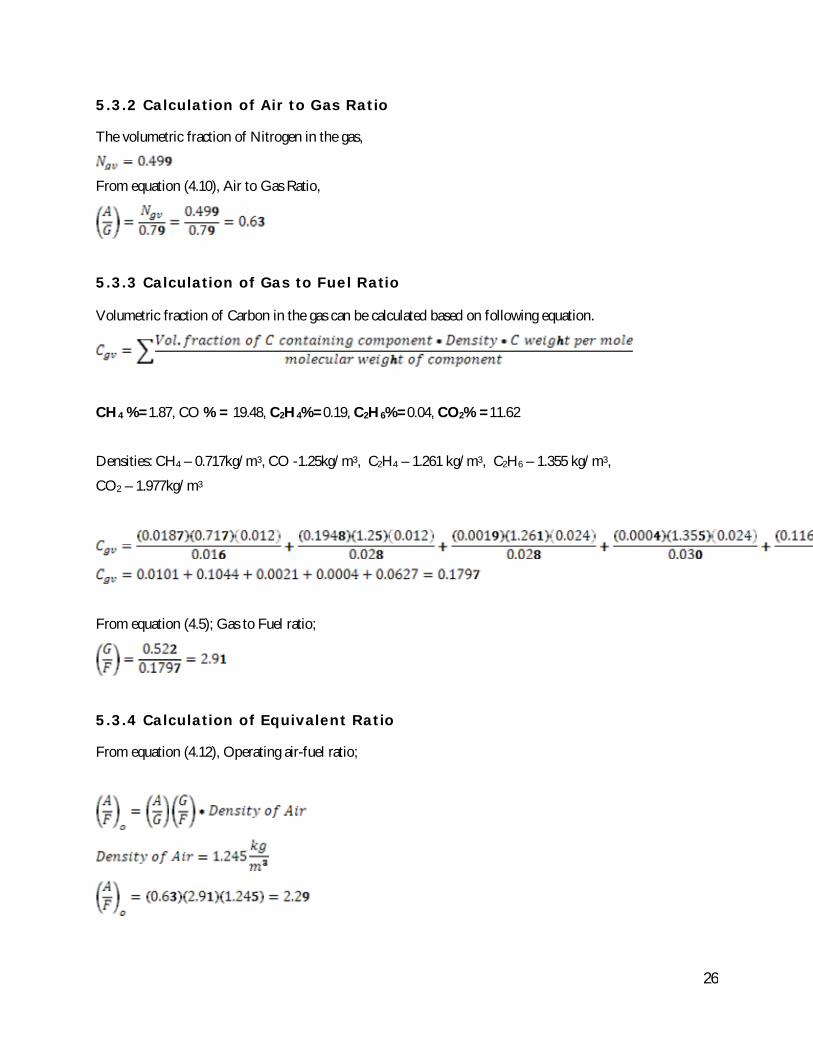
5.3.2 Calculation of Air to Gas Ratio
The volumetric fraction of Nitrogen in the gas,
From equation (4.10), Air to Gas Ratio,
5.3.3 Calculation of Gas to Fuel Ratio
Volumetric fraction of Carbon in the gas can be calculated based on following equation.
CH4 %=1.87, CO % = 19.48, C2H4%=0.19, C2H6%=0.04, CO2% =11.62
Densities: CH4 – 0.717kg/m3, CO -1.25kg/m3, C2H4 – 1.261 kg/m3, C2H6 – 1.355 kg/m3,
CO2 – 1.977kg/m3
From equation (4.5); Gas to Fuel ratio;
5.3.4 Calculation of Equivalent Ratio
From equation (4.12), Operating air-fuel ratio;

27
From equation (4.11), Equivalent Ratio;
5.3.5 Calculation of Lower Heating Value of Gas
Table 5.5: Producer gas composition and calorific valueComponent Composition (%) *Calorific Value (kJ/m3)
N2 49.9 -
H2 12.77 10788
CH4 1.87 35814
CO 19.48 12622
C2H4 0.19 59036
C2H6 0.04 63748
CO2 11.62 -
Calorific value of producer gas (kJ/m3) 4646
* Source: Waldheim & Nilsson, 2001
Lower heating value of gas;

28
5.3.6 Calculation of Efficiency of Gasification
Cold gas efficiency;
This can be rearranged as,
5.4 Analysis of parameters
Variations of calorific value of gas, efficiency and specific gas production with equivalence ratio for allexperimental trials are presented in the following tables.
5.4.1 Variation of parameters for different throat diameters
Table 5.6: Variation of parameters with ER for throat diameter 125mmAir flowsetting ER G/F A/G LHV
1 0.360 2.91 0.63 4646 71.662 0.366 2.84 0.66 4632 69.863 0.37 2.87 0.66 4606 70.234 0.375 2.91 0.66 4421 68.285 0.388 2.98 0.66 4222 66.826 0.411 3.01 0.7 3944 62.9
Table 5.7: Variation of parameters with ER for throat diameter 150mmAir flowsetting ER G/F A/G LHV
1 0.356 2.9 0.63 4748 73.02
2 0.358 2.89 0.63 4779 73.20
3 0.368 2.94 0.64 4612 72.02
4 0.380 3.05 0.64 4386 70.95
5 0.401 3.22 0.64 4203 71.76
6 0.427 3.36 0.65 3925 69.91

29
Table 5.8: Variation of parameters with ER for throat diameter 175mmAir flowsetting ER G/F A/G LHV
1 0.358 2.87 0.64 4767 72.662 0.362 2.79 0.66 4777 70.713 0.369 2.84 0.66 4603 69.424 0.403 3.21 0.64 4047 68.835 0.434 3.23 0.69 3859 66.146 0.443 3.15 0.72 3809 63.62
Following graphs illustrates the pattern of variation of downdraft gasifier parameters with ER for three throatdiameters.
For throat diameter 125mm:
Fig. 5.7: Variation of calorific value of gas with ER for throat diameter 125mm

30
Fig. 5.8: Variation of specific gas production with ER for throat diameter 125mm
Fig. 5.9: Variation of cold gas efficiency with ER for throat diameter 125mm
31
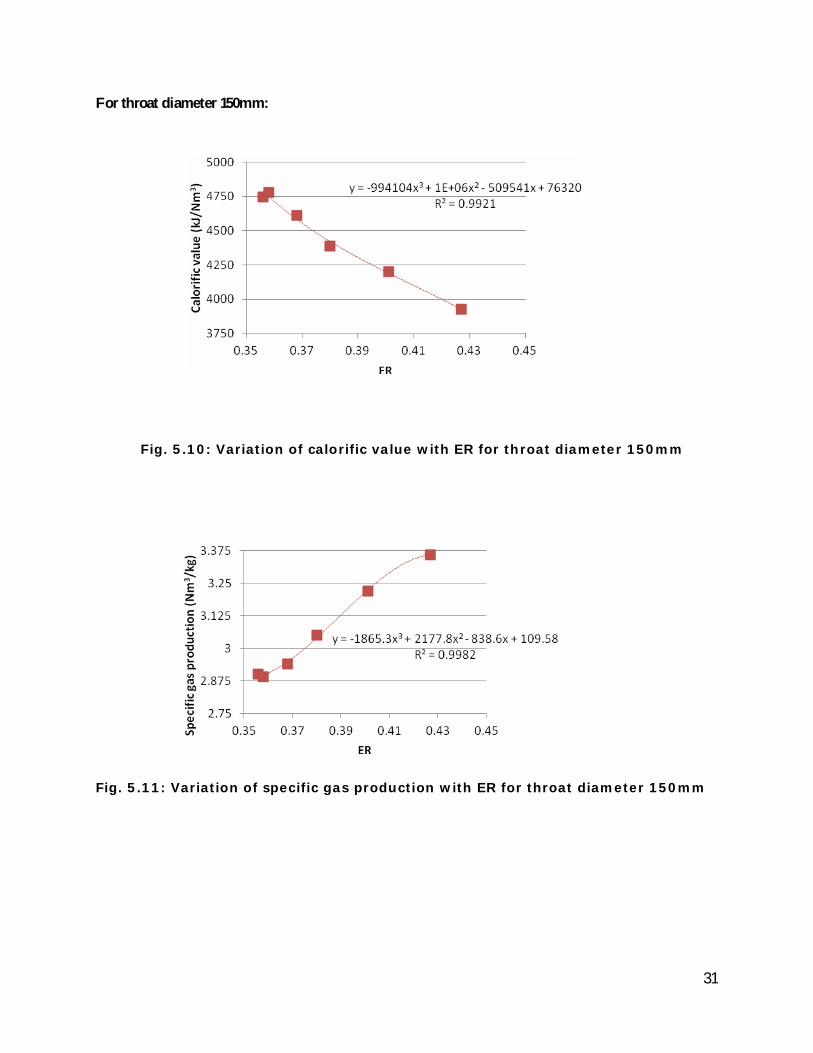
For throat diameter 150mm:
Fig. 5.10: Variation of calorific value with ER for throat diameter 150mm
Fig. 5.11: Variation of specific gas production with ER for throat diameter 150mm

32
Fig. 5.12: Variation of cold gas efficiency with ER for throat diameter 150mm
For throat diameter 175mm:
Fig. 5.13: Variation of calorific value gas with ER for throat diameter 175mm

33
Fig. 5.14: Variation of specific gas production with ER for throat diameter 175mm
Fig. 5.15: Variation of cold gas efficiency with ER for throat diameter 175mm

34
5.4.2 Comparison of performance
Fig. 5.16: Calorific value of gas at different throat diameters
The calorific value exhibits a decreasing trend with almost same pattern for all three throat diameters. Thehighest calorific value around 4750 kJ/Nm3 was obtained for each throat diametes near 0.36 ER. Thevariation of calorific value with ER was almost same for three throat diameters.
Fig. 5.17: Specific gas production at different throat diameters

35
When considering three throat diameters, the maximum specific gas production rate around 3.3 Nm3/kg wasobtained for 150mm and 175mm throat diameters at equivalence ratio of 0.425. Further, when the ER isincreased, throat diameter 150mm gave slightly higher specific gas production than throat diameter 175mmfor same ER value. For 125mm throat diameter, the maximum specific gas production rate of 3.075 Nm3/kgwas seen near 0.4 equivalence ratio.
Fig. 5.18: Cold gas efficiency at different throat diameters
The cold gas efficiency exhibits a similar decreasing trend for all three throat diameters. Further, when the ERis increased, throat diameter 150mm gave higher cold gas efficiency than throat diameter 175mm for sameER value. The 125mm throat diameter gave the minimum cold gas efficiencies.
According to above figures, the equivalence ratio plays a significant role in the performance of gasifier.
Table 5.9 compares the optimum points of all three throat diameters.
Table 5.9: Comparison of performance at different throat diametersThroat
diameter(mm)
Optimumequivalence
ratio
Calorific value(MJ/Nm3)
Specific gasproduction
rate (Nm3/kg)
Cold gasefficiency (%)
125 0.360 4.65 2.91 71.66
150 0.356 4.75 2.90 73.02
175 0.358 4.77 2.87 72.66
There is no significant variation of performance at the optimum point with three throat diameters.

36
5.4.3 Gas composition and calorific value ranges at different throatdiameters
Table 5.10: Gas composition ranges obtained with different throat diametersComponent 125mm throat 150mm throat 175mm throat
N2 49-56 49-52 50-57
H2 8-13 12-16 8-13
CH4 1-3 1-3 1-3
CO 18-20 14-19 15-20
CxHy 0-0.5 0-0.5 0-0.5
CO2 11-13 11-14 11-15
Calorific value(MJ/Nm3) 3.9-4.6 3.9-4.8 3.8-4.8
From the Table 5.10, it can be seen that there is no significant variation of composition ranges and also incalorific value ranges of different throat diameters.
Table 5.11: Gas composition with 50% reduced chip size for 125mm throatdiameter
For air flow setting 1 of 125mm throat diameter, when the fuel size is reduced to half of its original value,there is no significant variation of compositions and calorific value from previous trials.
Component Composition (%)
N2 50.87
H2 10.10
CH4 2.29
CO 22.53
C2H4 0.09
CO2 11.35
Calorific value (MJ/Nm3) 4.8

37
Chapter 6: Discussion and Conclusions
The bulk density of rubber wood chips used in the present study (332 kg/m3) is similar to the bulk density ofhard wood which is 330 kg/m3 (Stassen & Knoef, 1993).
The average HHV of wood is 20 MJ/kg dry basis (Stassen & Knoef, 1993) and the HHV of wood used in thepresent study (19.36 MJ/kg) is comparable with that.
The proximate analysis results of rubber wood* gave comparable results with literature values (SERI, 1988)for volatile matter content and fixed carbon content. The ash content of rubber wood found to be bit higher.The comparison is given in Table 6.1.
Table 6.1: Proximate analysis of different wood typesWood type Volatile matter (%) Fixed carbon (%) Ash (%)
Western Hemlock 84.8 15.0 0.2
Douglas Fir 86.2 13.7 0.1
White Fir 84.4 13.1 0.5
Ponderosa Pine 87.0 12.8 0.2
Redwood 83.5 16.1 0.4
Cedar 77.0 21.0 2.0
Rubber* 88.06 10.99 0.95
As shown in the Fig. 5.1 – 5.9 there is a clear variation of performance when varying the equivalence ratio forsame throat diameter. Similar trends have been obtained by Zainal et al., 2002, Pratik et al., 2009 andUmmadisingu et al., 2010.
According to Siva Kumar et al., 2008, the conversion efficiency has the highest value for the smallest throatdiameter. This is because the throats with larger diameters decrease the temperature due to divergent effectand hence decrease the reaction rate and vise versa. When considering 150mm and 175mm throats of thepresent study, cold gas efficiency of 150mm throat gave higher values compared to 175mm throat similar toSiva Kumar et al., 2008. But, 125mm throat gave minimum cold gas efficiencies. This may be due to low gasproduction as a result of bridging of fuel with inadequate throat size.
Following table summarize the experimental data on optimum equivalence ratio, calorific value, specific gasproduction rate and cold gas efficiency published by several researchers.

38
Table 6.2: Comparison of performance with literature valuesResearchGroup
Biomass type Optimumequivalenceratio
Calorificvalue(MJ/Nm3)
Specific gasproductionrate (Nm3/kg)
Cold gasefficiency (%)
Dogru et al.(2002)
Hazellnut shell 0.276 5.15 2.73 80.91
Zainal et al.(2002)
Furniture wood+ charcoal
0.388 5.34 - 80
Pratik et al.(2009)
Furniture waste 0.205 6.34 1.62 56.87
Ummadisinguet al. (2010)
Pinus roxburghiiwood shavings
0.21 6.14 1.75 45
Present study Rubber wood 0.356 4.75 (LHV) 2.90 73.02
The results obtained from the present study are comparable with the available data in the literature accordingto Table 6.2.
Hydrogen content of producer gas obtained during present study (8-16%) is bit lower than the literaturevalues (12-20%). The other compositions are comparable to typical producer-gas composition fromcommercial wood for downdraft gasifiers operated on low- to medium-moisture-content fuels (Table 2.2 :FAO, 1986).
Hydrogen content of producer gas varies with moisture content of fuel wood used. According to theliterature (Stassen & Knoef, 1993), up to 40% moisture in wood will increase the Hydrogen content in the gasand beyond 40%, it will decrease. Since the fuel wood used is comparably dry (14% moisture), the Hydrogencontent in the gas is acceptable.
According to Siva Kumar et al., 2008, the conversion efficiency has the highest value for the smallest fuelsize. The difference of efficiency is not much significant for small variations of wood sizes. For analyzing theeffect of size of the fuel on gasifier performance in the present study, more trials should be carried out withdifferent equivalence ratios.
Other issues
Fuel preparation difficulties
Since the fuel wood chips are cut manually, it was difficult to maintain uniform size and shape of chips. Thisis an essential requirement for throated gasifiers because the chips should flow smoothly through theconstricted hearth and operation is very sensitive to feedstock size and quality (Chopra and Jain, 2007).
Since the ambient humidity affect the moisture content of woodchips, it was difficult to maintain themoisture content of woodchips in the required level. Sun drying was used as the drying method and weatherconditions frequently affected the drying of woodchips.

39
Gasifier operation difficulties
Since the flame was introduced manually through air supply openings with the aid of suction of the blower, ittook some time for igniting woodchips inside the gasifier.
Since the manual feeding of woodchips is practiced, the work was tough and time consuming.Non-uniform distribution of woodchips inside the gasifier caused inaccurate measurement of fuelconsumption due to loosely filling of woodchips after the run. Sometimes this lead to flame instability due tolow gas production and this was partly rectified by means of vibrator and also by the comb rotor which wasused for cha-ash removal.
The gasifier was built for batch operation and not for continuous operation. If refueling is needed, the topcover should be opened and this cause a lot of air leakage and heat losses. And also when opening the hopperlid, gases inside the gasifier comes out and safety issues arise.Since the gasifier is operated in slight negative pressure, gas sampling required a pump.
Opportunities for improvement
Waste heat recovery
Fig. 6.1: Variation of producer gas temperature before and after cooling with time
Exit gas temperature of the gasifier was always in the range of 250 °C and gas temperature after cooling wasvary from 100-150 °C depending on the cooling water temperature and flow.
Higher temperature of exit gas is advantageous when the gas is used for heating applications. For engineapplications, exit gas temperature is not much important because gas is cooled down before feeding to theengine. Indirect water cooling is used in order to facilitate this. The hot water generated is discharged to theatmosphere without getting any use out of it and this will lead to environmental problems and increased waterconsumption.
Therefore, this waste heat may be used for air preheating specially in large scale applications.
Available waste heat = TCm p
Gas flow rate = 21m3/hDensity of producer gas = 1.3 kg/m3 (Maschio G., 1993)

40
skghkgm /0076.0/3.273.1*21Cp of producer gas = 1.45 kJ/kg K (Maschio G., 1993)If the gas is cooled down to 100 °C, 150100250T KAvailable waste heat =0.0076*1.45*150 = 1.653 kW
Higher inlet air temperatures increase the conversion efficiency of gasifiers because hot air providesadditional enthalpy necessary for reaction reducing equivalence ratio (Siva Kumar et al., 2008). Therefore, airpreheating will increase the gasifier performance.
Recovery of char-ash
Table 6.3 represents the char – ash generation rates and more detailed evaluation is presented in Annexure 2.
Table 6.3: Char-ash generation data
When considering all three throat diameters, the char-ash generation varies up to 0.46 kg/h. The proximateanalysis of char-ash gave 64.12% of fixed carbon content and 35.88% of ash content. The heating value ofthis char-ash was found to be 20.24 MJ/kg. Then, approximately 9.3 MJ/h (2.583 kW) is lost through char-ash at the maximum char-ash generation rate. However, in most of the time, char-ash generation rate is muchlower and hence, no significant loss will be happen through char-ash. Char-ash has a significant value as a soilconditioner or as charcoal (SERI, 1988).
The ash holes in the gasifier are 13mm in diameter and the size of char-ash particles collected to the grate wasaround 10mm. It is clear that, large particles carry more un-reacted carbon than small particles. Hence, tomaximize the efficiency, the removal of large particles through the grate should be minimized.
Limitations of the study
Since the optimum points were obtained at an end of the tested equivalence ratio range, it can not be justifiedas the actual optimum point of the gasifier. These optimum points valid only within the range of equivalenceratios tested.
Throat diameter125mm 150mm 175mm
ERChar-ashkg/h ER
Char-ashkg/h ER
Char-ashkg/h
0.360 0.191 0.356 0.077 0.358 0.2060.366 0.244 0.358 0.269 0.362 0.3660.370 0.247 0.368 0.313 0.369 0.3890.375 0.228 0.380 0.317 0.403 0.3460.388 0.461 0.401 0.214 0.434 0.2040.411 0.190 0.427 0.301 0.443 0.103

41
Future work
This study does not cover the optimization of other operating parameters like moisture content and type offuel wood and other design parameters like throat angle and height of the reduction zone. The effect of chipsize also not studied completely. Therefore, someone can continue this study by extending the study area forthose mentioned factors.
Since there is no any energy efficiency measures have been adopted in the present system, it is vital toinvestigate the possibility of adding air pre-heating, steam addition, etc.
Conclusions
Based on the results obtained during this study, following conclusions were drawn.
The fuel properties of rubber wood used in this study were in acceptable limits.
There was a clear variation of performance of the gasifier with equivalence ratio for all three throatdiameters. Lower equivalence ratios gave better performance in terms of calorific value and cold gasefficiency.
Optimum equivalence ratios for each thoat diameter was found to be 0.356-0.360 and correspondinglower heating values of gas and cold gas efficiencies were 4.65-4.77 MJ/Nm3 and 71-73%respectively.
The specific gas production rates at the above optimum equivalence ratios were in the range of 2.87-2.91 Nm3/kg. But, higher specific gas production rates were obtained with higher equivalence ratios.
The difference of optimum performance of three throat diameters was not significant.
The variation of calorific value with ER was almost same for three throat diameters.
When specific gas production rate is concerned, 150mm and 175mm throats gave maximum specificgas production around 3.3 Nm3/kg at ER of 0.425. 125mm throat gave maximum specific gasproduction around 3.075 Nm3/kg and it was considerably lower than other two probably due tobridging of fuel as a result of inadequate throat size for chips used.
Out of three throat diameters used, 150mm throat exhibit higher cold gas efficiency compared to175mm when increasing ER and 125mm throat gave minimum performance due to low gasproduction.
Calorific value or cold gas efficiency and specific gas production are changing inversely proportionalmanner. The value of ER to be used is dependent on the type of application of the gas produced andengine characteristics. When large heat is required, low ER is to be used in which gas production isless. On the other hand when a large amount of gas is needed higher value of ER is recommended. Ifthe application is thermal, the efficiency at its optimum point was around 80% (Annexure 3).
The gas compositions obtained for three different throat diameters are comparable with typicalproducer-gas composition.
For analyzing the effect of fuel size, more trials should be done.
The exit gas temperature of the gasifier was around 250 °C and 1.653 kW waste heat is available forenergy efficient measures like air preheating. The economy should be investigate prior to application.
Approximately 2.583 kW is lost through char-ash at the maximum char-ash generation rate. Thischar-ash can be used as a soil conditioner or as charcoal.

Master of Science ThesisKTH School of Industrial Engineering and Management
Energy Technology EGI-2010-xxxDivision of xxx
SE-100 44 STOCKHOLM
Bibliography
Bergerson J. and Keith D., 2006. Life Cycle Assessment of Oil Sands Technologies. Alberta Energy Futures Project,Institute for Sustainable Energy, Environment, and Economy (ISEE), University Calgary.Central Bank of Sri Lanka, 2010. Annual report 2010.Chopra S. and Jain A. K., 2007. A Review of Fixed Bed Gasification Systems for Biomass, Agricultural EngineeringInternational: the CIGR Ejournal. Invited Overview No. 5. Vol. IX.Coovattanachai N., 1989. Biomass gasification research and field developments by the Prince of Songkla University, Thailand.Biomass, Vol. 18, pp. 241-271.Dogru M., Howrath, C. R., Akay, G., Keskinler, B., Malik, A. A., 2002. Gasification of hazelnut shells in adowndraft gasifier. Energy 27, pp 415–427.Food and Agriculture Organization, 1986. Wood gas as engine fuel. Forestry paper 72, Rome:, ISBN: 92-5-102436-7.Huisman G. H., 2001. Acceptance Test for Large Biomass Gasifiers. Netherlands: NOVEM, the Dutch Organisationfor Energy and Environment.International Energy Agency, 2008. World Energy Outlook, 75739, Paris Cedex 15, France.Iyer P. V. R., Rao T. R., Groover P. D. and Singh N. P., 2002. Biomass–Thermochemical Characterization,Chemical Engineering Department, Indian Institute of Technology, Delhi, pp. 9 – 16.Kaupp A. and Goss J.R., 1984. Small scale gas producer – engine systems. Deutsche zentrum furEntwicklungstechnologien, AschbornLucas C., 2003. Experimental Study on High Temperature Air/Steam gasification of Biomass in Updraft Fixed Bed batchType Gasifier. Stockholm : Royal institute of Technology, ISBN:91-7283-506-0.Maschio G., 1993. Production of Syngas from Biomass, Dipartimento di Chimica Industriale, Universitd di Messina,CP 29-98166 S (Agata di Messina, Italy).Pratik N. and Babu B. V., 2009. Experimental studies on producer gas generation from wood waste in a downdraft biomassgasifier, Bioresource TechnologySharma A. K., 2011. Experimental investigations on a 20 kWe, solid biomass gasification system, Biomass & Bioenergy 35,pp 421-428Siva Kumar S., Pitchandi K. And Natarajan E., 2008. Modeling and simulation of down draft wood gasifier. Journalof Applied Sciences 8(2), pp 271-279Solar Energy Research Institute, 1988. Handbook of Biomass Downdraft Gasifier Engine Systems. Colorado: SolarTechnical Information Program, ISBN:91-7283-506-0.Stassen H.E.M. and Knoef H.A.M., 1993. Small scale gasification systems. The Netherlands: Biomass TechnologyGroup, University of Twente.Ummadisingu A., Sheth P. and Babu B. V., 2010. Experimental Studies on Gasification of Pine Wood Shavings in aDowndraft Biomass Gasifier, AIChEWaldheim L. and Nilsson T., 2001. Heating Value of Gases from Biomass Gasification. Report prepared for: IEABioenergy AgreementZainal Z.A., Rifau A., Quadir G.A. and Seetharamu K.N., 2002. Experimental Investigation of a DowndraftBiomass Gasifier. Biomass & Bioenergy 23, pp 283-289.Zuberbuhler U., 2005. Gasification of biomass – an overview on available technologies, 1st European summer school onrenewable motor fuels, Germany.

-43-
Annexure 1: Comparison of gas compositions
When considering chemistry of gasification following reactions has to be considered.
C + CO2 2CO (Endothermic Boudouard reaction)
C + H2O CO + H2 (Endothermic water – gas reaction)
CO + H2O CO2 + H2 (Exothermic water shift reaction)
C + 2H2 CH4 (Exothermic methane formation reaction)
CO + 3H2 CH4 + H2O Not predominant at low pressure and
CO2 + 4H2 CH4 + 2H2O without catalysts
All the CO formation reactions are endothermic and therefore high temperatures favour CO formation. H2
formation is governed not only by water – gas reaction and water shift reaction, but also by CH4 formationreactions which will be discussed later. At low temperatures, H2 will be formed by water shift reaction but will beconsumed for methane formation. Therefore, higher H2 content in the producer gas also can be seen at hightemperatures which predominant water – gas reaction.
Figure A1.1 – A1.3 represents the variation of H2, CO, CO2 and N2 content of producer gas with ER for threethroat diameters.
Fig. A1.1: Variation of composition of gas with ER for throat diameter 125mm

-44-
Fig. A1.2: Variation of composition of gas with ER for throat diameter 150mm
Fig. A1.3: Variation of composition of gas with ER for throat diameter 175mm
Relating to Fig. A1.1 – A1.3, CO2 and H2 have similar trends while CO has opposite trend to CO2 and H2 in allcases. Therefore, we can assume that exothermic water shift reaction is predominant in the reduction zone. Thismay be due to considerably low temperature in that zone.

-45-
The presence of considerable amount of CO2 in producer gas is mainly due to short residence time, moderatetemperatures and small reduction zone in down draft gasifiers. (Kaupp & Goss, 1984)
Figure A1.4 – A1.6 represents the variation of CH4, C2H4 and C2H6 content of producer gas with ER for threethroat diameters.
Fig. A1.4: Variation of hydrocarbon content of gas with ER for throat diameter125mm
Fig. A1.5: Variation of hydrocarbon content of gas with ER for throat diameter150mm

-46-
Fig. A1.6: Variation of hydrocarbon content of gas with ER for throat diameter175mm
Similar trends of CH4 and C2H4 were obtained for all throat diametes. C2H6 formation was seen very rarely andin very small amount.
Theoritically, exothermic CH4 formation is predominent at low temperatutes according to following reaction.
C + 2H2 CH4 (Exothermic methane formation reaction)
Considerable CH4 and C2H4 content of producer gas may be due to considerably low temperature in thereduction zone.
Very low pressure nearly 1 atm can not give high CH4 yield and at temperatures above 1000°C CH4 does notexist (Kaupp & Goss, 1984).
Since the heating values of hydrocarbons (in this case CH4, C2H4, C2H6) are very high, even very small amountwill increase the heating value of producer gas considerably.
Figure A1.7 represents the variation of LHV of producer gas with Total Hydro Carbon (THC) content ofproducer gas for throat diameter 125 mm. THC is approximated by 95% of CH4 anf 5% of C2H6 (Kaupp &Goss, 1984).

-47-
Fig. A1.7: Variation LHV of producer gas with THC
It can be seen that LHV of producer gas is directly proportional to the THC content.

-48-
Annexure 2: Comparison of char – ash generation
Figure A2.1 – A2.3 represents the variation of char-ash generation with ER for three throat diameters.
Fig. A2.1: Variation of char-ash generation with ER for throat diameter 125mm
Fig. A2.2: Variation of char-ash generation with ER for throat diameter 150mm

-49-
Fig. A2.3: Variation of char-ash generation with ER for throat diameter 175mm
Char-ash generation shows similar trens for three throat diameters which rises up initially with ER and reachesto a maximum at a certain ER and comes down again.
At low ER values higher calorific values were seen as a result of higher char reactivity (low char-ash production).When ER is increased, calorific value was dropped as char-ash production got increased. When increasing theER further, char – ash production was less, but consequently some producer gas burns increasing thetemperature while further reducing the calorific value of producer gas.

-50-
Annexure 3: Thermal efficiency of the gasifier
Thermal application of gasifier is another important area we can look in to. In Sri Lanka, major use of producergas in thermal application is in crematoria. In thermal applications, producer gas gives blue colour flame asindicated in Fig. A3.1
Fig. A3.1: Flame obtained with producer gas
When dealing with thermal applications, thermal efficiency of the gasifier gives a better idea on its viability.
Thermal efficiency of the gasifier can be calculated by following equation.
(FAO, 1986)……………………………… (A3.1)Where,
= 1.3 (Maschio G., 1993)
= 1.45 kJ/kg K (Maschio G., 1993)
The equation can be rearranged as,

-51-
For air flow setting 1 of throat diameter 150 mm which gives the highest performance in terms of cold gasefficiency and calorific value of gas;
Substituting above values;