optimization of the c3mr cycle with genetic algorithm · optimization of the c3mr cycle with...
TRANSCRIPT

OPTIMIZATION OF THE C3MR CYCLE WITH GENETIC ALGORITHM
Hamidreza Taleshbahrami, Hamid SaffariLNG Research Laboratory, School of Mechanical Engineering, Iran University of Science and Technology,
Tehran, Iran
E-mail: [email protected]; [email protected]
Received April 2010, Accepted November 2010No. 10-CSME-18, E.I.C. Accession 3181
ABSTRACT
The aim of this paper is thermodynamic simulation and optimization of the C3MR systemwith Genetic Algorithm. For this purpose, in the first step, the Peng Robinson equation of stateis simulated with a code in MATLAB and then used for simulating thermodynamic propertiesof natural gas and refrigerants that are used in the cycle. Following that the cycle isthermodynamically simulated and composite curves for subcooling and liquefaction heatexchangers are plotted. If composite curves in heat exchangers approach, the total power willdecrease. Then, the total power used by the compressors is calculated. In the next step, thethermodynamic modeling is linked with Genetic Algorithm and the total power consumed bycompressors is defined as objective function. The best value resulted from optimization has 23%lower power than the base design. In addition, heat exchange curves closed together.
Keywords: LNG; Optimization; C3MR; Genetic Algorithm.
OPTIMISATION DU CYCLE C3MR PAR LE MOYEN D’ALGORITHMESGENETIQUES
RESUME
Cet article s’interesse a la simulation et l’optimisation d’un systeme par le moyend’algorithmes genetiques. Pour arriver a notre objectif, nous simulons la premiere equationd’etat de Peng Robinson a l’aide d’un code dans MATLAB, et ensuite nous l’utilisons pour lasimulation des proprietes thermodynamiques de gaz naturel et de refrigerants qui sont utilisespendant le cycle. Par la suite, le cycle est simule, et les courbes composites pour la surfusion et laliquefaction des echangeurs de chaleur sont definies. Si des courbes composites dans lesechangeurs de chaleur s’approchent, la valeur de la puissance totale diminuera. Ainsi lapuissance totale utilisee par les compresseurs est calculee. Dans l’etape suivante, le modelethermodynamique est relie par des algorithmes genetiques et la puissance totale consommee parles compresseurs est definie comme fonction objective. Le resultat de la valeur optimale del’optimisation est de 23% moindre que dans la conception de base.
Mots-cles: LNG; optimisation; C3MR; algorithmes genetiques.
Transactions of the Canadian Society for Mechanical Engineering, Vol. 34, No. 3–4, 2010 433

1. INTRODUCTION
The use of energy resources with less or no influence on air pollution and environment isrequired and the rational use of available energy is recommended [1,2]. Liquefied natural gas(LNG) is known as a clean energy source that is commonly used as domestic and industrial fuelfor combustion. LNG is composed of 85–99% methane by mole fraction, a few percent ethane,and propane depending on its production site. Since moisture and sulphur are contained in crudenatural gases, they should be removed during the liquefying pre-process. Natural gas is widelyused in electricity generation and daily living for its friendly environmental performance [3].
Since the first LNG trade in 1964, the global LNG trade has observed a continuously rapidgrowth, mainly because the transformation from natural gas to the LNG reduces its volume byabout 600-fold and thus facilitates the transfer conveyance from the gas source to receivingterminal. During the liquefying process, a large amount of mechanical energy is consumed inrefrigeration process, approximately 500 kWh electric energy per ton LNG; so LNG contains aconsiderable portion of the energy and exergy invested in this process (cryogenic energy) [4].
Studies on the operation of complex vapor compression cycles, like the one used for theproduction of LNG, are not widely reported in the open literature [5]. Most low temperatureprocesses feature one or more refrigeration cycles with the purpose of removing heat fromsubambient hot streams. The provision of a cryogenic cooling requires significant powerdemands for compression and it is very important to achieve high-energy efficiency in the designand operation of refrigeration cycles, leading to low carbon emissions into the environment. Ina simple system with a closed refrigeration cycle, the heat is removed by vaporization of a low-pressure refrigerant, which is then compressed and condensed at a higher pressure against awarmer cold utility or heat sink. The condensed liquid is let down in pressure (and temperature)by means of an expanding device such as a throttle valve. When cooling for a wide temperaturerange is required, a complex arrangement (for example, a cascade cycle or a cycle with
Nomenclature
a attraction parameter (MPam6
kmol22)b molecular co-volume para-
meter (m3 kmol21)h specific enthalpy (J/kg)k binary interaction parameter_mm mass flow rate (kg/s)
p pressure (MPa)Q heat transfer, WR universal gas constant (8.314 6
21023 MPam3 kmol21 K21)T temperature (K)v volume (m3 kmol21)W net power output, Wx liquid phase composition (also
phase composition)y vapour phase composition
Greek symbols
v acentric factorf partial fugacity coefficient
Subscripts
c criticali,j components i and ji inputo outputMR1 mixed refrigerant is used in
liquefaction
MR2 mixed refrigerant is used insubcooling process
Superscripts
V vapourl liquid
Transactions of the Canadian Society for Mechanical Engineering, Vol. 34, No. 3–4, 2010 434

multilevel cooling) is introduced to improve thermodynamic efficiency of the refrigerationsystems [6]. On the other hand, using Mixed Refrigerant (MR) in the refrigeration cyclesprovides very promising potential to yield more efficient, yet simple and reliable systems incomparison to pure refrigerant ones because a mixture of refrigerants is evaporated isobarically,not at a single but in a range of temperatures. Although there are important ‘‘natural’’applications for MR cycles (e.g., LNG), their optimal design has not been the object ofextensive research as in the case of pure refrigerant systems [6].
A liquefaction process of natural gas has been optimized in peak shaving plant using GeneticAlgorithm (GA) [7]. However, peak shaving plants had a relatively low load and used in specialseasons in year. The aim of this paper is the thermodynamic simulation and optimization of theC3MR system with GA. For reaching this goal, first Peng Robinson equation of state issimulated. Then, it was used for simulating the properties of natural gas and the refrigerantsthat are used in the cycle. Then, the cycle is thermodynamically simulated and composite curvesfor subcooling and liquefaction heat exchangers and the total power used by the compressorsare calculated. Then, the thermodynamic modeling is linked with Genetic Algorithm. Theoptimization algorithm is explained. The constraint of 3uC is applied for the minimum distancebetween hot and cold composite curves.
2. MR SYSTEMS
Increasing concerns about greenhouse effects on climate and ecological problem by certainchlorofluorocarbon (CFC)-based refrigerants, have forced the refrigeration-based industries todirect the research trends in search of alternative refrigerants and alternative technologies [8].Using mixed refrigerants is a choice to replace the environmentally harmful CFCs [9].Achievement of high energy efficiency in MR systems have been shown [9,10].
A MR system uses a mixture as the refrigerant rather than several pure refrigerants as inconventional multistage or cascading refrigeration systems [12]. In contrast to pure refrigerants,mixed refrigerants evaporate and condense in a range of temperature at a constant pressure.The composition of the mixture is selected such that the liquid refrigerant evaporates over atemperature range similar to that of the process cooling demand. A mixture of hydrocarbons(usually in the C1-C4 range) and nitrogen (because of its low critical temperature) is usuallyused to achieve the desired refrigerant characteristics in natural gas liquefaction (e.g., closematching of the hot and cold composite curves, with small temperature driving forces over thewhole temperature range) for the specific refrigeration demand. If the temperature drivingforces are very small, then the operation will approach a reversible operation, a higherthermodynamic efficiency, and a lower power requirement. In addition, a MR system, unlikepure cascade cycles, has a simpler machinery configuration and fewer maintenance problems.Several variations and applications of mixed-component refrigerant have been introduced[12–14]. Some references showed that MR systems have more efficiency than turbo-expandersystems in natural gas liquid (NGL) recovery processes [15]. Duvedi et al. [16] used a mixed-integer nonlinear programming approach for the design of refrigerant mixtures that have thedesired attributes. However, the approach was limited to a small number of refrigerantcomponents, and the assumptions made in the MINLP model were far from realistic. In thedesign of MR systems, we need to be concerned not only about the minimization of energy andcapital costs, but also about the temperature profiles of the evaporation and condensationprocesses. Usually, the temperature approach within the heat exchangers of MR systems is assmall as 1uC to 3uC.
Transactions of the Canadian Society for Mechanical Engineering, Vol. 34, No. 3–4, 2010 435

3. MODELING
The simplified diagram of the C3MR cycle is shown in Fig. 1. The cycle is composed of threesubcycles. The first is the precooling process in which Crude Gas (133–134) and MR1 (221–222)and MR2 (233–234) refrigerant are precooled. The refrigerant of the subsycyle is Propane. Inthe second subcycle, i.e., liquefaction process, Crude Gas (134–135) is liquefied and the MR2
(234–235) is precooled again. Finally, in third subcycle, i.e., the subcooling process Crude Gas issubcooled and exit as LNG (136–137). MR1 is composed of Methane, Ethane, and Propane andMR2 is composed of Methane, Ethane, and Nitrogen. In this paper, the C3MR cycle isthermodynamically modeled and then simulated by a code in MATLAB software.
One major step in the thermodynamic modeling is simulating of material properties. Forthermodynamic properties simulation, various methods are proposed. Many researchers havestudied equation of state (EoS) for refrigerant mixtures [17, 18]. However, they are not widelyused and their correctness is not verified. One of the best-improved equations of states is Peng-Robinson EoS [19] and many researchers have studied and improved it. In this paper, this EoShas been used.
P~RT
v{b{
a Tð Þv vzbð Þzb v{bð Þ , ð1Þ
Fig. 1. Simplified diagram of the C3MR cycle.
Transactions of the Canadian Society for Mechanical Engineering, Vol. 34, No. 3–4, 2010 436

a Tcð Þ~0:45724R2T2
Pc
, ð2Þ
b Tcð Þ~0:07780RTc
Pc
, ð3Þ
a(T)~a(Tc):a(Tr,v), ð4Þ
b(Tc)~b(Tc), ð5Þ
Where a Tr,vð Þis a dimensionless function of reduced temperature and acentric factor andequals unity at the critical temperature.
a1=2~1zk 1{Tr1=2
� �, ð6Þ
k~0:37464z1:54226v{0:26992v2, ð7Þ
The mixture equilibrium calculations can be carried out by solving the followingsimultaneous equations:
Tl~Tv, ð8Þ
Pl~Pv, ð9Þ
xiQli~yiQv
i , ð10Þ
The fugacity coefficients are calculated using the Peng-Robinson EoS equation. The system isassumed to operate at steady state and the refrigerant flow leaving one component is sameconditions as the one entering the next one. The kinetic and potential energies are negligible andthus they are not considered. The system is adiabatic and thus the heat is only exchanged byheat exchangers. In addition, it is supposed that natural gas has a constant mixture through thecycle. The throttling process is supposed to be adiabatic so the inlet total enthalpy is equal withthe exit one. The pressure drop in the heat exchangers was assumed zero.
For the thermodynamic analysis of the system, the principles of mass conservation, the firstand the second laws of thermodynamics are applied to each components of the system in asimilar manner used by Lee [20]. Each component can be treated as a control volume with inletand outlet streams and heat transfer and power interactions. In the system, mass conservationincludes the mass balance of total mass and each material of the solution.
Transactions of the Canadian Society for Mechanical Engineering, Vol. 34, No. 3–4, 2010 437

The governing equation of mass conservation for a steady state and steady flow system is:
X_mmi{
X_mmo~0 ð11Þ
The first law of thermodynamics yields the energy balance of each component of the systemas follows:
X_mmhð Þi{
X_mmhð Þoz
XQi{
XQo
" #zW~0 ð12Þ
The above equation yields the energy balance of each component (each component can betreated as a control volume with inlet and outlet streams, heat transfer and power interactions)of the system.
4. VALIDATION
Considering the mentioned assumptions, the system was modeled with a code in MATLABH.For confidence from the correctness of the code, we modeled the cycle in the HysysH software[21] at the same condition and then compared their results. For this purpose, the conditions inTables 1 and 2 are taken into account.
After running the code and HysysH software, we got the results shown in Figs. 2–5. In thisstep the total power that was calculated by the code is nearly 196 Mw.
In Fig. 2, the refrigerant curve has a breakage point at 250uC. Refrigerant (MR1) is twophase from Q50 to this point. After this breakage, the refrigerant is single phase. Moreover, thehot stream curve (D) is the sum of the heat that exchanged from refrigerant to other streams inthis heat exchanger. In the breakage point, the distance between two curves is maximized. Thereis no temperature cross in this heat exchange process and this shows that the heat exchanger isdesigned properly. However, the distance between refrigerant curve and the total hot streamcurve is high and according to the second law of thermodynamic, it has an extra exergy loss.
Explanations for Fig. 3 are the same as Fig. 2. It seems that the heat exchange curves are closehere and this shows that the design of this heat exchanger is better than the former. In addition,the breakage point can be observed in this curve too.
Table 1. An example of mass flow rate.
Table 2. An example of mole fraction compositions.
Transactions of the Canadian Society for Mechanical Engineering, Vol. 34, No. 3–4, 2010 438

As it can be seen, the result of the code and HysysH software are nearly the same. Forcomparison of the distance between composite curves, we can integrate the area between the hotand the cold composite curves as Eq. (13)
A~X
i
h ið Þzh i{1ð Þð Þ T ið Þ{T i{1ð Þð Þ2
{X
j
C jð ÞzC j{1ð Þð Þ T jð Þ{T j{1ð Þð Þ2
ð13Þ
.
From Table 3, it can be seen that the result of HysysH and the code are nearly the same.
Fig. 2. Composite curves for the liquefaction heat exchanger calculated by the code beforeoptimization.
Fig. 3. Composite curves for the subcooling heat exchanger calculated by the code beforeoptimization.
Transactions of the Canadian Society for Mechanical Engineering, Vol. 34, No. 3–4, 2010 439

5. MODELING THE PROBLEM AND GENETIC-BASED OPTIMIZATION
For optimization, first the total power used by the compressors of the cycle is defined as theobjective function. In addition, the goal is to minimize this function. The 11 unknown variablesare listed in Table 1 and Table 2. The optimization problem is of the NLP type and not all theformulation has been explicit (e.g., phase equilibrium and physical property calculations).
There are many calculus-based methods including gradient approaches to search for mostlylocal optimum solutions and these are well documented in the literature [22, 23]. However, somebasic difficulties in the gradient methods such as their strong dependence on the initial guess cancause them to obtain a local optimum rather than a global one. This has led to other heuristicoptimization methods, particularly genetic algorithms (GAs) being used extensively during thelast decade. Genetic algorithms [24, 25] are highly robust and efficient search and optimizationmethods; they draw inspiration from natural selection and evolution for finding the global
Fig. 5. Composite curves for the subcooling heat exchanger calculated by HysysH beforeoptimization.
Fig. 4. Composite curves for liquefaction heat exchanger calculated by HysysH before optimization.
Transactions of the Canadian Society for Mechanical Engineering, Vol. 34, No. 3–4, 2010 440

optimum. They have been applied to various scientific disciplines including materials science foralloy microstructure and process optimization [26–30].
The evolution starts from a population of randomly generated chromosomes and happens ingenerations. In each generation, every individual is evaluated by measuring its fitness function(total power used by compressors) in the population and assigning a score to it. Based upontheir fitness, multiple individuals are stochastically selected from the current population to formthe next population of n52 individuals. To create the next generation, new individuals, calledoffspring, are formed by either merging two chromosomes from the current generation using acrossover operator or modifying a chromosome using a mutation operator. The crossoveroperator takes two selected individuals and combines them about a crossover point therebycreating two new individuals. The mutation operator randomly modifies the genes of achromosome, introducing further randomness into the population. The cycle restarts by theformulation of a new generation by selection and according to the fitness values, some of thebest parents and offspring are kept whereas the others are rejected to keep the population sizeconstant. The algorithm ends when either a maximum number of generations have beenproduced or a satisfactory fitness level has been reached.
5.1 Optimization ProblemsThe main problem in optimization is the temperature cross. This violates the second law of
thermodynamics. Consider Table 1 as the inputs for mass flows and Table 4 for mixtures. Thesimulation result for subcooling heat exchanger is shown in Fig. 6.
It can be seen from Fig. 7 that the temperature cross occurs at near 2150 uC. As it wasmentioned this violates second law of thermodynamics. As we like to minimize the exergy lossin the heat exchangers, the distance between two cures should be minimized. But according toEq. 14 with a known U and Q when the DTm decreases A increases and this increases the cost.
Q~UADTm ð14Þ
According to this equation, if DTm limits to zero, then A will limit to infinity. But in practicethis cannot happen. For overcoming this problem, some studies have proposed a minimum
Table 3. The integration results.
Table 4. Refrigerant compositions for a sample temperature cross.
Transactions of the Canadian Society for Mechanical Engineering, Vol. 34, No. 3–4, 2010 441

temperature difference for example 3uC [16]. We follow this procedure and define the minimumtemperature difference of 3uC as a constraint for genetic algorithm. As it was mentioned, thegoal is minimization of total power. For this purpose, each member of the population in thegenetic algorithm must satisfy the following constraints:
1. The total heat exchange curves must not cross.
2. After satisfying first constraint, the minimum temperature difference between total heatexchange curves must be more than 3uC.
Some individuals do not satisfy the first constraint, for example like the one shown in Fig. 7.For the second constraint, consider Table 5 as a population. The simulation result for theliquefaction and subcooling heat exchangers are shown in Figs. 8 and 9.
Fig. 7. Composite curves for a sample temperature cross.
Fig. 6. Example for calculation of the area between hot and cold composite curves.
Transactions of the Canadian Society for Mechanical Engineering, Vol. 34, No. 3–4, 2010 442

6. RESULTS AND DISCUSSION
As has been mentioned, a single objective genetic algorithm is used for optimization of thesystem. In the present study, tournament selection, uniform crossover, and one-point mutationwere selected. The best parent is reproduced (copied) into the new population. After the new
Table 5. Input mass flow rate for an individual that does not satisfy first constraint.
Fig. 8. Composite curves for an individual that does not satisfy the second constraint in liquefactionprocess.
Fig. 9. Composite curves for an individual that does not satisfy the second constraint in subcoolingprocess.
Transactions of the Canadian Society for Mechanical Engineering, Vol. 34, No. 3–4, 2010 443

Table 6. Refrigerant composition for an individual that does not satisfy second constraint.
Fig. 10. The algorithm of optimization process.
Transactions of the Canadian Society for Mechanical Engineering, Vol. 34, No. 3–4, 2010 444

population is generated, GA checks if the best parent has been replicated. The size ofpopulation and maximum evolution generation are set to 1000 and 30, respectively. Probabilityof crossover and mutation are set to 0.5 and 0.005, respectively.
The first and second constraints (that is specified in Section 5.1) are not predictable so itcannot be defined as a constraint beforehand in the optimization process. A solution for thisproblem is, if the constraints are not satisfied, then the objective function should be replaced bya big value; therefore with evaluating the genetic algorithm the bad individuals will disappearand finally the best individual is found as the optimal value of their objective function. Maybenone of the individuals satisfies the two constraints in the initial steps. But in the evaluatingprocess, the individuals that satisfy these constraints are produced and the bad individuals areomitted. The algorithm of optimization process is shown in Fig. 10. We substituted 1000 MWfor bad individuals.
Fig. 11. Optimization process by GA for 1000 individuals.
Fig. 12. Composite curves in the liquefaction process for the best individual.
Transactions of the Canadian Society for Mechanical Engineering, Vol. 34, No. 3–4, 2010 445
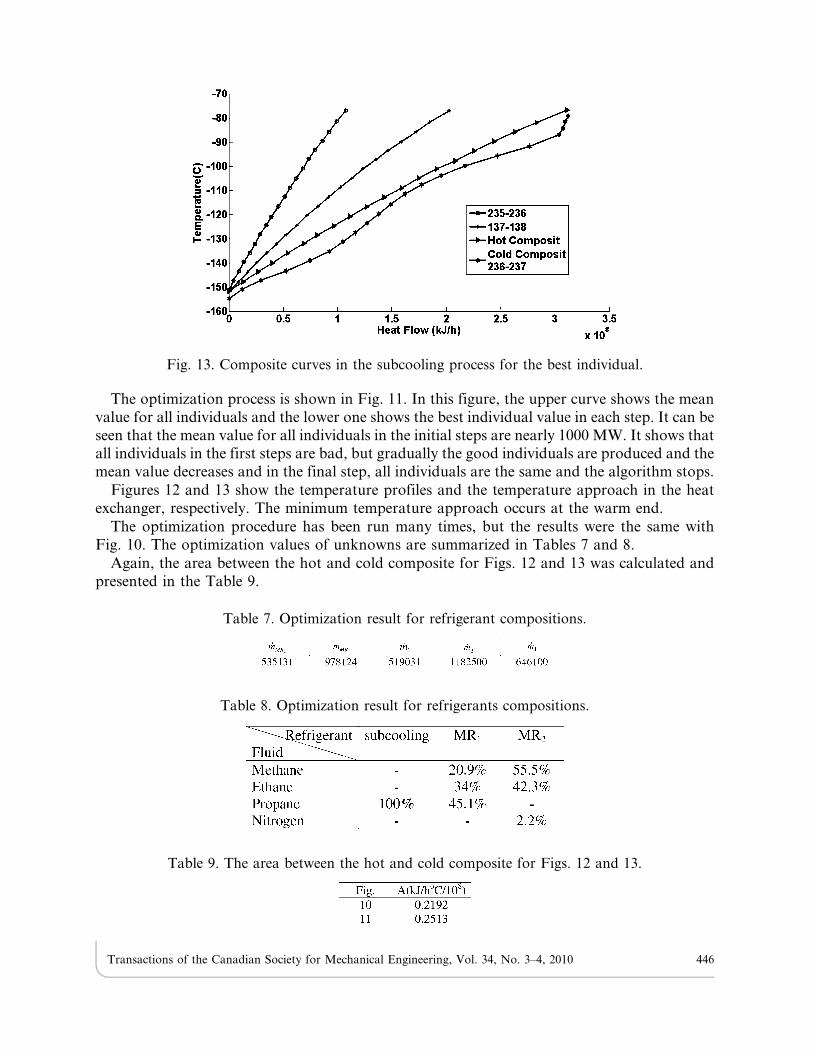
The optimization process is shown in Fig. 11. In this figure, the upper curve shows the meanvalue for all individuals and the lower one shows the best individual value in each step. It can beseen that the mean value for all individuals in the initial steps are nearly 1000 MW. It shows thatall individuals in the first steps are bad, but gradually the good individuals are produced and themean value decreases and in the final step, all individuals are the same and the algorithm stops.
Figures 12 and 13 show the temperature profiles and the temperature approach in the heatexchanger, respectively. The minimum temperature approach occurs at the warm end.
The optimization procedure has been run many times, but the results were the same withFig. 10. The optimization values of unknowns are summarized in Tables 7 and 8.
Again, the area between the hot and cold composite for Figs. 12 and 13 was calculated andpresented in the Table 9.
Fig. 13. Composite curves in the subcooling process for the best individual.
Table 7. Optimization result for refrigerant compositions.
Table 8. Optimization result for refrigerants compositions.
Table 9. The area between the hot and cold composite for Figs. 12 and 13.
Transactions of the Canadian Society for Mechanical Engineering, Vol. 34, No. 3–4, 2010 446

By comparing Tables 8 and 9, it can be seen that the area between cold and hot composite forliquefaction and subcooling heat exchangers decreased in the optimization process. Moreover,this shows that the hot and composite curves get close. When two curves approach, the heatexchange process becomes more reversible and this event influences the total function of thecycle. The result of Genetic Algorithm is shown in Fig. 11 and the total power decreased to149 MW, i.e., the total power is decreased by nearly 23%.
7. CONCLUSIONS
In this paper, a C3MR system was studied. First, the system was thermodynamically modeledin MATLAB software. The modeled system was linked with a GA code in the software. Heatexchangers composite curves were a good concept for optimization. It was then tried to makecomposite curves get closed. Composite curves crossed in sometimes. According to literature, aminimum margin of 3uC is used for optimization. This has been defined as a constraint for GA.Chromosomes were generated randomly and the fitness functions for the Chromosomes thatcould not satisfy the margin of 3uC, were replaced with 1000 MW. After 26 generations, the bestvalue did not change and the minimum power and the best individuals were obtained. The bestvalue obtained from optimization had 23% lower power than the base design.
REFERENCES
1. Miller, A.I. and Duffey, R.B., ‘‘Sustainable supply of global energy needs and greenhouse gasreductions,’’ Transactions of the Canadian Society for Mechanical Engineering, Vol. 33, No. 1,pp. 1–10, 2009.
2. Aliabadi, A.A. and Wallace, J.S., ‘‘Cost-effective and reliable design of a solar thermal powerplant,’’ Transactions of the Canadian Society for Mechanical Engineering, Vol. 33, No. 1, pp. 25–38,2009.
3. Lu, T. and Wang, K.S., ‘‘Analysis and optimization of a cascading power cycle with liquefiednatural gas (LNG) cold energy recovery,’’ Applied thermal Engineering, Vol. 29, No. 8–9,pp. 1478–1484, 2009.
4. Liu, M., Lior, N., Zhang, N. and Han, W., ‘‘Thermoeconomic analysis of a novel zero-CO2-emission high-efficiency power cycle using LNG coldness,’’ Energy Conversion and
Management, Vol. 50, No. 11, pp. 2768–2781, 2009.
5. Jensen, J.B., Skogestad, S., ‘‘Optimal operation of a mixed fluid cascade LNG plant,’’ Computer
Aided Chemical Engineering, Vol. 21, pp. 1569–1574, 2006.
6. Nogal, F.D., Kim, J.K., Perry, S. and Smith, R., ‘‘Optimal design of mixed refrigerant cycles,’’Industrial and Engineering Chemistry Research, Vol. 47, No. 22, pp. 8724–8740, 2008.
7. Mokarizadeh Haghighi Shirazi, M. and Mowla, D., ‘‘Energy optimization for liquefaction processof natural gas in peak shaving plant,’’ Journal of Energy, Vol. 35, No. 7, pp. 2878–2885, 2008.
8. Steed, J.M., ‘‘Present uses of chlorofluorocarbons and effects due to environment regulations,’’International Journal of Thermophysics, Vol. 10, No. 3, pp. 545–552, 1989.
9. Radermacher, R., ‘‘Thermodynamic and heat transfer implications of working fluid mixtures inRankine cycles,’’ International Journal of Heat Fluid Flow, Vol. 10, No. 2, pp. 90–102, 1989.
10. Lamb, R., Foumeny, E.A. and Haselden, G.G., ‘‘The use of wide boiling refrigerant mixtures inwater chiller units for power saving,’’ In The 1996 IChemE Research Event/Second European
Conference for Young Researchers, Institute of Chemical Engineers, 1996.
11. Bensafi, A. and Haselden, G.G., ‘‘Wide-boiling refrigerant mixtures for energy saving,’’International Journal of Refrigeration, Vol. 17, No. 7, pp. 469–474, 1994.
Transactions of the Canadian Society for Mechanical Engineering, Vol. 34, No. 3–4, 2010 447

12. Lee, G.C., Smith, R. and Zhu, X.X., ‘‘Optimal synthesis of mixed-refrigerant systems for low-temperature processes,’’ Industrial and Engineering Chemistry Research, Vol. 41, No. 20,pp. 5016–5028, 2002.
13. Perret, J.C., ‘‘Methods and apparatus for the cooling and temperature liquefaction of gaseousmixtures,’’ United States Patent 3364685, 1968.
14. Gaumer, L.S. and Newton, C.L., ‘‘Liquefaction of natural gas employing multiple – componentrefrigerants,’’ United States Patent 3593535, 1971.
15. MacKenzie, D.H. and Donnelly, S.T., ‘‘Mixed refrigerants proven efficient in natural-gasliquids recovery process’’, Oil and Gas Journal, Vol. 83, No. 9, pp. 116–126, 1985.
16. Duvedi, A. and Achenie, L.E.K., ‘‘On the design of environmentally benign refrigerantmixtures: A mathematical programming approach,’’ Computer and Chemical Engineering, Vol. 21,No. 8, pp. 915–923, 1997.
17. Patel, N.C. and Teja, A.S., ‘‘A new cubic equation of state for fluids and fluid mixtures,’’Chemical Engineering Science, Vol. 37, No. 3, pp. 463–473, 1982.
18. Lee, M.J. and Sun, H.C., ‘‘Thermodynamic property prediction for refrigerant mixtures,’’Industrial and Engineering Chemistry Research, Vol. 31, No. 4, pp. 1212–1216, 1992.
19. Peng, D.Y. and Robinson, D.B., ‘‘A new two-constant equation of state,’’ Industrial and
Engineering Chemistry Fundamentals, Vol. 15, No. 1, pp. 59–64, 1976.20. Lee, G.C., ‘‘Optimal design and analysis of refrigeration systems for low temperature
processes,’’ PhD Thesis, UMIST, UK, 2001.21. http://www.aspentech.com.22. Arora, J.S., Introduction to Optimum Design, McGraw-Hill, 1989.23. Rao, S.S., Engineering Optimization: Theory and Practice, 3 ed., Wiley, 1996.24. Goldberg, D.E., Genetic algorithms in search, Optimisation and Machine Learning, 1 set ed.,
Addison-Wesley, MA, 1989.25. Srinivas, M. and Patnaik, L.M., ‘‘Genetic algorithm: a survey,’’ IEE Computer, Vol. 27, No. 6,
pp. 17–26, 1994.26. Chakraborti, N., ‘‘Genetic algorithms in materials design and processing,’’ International
Materials Reviews, Vol. 49, No. 3–4 , pp. 246–260, 2004.27. Ganguly, S., Datta, S., and Chakraborti, N., ‘‘Materials and manufacturing processes genetic
algorithms in optimization of strength and ductility of low carbon steels – materials andmanufacturing processes’’ Materials and Manufacturing Processes, Vol. 22, No. 5, pp. 650–658,2007.
28. Kulkarni, A.J., Krishnamurthy, K., Deshmukh, S.P. and Mishra, R.S., ‘‘Microstructuraloptimization of alloys using a genetic algorithm,’’ Materials science & engineering. A, Structural
materials: properties, microstructure and processing, Vol. 372, No. 1–2, pp. 213–220, 2004.29. Mahfouf, M., Jamei, M. and Linkens, D.A., ‘‘Optimal design of alloy steels using multi
objective genetic algorithms,’’ Materials and Manufacturing Processes, Vol. 20, No. 3, pp. 553–567,2005.
30. Song, R.G. and Zhang, Q.Z., ‘‘Heat treatment technique optimization for 7175 aluminium alloyby an artificial neural network and a genetic algorithm,’’ Journal of Materials Processing
Technology, Vol. 117, No. 1, pp. 84–88, 2001.
Transactions of the Canadian Society for Mechanical Engineering, Vol. 34, No. 3–4, 2010 448