optimization of enzymatic hydrolysis of tilapia muscle
TRANSCRIPT

Sains Malaysiana 43(11)(2014): 1715–1723
Optimization of Enzymatic Hydrolysis of Tilapia Muscle (Oreochromis niloticus) using Response Surface Methodology (RSM)
(Pengoptimuman Hidrolisis Berenzim bagi Otot Tilapia (Oreochromis niloticus) Menggunakan Kaedah Sambutan Permukaan)
JUMARDI ROSLAN, SITI MAZLINA MUSTAPA KAMAL*, KHAIRUL FAEZAH MD. YUNOS & NORHAFIZAH ABDULLAH
ABSTRACT
Fish protein hydrolysate was prepared from tilapia muscle using commercial Alcalase enzyme. Optimization of enzymatic hydrolysis process for preparing tilapia muscle protein hydrolysates (TMPH) was performed by employing central composite design (CCD) method of response surface methodology (RSM). O-phtaldialdehyde (OPA) method was employed to calculate the degree of hydrolysis (DH), which is the key parameter for monitoring the reaction of protein hydrolysis. The suggested model equation was proposed based on the effects of pH, temperature, substrate concentration and enzyme concentration on the DH. Optimum enzymatic hydrolysis conditions using Alcalase enzyme were obtained at pH7.5, temperature of 50oC, substrate concentration of 2.5% and enzyme concentration of 4.0%. Under these conditions, the highest value of the DH was achieved at 25.16% after hydrolysing at 120 min. The TMPH was further assessed for their nutritional value with respect to chemical and amino acid compositions. Molecular weight distributions of TMPH were characterized by SDS-PAGE. TMPH contains moderate amount of protein (28.14%) and good nutritive value with respect to the higher total amino acid composition (267.57 mg/g). Glutamic acid, aspartic acid and lysine were the most abundant amino acids present in TMPH with values 42.68, 29.16 and 26.21 mg/g, respectively. Protein hydrolysates from tilapia muscle containing a desirable peptide with low molecular weight which may potentially to be used as functional food products.
Keywords: Alcalase; degree of hydrolysis; enzymatic hydrolysis; response surface methodology; tilapia muscle
ABSTRAK
Protein ikan hidrolisat disediakan daripada otot tilapia dengan menggunakan enzim alkalase. Pengoptimuman proses hidrolisis berenzim untuk penyediaan protein hidrolisat otot tilapia (TMPH) dilakukan dengan menggunakan reka bentuk komposit berpusat (CCD) iaitu kaedah sambutan permukaan (RSM). Kaedah O-phtaldialdehid (OPA) telah digunakan untuk penentuan darjah hidrolisis (DH) yang merupakan kunci utama untuk memantau tindak balas hidrolisis protein. Model cadangan yang digunakan adalah berasaskan kepada kesan pH, suhu, kepekatan substrat dan kepekatan enzim ke atas DH. Keadaan hidrolisis optimum bagi enzim alkalase diperoleh pada pH7.5, suhu 50oC, kepekatan substrat 2.5% dan kepekatan enzim 4.0%. Pada keadaan ini, nilai tertinggi DH dicapai pada 25.16% selepas hidrolisis dijalankan selama 120 min. TMPH seterusnya diuji nilai nutrisinya berdasarkan kepada komposisi kimia dan asid amino. Taburan berat molekul TMPH dicirikan menggunakan SDS-PAGE. TMPH mengandungi kandungan protein yang sederhana (28.14%) serta nilai nutrisi yang baik berdasarkan kepada jumlah asid amino yang tinggi (267.57 mg/g). Asid glutamik, asid aspartik dan lisina merupakan asid amino yang paling banyak terkandung di dalam TMPH dengan nilai masing-masing adalah 42.68, 29.16 dan 26.21 mg/g. Protein hidrolisat daripada otot tilapia mengandungi peptida yang dikehendaki dengan berat molekul rendah yang berpotensi untuk digunakan sebagai produk makanan berfungsi.
Kata kunci: Alkalase; darjah kehidrolisisan; hidrolisis berenzim; kaedah sambutan permukaan; otot tilapia
INTRODUCTION
Tilapia is abundantly cultured in several parts of the world due to its special features such as fast-growing, tolerant to environmental changes and disease, as well as can provide an excellent source of protein. The composition of amino acid in the fish muscle is considerably high, particularly an essential amino acid which is the major factor determining the nutritional value of food protein (Venugopal et al. 1996). Beside of the basic function of fish protein, it can
also be converted into fish protein hydrolysates (FPH) which possess numerous functional properties including solubility, oil/water holding capacity, emulsifying, foaming and sensory properties (Kristinsson & Rasco 2000). One of the ways to convert fish proteins is through enzymatic hydrolysis which the properties of desired end products can be controlled (Benjakul & Morrissey 1997). Alcalase enzyme from microbial sources is found to be one of the highly efficient enzymes for the hydrolysis

1716
of fish proteins (Kristinsson & Rasco 2000) due to its ability to catalyze protein hydrolysis reaction with high degree of hydrolysis in a relatively short period (Aspmo et al. 2005). Several studies have shown that the use of different substrate can affect the alcalase enzyme to achieve higher degree of hydrolysis at different operating conditions (Adler-Nissen 1986; Benjakul & Morrisey 1997; Kristinsson & Rasco 2000; Shahidi et al. 1995). A wide range of alcalase enzyme working conditions indicate that there is a need to determine the optimal condition for each process parameter in order to achieve a good result. Hydrolysis of fish protein was monitored based on the DH which measured as the percentage of peptide bond cleaved. In most studies in the literature, the DH was measured using pH-stat method (Adler-Nissen 1986). However, this method has limitation in measuring DH value above 30% for single enzyme system and is only applicable for pH ranging from 7 to 9 (Adler-Nissen 1986). There are few studies reporting on the use of the pH-stat method to calculate the DH in hydrolyzing of tilapia muscle by alcalase enzyme (Abdul-Hamid et al. 2002; Foh et al. 2010; Shamloo et al. 2012). The normal conditions for producing fish protein hydrolysate from tilapia muscle were pH 8.0, 55-60oC, and 1-2% of enzyme concentration. At these conditions, the best degree of hydrolysis obtained after hydrolysed black tilapia muscle for 5 h was 14.9% (Abdul-Hamid et al. 2002). Shamloo et al. (2012) hydrolyzed tilapia muscle at the conditions of pH8, temperature of 60oC and 2% enzyme concentration for 5 h and obtained almost 20% of DH. Several methods have been developed to measure DH during protein hydrolysis and Trinitrobenzenesulfonic acid (TNBS) (Adler-Nissen 1979) and O-phthaldialdehyde (OPA) (Church et al. 1983) were found to be the most efficient methods for measuring DH directly based on the amino groups released during hydrolysis. However, no research has been reported on the optimization of enzymatic hydrolysis from tilapia muscle using both methods. Response surface methodology (RSM) was found to be effective in optimizing and monitoring food processes (Wangtueai & Noomhorm 2009). This paper will focus on using the OPA method for measuring the highest possible DH can be achieved during enzymatic hydrolysis from tilapia muscle. Therefore, the objective of this study was to optimize the enzymatic hydrolysis of tilapia muscle through optimization process using RSM and to characterize the fish protein hydrolysate produced in term of chemical and amino acid compositions and distribution of molecular weight using SDS-PAGE.
MATERIALS AND METHODS
SAMPLE PREPARATION
Fresh red tilapia (Oreochromis niloticus) with average weight about 400-500 g per fish was purchased from a local wet market in Selangor, Malaysia. Sample was transported
to the laboratory on ice. Fresh red tilapia was processed (washed, eviscerated and hand filleted) immediately upon arrival at the laboratory. Tilapia muscle (TM) was minced using a waring blender and then packed in polyethylene bags and freeze-stored at -20°C until further use.
ENZYMATIC HYDROLYSIS REACTION
Alcalase enzyme® 2.4 L (Novo Industry, Denmark) was used for conducting enzymatic hydrolysis reaction. The minced TM was thawed overnight in cold room (4oC). Then, TM was mixed with 50 mL of 50 mM buffer solution (pH6.5-8.5) at a desired substrate concentration (1.5-3.5% w/v). The mixture was then preincubated at the reaction temperature of 40-60oC for 20 min prior to the enzymatic hydrolysis reaction. The reaction was initiated by adding the Alcalase 2.4 L enzyme at a desired enzyme concentration (3.0-5.0% w/w) into the mixture. The enzyme concentrations were calculated based on the protein content in the substrate which was determined using the Kjeldahl method. The enzymatic hydrolysis was carried out for 120 min. After that, the reaction was terminated by heating in a water bath at 90°C for 15 min with occasional agitation. The mixture was cooled immediately in chilled water and then centrifuged at 10000 rpm for 20 min in a refrigerated high speed centrifuge. Supernatant was collected and the DH was determined.
DEGREE OF HYDROLYSIS
Degree of hydrolysis (DH) is a crucial parameter in monitoring protein hydrolysis reaction. DH is defined as the percentage of cleaved peptide bond:
DH = h/htot × 100 (1)
where, htot is the total number of peptide bonds in the substrate, and h is the number of hydrolyzed bonds. In the present study, the OPA method was used to measure DH, as described by Church et al. (1983) and Nielsen et al. (2001) with a slight modification. Basically, the OPA method involves the reaction between free amino groups and o-phtaldialdehyde (OPA) with the presence of β-mercapthoethanol. The colour changes in the solution can be detected using a spectrophotometer at 340 nm. The OPA reagent was prepared by dissolving 7.62 g sodium tetraborate decahydrate and 200 mg sodium dodecyl sulfate in 150 mL deionized water. The solution was then added with 160 mg o-phthaldehyde 97% in 4 mL ethanol. Later, 400 μL of β-mercaptoethanol was added into the solution and then made up to 200 mL by adding deionized water. This reagent was prepared daily. Meanwhile, 50 mg serine was prepared in 500 mL deionized water (0.9516 mmole/L) as a standard solution. A total of 400 μL of serine standard or protein hydrolysate was added with 3 mL OPA reagent and mixed for 5 s. The mixtures were incubated for 2 min at the room temperature and the absorbance at 340 nm was measured using a spectrophotometer.
1717
EXPERIMENTAL DESIGN FOR OPTIMIZATION
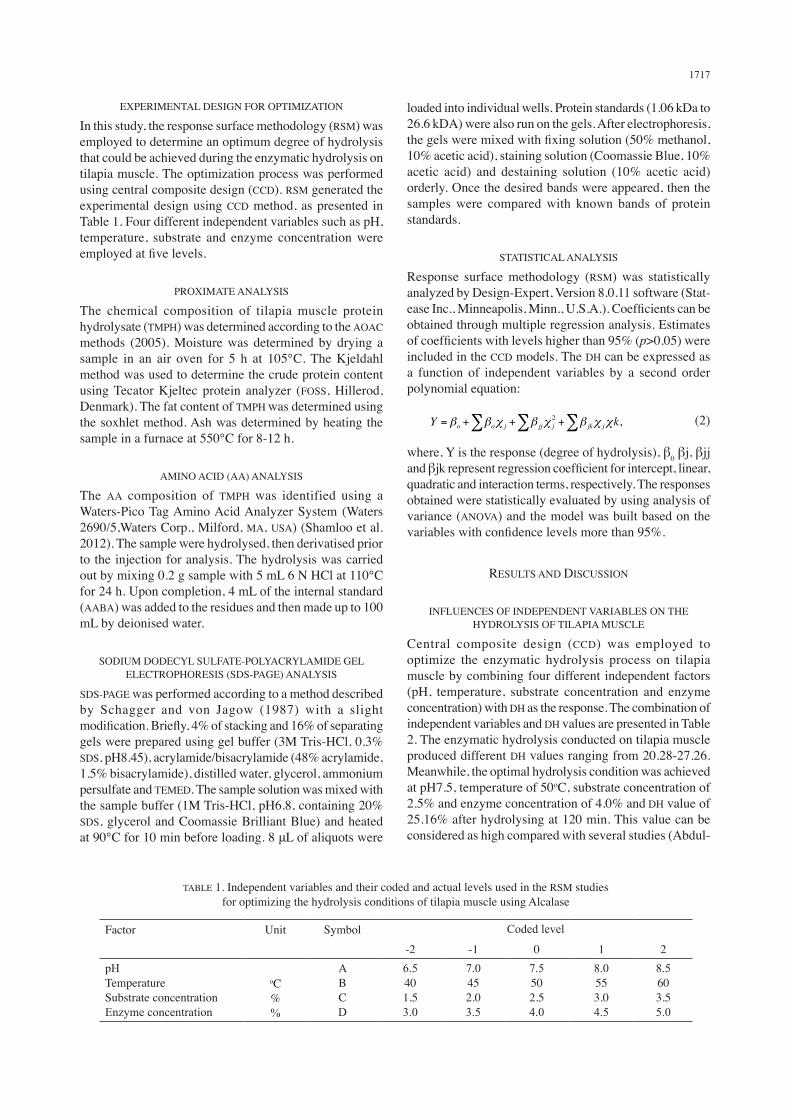
In this study, the response surface methodology (RSM) was employed to determine an optimum degree of hydrolysis that could be achieved during the enzymatic hydrolysis on tilapia muscle. The optimization process was performed using central composite design (CCD). RSM generated the experimental design using CCD method, as presented in Table 1. Four different independent variables such as pH, temperature, substrate and enzyme concentration were employed at five levels.
PROXIMATE ANALYSIS
The chemical composition of tilapia muscle protein hydrolysate (TMPH) was determined according to the AOAC methods (2005). Moisture was determined by drying a sample in an air oven for 5 h at 105°C. The Kjeldahl method was used to determine the crude protein content using Tecator Kjeltec protein analyzer (FOSS, Hillerod, Denmark). The fat content of TMPH was determined using the soxhlet method. Ash was determined by heating the sample in a furnace at 550°C for 8-12 h.
AMINO ACID (AA) ANALYSIS
The AA composition of TMPH was identified using a Waters-Pico Tag Amino Acid Analyzer System (Waters 2690/5,Waters Corp., Milford, MA, USA) (Shamloo et al. 2012). The sample were hydrolysed, then derivatised prior to the injection for analysis. The hydrolysis was carried out by mixing 0.2 g sample with 5 mL 6 N HCl at 110°C for 24 h. Upon completion, 4 mL of the internal standard (AABA) was added to the residues and then made up to 100 mL by deionised water.
SODIUM DODECYL SULFATE-POLYACRYLAMIDE GEL ELECTROPHORESIS (SDS-PAGE) ANALYSIS
SDS-PAGE was performed according to a method described by Schagger and von Jagow (1987) with a slight modification. Briefly, 4% of stacking and 16% of separating gels were prepared using gel buffer (3M Tris-HCl, 0.3% SDS, pH8.45), acrylamide/bisacrylamide (48% acrylamide, 1.5% bisacrylamide), distilled water, glycerol, ammonium persulfate and TEMED. The sample solution was mixed with the sample buffer (1M Tris-HCl, pH6.8, containing 20% SDS, glycerol and Coomassie Brilliant Blue) and heated at 90°C for 10 min before loading. 8 μL of aliquots were
loaded into individual wells. Protein standards (1.06 kDa to 26.6 kDA) were also run on the gels. After electrophoresis, the gels were mixed with fixing solution (50% methanol, 10% acetic acid), staining solution (Coomassie Blue, 10% acetic acid) and destaining solution (10% acetic acid) orderly. Once the desired bands were appeared, then the samples were compared with known bands of protein standards.
STATISTICAL ANALYSIS
Response surface methodology (RSM) was statistically analyzed by Design-Expert, Version 8.0.11 software (Stat-ease Inc., Minneapolis, Minn., U.S.A.). Coefficients can be obtained through multiple regression analysis. Estimates of coefficients with levels higher than 95% (p>0.05) were included in the CCD models. The DH can be expressed as a function of independent variables by a second order polynomial equation:
(2)
where, Y is the response (degree of hydrolysis), β0 βj, βjj and βjk represent regression coefficient for intercept, linear, quadratic and interaction terms, respectively. The responses obtained were statistically evaluated by using analysis of variance (ANOVA) and the model was built based on the variables with confidence levels more than 95%.
RESULTS AND DISCUSSION
INFLUENCES OF INDEPENDENT VARIABLES ON THE HYDROLYSIS OF TILAPIA MUSCLE
Central composite design (CCD) was employed to optimize the enzymatic hydrolysis process on tilapia muscle by combining four different independent factors (pH, temperature, substrate concentration and enzyme concentration) with DH as the response. The combination of independent variables and DH values are presented in Table 2. The enzymatic hydrolysis conducted on tilapia muscle produced different DH values ranging from 20.28-27.26. Meanwhile, the optimal hydrolysis condition was achieved at pH7.5, temperature of 50oC, substrate concentration of 2.5% and enzyme concentration of 4.0% and DH value of 25.16% after hydrolysing at 120 min. This value can be considered as high compared with several studies (Abdul-
TABLE 1. Independent variables and their coded and actual levels used in the RSM studies for optimizing the hydrolysis conditions of tilapia muscle using Alcalase
Factor Unit Symbol Coded level
-2 -1 0 1 2pHTemperature Substrate concentration Enzyme concentration
oC%%
ABCD
6.5401.53.0
7.0452.03.5
7.5502.54.0
8.0553.04.5
8.5603.55.0

1718
Hamid et al. 2002; Foh et al. 2010; Shamloo et al. 2012) which reported that the DH values obtained are in the range of 15-20% after hydrolysis for 5 h. This indicates the effectiveness of using the OPA method in measuring the DH that cannot be achieved using the pH-stat method. The model equation for DH, the response variable (Y) of TM, was derived using the regression coefficient of linear, quadratic and interaction terms to fit a full response surface model. RSM generates the response surface regression equation that can be expressed as follows:
Y = -166.87 + 35.16A + 0.60B + 5.35C + 12.61D – 2.06A2 – 0.008B2 + 0.17C2 - 0.34D2 + 0.07AB – 1.01AC – 0.89AD – 0.02BC – 0.07BD + 0.81CD
(3)
where, Y, A, B, C and D are DH, pH, temperature, substrate and enzyme concentration, respectively. The model was statistically evaluated using analysis of variance (ANOVA) to demonstrate which parameter would give a significant effect on DH. From ANOVA (Table 3), the model adequately represents the experimental data with a good R2 = 0.8878 and also shows a significant (p<0.05) value. According to
Joglekar and May (1987), R2 should be greater than 0.80 in order to obtain a good fit model. The ANOVA results also demonstrate that the linear model terms of (A), (C) and (D) have significant effect (p<0.05) and only (B) is not significant. The most significant effect is the linear term of enzyme concentration (D), followed by pH (A), and substrate concentration (C). Meanwhile, most quadratic coefficients (B2, C2 and D2) did not have significant effect (p>0.05) except for (A2). For the interaction coefficient, all of them (AB, AC, AD, BC, BD and CD) did not have significant effect (p>0.05). The lack of fit test was used to evaluate the fitness of the model. It was found that the P-values for the lack of fit test was not significant (p>0.05) indicating that the model was fitted for predicting enzymatic hydrolysis condition of tilapia muscle. A good fit means that the generated models adequately explain the data variation. The influences of the independent variables on the DH can be visualized through three-dimensional of the response surface and contour plots of the enzymatic hydrolysis conditions (Figures 1-3). Figure 1 shows the effects of temperature and pH on the DH during hydrolysis of tilapia muscle. In particular, DH was found to increase with the rise in temperature and pH value. DH reached the
TABLE 2. The actual levels of independent variables used in optimizing the hydrolysis condition of tilapia muscle using Alcalase with the observed values for the degree of hydrolysis (DH)
Run pH(A) Temperature(B) Substrate(C) Enzyme(D) DH
123456789101112131415161718192021222324252627282930
8.07.57.07.07.08.08.07.08.07.57.07.57.08.08.07.58.07.07.08.06.57.57.57.58.57.57.57.57.57.5
555055455545454555505550554555505545454550506050505050405050
2.02.53.02.02.02.03.03.03.02.52.02.53.02.02.02.53.02.03.03.02.52.52.52.52.52.53.52.51.52.5
4.54.03.53.53.53.54.54.54.54.04.54.04.54.53.54.03.54.53.53.54.04.04.03.04.04.04.04.04.05.0
25.9324.2523.1020.2821.3123.1126.2524.7526.8325.4522.9824.4725.4724.1225.1324.1724.0224.1421.9223.6822.1325.7525.4524.2725.9626.8926.3725.2026.1927.26

1719
maximum level at almost 50oC. However, DH exhibited a decreasing trend above the optimum level of temperature. High temperatures lead to a complete inactivation of Alcalase enzyme due to denaturation. According to Adler-Nissen (1986), Alcalase is active at the temperature ranging from 50-70oC. However, Table 3 demonstrates that the linear model term of temperature is not significant, suggesting that temperature has less effect on DH. Most optimization studies on the hydrolysis of fish using Alcalase have demonstrated that the optimum temperature was achieved at 55oC (Bhaskar et al. 2005; See et al. 2011) and 60oC (Amiza et al. 2011; Normah et al. 2005). The change in pH level affects both the substrate and enzyme by changing the charge distribution and conformation of the molecules. Figure 1 shows that the DH increased with
an increase in pH up to pH7.5. Beyond this level, the yield of DH would decrease. This was agreed with the working pH range of Alcalase is found at alkaline condition (pH 6-10) and several studies reported that hydrolysis of fish using Alcalase can reached an optimum pH condition at varies values within the ranges depending on substrate used (Amiza et al. 2011; Benjakul & Morrissey 1997; Bhaskar et al. 2008; See et al. 2011). Figure 2 shows the influences of enzyme concentration and pH level on the DH of tilapia muscle hydrolysis. The result showed that DH increased as the enzyme concentration increased. The optimum enzyme concentration for hydrolyzing tilapia muscle was achieved at 4% (w/w), with DH values ranging from 24-27%. Nonetheless, DH remains constant at
TABLE 3. Analysis of variance for the second order response surface model for the degree of hydrolysis (DH)
Source Sum of square Degree of freedom Mean square F value P valueModelABCDABACADBCBDCDA2
B2
C2
D2
ResidualLack of fitPure errorCor. Total
62.8421.622.053.67
23.800.561.020.78
0.0480.430.667.291.05
0.0520.207.946.241.70
85.36
1411111111111111
14104
29
4.49 21.62 2.05 3.67
23.80 0.56 1.02 0.78
0.048 0.43 0.66 7.29 1.05
0.052 0.200.570.620.42
7.9138.123.626.46
41.970.981.801.38
0.0850.761.16
12.851.85
0.0910.35
1.47
0.0002<0.0001 0.0778 0.0235
<0.0001 0.3393 0.2012 0.2595 0.7745 0.3991 0.3003 0.0030 0.1956 0.7676 0.5620
0.3779
R2 = 0.8878, A=pH, B=Temperature (oC), C=Substrate concentration (%) and D=Enzyme concentration (%)
FIGURE 1. Response surface graph for DH as a function of temperature and pH during the hydrolysis of tilapia muscle with alcalase

1720
enzyme concentration above this level. This findings indicates that there will be more chances for hydrolysis to occur at initial reaction until it reaches the optimum level (4% w/w) and when higher level of enzyme was added there would be no changes in the DH value. As presented in Table 3, enzyme concentration has the most significant effect on DH. However, 4% (w/w) of enzyme concentration can be considered as high when compared to other findings. DH is almost constant at 2% of enzyme concentration (Amiza et al. 2011; Normah et al. 2005; See et al. 2011). Figure 3 shows the three dimension plot for DH as a function of substrate concentration and pH. DH increases with an increase in substrate concentration. However, the effect of substrate concentration on DH was lesser as compared to enzyme concentration and pH.
OPTIMIZATION OF ENZYMATIC HYDROLYSIS
The optimum enzymatic hydrolysis condition was determined by three-dimension response surface and contour plots on DH (Figures 1-3). They were generated from some predicted data to illustrate the effects of independent variables (pH, temperature, substrate and
enzyme concentration). From (1), DH was shown to be influenced by enzyme concentration, pH and substrate concentration. The optimum enzymatic hydrolysis conditions for the maximum DH (namely, pH7.5, temperature of 50oC, 2.5% of substrate concentration (w/v) and 4% of enzyme concentration) were obtained using superimposed RSM (Figure 4).
VERIFICATION EXPERIMENT
The suitability of the model equation for predicting the optimum response value was tested using some selected optimum conditions (pH7.5, 50oC, 2.5% of substrate concentration and 4% of enzyme concentration. For instance, if the desirability value is close to 1.0, the suggested conditions are suitable to achieve the highest DH. The data from the validation experiment are presented in Table 4. The desirability value is 0.929 and the hydrolysis conditions selected at pH7.5, 50oC, substrate concentration of 2.5% and enzyme concentration of 4.0% to achieve the highest DH. The experimental DH was found to be in agreement with the predicted one. This result indicates that the model used is valid for predicting DH of TM.
FIGURE 2. Response surface graph for DH as a function of enzyme and pH during the hydrolysis of tilapia muscle with alcalase
FIGURE 3. Response surface graph for DH as a function of substrate and pH during the hydrolysis of tilapia muscle with alcalase

1721
PROXIMATE AND AMINO ACID COMPOSITIONS
The chemical compositions of TMPH were presented in Table 5. TMPH has moderate amount of crude protein with value of 28.14%. However, protein content in TMPH was lower compared with other fish protein hydrolysates obtained by several researchers (Foh et al. 2010; Kristinsson & Rasco 2000; Pacheco-Aguilar et al. 2008; Thiansilakul et al. 2007). Generally, crude protein content in fish protein hydrolysates was varied ranging from 60-90%. Ash was the major component in TMPH with value of 52.09%. High ash content in TMPH might be due to the addition of sodium phosphate buffer during the enzymatic reaction which is remained in the protein hydrolysate powder after freeze dried (Benjakul & Morrissey 1997; See et al. 2011). Lower moisture content was obtained in TMPH could be due to freeze drying process. Different moisture content values have been reported by several researchers for different fish muscle hydrolysate with values ranging from 1-9% (Foh et al. 2011; Kristinsson & Rasco 2000; Thiansilakul et al. 2007; Pacheco-Aguilar et al. 2008). Lower lipid content was found in TMPH due to the removal of lipid during hydrolysis process and assisted by using centrifuge to separate lipid and insoluble protein. Reduction in the lipid content was also reported in protein hydrolysate from several fish species such as round scad muscle (Thiansilakul et al. 2007), pacific whiting muscle (Pacheco-Aguilar et al. 2008) and atlantic salmon muscle (Kristinsson & Rasco 2000). Generally, the production of fish protein hydrolysate using alcalase enzyme would resulted in high protein recovery and low lipid content (Adler-Nissen 1986). As presented in Table 5, the highest AA compositions in TMPH were glutamic acid followed by aspartic acid,
lysine and leucine. Meanwhile, cysteine was the lowest AA compositions in TMPH. This finding was similar to the reports by several authors which showed that cysteine was the lowest amino acid in fish protein (Benjakul & Morrissey 1997; Bhaskar et al. 2008; See et al. 2011). Lysine and leucine were the highest essential amino acid in TMPH which indicates that TMPH could contribute significantly to the supply of essential amino acid in the diet. According to Bhaskar et al. (2008), the nutritive value of any ingredient depends on the proteins capacity to meet the requirements of organism based on the essential amino acids.
SDS-PAGE OF TILAPIA MUSCLE PROTEIN HYDROLYSATE
SDS-PAGE was used to evaluate the peptide molecular weight distributions of TMPH. There are a strong bands appear at molecular weight ranging between 1-14.2 kDa, which indicated that peptides with smaller size are feasible to be produced using alcalase enzyme when hydrolyzing in 120 min (Figure 5). Several studies have shown the ability of Alcalase enzyme to produce low molecular weight peptides at high degree of hydrolysis (Benjakul & Morrissey 1997; Lalasidis et al. 1978; Liaset et al. 2000). In producing fish protein hydrolysate with high nutritional values, it should be rich in low molecular weight of peptide with as low as possible amount of free amino acids (Bhaskar et al. 2008).
CONCLUSION
In this study, the production of fish protein hydrolysate from tilapia muscle was successfully carried out through an enzymatic hydrolysis using Alcalase enzyme. The
TABLE 4. Degree of hydrolysis (DH) observed during validation experiments using Alcalase and the corresponding predicted values for the DH
Run A B C D Desirability DH-Predicted DH-Experimental7.5 50.0 2.5 4.0 0.929 25.410 25.05 ± 0.18
A: pH, B: Temperature, C: Substrate concentration, D: Enzyme concentration and DH: Degree of hydrolysisAll data are expressed as means ± S. D (n=5)
FIGURE 4. Contour plot of the enzymatic hydrolysis on tilapia muscle as a function of temperature and

1722
enzymatic hydrolysis conditions of tilapia muscle were optimized using RSM through central composite design (CCD). CCD demonstrated that hydrolysis of tilapia muscle was greatly influenced by pH, temperature, substrate and enzyme concentration in order to achieve the optimal DH. The optimum DH value was found to be achieved at 25.16% when hydrolyzing at pH7.5, 50oC, 2.5% (w/v) substrate
concentration and 4.0% (w/w) enzyme concentration. TMPH has good nutritional value with respect to protein content and essential amino acid compositions. Low molecular weight compounds in TMPH can serve as a basis for future studies regarding the potential applications of this fish protein hydrolysate for human nutrition in functional foods.
ACKNOWLEDGEMENTS
The authors would like to acknowledge the financial support through the Research University Grant Scheme (RUGS, University Putra Malaysia) and Science Fund Research Grant from the Ministry of Science, Technology and Innovation (MOSTI), Malaysia.
REFERENCES
Abdul-Hamid, A., Bakar, J. & Bee, G.H. 2002. Nutritional quality of spray dried protein hydrolysate from Black Tilapia (Oreochromis mossambicus). Food Chemistry 78: 69-74.
Adler-Nissen, J. 1986. Enzymatic Hydrolysis of Food Proteins. Oxford, UK: Elsevier Applied Science Publishers.
Adler-Nissen, J. 1979. Determination of the degree of hydrolysis of food protein hydrolysates by trinitrobenzenesulfonic acid. Journal of Agricultural and Food Chemistry 27(6): 1256-1262.
TABLE 5. Proximate and amino acids composition of TMPH
Nutritional composition Tilapia muscle protein hydrolysate (TMPH)Chemical composition (%) Moisture content Crude protein
Lipid Ash
9.54± 0.1328.14± 0.440.07± 0.03
52.09± 0.49Amino acid composition (mg/g) Aspartic acid Glutamic acid Serine Glycine Alanine Cysteine Tyrosine Arginine Proline Valine* Methionine* Isoleucine* Leucine* Phenylalanine* Histidine* Lysine* Threonine* Total amino acids Essential amino acids Hydrophobic amino acids
19.71 ± 0.1529.49 ± 0.637.74 ± 0.028.64 ± 0.07
11.85 ± 0.130.38 ± 0.017.87 ± 0.08
12.04 ± 0.086.75 ± 0.08
11.30 ± 0.106.75 ± 0.04
10.33 ± 0.0016.44 ± 0.068.79 ± 0.017.58 ± 0.24
19.74 ± 0.018.06 ± 0.01
193.41 ± 0.33a
88.97 ± 0.11a
81.95 ± 0.07b
All data are expressed as the mean ± S. D (n=2)*Essential amino acid.Means within each row sharing same upper case were not significantly different (p>0.05)
FIGURE 5. SDS-PAGE analysis on tilapia muscle protein hydrolysate

1723
Amiza, M.A., Nurul Ashikin, S. & Faazaz, A.L. 2011. Optimization of enzymatic protein hydrolysis from silver catfish (Pangasius sp.) frame. International Food Research Journal 18: 775-781.
Association of Official Analytical Chemists (AOAC). 2005. Official Methods of Analysis. 16th ed. Washington DC, USA: AOAC Inc.
Aspmo, S.I., Horn, S.J. & Eijsink, V.G.H. 2005. Enzymatic hydrolysis of Atlantic cod (Gadus morhua L.) viscera. Process Biochemistry 40: 1957-1966.
Benjakul, S. & Morrissey, M.T. 1997. Protein hydrolysates from pacific whiting solid wastes. J. Agric. Food Chem. 45: 3423-3430.
Bhaskar, N., Benila, T., Radha, C. & Lalitha, R.G. 2008. Optimization of enzymatic hydrolysis of visceral waste proteins of Catla (Catla catla) for preparing protein hydrolysate using a commercial protease. Bioresource Technology 99: 335-343.
Church, F.C., Swaisgood, H.E., Porter, D.H. & Catignani, G.L. 1983. Spectrophotometric assay using o-phthaldialdehyde for determination of proteolysis in milk and isolated milk proteins. Journal of Dairy Science 66: 1219-1227.
Foh, M.B.K., Qixing, J., Amadou, I. & Xia, W.S. 2010. Influence of ultrafiltration on antioxidant activity of tilapia (Oreochromis niloticus) protain hydrolysate. Advanced Journal of Food Science and Technology 2(5): 227-235.
Joglekar, A.M. & May, A.T. 1987. Product excellence through design of experiments. Cereal Foods World 32(12): 857-868.
Kristinsson, H.G. & Rasco, B.A. 2000. Biochemical and functional properties of Atlantic Salmon (Salmo salar) muscle proteins hydrolyzed with various alkaline proteases. Journal of Agricultural and Food Chemistry 48: 657-666.
Lalasidis, G., Bostrom, S. & Sjoberg, L.B. 1978. Low molecular weight enzymatic fish protein hydrolysates: Chemical composition and nutritive value. Journal of Agricultural and Food Chemistry 26(3): 751-756.
Liaset, B., Lied, E. & Espe, M. 2000. Enzymatic hydrolysis of by-products from the fish-filleting industry; Chemical characterisation and nutritional evaluation. Journal of the Science of Food and Agriculture 80: 581-589.
Nielsen, P.M., Petersen, D. & Dambmann, C. 2001. Improved method for determining food protein degree of hydrolysis. Journal of Food Science 66(5): 642-646.
Normah, I., Jamilah, B., Saari, N. & Che Man, Y. 2005. Optimization of hydrolysis conditions for the production of threadfin bream (Nemipterus japonicus) hydrolysate by Alcalase®. Journal of Muscle Foods 16: 87-102.
Pacheco-Aguilar, R., Mazorra-Manzano, M.A. & Ramirez-Suarez, J.C. 2008. Functional properties of fish protein hydrolysates from Pacific whiting (Merluccius productus) muscle produced by a commercial protease. Food Chemistry 109: 782-789.
Schagger, H. & von Jagow, G. 1987. Tricine-sodium dodecyl sulfate-polyacrylamide gel electrophoresis for the separation of proteins in the range from 1 to 100 kDa. Analytical Biochemistry 166: 368-379.
See, S.F., Hoo, L.L. & Babji, A.S. 2011. Optimization of enzymatic hydrolysis of Salmon (Salmo salar) skin by Alcalase. International Food Research Journal 18(4): 1359-1365.
Shahidi, F., Han, X.Q. & Synowiecki, J. 1995. Production and characteristics of protein hydrolysates from capelin (Mallotus villosus). Food Chemistry 53: 285-293.
Shamloo, M., Bakar, J., Mat Hashim, D. & Khatib, A. 2012. Biochemical properties of red Tilapia (Oreochromis niloticus) protein hydrolysates. International Food Research Journal 19(1): 183-188.
Thiansilakul, Y., Benjakul, S. & Shahidi, F. 2007. Compositions, functional properties and antioxidative activity of protein hydrolysates prepared from round scad (Decapterusmaruadsi). Food Chemistry 103: 1385-1394.
Venugopal, V., Chawla, S.P. & Nair, P.M. 1996. Spray dried protein powder from threadfin beam: Preparation, properties and comparison with FPC type-B. J. Muscle Foods 7: 55-71.
Wangtueai, S. & Noomhorm, A. 2009. Processing optimization and characterization of gelatin from lizardfish (Saurida spp.) scales. LWT - Food Science and Technology 42: 825-834.
Jumardi Roslan, Siti Mazlina Mustapa Kamal* & Khairul Faezah Md. Yunos Department of Process and Food EngineeringFaculty of Engineering, Universiti Putra Malaysia43400 Serdang, SelangorMalaysia
Norhafizah AbdullahDepartment of Chemical and Environmental EngineeringFaculty of Engineering, Universiti Putra Malaysia43400 Serdang, SelangorMalaysia
*Corresponding author; email: [email protected]
Received: 2 September 2013Accepted: 14 April 2014