optimism, attribution and corporate investment policy by ......optimism, attribution and corporate...
TRANSCRIPT

Optimism, Attribution and Corporate Investment Policy
by
Richard Walton
A Dissertation Presented in Partial Fulfillment of the Requirements for the Degree
Doctor of Philosophy
Approved April 2016 by the Graduate Supervisory Committee:
Thomas Bates, Chair
Ilona Babenko Laura Lindsey
ARIZONA STATE UNIVERSITY
May 2016

i
ABSTRACT
Chief Executive Officers (CEOs) whose observed personal option-holding
patterns are not consistent with theoretical predictions are variously described as
overconfident or optimistic. Existing literature demonstrates that the investment and
financing decisions of such CEOs differ from those of CEOs who do not exhibit such
behavior and interprets the investment and financing decisions by overconfident or
optimistic CEOs as inferior. This paper argues that it may be rational to exhibit behavior
interpreted as optimistic and that the determinants of a CEO’s perceived optimism are
important. Further, this paper shows that CEOs whose apparent optimism results from
above average industry-adjusted CEO performance in prior years make investment and
financing decisions which are actually similar, and sometimes superior to, those of
unbiased CEOs.

ii
TABLE OF CONTENTS
Page
LIST OF TABLES .................................................................................................................. iii
CHAPTER
1 INTRODUCTION ................ ...................................................................................... 1
2 DATA ........................ ................................................................................................. 9
Variable Construction .............................................................................. 10
Measuring Optimism ............................................................................... 11
3 PERMANENCE OF OPTIMISM ............................................................................ 13
4 DETERMINANTS OF CHANGE IN ANNUAL OPTIMISM .............................. 17
Alternative Explanations .......................................................................... 22
5 GROUPING OPTIMISTIC CEOS .......................................................................... 27
6 OPTIMISM AND INVESTMENT SENSITIVITY TO CASH FLOW ................. 37
7 OPTIMISM AND M&A ACTIVITY ...................................................................... 38
8 OPTIMISM AND PAYOUT POLICY .................................................................... 44
Optimism and Dividend Payout .............................................................. 44
Optimism and Total Payout ..................................................................... 48
9 CONCLUSIONS .................. .................................................................................... 52
REFERENCES....................................................................................................................... 54

iii
LIST OF TABLES
Table Page
1. Distribution of Frequency of CEO-Year Observation (1992-2006) Where ITM of
Unexercised, Exercisable Options >=67% …… .............................................. 15-16
2(a). Self-Attribution – Differential Impact of Positive and Negative Returns on
Optimism. Conditional Logit Regression of Factors Influencing Probability of
CEO Being Optimistic ............................................................................................. 25
2(b). Self-Attribution – Differential Impact of Positive and Negative Returns on
Optimism. OLS Regression of Factors Influencing ITM of Unexercised,
Exercisable Options .................................................................................................. 26
3. Summary Statistics .............................................................................................. 31-32
4. CEO Optimism and Corporate Investment .............................................................. 37
5. Probability of Takeover Attempt ............................................................................. 42
6. Cumulative Abnormal Returns and Optimism ....................................................... 43
7. CEO Optimism and Dividend Policy ...................................................................... 50
8. CEO Optimism and Total Payout Policy ................................................................ 51

1
CHAPTER 1
INTRODUCTION
Since the articulation of the principal-agent problem it has been widely accepted that
firms are not necessarily run in the best interests of their owners. The disproportionate
impact of the Chief Executive Officer (CEO) on both the behavior and the performance
of the firm has prompted research in corporate finance to better understand why CEOs
behave as they do. Agency problems occur when the interests of the CEO and the
shareholders diverge and the CEO can intentionally follow policies that further his own
interests at the expense of those of the shareholders. A different line of research considers
how a CEO’s personal bias may cause him to unintentionally act against the best interests
of the shareholders even in the absence of any deliberate attempt to further his own
advantage. Hirshleifer (2001) presents an overview of biases which can affect
investment. Two such biases in the literature are optimism about likely outcomes and a
CEO’s overconfidence in the precision of his information. The literature is however not
always consistent in its use of the terms “overconfidence” and “optimism”. This paper
follows the traditional approach of Hackbarth (2008), which defines optimistic agents as
predicting “that favorable future events are more likely than they actually are” and
overconfident agents as believing “that they have more precise knowledge about future
events than they actually have.” In short, optimists overestimate expected values, and
overconfident agents underestimate risk.
There is a broad and growing literature in which the personal option-holding patterns of
CEOs are used to identify CEOs with an “upward bias in the assessment of future
outcomes” (Malmendier & Tate (2005a)). The bias is labelled overconfidence, by authors

2
who wish to distinguish a CEO’s tendency to overestimate his personal attributes and
outcomes from a tendency to overestimate exogenous outcomes, and as optimism, by
authors who wish to distinguish it from the tendency to underestimate risk. The bias is
generally claimed to be present when a CEO fails to exercise exercisable options until the
final year of the options or when a CEO fails to exercise exercisable options exceeding a
threshold in-the-moneyness (ITM). Such behavior has been shown to be associated with a
variety of negative behaviors. Malmendier & Tate (2005a, 2008) find that a biased
CEO’s reluctance to raise external financing makes his investment decisions more
sensitive to the availability of internal funds. In addition, CEOs subject to this bias
engage in more mergers and acquisitions and that the market reacts less favorably to the
announcement of their acquisitions. Deshmukh, Goel & Howe (2013) finds that a biased
CEO’s preference for internal financing causes the CEO to pay lower dividends but the
dividend policy deviates less when the firm has growth opportunities. However, there are
theoretical and empirical findings demonstrating positive consequences of CEO
optimism. Hirshleifer, Low & Teoh (2012) shows biased CEOs in innovative industries
are more successful at investing in innovation. Campbell, Gallmeyer, Johnson,
Rutherford & Stanley (2011) claims there is an optimal level of CEO optimism and finds
that “CEOs with relatively low or high optimism face a higher probability of forced
turnover than moderately optimistic CEOs face.” While these behavioral distortions have
been identified and well documented, it is less well known how CEOs become subject to
the optimism bias and whether inter-temporal variation in the exhibition of this bias can
provide information about its causes and the resultant quality of a CEO’s decisions.

3
This paper considers whether seemingly optimistic behaviors might sometimes be an
unbiased response to short-term conditions and therefore examines the annual variation in
a CEO’s measured optimism rather than optimism as a permanent characteristic.
Information on CEOs’ option-holdings found in Compustat’s Execucomp database is
used to estimate the average in-the-moneyness of unexercised exercisable options as a
measure of a CEO’s optimism. Concentrating on short term variation in optimism allows
the consideration of the determinants of changes in optimism and the classification of
optimistic CEOs into distinct groups. The existing literature suggests that, as a whole,
CEOs who exhibit optimistic option-holding behaviors are likely to implement sub-
optimal and value-destroying investment and financing decisions. Van den Steen (2004)
shows how “choice-driven overoptimism” can result from rational behavior under
uncertainty, but the CEO’s choice is still ex post incorrect, in that it was the result of
inaccurate expectations. Optimistic option-holding behaviors essentially identify CEOs
whose expectations of the future value of the firm are more positive than those of the
market. This can be the result of bias or a response to superior information concerning the
prospects of the firm or the CEO’s abilities. This paper finds that CEOs exhibiting both
optimistic option-holding behaviors and superior prior industry-adjusted performance
actually implement investment and financing decisions which are comparable to or better
than those of non-optimistic CEOs, supporting the hypothesis that, for a significant
proportion of CEOs, such behavior is most likely a rational response to temporary
conditions rather than the unfortunate consequence of bias.
Related literature that uses the observed option-holding policies of CEOs in order to
identify optimistic CEOs are generally “interested in a “permanent” rather than a

4
“transitory” … effect” (Malmendier & Tate (2005a)). A CEO is typically classified as
exhibiting an optimistic bias only if he displays qualifying behaviors at least twice and, if
so, from the first such display until the end of the sample period. In Malmendier, Tate
and Yan (2010), the effects of a bias to overestimate future cash-flows are discussed and
treated in the same way as the effects of permanent impacts on a CEO’s personal history,
such as growing up during the Great Depression or having a military background. In
Campbell et al. (2011), optimism is treated as “semi-permanent” but only to the extent
that a CEO’s optimism classification may change if the CEO exhibits the opposite bias
later in the sample period. This paper finds that CEOs in the period 1992-2006 who
would be classified as exhibiting a permanent bias using the Holder67 measure described
in Malmendier & Tate (2005a) actually exhibit option-holding behaviors associated with
this bias only infrequently, with 58% of such CEOs exhibiting such behavior less than
67% of the time. Despite the high degree of annual variation in associated option-holding
behaviors, the existing literature has focused exclusively on the effects of long term bias.
This paper investigates the causes and consequences of short term variations in CEO
optimism and demonstrates some important differences between the effects of short term
optimism and more permanent optimism.
Next, having established that CEO optimism does indeed vary over the short term, this
paper investigates the factors which lead to annual changes in optimism and finds some
support for the self-attribution hypothesis that CEOs attribute good performance to their
own skills and poor performance to bad luck. CEO optimism increases more following
good performance than it decreases following poor performance. This is not the expected
result if optimism were purely the mechanical consequence of equity returns. This paper

5
classifies CEOs exhibiting optimistic option-holding behavior according to the CEO’s
most recent performance, where CEO performance is measured by the equity returns of
the CEO’s firm relative to industry returns. CEOs whose option-holding behaviors
identify them as optimists and whose optimism increases following superior CEO
performance are classified as Justified Optimists. This nomenclature is chosen as, while a
Justified Optimist’s option-holding behavior identifies him as optimistic, this paper
hypotheses that his expectation that firm value will increase is the result of his private
information rather than a bias. Optimists whose optimism increases despite following
inferior CEO performance are classified as Unjustified Optimists. This paper chooses to
classify optimism as justified based on the CEO’s ex ante rationale for his increasing
optimism rather than the ex post realized outcomes of his option-holding decisions as the
paper is interested in those CEOs who had a common rational justification for their
optimism rather than those whose optimism happened to be profitable. The remainder of
the paper investigates whether the determinants of a CEO’s optimism impacts his
investment and financing decisions. It is hypothesized that Justified Optimists are not
actually subject to bias and consequently the investment and financing decisions of
Justified Optimists should not be subject to the distortions identified in the existing
literature. After all, sometimes an unbiased, rational CEO will correctly have a more
positive view of the future than the market, or, in other words, it’s not optimism if you
know you’re right.
Heaton (2002) explains how managerial optimism can impact a firm’s investment policy.
Overvaluing investment opportunities leads optimistic CEOs with available cash to
overinvest relative to an unbiased CEO. However, overvaluing the firm causes an

6
optimistic CEO to be reluctant to raise external financing for investment. This paper finds
that while the investment decisions of CEOs exhibiting optimistic behaviors are on
average less sensitive to cash flow (in contrast to Malmendier & Tate (2005a)), the
investment decisions of Justified Optimists are no more or less sensitive to cash flow than
those of CEOs who are not displaying optimistic behaviors.
Roll (1986) explains how management hubris can lead to value-destroying mergers.
Billet & Qian (2008) claims an association between management hubris, acquisitiveness
and negative post-acquisition performance. Malmendier & Tate (2008) and Kolasinski &
Li (2013) find that a CEO’s tendency to overestimate future outcomes is associated with
a higher propensity to complete mergers and a less favorable market reaction to those
mergers as judged by announcement returns. This paper finds that optimistic CEOs are
more likely to attempt a merger, but the announcement returns for Justified Optimists are
actually higher than for the average CEO. This result suggests that the M&A performance
of Justified Optimists is actually superior to that of CEOs who are not displaying
optimistic behaviors.
Deshmukh et al. (2013) predicts and finds that “firms led by overconfident CEOs pay
lower dividends than firms led by rational CEOs” and that the “difference between the
dividend payments by a rational CEO and an overconfident CEO is smaller in a firm with
higher growth (Q).” It is argued that higher growth opportunities indicate less private
information for overconfident CEOs to misinterpret and so the dividend decisions of
overconfident CEOs and rational CEOs will be more similar. This paper finds that while
optimistic CEOs are more likely to pay a lower dividend, the difference in dividend
policy versus that of unbiased CEOs only narrows for Justified Optimists. This suggests

7
that unbiased CEOs make decisions similar to Justified Optimists in the absence of
private information. The dividend policy of other types of optimistic CEOs do not
become more like the dividend policy of rational CEOs as information about growth
opportunities becomes widely available, suggesting that their dividend policy differences
are indeed due to the effect of their bias rather than different information sets.
Combining the evidence, it is reasonable to conclude that Justified Optimists are not so
much overly optimistic as better informed or aware that they possess better skills for
dealing with current uncertainties. The investment sensitivity of Justified Optimists is no
different from that of unbiased CEOs which suggests Justified Optimists are not more
likely to forego value-creating investment opportunities due to biased beliefs about the
value of their firm. Justified Optimists do engage in more M&A activity but achieve
better returns than CEOs who do not exhibit optimism. Lastly, unlike other optimistic
CEOs, the dividend policies of Justified Optimists become more like those of unbiased
CEOs as the informational advantage of CEOs versus their shareholders decreases. In
short, there is a distinct group of optimistic CEOs whose decisions are either no different
from or superior to those of CEOs who do not exhibit optimistic behaviors.
This paper adds to the current literature on overconfidence and optimism. First, this paper
demonstrates that many CEOs categorized as overconfident or optimistic actually exhibit
the qualifying option-holding behavior relatively infrequently. Furthermore, by focusing
on the determinants of annual variation in optimistic behaviors, rather than treating the
bias as a permanent trait, it is possible to identify distinct groups of optimistic CEOs.
Previously, CEOs who persistently displayed optimistic behaviors were shown to
implement seemingly sub-optimal investment and financing decisions. Classifying

8
optimistic CEOs according to the determinants of their optimism allows the identification
of a significant and distinct group of CEOs whose investment and financing decisions
seem as good as or better than those of unbiased CEOs. While some groups’ behaviors
may be characterized as “irrational” (or at least different from those of non-optimistic
CEOs), those CEOs whose ITM is increasing as a result of the CEO’s own superior
performance are not biased: their expectations of improved firm value is justified by their
own prior performance and the appropriateness of their investment and financing
decisions.

9
CHAPTER 2
DATA
This paper employs data from Compustat’s Execucomp database for information on CEO
compensation including the number and estimated value of unexercised, exercisable
options and the number and estimated realized value of exercised options. Therefore, the
sample consists of S&P1500 firms from 1992 to 2012. The data is supplemented with
information on stock returns, index returns and market prices from the Center for
Research in Security Prices (CRSP) database. Data on a company’s annual balance sheet
and income statement items comes from the Compustat Annual database. Data on
industry returns is taken from French’s website
(http://mba.tuck.dartmouth.edu/pages/faculty/ken.french/data_library.html), as are the
definitions of the 49 different industries.
The Thomson Securities Data Company (SDC) merger database is used to obtain
information on the timing, incidence and proposed financing of takeover attempts to
create a sample of 26,350 acquisitions, mergers and acquisitions of majority interest by
publicly traded US firms announced over the period 1992-2013 where the acquirer held
less than 50% of the target stock before the announcement but sought to own more than
50% after the announcement. Variable definitions, other than those pertaining to CEO
optimism, are given in the parts of the paper describing the experiments where they are
used and in the respective tables.

10
VARIABLE CONSTRUCTION
This paper closely follows Campbell et al. (2011)’s methodology for calculating
estimated average ITM of a CEO’s unexercised, exercisable options and the estimated
average realized ITM of exercised options using aggregated data from Execucomp. Of a
sample of 35,413 CEO-year observations from Execucomp over the period 1992 to 2012,
18,940 could be classified as “high-optimism”, “moderate-optimism” or “low-optimism”
according to the methodology outlined in Campbell et al. (2011) based on the estimated
average ITM of unexercised, exercisable options and the estimated average realized ITM
of exercised options. When the estimated average ITM of a CEO’s unexercised,
exercisable options in a given year is greater than or equal to 100%, this paper classifies
the CEO as an Optimist. When a CEO’s option-holding policy in a given year would be
classified as an indicator of low-optimism or moderate-optimism, this paper classifies the
CEO as not an Optimist. Of the remaining CEO-year observations, 15,941 could not be
classified as the combination of the ITM of unexercised, exercisable options and the
realized value of exercised options did not allow a definitive classification and 68 could
not be classified because of missing data.
Column 1 of table 2, Panel A shows the distribution of CEO-year observations by year
and their classification as Optimist or Not Optimist by year. There are 11,516 CEO-year
observations where the CEO is not an Optimist, representing 4,098 unique CEO’s and
2,651 unique firms. There are 7,424 CEO-year observations where the CEO exhibits
optimistic behaviors, representing 2,722 unique CEOs and 2,206 unique firms. The last
three columns of the table will be explained in Chapter 5.

11
MEASURING OPTIMISM
There are two general approaches to measuring an individual’s optimism. Surveys of
specific individuals potentially generate the most accurate measures of optimism but are
expensive and time-consuming to collect, particularly for a large sample of individuals or
over a long period of time: Ben-David, Graham & Campbell (2007) uses the results of a
survey of CFO predictions; Graham, Campbell & Puri (2007) applies psychometric tests
to test subjects.
The alternative to surveys of limited samples of subjects is to identify optimistic
behaviors using information from existing databases which cover a large sample of CEOs
over a long period of time. Researchers have successively innovated by applying related
research and exploiting existing databases in order to develop measures of optimism
based on existing, large databases. Hall & Murphy (2002) develops a theoretical
threshold ITM of 67% at which a rational under-diversified CEO should exercise his
stock options. Cicero (2009) confirms that executives do immediately sell their shares
after exercising their options about 70% of the time, consistent with reducing their
exposure to their own company. Malmendier & Tate (2005) applies this theoretical
threshold to actual CEO option-holdings and classify CEOs who “persistently fail” to
exercise options at or above the threshold as overconfident. Unfortunately, the
information they use is not generally available and, as Kolasinski & Li (2013) puts it,
“empirical research on CEO overconfidence is largely limited to a relatively small sample
of less than 500 large firms that ends in 1994.” Campbell et al. (2011) overcomes this
limitation by developing a measure of average values of ITM using information available
in Compustat’s Execucomp database. While a large sample of US firms is covered over a

12
reasonable period, the required option information is only available in Execucomp from
1992. Kolasinski & Li (2013) proposes an even more readily calculable alternative,
where a CEO is classified as being overconfident in a given year if the CEO “on average
loses money from open-market purchases of his own company’s stock in the next 2
years.” Confusingly, different authors use the same metric as a measure of both CEO
“overconfidence” and CEO “optimism”. This paper is concerned with short term
variation in a CEO’s evaluation of his firm’s prospects and follows Campbell et al.
(2011) by referring to the metric as a measure of optimism, except when reviewing the
existing literature where the cited authors’ own preferred description is used.

13
CHAPTER 3
PERMANENCE OF OPTIMISM
In order to demonstrate the relative infrequency of optimistic behavior amongst CEOs
classified as exhibiting a permanent bias, this paper estimates the average ITM of
unexercised exercisable options of 1,416 CEOs of 530 large, publicly traded firms over
the sample period 1992-2006 using Campbell et al.’s (2011) methodology. CEO’s are
classified as “Holder67” if the ITM of their unexercised exercisable options is at least
67% at least twice in the sample period.
Table 1 shows the frequency of distribution of CEO-year observations in which ITM of
unexercised exercisable options is at least 67%. The rows of the tables represent the
number of annual observations where the ITM can be calculated. The columns represent
the number of annual observations where ITM met or exceeded the 67% threshold. Panel
A shows that 48.7% of CEOs never exhibited optimistic behavior and 13.8% exhibited it
only once. Panel B shows the distribution of those CEOs which meet the Holder67
classification for each year.
It should be noticed that 57.7% of CEOs classified as Holder67 (or permanently biased)
exhibited this behavior in two-thirds or fewer of the years in which the ITM could be
calculated and 40.2% exhibited this behavior in half or fewer of the years in which the
ITM could be calculated. Clearly, even those CEOs for whom a tendency to overestimate
future outcomes has been identified as a “permanent” trait, the qualifying option-holding
behavior is actually exhibited relatively rarely.

14
This paper seeks to understand what factors cause CEOs to exhibit optimistic behavior
and whether the effects of CEO optimism on investment and financing decisions are
different when CEO optimism has different causes.

15

16

17
CHAPTER 4
DETERMINANTS OF CHANGE IN ANNUAL OPTIMISM
It is widely accepted that humans are subject to a psychological bias called “self-
attribution” where individuals credit success to their own skills and failure to external
factors or, as Langer & Roth (1975) succinctly puts it, “heads I win, tails it’s chance”.
There are theoretical models linking self-attribution and overconfidence in investors
(Daniel, Hirshleifer & Subrahmanyam (1998)) and traders (Gervais & Odean (2011)) and
Hilary & Menzly (2006) offers empirical support for a link between confidence and self-
attribution for analysts. Using the sample of CEOs and the measure of optimism
described in Chapter 2, this paper provides evidence of an association between CEO
optimism and self-attribution.
This paper first tests the self-attribution hypothesis by performing a logit regression to
show how the probability of a CEO being classified as an optimist is affected by
conditional returns. If the self-attribution hypothesis is correct then the probability that a
CEO is optimistic increases more as a result of positive total equity returns than it
decreases as a result of comparable negative equity returns. This can be tested using the
following conditional logit regression:
Conditional Logit Regression (1):
Pr[Optimistic CEOt] = b1[returns│returns>0] + b2[returns│returns<0] + b3 [controls]
where a CEO is Optimistic in year t if the ITM of a CEO’s unexercised, exercisable
options is greater than or equal to 100% in year t.
A conditional logit regression is performed rather than a regular logit regression to allow
the use of fixed effects without introducing bias due to the incidental parameters problem,

18
Chamberlain (1980). Standard errors are robust to heteroskedasticty across the error
terms.
The key variables of interest are the conditional returns. The self-attribution hypothesis
predicts: b1 > b2 >= 0. In other words, the probability that a CEO is optimistic increases
more as a result of positive total equity returns than it decreases as a result of comparable
negative equity returns. It is expected that b2 will be positive as negative returns are
expected to reduce the probability that a CEO is optimistic. It should be expected that
returns are associated with optimism as high returns lead to high equity prices and hence,
ceteris paribus, high ITM of options. However unless the stock price is close to the
exercise price of the unexercised option, a situation which is later controlled for, the
impact of positive and negative returns on the ITM of the unexercised, exercisable
options should be symmetrical. Equity returns are winsorized at 0.5% to avoid distortions
from extreme values.
Control variables include: change in total volatility versus (t-1); year x industry fixed
effects (using Fama-French 49 classification); and age and gender CEO characteristics.
Total volatility is calculated as the 60-month annualized volatility of the firm’s equity
returns. Young is an indicator variable with a value of 1 if the CEO is 52 years old or
younger in the year of observation (putting the CEO in the youngest tercile of CEOs in
the sample) and 0 otherwise. Old is an indicator variable with a value of 1 if the CEO is
59 years old or older in the year of observation (putting the CEO in the oldest tercile of
CEOs in the sample) and 0 otherwise. Female is an indicator variable with a value of 1 if
the CEO is female and 0 otherwise. Utility and finance firms (with SICs between 4900-
4999 and 6000-6699 respectively) are excluded from the sample as industry specific

19
regulation may influence the behaviors of their CEOs. The results of these analyses are
robust to including these firms.
Model 1 compares the impact of the positive total conditional equity returns and negative
total conditional equity returns. Model 2 compares the impact of positive industry-
adjusted conditional equity returns and negative industry-adjusted conditional equity
returns. Total equity returns are actually the result of CEO performance and general
industry trends outside the CEO’s control; whereas industry-adjusted returns are more
closely related to CEO performance relative to his industry peers. Models 1(b) and 2(b)
exclude observations where the ITM of the CEO’s unexercised, exercisable options are
less than 30%. The remaining CEOs would be classified as moderately or highly
optimistic according to Campbell et al.’s (2011) thresholds. The price of the underlying
stock should be sufficiently above than the exercise price of the underlying options to
avoid distortions due to the non-linear payoffs of options close to their exercise price. To
counter concerns that high values of the ITM of unexercised, exercisable options may
identify inattentive CEOs rather than optimistic ones, models 1(c) and 2(c) also exclude
years in which the CEO did not exercise any options. Holding some options despite
having exercised others indicates a conscious decision not to exercise the remaining
options.
Table 2(a) “Self-attribution – differential impact of positive and negative returns on
optimism” summarizes the results of the conditional logit regressions estimating the
impact of various factors on the probability that a CEO is optimistic for an original
sample of 15,054 CEO-year observations of all those CEO-year observations where the
CEO optimism could be classified according to Campbell et al.’s methodology described

20
above. The table shows the absolute estimated coefficients for the variables and separate
t-tests are performed to confirm whether the estimates of b1 and b2 are statistically
different from one another.
Table 2(a) provides some support for the self-attribution hypothesis. The estimated
coefficients for conditional returns in each of the models are significantly different from
zero and the point estimates of the coefficients for positive conditional returns are higher
than those for negative conditional returns. However, t-tests show that the estimated
coefficient for positive total conditional returns is statistically distinguishable from the
estimated coefficient for negative total conditional returns only in models 1(b) and 1(c).
Models 2(a), 2(b) and 2(c) in table 2(a) show that while the estimated coefficients for
industry-adjusted conditional returns in each of the models are significantly different
from zero and the point estimates of the coefficients for positive conditional returns are
higher than those for negative conditional returns, the coefficients for positive industry-
adjusted conditional returns are not statistically different from the coefficients for
negative industry-adjusted conditional returns.
Interestingly, changes in the volatility of the stock price of the underlying stock do not
have a statistically significant impact on a CEO’s optimism even though it will have an
impact on the value of the CEO’s options. There is a non-linear relationship between
CEO optimism and CEO age with both the youngest and the oldest tercile of CEOs being
more likely to be optimistic. Table 2(a) also suggests that female CEOs are less likely
than male CEOs to be Optimists.

21
The following robustness check tests how conditional returns directly impact the ITM of
a CEO’s unexercised, exercisable options through the following ordinary least squares
regression.
OLS Regression (2):
ITM = b1[returns│returns>0] + b2[returns│returns<0] + b3 [controls]
If the self-attribution hypothesis is correct then we would expect the following to be true:
b1 > b2 >=0 (the ITM of unexercised, exercisable options should increase as a result of
positive returns more than it decreases as a result of negative returns). This is because
increasing ITM of unexercised, exercisable options is associated with increasing
optimism. It is expected that b2 will be greater than zero as negative returns should reduce
the ITM of unexercised options. Table 2(b) “Self-attribution – differential impact of
positive and negative returns on optimism” summarizes the results of OLS regressions
estimating the impact of various factors on the change in ITM of a CEO’s unexercised,
exercisable options for a sample of 15,054 CEO-year observations of all those CEO-year
observations where the CEO optimism could be classified according to Campbell et al.’s
methodology described above and where the firms were not utility or finance firms.
Model 1 considers the differential impact of total conditional returns; model 2 considers
the differential impact of positive industry-adjusted conditional returns and negative
industry-adjusted conditional returns. As in table 2(a), models 1(b) and 2(b) exclude
observations where the ITM of the CEO’s unexercised, exercisable options were less than
30% and models 1(c) and 2(c) also exclude observations where the CEO did not exercise
any options in order to exclude any observations where the CEO might not have made a
deliberate decision to hold onto the unexercised exercisable options. In all models, ITM

22
and equity returns are winsorized at 0.5% to avoid distortions from extreme values. The
OLS regressions use firm and year fixed effects, otherwise each model uses the same
control variables as in table 2(a). Standard errors are clustered by firm and robust to
heteroskedasticity and correlation in the residuals across observations for the same firm.
The adjusted r-squared for all models is low (about 3-6%). This is to be expected as there
are many other factors impacting the ITM of unexercised exercisable options including
the availability of exercisable options and the decision the CEO’s decision whether to
exercise any exercisable options. As predicted, the estimated coefficients for the positive
conditional returns are highly significant and positive. The estimated coefficients for
negative conditional returns are positive in all models and lower than those for positive
conditional returns in all but model 2(c). This is consistent with the predictions of the
self-attribution hypothesis: b1 > b2 >=0 however the t-tests show that the estimated
coefficients for positive conditional returns are only statistically different from those for
conditional negative returns for the industry-adjusted returns. Overall, the table suggests
that ITM increases more when industry-adjusted returns are positive than it decreases
when they are negative: consistent with the self-attribution hypothesis.
ALTERNATIVE EXPLANATIONS
One alternative explanation of these results might be that the CEO was falsely classified
as an Optimist due to a combination of the mechanistic impact of higher returns on the
ITM of the CEO’s unexercised, exercisable options and CEO inertia (resulting in a failure
to exercise his options through inaction rather than as a deliberate decision). This
explanation is unlikely.

23
The mechanistic impact of returns on the ITM of unexercised, exercisable options would
not generally explain the asymmetric impact of positive and negative returns: as long as
the price of the stock underlying the option is not close to the exercise price of the option
then an increase in the stock price will cause a comparable change in the ITM of an
option to a comparable decrease in the stock price. It is true that when the stock price is
close to the exercise price of the option the impact of positive and negative returns will
not be symmetrical. However, the ITM of an unexercised, exercisable option is not purely
a function of the price of the underlying stock: so long as an option has a positive ITM,
the CEO can decide to exercise the option (in which case the option will not be included
in the unexercised options) or hold the option. Secondly, to reduce concerns that the
asymmetric impact of positive and negative returns is driven by options which were close
to the money, models 1(b), 1(c), 2(b) and 2(c) in tables 2(a) and 2(b) exclude
observations where the ITM was below 30%. The remaining observations are above
Campbell et al.’s (2011) threshold for moderate optimism and are unlikely to have been
close to the money options. Table 2(a) shows that the asymmetric impact of positive and
negative returns on the probability of a CEO being an optimist actually becomes more
pronounced when this adjustment is made.
For CEOs to be misclassified as Optimists, they would also have to unintentionally hold
the exercisable high ITM options. Such CEO inertia could occur if the CEOs were too
busy to manager their personal wealth; however, over 54% of Optimists did exercise
some options (this is only 6% lower than for non-Optimists), suggesting that these CEOs
did make a conscious decision to hold onto their remaining exercisable options. Cicero

24
(2009) shows that executives are actually sophisticated and deliberate in their choice of
option exercising strategies, choosing strategies which exploit differential tax rates and
private information. Secondly, concerns about the inertia hypothesis are alleviated by
excluding all CEO-year observations where the CEO did not exercise any options in
models 1(c) and 2(c). Exercising some but not all options implies that holding the
unexercised, exercisable options was a deliberate decision by the CEO. Table 2(a) shows
that excluding potentially inert CEOs improves the explanatory power of the models
while increasing the gap between the estimated coefficients b1 and b2.
A second potential concern is that annual changes in the ITM of unexercised, exercisable
options may be measuring annual changes in CEO risk tolerance rather than changes in
CEO optimism. Hall & Murphy’s (2002) threshold ITM was calculated assuming the
CEO had a Constant Relative Risk Aversion (CRRA) of 3. A CEO with a much higher
risk tolerance will have a higher ITM threshold. If the ITM of unexercised exercisable
options were actually measuring changes in annual risk tolerance rather than changes in
optimism then the expected results of some tests in this paper would be different. It
should not be expected that CEOs with high risk tolerance should prefer low payout
ratios (as this paper finds) and it should not be expected that risk tolerance reacts
asymmetrically to positive and negative total returns. It is therefore reasonable to accept
that the observed option-holding behavior is a result of annual changes in the CEO’s
optimism rather than risk tolerance.
In summary, the combined results of the conditional logit and OLS regressions provide
considerable, if not definitive, evidence to support the self-attribution hypothesis.

25
Tab
le 2
(a)
Sel
f-at
trib
utio
n -
diff
eren
tial i
mpa
ct o
f po
sitiv
e an
d ne
gativ
e re
turn
s on
opt
imis
mC
ond
itio
nal
logi
t re
gres
sio
ns
of
fact
ors
inf
luen
cin
g p
rob
abil
ity
of C
EO
bei
ng a
n o
pti
mis
m
Mo
del
1(a)
Mo
del
1(b
)M
od
el 1
(c)
Mo
del
2(a
)M
od
el 2
(b)
Mo
del
2(c
)
Num
ber
of o
bser
vatio
ns u
sed
11,0
329,
421
4,77
611
,032
9,42
14,
776
Pse
udo
R-s
quar
ed0.
042
0.03
40.
039
0.04
70.
037
0.04
2
Sto
ck R
etu
rns
Tot
al r
etur
ns (
t),
give
n >
00.
979*
**0.
959*
**1.
082*
**x
xx
Tot
al r
etur
ns (
t),
give
n <
00.
880*
**0.
186
0.19
2x
xx
Indu
stry
-adj
ret
urns
(t)
, gi
ven
>0x
xx
1.09
6***
1.00
3***
1.18
1***
Indu
stry
-adj
ret
urns
(t)
, gi
ven
<0x
xx
0.99
7***
0.79
9***
0.73
0***
Cha
nge
in to
tal v
olat
ility
(t)
-0.5
77-0
.405
-0.4
33-0
.763
-0.4
25-0
.547
CE
O c
hara
cter
isti
csY
oung
(<
52 y
ears
old
)0.
154
0.11
0**
0.19
4***
0.15
7***
0.11
2**
0.19
8***
Old
(>
59 y
ears
old
)0.
108*
0.11
6**
0.07
50.
105*
*0.
11**
0.07
2***
Fem
ale
-0.7
95**
*-0
.688
***
-0.7
61**
*-0
.811
***
-0.7
05**
*-0
.777
**
Fix
ed e
ffec
tsY
ears
x I
ndus
try
(FF
49)
YY
YY
YY
t-te
st: c
oeff
icie
nt o
f co
nd'l
retu
rns
equa
lx
N**
*N
**x
xx
Pr(
Op
tim
ist)
Sam
ple
of15
,054
CE
O-y
ear
obse
rvat
ions
(exc
ludi
ngfi
nanc
ean
dut
ility
firm
s)ov
erth
epe
riod
1992
-201
2.M
odel
s1(
b)an
d2(
b)ex
clud
eob
serv
atio
nsw
here
the
ITM
ofa
CE
O's
unex
erci
sed,
exer
cisa
ble
optio
nsar
ele
ssth
an30
%.M
odel
s1(
c)an
d2(
c)al
soex
clud
eob
serv
atio
nsw
here
the
CE
Odi
dno
tex
erci
sean
yop
tions
.T
able
show
ses
timat
edco
effi
cien
tsfr
omco
nditi
onal
logi
tre
gres
sion
sof
the
prob
abili
tyth
atth
eIT
Mof
aC
EO
'sun
exer
cise
d,ex
erci
sabl
eop
tions
>=
100%
.Tot
alre
turn
s(t
),gi
ven
>0
are
to
tal
posi
tive
equi
tyre
turn
sin
year
t.T
otal
retu
rns
(t),
give
n<
0ar
eto
tal
nega
tive
equi
tyre
turn
sin
year
t.In
dust
ry-a
dj
retu
rns(
t),
give
n>
0ar
epo
sitiv
ein
dust
ry-a
djus
ted
equi
tyre
turn
sin
year
t.In
dust
ry-a
djre
turn
s(t
),gi
ven
<0
are
nega
tive
indu
stry
-adj
uste
deq
uity
retu
rns
inye
art.
Cha
nge
into
tal
vola
tili
ty(t
)is
the
chan
gein
annu
aliz
ed60
-mon
thvo
latil
ityof
afi
rm's
mon
thly
stoc
kre
turn
sfr
om(t
-1)
tot.
You
ngis
anin
dica
tor
vari
able
with
valu
e1
ifth
eC
EO
is52
oryo
unge
rin
the
year
ofth
eob
serv
atio
nan
d0
othe
rwis
e.O
ldis
anin
dica
tor
vari
able
with
ava
lue
of1
ifth
eC
EO
is59
orol
der
inth
eye
arof
the
obse
rvat
ion
and
0ot
herw
ise.
Fem
ale
isan
indi
cato
rva
riab
lew
itha
valu
eof
1if
the
CE
Ois
fem
ale
and
0ot
herw
ise.
All
mod
els
incl
ude
fixe
def
fect
sfo
rin
dust
ryx
year
.S
tand
ard
erro
rsar
ero
bust
.T
hesu
pers
crip
ts**
*,**
and
*in
dica
test
atis
tical
sign
ific
ance
at
the
1%,
5% a
nd 1
0% le
vels
, res
pect
ivel
y.

26
Tab
le 2
(b)
Sel
f-at
trib
utio
n -
diff
eren
tial i
mpa
ct o
f po
sitiv
e an
d ne
gativ
e re
turn
s on
opt
imis
mO
LS
reg
ress
ion
s o
f fa
cto
rs in
flu
enci
ng
ITM
of
un
exer
cise
d,
exer
cisa
ble
op
tio
ns
Mo
del
1(a
)M
od
el 1
(b)
Mo
del
1(c
)M
od
el 2
(a)
Mo
del
2(b
)M
od
el 2
(c)
Num
ber
of o
bser
vatio
ns u
sed
11,4
999,
791
5,22
411
,499
9,79
15,
224
R-s
quar
ed (
adj)
0.04
20.
034
0.05
70.
038
0.03
10.
048
Sto
ck R
etu
rns
Tot
al r
etur
ns (
t),
give
n >
00.
959*
**0.
910*
**1.
311*
**x
xx
Tot
al r
etur
ns (
t),
give
n <
00.
883*
*0.
871*
1.32
9*x
xx
Indu
stry
-adj
ret
urns
(t)
, gi
ven
>0
xx
x1.
147*
**1.
052*
**1.
579*
**In
dust
ry-a
dj r
etur
ns (
t),
give
n <
0x
xx
0.32
3*0.
371*
0.19
5C
hang
e in
tota
l vol
atili
ty (
t)1.
370*
*1.
424*
*3.
016*
*1.
199*
1.29
1*2.
651*
*
CE
O c
har
acte
rist
ics
You
ng (
<52
yea
rs o
ld)
0.06
3-0
.032
-0.3
000.
066
-0.0
35-0
.289
Old
(>
59 y
ears
old
)0.
133
0.16
00.
104
0.13
60.
157
0.11
2F
emal
e-0
.187
0.04
80.
073
-0.1
450.
066
0.13
8
Fix
ed e
ffec
tsF
irm
YY
YY
YY
Yea
rsY
YY
YY
Y
t-te
st: c
oeff
icie
nt o
f co
nd'l
retu
rns
equa
lx
xx
N**
N*
N**
Sam
ple
of15
,054
CE
O-y
ear
obse
rvat
ions
(exc
ludi
ngfi
nanc
ean
dut
ility
firm
s)ov
erth
epe
riod
1992
-201
2.M
odel
s1(
b)an
d2(
b)ex
clud
eob
serv
atio
nsw
here
the
ITM
ofa
CE
O's
unex
erci
sed,
exer
cisa
ble
optio
nsar
ele
ssth
an30
%.
Mod
els
1(c)
and
2(c)
also
excl
ude
obse
rvat
ions
whe
reth
eC
EO
did
not
exer
cise
any
optio
ns.
Tab
lesh
ows
estim
ated
coef
fici
ents
from
OL
Sre
gres
sion
sof
the
ITM
ofa
CE
O's
unex
erci
sed,
exer
cisa
ble
optio
ns>
=10
0%.
Tot
alre
turn
s(t
),gi
ven
>0
are
tota
lpo
sitiv
eeq
uity
retu
rns
inye
art.
Tot
alre
turn
s(t
),gi
ven
<0
are
tota
lne
gativ
eeq
uity
retu
rns
inye
art.
Indu
stry
-adj
retu
rns(
t),
give
n>
0ar
epo
sitiv
ein
dust
ry-a
djus
ted
equi
tyre
turn
sin
year
t.In
dust
ry-a
djre
turn
s(t
),gi
ven
<0
are
nega
tive
indu
stry
-adj
uste
deq
uity
retu
rns
inye
art.
Cha
nge
into
tal
vola
tili
ty(t
)is
the
chan
gein
annu
aliz
ed60
-mon
thvo
latil
ityof
afi
rm's
mon
thly
stoc
kre
turn
sfr
om(t
-1)
tot.
You
ngis
anin
dica
tor
vari
able
with
valu
e1
ifth
eC
EO
is52
oryo
unge
rin
the
year
ofth
eob
serv
atio
nan
d0
othe
rwis
e.O
ldis
anin
dica
tor
vari
able
with
ava
lue
of1
ifth
eC
EO
is59
orol
der
inth
eye
arof
the
obse
rvat
ion
and
0ot
herw
ise.
Fem
ale
isan
indi
cato
r va
riab
le w
ith a
val
ue o
f 1
if t
he C
EO
is f
emal
e an
d 0
othe
rwis
e. A
ll m
odel
s in
clud
e fi
rm a
nd y
ear
fixed
eff
ects
. S
tand
ard
erro
rsar
ecl
uste
red
byfi
rm.
The
supe
rscr
ipts
***,
**an
d*
indi
cate
stat
istic
alsi
gnif
ican
ceat
the
1%,
5%an
d10
%le
vels
,re
spec
tivel
y.
OL
S I
TM

27
CHAPTER 5
GROUPING OPTIMISTIC CEOS
This paper shows that there is a significant and distinct group of optimistic CEOs whose
apparently optimistic behavior is not necessarily the result of psychological bias and that
this sub-group of CEOs makes investment and financing decisions which are no different
from or superior to those of unbiased, non-optimistic CEOs.
Malmendier & Tate (2005a) divides its Holder67 CEOs into ‘Hold and Win 67’ and
‘Hold and Lose 67’, according to the outcome of their decision to hold exercisable
options with an ITM of greater than 67% turned out ex post, in order to test whether
investment distortions may be due to superior private information. They find no
difference between the two groups. Kolasinski and Li (2013) defines CEOs as justifiably
confident CEOs, according to the ex post 180-day returns from buying their own
company stock and finds that the merger announcement returns of the justifiably
confident CEOs are no different from those of CEOs who are not confident.
While claiming that optimism is justifiable based on ex post realized returns might be
intuitively appealing, optimism is defined as a tendency to overestimate the value of
uncertain future outcomes, it ignores the rationale for a CEO’s expectation. A manager
who believes his firm is undervalued without any reasonable justification will be right in
a rising market; whereas a rational CEO without bias will not always realize positive
outcomes even when the positive outcome could be rationally justified. In other words,
the rationale for a decision is a better indication of the absence of bias than the ex post
results of that decision.

28
This paper distinguishes between justified and unjustified optimism based on the
rationale for the optimism. Chapter 4 of this paper provides support for the claim that
CEO optimism is subject to self-attribution (it increases more when CEO performance is
positive than it decreases when CEO performance is negative) and so it is reasonable to
separate optimistic CEOs into justifiable optimists and unjustifiable optimists according
to the CEO’s recent performance rather than the ex post accuracy of their expectations.
The results of this methodology suggest that this approach may be superior to the
alternative of determining justifiability based on outcomes. Kolasinski and Li (2013)
highlights that, according to its methodology, the merger announcement returns for
justifiably confident CEOs are negative; whereas Chapter 7 of this paper shows that its
methodology yields positive merger announcement returns for justified optimists.
To identify “Justified Optimists”, this paper selects optimistic CEOs whose optimism
increased following positive industry-adjusted equity returns. To identify “Unjustified
Optimists”, optimistic CEOs whose optimism increases despite following negative
industry-adjusted equity returns are selected. The rationale for this classification is that
increases in optimism due to positive industry-adjusted returns are likely to be due to the
demonstrated superior skill or judgment of the CEO; whereas increases in optimism
despite negative industry-adjusted returns are more likely to be due to the CEO’s bias.
The classification is performed using increasing ITM of unexercised, exercisable options
as a measure of increasing optimism.
Table 3, panel A summarizes the annual frequency of Justified Optimists and Unjustified
Optimists. There are 3,079 CEO-year observations where the CEO is classified as a
Justified Optimist (16.3% of the total CEO-year observations and 41.5% of the

29
observations classified as Optimistic). There are 1,269 CEO-year observations where the
CEO is classified as an Unjustified Optimist (6.7% of the total CEO-year observations
and 17.1% of the observations classified as Optimistic).
Table 3, Panel B summarizes the characteristics of the different groups of CEOs. The
differences in the ITM of unexercised, exercisable options and returns reflect the
definitions of the various groups. There seems to be no significant difference in the mean
ages of the different groups of CEOs and, due to the low percentage of female CEOs, the
differences in the gender ratio of the various groups is also low.
The CFO Optimist indicator is shown as a simple robustness test for the Justified
Optimist indicator. If the optimism of Justified Optimists is indeed justified, it would be
expected that the CFOs working for Justified Optimists should be more likely to exhibit
optimism than the CFOs of Unjustified Optimists. Firstly, CFOs are likely to be astute
concerning the financial prospects of the firm and optimal option-holding behavior.
Secondly, the CFO is less likely than the CEO to be subject to a biased evaluation of the
CEO’s abilities. Lastly, Wang, Shin & Francis (2012) shows that CFOs tend to earn
higher returns than CEOs when trading the stock of their own company and concludes
that CFO trades have more informational content than those of CEOs.
The CFO Optimist indicator is equal to 1 when the CFO exhibits optimistic option-
holding behavior and is set to 0 otherwise. Table 3, Panel B shows that Justified
Optimists have the highest mean value for CFO Optimist indicator (indicating that 73.8%
of Justified Optimists’ CFOs are also optimistic, compared to 26.3% for CFOs of the
average CEO and 66.4% of CFOs of the average Optimist). Separate t-tests show the
differences in means between Justified Optimists and all other CEOs (54.7%) and

30
between Justified Optimists and all other Optimist CEOs (12.6%) are both statistically
significant with p-values less than 1%. If it is accepted that CFOs are less likely to be
biased and are more likely to be financially astute, then the higher coincidence of CFO
optimism and CEO optimism for Justified Optimists is an indication that Justified
Optimists are indeed justified in their optimism.
While this is reassuring, the key test of whether the behavior of Justified Optimists is
indeed not the result of a psychological bias is whether Justified Optimists as a group
implement financing and investment decisions different from those of CEOs who do not
exhibit optimistic option-holding behavior.

31
Table 3 Summary Statistics
Panel A: CEO observations by year
Year TotalNot
Optimist OptimistJustified Optimist
Unjust'd Optimist
Optimist Other
1992 214 149 65 x x 651993 659 401 258 71 67 1201994 797 503 294 116 35 1431995 903 547 356 164 96 961996 977 537 440 210 75 1551997 1,096 516 580 304 105 1711998 1,027 503 524 244 50 2301999 988 473 515 195 96 2242000 1,018 502 516 242 64 2102001 935 581 354 105 55 1942002 791 573 218 57 15 1462003 1,056 686 370 98 150 1222004 1,139 710 429 214 89 1262005 1,073 649 424 200 62 1622006 1,166 668 498 163 84 2512007 1,121 648 473 214 21 2382008 695 512 183 46 7 1302009 735 535 200 63 64 732010 897 642 255 129 62 642011 811 577 234 125 23 862012 842 604 238 119 49 70
Total 18,940 11,516 7,424 3,079 1,269 3,076
Sample includes CEOs of S&P1500 firms whose optimism can be calculated according to the methodology described in Campbell et al. (2011). CEO classified as Optimist if ITM of unexercised exercisable options >=100% in given year. Justified Optimist is an Optimist where the ITM-ness of unexercised exercisable options has increased versus the prior year and industry-adjusted returns are positive. Unjustified Optimist is an Optimist where the ITM-ness of unexercised exercisable options has increased vs prior year and industry-adjusted returns are negative.

32
Table 3 Summary Statistics
N Mean Median Std Dev Min Max
All CEOsOptimist indicator 18,940 0.392 0.000 0.488 0.000 1.000Justified Optimist indicator 18,940 0.163 0.000 0.369 0.000 1.000Unjustified Optimist indicator 18,940 0.067 0.000 0.250 0.000 1.000CFO Optimist indicator 5,163 0.263 0.000 0.440 0.000 1.000ITM-ness of unexercised, exercisable options 18,940 1.739 0.773 5.053 0.000 61.372Total returns (%) 17,562 28.2% 17.9% 72.4% -97.8% 2809.5%Industry-adjusted returns (%) 17,562 9.7% 3.0% 66.5% -313.1% 2654.2%CEO age 18,266 55.4 55.0 7.2 29.0 91.0CEO female indicator 18,940 0.016 0.000 0.124 0.000 1.000
All OptimistsJustified Optimist indicator 7,424 0.415 0.000 0.493 0.000 1.000Unjustified Optimist indicator 7,424 0.171 0.000 0.376 0.000 1.000CFO Optimist indicator 1,649 0.664 1.000 0.472 0.000 1.000ITM-ness of unexercised, exercisable options 7,424 3.688 1.875 7.667 1.000 61.372Total returns (%) 6,843 45.7% 31.7% 83.0% -97.8% 1772.6%Industry-adjusted returns (%) 6,843 24.6% 13.4% 76.6% -313.1% 1739.0%CEO age 7,218 54.9 55.0 7.5 32.0 90.0CEO female indicator 7,424 0.012 0.000 0.110 0.000 1.000
Justified OptimistsCFO Optimist indicator 679 0.738 1.000 0.440 0.000 1.000ITM-ness of unexercised, exercisable options 3,079 3.943 2.026 7.760 1.000 61.372Total returns (%) 3,079 76.1% 52.6% 95.2% -54.8% 1772.6%Industry-adjusted returns (%) 3,079 57.1% 35.2% 84.5% 0.0% 1739.0%CEO age 3,028 55.0 55.0 7.4 33.0 80.0CEO female indicator 3,079 0.012 0.000 0.109 0.000 1.000
Unjustified OptimistsCFO Optimist indicator 234 0.543 1.000 0.499 0.000 1.000ITM-ness of unexercised, exercisable options 1,269 3.467 1.752 7.800 1.000 61.372Total returns (%) 980 21.9% 20.2% 34.2% -87.5% 142.4%Industry-adjusted returns (%) 980 -24.1% -15.4% 26.0% -313.1% 0.0%CEO age 1,237 55.5 55.0 7.6 34.0 83.0CEO female indicator 1,269 0.008 0.000 0.088 0.000 1.000
Other OptimistsCFO Optimist indicator 736 0.635 1.000 0.482 0.000 1.000ITM-ness of unexercised, exercisable options 3,076 3.524 1.808 7.512 1.001 61.372Total returns (%) 2,784 20.4% 6.6% 68.1% -97.8% 828.5%Industry-adjusted returns (%) 2,784 5.7% -0.9% 62.7% -215.4% 747.2%CEO age 2,953 54.5 54.0 7.6 32.0 90.0CEO female indicator 3,076 0.014 0.000 0.119 0.000 1.000
CEO classified as Optimist if ITM of unexercised exercisable options >=100% in given year. Justified Optimist is an Optimist where the ITM-ness of unexercised exercisable options has increased versus the prior year and industry-adjusted returns are positive. Unjustified Optimist is an Optimist where the ITM-ness of unexercised exercisable options has increased vs prior year and industry-adjusted returns are negative.

33
CHAPTER 6
OPTIMISM AND INVESTMENT SENSITIVITY TO CASH FLOW
Heaton (2002) presents a simple model to describe the interaction between managerial
optimism, investment and free cash flow. An optimistic manager overvalues his firm’s
investment opportunities causing him to want to overinvest but he also overestimates the
value of his firm and therefore sees external financing as costly. An optimistic CEO will
therefore invest more than an unbiased CEO when the firm’s cash flow is sufficiently
high but will reduce investment more than an unbiased CEO when the firm’s cash flow is
low.
This paper hypothesizes that while Justified Optimists may be more likely to invest than
other unbiased CEOs, the investment sensitivity to cash flow of Justified Optimists
should be no different from that of unbiased CEOs. Justified Optimists, if unbiased, will
not forfeit good investment opportunities due to a lack of internal funds. This hypothesis
is tested by regressing investment against the interaction term between the optimism
indicator variable and normalized cash flow, along with standard controls for explaining
corporate investment. Malmendier & Tate (2005a) interpret a statistically significant
estimated beta for this interaction term as an indication of investment sensitivity to cash
flow. Although investment cannot be less than zero, the distribution of investment across
firms shows no distortions and so a truncated Tobit regression is not necessary to avoid
any potential bias of an OLS regression.
OLS (3):
Investment = b1[cash flow] + b2[Q] + b3[optimism] + b4[optimism*cash flow] +
b5[controls]

34
where investment is defined as firm capital expenditures normalized by capital at the
beginning of the year; cash flow is calculated as operating income before depreciation
minus interest, tax and dividend payments and is normalized by capital at the beginning
of the observation year; Q is calculated as the market value of assets divided by the book
value of assets; optimism is represented by indicator variables for CEO optimism; and
controls include standard variables for investment regressions such as CEO stock
ownership and aggregate vested options, firm size, year fixed effects and firm fixed
effects. Firm size is measured as the natural log of total assets. Standard errors are
clustered by firm. Outlier values of normalized cash flow and investment are removed by
trimming observations with the highest and lowest 1% of values. There are 4,299 CEO-
year observations with usable data, of which 15.9% are Justified Optimists, 7.6% are
Unjustified Optimists and 15.6% are Optimists (excluding Justified and Unjustified
Optimists).
The key variables of interest are the interactions between the optimism indicator variables
and cash flow. These interaction variables are calculated as the product of cash flow and
the respective optimism indicator variables. If the hypothesis is correct and the
investment decisions of Justified Optimists are no more sensitive to cash flow than those
of non-optimistic CEOs then the estimated beta for the interaction between the Justified
Optimism indicator and cash flow (b4) should not be significantly different from zero.
Table 4 summarizes the results of the analysis.
It should be expected that optimistic CEOs will invest more than non-optimistic CEOs as
they are likely to overestimate the returns of investment projects, in which case the
estimated betas for the optimism indicator variables should be positive and statistically

35
significant. Table 4, which summarizes the OLS regressions, shows that while the
estimated betas are positive and statistically significant for all optimists in model 1 and
all types of optimists in model 2, they are not statistically significant for Justified
Optimists in model 3. A t-test comparing the estimated betas for the Optimist (excl.
Justified & Unjustified Optimists) indicator variable and the Justified Optimist indicator
variable shows they are not equal, with a statistical significance of 1%. Together this
suggests that Optimists (excluding Justified and Unjustified Optimists) invest more than
non-optimist CEOs and that Justified Optimists invest no less and may invest more than
non-optimist CEOs.
Most importantly, although the investment sensitivity to cash flow is negative for
Optimists as a group (see model 1), as predicted, the investment sensitivity to cash flow
of Justified Optimists is not statistically different from that of rational CEOs (see models
2 and 3). A t-test shows the estimated betas for the interaction terms of the Optimist
(excl. Justified & Unjustified)*Cash Flow and Justified Optimist*Cash Flow are also not
equal to one another (with a statistical significance level of 1%). This suggests that any
overinvestment by Justified Optimists relative to non-optimistic CEOs is independent of
the availability of internal funds. It may be that a Justified Optimist is better able to
convince external financiers of the reasonableness of his evaluation of the project’s
return. It may be that a Justified Optimist simply prefers to share some of the project’s
gains with external investors rather than forfeit all the gains of a positive NPV project.
As hypothesized, Justified Optimists are a distinct group from other optimistic CEOs:
they do not overinvest as much as other optimists and, most importantly, their investment
is no more sensitive to cash flow than that of non-optimistic CEOs.

36
Interestingly, and contrary to Malmendier & Tate (2005a), the investment sensitivity to
cash flow of Optimists (excluding Justified and Unjustified Optimists) is actually
negative, implying that as cash flow increases the investment decisions become more like
those of non-optimistic CEOs. This would be a perverse result if it is interpreted as
meaning that Optimistic CEOs invest less as cash flow increases. A more intuitive
interpretation is consistent with Jensen’s (1986) agency costs of cash flow theory:
optimistic CEOs overinvest due to higher expected returns, but non-optimistic CEOs
overinvest due to higher availability of internal funds. Thus, as cash flows increase, non-
optimistic CEOs will invest more thereby reducing the difference in investment between
non-optimistic and optimistic CEOs.
In summary, while the investment decisions of Optimists (excluding Justified and
Unjustified Optimists) are distinct from non-optimistic CEOs, this analysis finds no
evidence to suggest that the investment decisions of Justified Optimists are any more
sensitive to changes in cash flow than the investment decisions of non-optimistic CEOs
and provides only limited evidence that their investment decisions are any different from
non-optimistic CEOs.

37
Table 4 CEO Optimism and Corporate Investment
Model 1 Model 2 Model 3
Observations used 4,288 4,288 4,288R-squared (adj) 0.160 0.165 0.170
Optimism Indicator VariablesOptimist 0.018*** x xJustified Optimist x 0.009* 0.007Unjustified Optimist x 0.012* 0.011*Optimist (excl. Justified & Unjustified) x 0.031*** 0.029***
Optimist * CF -0.021** x xJustified Optimist*CF x -0.004 0.001Unjustified Optimist*CF x -0.020 -0.019Optimist (excl. Justified & Unjustified) *CF x -0.037*** -0.034***
Explanatory VariablesCash Flow 0.063*** 0.064*** 0.128***Q 0.006*** 0.059** 0.008***
ControlsStock Ownership 0.001** 0.001** 0.001Vested Options -0.241 -0.202 -0.270Firm size (log of total assets) 0.009* 0.009* 0.013**
Interactive TermsQ*Cash Flow x x -0.004*Stock Ownership * Cash Flow x x 0.001Vested Options * Cash Flow x x 0.264Size * Cash Flow x x -0.009*
Fixed effectsYear Y Y YFirm Y Y Y
Sample of 18,940 CEO-year observations over the period 1992-2012. Dependent variable is Investmentdefined as firm capital expenditures normalized by capital at the beginning of the year. Optimist is anindicator variable with a value of 1 if the CEO is an optimist according to the classification described partII. Justified Optimist is an indicator variable with a value of 1 if CEO is classified as Justified Optimistdue to increasing ITM-ness of unexercised, exerciseable options, as defined in part V. Unjustified Optimist is an indicator variable with a value of 1 if CEO is classified as Unjustified Optimist due toincreasing ITM-ness of unexercised, exercisable options as defined in chapter 5. Optimist (excludingJustified/Unjustified) is an indicator variable with a value of 1 if the CEO is an Optimist but is not aJustified Optimist or Unjustified Optimist . Cash flow is cash flow normalised by capital at the beginningof the year, calculated as [(oibdp - xint -txt - dvc)/ppegt]. Q is the market value of assets over the bookvalue of assets. Stock Ownership is the percentage of company stock held by the CEO. Vested Options is aggregate number of unexercised options held by the executive at fiscal year end that were vested as apercentage of total shares outstanding. Firm size is log of assets. All models include firm and year fixedeffects. The table shows the estimated co-efficient for each explanatory variable. Standard errors areclustered by firm. The superscripts ***, ** and * indicate statistical significance at the 1%, 5% and 10%levels, respectively.

38
CHAPTER 7
OPTIMISM AND M&A ACTIVITY
Existing literature finds an association between a CEO exhibiting an optimistic bias and
his propensity to engage in mergers and acquisitions (M&A) and that the market reacts
less favorably to announcements of acquisitions by CEOs exhibiting such a bias. It is
hypothesized that Justified Optimists are not biased and are therefore less likely to
engage in irrational value-destroying M&A activity. This paper finds that while there is
evidence that Justified Optimists are more likely to attempt a takeover, the announcement
of such an attempt is associated with positive abnormal returns, even after controlling for
the means of financing the deal. Given Justified Optimists’ option-holding decisions are
based on positive prior industry-adjusted performance and their M&A decisions are
positively received by the stock market, the M&A decisions of Justified Optimists should
not be described as the result of a bias.
Table 5 “Probability of takeover attempt” shows the results of conditional logit
regressions of how various factors impact the probability of a CEO engaging in a
takeover attempt within one year and within the next three years. A CEO is classified as
engaging in a takeover attempt if he is chief executive of a publicly traded US firm
(excluding utility and finance firms) which announces an attempt to acquire, merge with
or acquire a majority interest in a target firm where the acquirer holds less than 50% of
the target stock before the announcement but seeks to own more than 50% after the
announcement. The sample period for the conditional logit regression of the probability
of a takeover attempt within three years is necessarily shorter by two years. In column 1,
the dependent variable takes the value of 1 if the CEO engages in a takeover attempt

39
within one year and otherwise takes a value of 0. In column 2, the dependent variable
takes a value of 1 if the CEO engages in a takeover attempt within three years and
otherwise takes a value of 0. The unit of observation is the CEO-year. The primary
variables of interests are the indicator variables indicating that the CEO was a Justified
Optimist, an Unjustified Optimist or an Optimist (excluding Justified and Unjustified
Optimist) in a given year. Positive estimated coefficients for these indicator variables
would indicate that these CEO types are more likely to engage in M&A activity, negative
estimated coefficients would indicate a lower propensity to engage in M&A activity.
The conditional logit regression includes controls for firm characteristics which might
impact the CEO’s likelihood of engaging in M&A activity: firm size, cash availability
and the firm’s market-to-book ratio. Industry and year fixed effects control for the
potential influence of merger waves and any industry specific tendency to engage in (or
avoid) mergers.
The economic characteristics of the CEO’s firms have the expected impacts on the
probability of a takeover attempt: large, cash-rich firms are more likely to engage in a
takeover attempt. The signs of the estimated coefficients for CEO age indicator variables
suggest that young CEOs are more likely to engage in a takeover attempt and old CEOs
are less likely to engage in a takeover attempt.
As expected, optimistic CEOs are generally more likely to engage in a takeover attempt.
The estimated coefficients of the Optimist (excluding Justified and Unjustified Optimists)
and Justified Optimist indicator variables are positive and statistically significant; the
estimated coefficient for the Unjustified Optimist indicator variable is not. The estimated
coefficient of the Justified Optimist indicator variable is always the highest. Separate t-

40
tests show that the estimated coefficient of the Justified Optimist indicator is different
from those of the Unjustified Optimist and the other Optimist (excluding Justified and
Unjustified Optimists) indicators for the one year period, suggesting that Justified
Optimists are the most likely to engage in takeover attempts.
Table 6 “Cumulative Abnormal Returns and Optimism” provides evidence on the impact
of CEO optimism and announcement returns relating to takeover attempts. It shows the
estimated betas of an OLS regression of cumulative abnormal announcement returns
(CARs) for takeover attempts with CEO optimism as explanatory variables and controls
for deal characteristics, acquiring firm characteristics, as well as year and Fama-French
49 industry fixed effects. Standard errors are clustered by firm.
Columns 1 and 2 show estimates for value-weighted announcement returns for the three
day window from the day before the announcement of a takeover attempt to the day after
the announcement (-1,+1). Columns 3 and 4 show estimates for value-weighted
announcement returns for the seven day window from 3 days before the announcement of
a takeover attempt to 3 days after the announcement (-3,+3). The seven day window
captures the impact from any rumors or insider-trading before the announcement and any
slow to react investors after the announcement; the shorter three day window misses such
impacts but also excludes the impact of any unrelated information released over the
longer period.
Columns 1 and 3 do not control for how the takeover attempt was to be financed.
Columns 2 and 4 use indicator variables to control for the method of financing the deal.
Cash(>50%) is an indicator variable with a value of 1 if, according to Thomson SDC, the
deal was to be mostly financed with cash and otherwise has a value of 0. Stock (>50%) is

41
an indicator variable with a value of 1 if, according to Thomson SDC, the deal was to be
mostly financed with stock and otherwise has a value of 0. Hostile is an indicator variable
with a value of 1 if, according to Thomson SDC, the takeover attempt was categorized as
hostile and otherwise has a value of 0. There are 2,617 announcement events which can
be matched with the CEO sample and have calculable CAR’s, of which 22.2% are
Justified Optimists, 8.1% are Unjustified Optimists and 20.9% are Optimists (excluding
Justified and Unjustified Optimists).
The following results are of interest. Firstly, the announcement returns for takeover
attempts by CEOs who are Justified Optimists are significantly higher than for those by
the average CEO. This is true for both windows and is also true when controls for
financing are included. This is consistent with the hypothesis that Justified Optimists are
rational and do not engage in value-destroying takeovers. Secondly, the estimated betas
for other optimists are positive but only the estimated beta for the Optimists (excluding
Justified and Unjustified Optimists) is statistically significant and only for the returns
over the 3-day window. This further supports the hypothesis that Justified Optimists are a
group distinct from the other CEOs classified as optimists.
Overall, these results support the hypothesis that Justified Optimists do not engage in
value-destroying M&A activity. Rather they are more likely to attempt a takeover but the
market judges merger attempts by Justified Optimists more favorably than attempts by
other CEOs. Thus, it appears that the underlying cause of what has been perceived in
prior literature as optimism matters crucially.
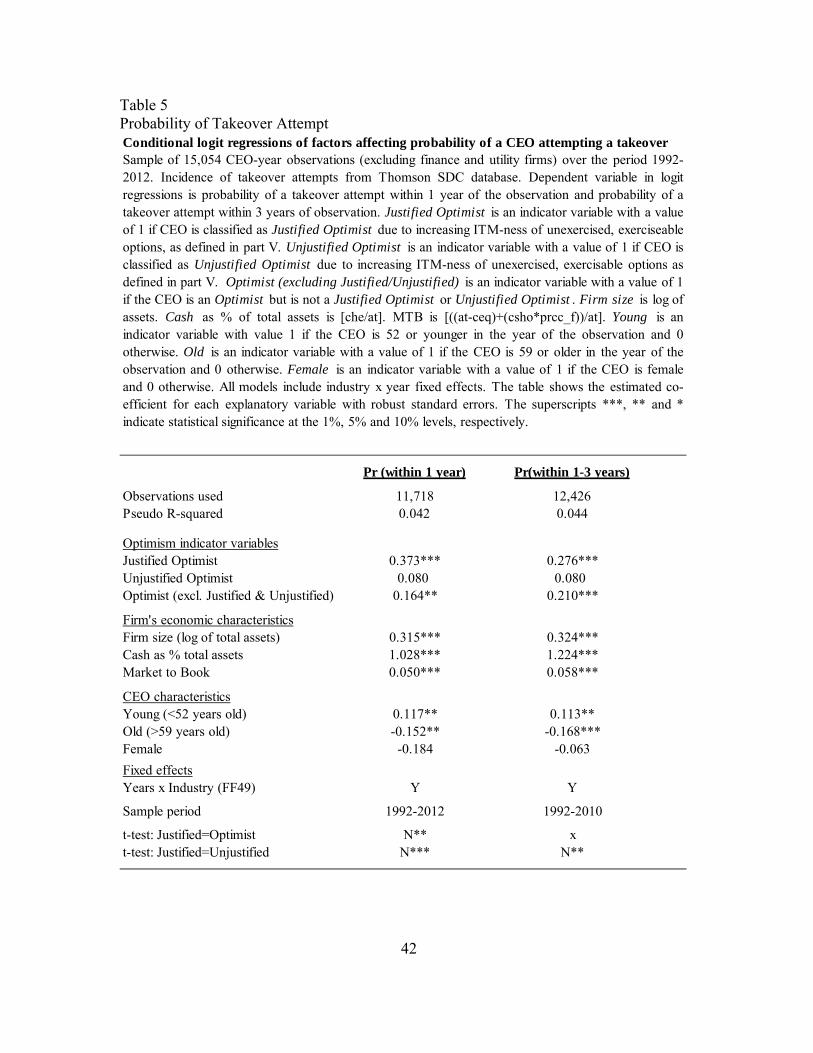
42
Table 5 Probability of Takeover Attempt Conditional logit regressions of factors affecting probability of a CEO attempting a takeover
Pr (within 1 year) Pr(within 1-3 years)
Observations used 11,718 12,426 Pseudo R-squared 0.042 0.044
Optimism indicator variablesJustified Optimist 0.373*** 0.276***Unjustified Optimist 0.080 0.080Optimist (excl. Justified & Unjustified) 0.164** 0.210***
Firm's economic characteristicsFirm size (log of total assets) 0.315*** 0.324***Cash as % total assets 1.028*** 1.224***Market to Book 0.050*** 0.058***
CEO characteristicsYoung (<52 years old) 0.117** 0.113**Old (>59 years old) -0.152** -0.168***Female -0.184 -0.063\Fixed effectsYears x Industry (FF49) Y Y
Sample period 1992-2012 1992-2010
t-test: Justified=Optimist N** xt-test: Justified=Unjustified N*** N**
Sample of 15,054 CEO-year observations (excluding finance and utility firms) over the period 1992-2012. Incidence of takeover attempts from Thomson SDC database. Dependent variable in logitregressions is probability of a takeover attempt within 1 year of the observation and probability of atakeover attempt within 3 years of observation. Justified Optimist is an indicator variable with a valueof 1 if CEO is classified as Justified Optimist due to increasing ITM-ness of unexercised, exerciseableoptions, as defined in part V. Unjustified Optimist is an indicator variable with a value of 1 if CEO isclassified as Unjustified Optimist due to increasing ITM-ness of unexercised, exercisable options asdefined in part V. Optimist (excluding Justified/Unjustified) is an indicator variable with a value of 1if the CEO is an Optimist but is not a Justified Optimist or Unjustified Optimist . Firm size is log ofassets. Cash as % of total assets is [che/at]. MTB is [((at-ceq)+(csho*prcc_f))/at]. Young is anindicator variable with value 1 if the CEO is 52 or younger in the year of the observation and 0otherwise. Old is an indicator variable with a value of 1 if the CEO is 59 or older in the year of theobservation and 0 otherwise. Female is an indicator variable with a value of 1 if the CEO is femaleand 0 otherwise. All models include industry x year fixed effects. The table shows the estimated co-efficient for each explanatory variable with robust standard errors. The superscripts ***, ** and *indicate statistical significance at the 1%, 5% and 10% levels, respectively.

43
Table 6 Cumulative Abnormal Returns and Optimism OLS Regressions of CARs over takeover attempt announcement windows.
Observations used 2,617 2,617 2,617 2,617R-squared (adj) 0.024 0.030 0.024 0.025
Optimism indicator variablesJustified Optimist 0.007* 0.007* 0.014*** 0.014***Unjustified Optimist 0.001 0.001 0.008 0.008Optimist (excl. Justified & Unjustified) 0.008 0.008* 0.007 0.007
Deal characteristicsCash (>50%) x 0.006** x 0.004Stock (>50%) x -0.010*** x -0.009*Hostile x -0.007 x -0.008
Acquiring firm characteristics
Cash as % assets -0.011 -0.007 -0.002 0.001Market-to-Book 0.003** 0.003*** 0.003*** 0.003***Firm size (log of total assets) -0.003*** -0.003*** -0.003*** -0.003***Book leverage 0.014 0.011 0.019 0.016Cash Flow as % assets -0.107** -0.111** -0.122** -0.125**
Fixed effectsYears Y Y Y YIndustry (FF49) Y Y Y Y
Sample of 2,617 announcements which met criteria described in part VI and could be matched to CEOs in mainsample. Deal characteristics from Thomson SDC. Dependent variable in (-1,+1) column is value-weightedCumulative Abnormal Returns (CARs) from 1 day before announcement of takeover until 1 day after theannouncement. Dependent variable in (-3,+3) column is value-weighted Cumulative Abnormal Returns (CARs)from 3 days before announcement of takeover until 3 days after the announcement. Justified Optimist is anindicator variable with a value of 1 if CEO is classified as Justified Optimist due to increasing ITM-ness ofunexercised, exerciseable options, as defined in part V. Unjustified Optimist is an indicator variable with a value of 1 if CEO is classified as Unjustified Optimist due to increasing ITM-ness of unexercised, exercisable optionsas defined in part V. Optimist (excluding Justified/Unjustified) is an indicator variable with a value of 1 if theCEO is an Optimist but is not a Justified Optimist or Unjustified Optimist . Cash (>50%) is an indicatorvariable with a value of 1 if the takeover attempt is to be financed mostly with cash. Stock (>50%) is anindicator variable with a value of 1 if the takeover attempt is to be finance most with equity. Hostile is anindicator variable with a value of 1 if the takeover attempt is reported as hostile on Thomson SDC. MTB is [((at-ceq)+(csho*prcc_f))/at]. Firm size is log of assets. Book leverage is [(dltt+dlc)/at]. Cash Flow as % assets is [(oibdp-xint-txt-dvc)/at]. All models include year fixed effects and Fama-French 49 industry fixed effects. Thetable shows the co-efficient for each explanatory variable with standard errors clustered by firm. Thesuperscripts ***, ** and * indicate statistical significance at the 1%, 5% and 10% levels, respectively.
(-1,+1) (-3,+3)

44
CHAPTER 8
OPTIMISM AND PAYOUT POLICY
OPTIMISM AND DIVIDEND PAYOUT
Deshmukh et al. (2013) models the interaction between CEO overconfidence and
dividend policy, where overconfidence is defined as “an upward bias in expectations of
future outcomes (overoptimism)”, and predicts that biased CEOs will pay lower levels of
dividends than unbiased CEOs and the “reduction in dividends associated with CEO
overconfidence is greater in firms with lower growth opportunities”. The paper’s
empirical results confirm the predictions of the model. The results of the random-effects
Tobit model of dividend payout show a negative estimated beta for optimists and a
positive estimated beta for the interaction between optimists and growth firms.
The rationale given for the lower overall dividend payout is that biased CEOs believe
external funds to be expensive and so cash is conserved to maintain financial slack. The
explanation for the interaction between growth opportunities and overconfidence is more
complex. Deshmukh et al. (2013) highlights that a CEO’s beliefs about the value of
investment projects may be “based on private information … or on widely available
public information. CEO overconfidence has a greater impact in the former case than in
the latter.” Where information is widely available, both overconfident and rational CEOs
will choose to invest in these growth opportunities, making the CEO’s personal bias less
important in determining the cash needs and hence the dividend policy of the firm. Where
information is private, the impact of the managers belief’s on his evaluation of the
investment opportunities will be larger.

45
If Justified Optimists are not biased then it would be expected that they would pay out
lower dividends when they had private information about growth opportunities which
were not recognized by the market but would pay similar dividends to unbiased CEOs if
all the growth opportunities were fully reflected in the market price. It should therefore
be expected that the estimated beta of a Justified Optimist indicator variable should be
negative and the estimated beta of the interaction between the Justified Optimist indicator
variable and growth opportunities should be positive.
If optimistic CEOs (excluding Justified Optimists) are not rational then it would be
expected that they would pay out lower dividends regardless of whether the firm’s
growth opportunities are fully reflected in its market price: the overvaluation of their
firms’ investment opportunities is based on their bias and not on private information.
Therefore, it should be expected that the estimated beta for Optimists (excluding
Justified and Unjustified Optimists) should be negative but the estimated beta for the
interaction between the respective optimism indicator variable and growth opportunities
should be zero (or at least lower than for the interaction between the Justified Optimist
indicator variable and growth opportunities). The perceived need for cash for investment
of a biased CEO is due to his bias and not due to private information not yet reflected in
the market valuation of the firm.
These hypotheses will be tested by regressing dividend payout against the CEO optimism
measures and standard controls for dividend policy similar to table 4 of Deshmukh et al.
(2013). As the distribution of dividend payouts across the sample is distorted because
dividend payout is truncated at zero, a Tobit regression is appropriate in order to avoid
the potential bias of an OLS regression.

46
Random Effects Tobit Regression (4):
Dividend Payout = b1[optimism] + b2[optimism*growth opportunities] + b3[controls]
where dividend payout is defined as the ratio between dividends to market value of
equity; optimism is represented by indicator variables for CEO optimism; and controls
include standard variables for dividend regressions such as cash flow, CEO stock
ownership (%), CEO vested options, firm size, year fixed effects and industry fixed
effects (Fama-French 49). Following Deshmukh et al (2013), growth opportunities are
measured by the ratio of market value to book value of assets; cash flow is defined as
operating income before depreciation normalized by total assets; firm size is measured as
the natural log of sales; and outlier values of cash flow and investment were removed by
trimming the observations with the highest and lowest 1% of values. All models control
for firm-level random effects. The sample excludes utility and finance firms as their
payout policies are influenced by regulation. There are 8,682 CEO-year observations
with sufficient non-missing data to be included in the analysis, of which 17.0% are
Justified Optimists, 7.2% are Unjustified Optimists and 18.5% are Optimists (excluding
Justified and Unjustified Optimists).
A random effects model is used to match the approach of Deshmukh et al (2013) and to
limit the drawbacks of fixed effects models, namely: the significant loss of degrees of
freedom due to the implicit use of indicator variables; and the loss of time-invariant
explanatory variables.
Table 7 shows the results of the analysis. Model 1 does not breakdown the different
groups of optimists and the results match the predictions of Deshmukh et al (2013): the
estimated beta for the Optimism indicator is negative, the estimated beta for the

47
interaction between Optimism and growth opportunities is positive and both estimates are
statistically significant. In order to determine whether all optimistic CEOs exhibit the
same behaviors, model 2 of table 7 uses separate indicator variables for the three types of
optimists: Justified Optimists, Unjustified Optimists and Optimists (excluding Justified
and Unjustified Optimists). As predicted, the estimated betas for these three indicator
variables are all negative and highly significant: any CEO who believes his firm to be
undervalued (whether correctly or not) should prefer to maintain his firm’s financial slack
by retaining dividends. Also as predicted, the estimated beta for the interaction term
between growth opportunities and the Justified Optimist indicator variable is positive and
statistically significant; whereas the estimated beta for the interaction term for other
optimists is not significantly different from zero. The dividend policy of a Justified
Optimist who is CEO of a growth firm is more similar to that of an unbiased CEO of a
growth firm as there is less private information not yet reflected in the firm’s market
price. If all optimistic CEOs were alike then the estimated beta for the interaction
between optimism and growth opportunities for all optimists would be positive and
significantly different from zero. However, the estimated betas for the interaction
between growth opportunities and Unjustified Optimists and Optimists (excluding
Justified and Unjustified Optimists) are not statistically different from zero, suggesting
that the dividend policies for these classes of optimists are not more similar to those of
unbiased CEOs when they manage high growth firms. In other words, there is again
evidence to suggest that Justified Optimists are distinct from other optimists and that they
behave like unbiased CEOs, while the other types of optimist do not.

48
OPTIMISM AND TOTAL PAYOUT
It can be argued that it is inappropriate to only consider dividend payout rather than total
payout policy as dividend payout does not consider the significant cash amounts returned
to shareholders through stock repurchases. Furthermore, the personal wealth of CEOs
with vested options will be impacted in different ways when the firm pays its
shareholders via dividends rather than via stock purchases. Executive options are
generally not adjusted for the impact of dividend payments or stock repurchases on the
underlying stock’s price. When a firm pays a dividend then ceteris paribus the ex-
dividend price will be lower, thereby reducing the value (and ITM) of any associated
options. On the other hand, when a firm repurchases its own stock, the stock price will
increase, thereby increasing the value (and ITM) of any associated options. A CEO with
unexercised options should therefore prefer to return cash to the firm’s shareholders by
stock repurchases rather than paying dividends. As all optimistic CEOs, by definition,
have unexercised options, they should prefer stock repurchases to dividend payments.
The random effects Tobit regression (4) is repeated using total payout ratio rather than
dividend payout as the dependent variable. For consistency, the total payout ratio is
calculated as the ratio of the sum of the value of repurchased stock and dividends paid to
the market value of the firm’s equity. The results are shown in table 8.
It should be noted that the results are similar to those for regressions of dividend payout:
all optimists have lower payout ratios but the estimated beta for the interaction term for
optimism and growth opportunities is only statistically significant for Justified Optimists.
When the total payout ratio is the dependent variable, the signs and significance of all the
other explanatory variables are consistent with Deshmukh et al (2013).

49
In summary, analysis of the relationship between payout policy and optimism suggests
that Justified Optimists are not subject to bias. Although they pay lower dividends than
CEOs who are not optimists, this is rational if they correctly judge the firm to be
undervalued and hence that external financing is expensive. Most importantly, the
“underpayment” of dividends is smaller for firms which the market recognizes as having
higher growth opportunities. This is not true for other groups of optimists.

50
Table 7 CEO Optimism and Dividend Policy
Random-effects Tobit regression of factors influencing dividend payout
Model 1 Model 2
CEO OptimismOptimist -0.006*** xJustified Optimist x -0.006***Unjustified Optimist x -0.005***Optimist (excl. Justified & Unjustified) x -0.005***
Optimist*Growth 0.001* xJustified Optimist*Growth x 0.001**Unjustified Optimist*Growth x 0.001Optimist (excl. Justified & Unjustified)*Growth x 0.000
Firm characteristicsStock Ownership -0.000 -0.000Vested Options -0.013 -0.012Growth opportunities -0.001*** -0.001***Cash Flow as % assets 0.003 0.004Firm size (log of total assets) 0.004*** 0.004***Tangible assets -0.000 -0.000
Year FE yes yesIndustry FE yes yesRandom effects yes yes
Observations 8,682 8,682Log-Likelihood 9,778 9,780Chi-squared 1,472*** 1,477***
15,054 CEO-year observations (excluding finance and utility firms) over the period 1992-2012. Dependentvariable is Dividend Payout , defined as % of market value. Optimist is an indicator variable with a value of1 if the CEO is an Optimist according to the classification described part II. Justified Optimist is anindicator variable with a value of 1 if CEO is classified as Justified Optimist due to increasing ITM-ness ofunexercised, exerciseable options, as defined in part V. Unjustified Optimist is an indicator variable with avalue of 1 if CEO is classified as Unjustified Optimist due to increasing ITM-ness of unexercised,exercisable options as defined in part V. Optimist (excluding Justified /Unjustified) is an indicator variablewith a value of 1 if the CEO is an Optimist but is not a Justified Optimist or Unjustified Optimist . Cash flow is cash flow normalised by total assets, calculated as [oibdp/at]. Growth Opportunities is the ratio ofmarket value of assets to book value of assets. Stock Ownership is the percentage of company stock held bythe CEO. Vested Options is aggregate number of vested unexercised options held by the executive at fiscalyear end as a percentage of total shares outstanding . Firm size is log of sales. All models include year fixedeffects and Fama-French 49 industry fixed effects and control for firm-level random effects. The table showsthe estimated co-efficient for each explanatory variable. The superscripts ***, ** and * indicate statisticalsignificance at the 1%, 5% and 10% levels, respectively.

51
Table 8 CEO Optimism and Total Payout Policy
Random-effects Tobit regression of factors influencing total payout
Model 1 Model 2
CEO OptimismOptimist -0.017*** xJustified Optimist x -0.021***Unjustified Optimist x -0.013***Optimist (excl. Justified & Unjustified) x -0.015***
Optimist*Growth 0.002** xJustified Optimist*Growth x 0.002***Unjustified Optimist*Growth x 0.001Optimist (excl. Justified & Unjustified)*Growth x 0.001
Firm characteristics
Stock Ownership -3.1 x10⁻⁴
*** -3.1 x10⁻⁴
***Vested Options 0.139*** -0.140***Growth Opportunities -0.007*** -0.007***Cash Flow as % assets 0.135*** 0.135***Firm size (log of total assets) 0.007*** 0.007***Tangible assets -0.001* -0.001*
Year FE yes yesIndustry FE yes yesRandom effects yes yes
Observations 7,989 7,989Log-Likelihood 9,515 9,520Chi-squared 1,680*** 1,693***
15,054 CEO-year observations (excluding finance and utility firms) over the period 1992-2012. Dependentvariable is Total Payout Payout , defined as % of market value. Optimist is an indicator variable with a valueof 1 if the CEO is an Optimist according to the classification described part II. Justified Optimist is anindicator variable with a value of 1 if CEO is classified as Justified Optimist due to increasing ITM-ness ofunexercised, exerciseable options, as defined in part V. Unjustified Optimist is an indicator variable with avalue of 1 if CEO is classified as Unjustified Optimist due to increasing ITM-ness of unexercised,exercisable options as defined in part V. Optimist (excluding Justified /Unjustified) is an indicator variablewith a value of 1 if the CEO is an Optimist but is not a Justified Optimist or Unjustified Optimist . Cash Flow is cash flow normalised by total assets, calculated as [oibdp/at]. Growth Opportunities is the ratio ofmarket value of assets to book value of assets. Stock Ownership is the percentage of company stock held bythe CEO. Vested Options is aggregate number of vested unexercised options held by the executive at fiscalyear end as a percentage of total shares outstanding . Firm size is log of sales. All models include year fixedeffects and Fama-French 49 industry fixed effects and control for firm-level random effects. The table showsthe estimated co-efficient for each explanatory variable. The superscripts ***, ** and * indicate statisticalsignificance at the 1%, 5% and 10% levels, respectively.

52
CHAPTER 9
CONCLUSIONS
This paper finds that self-attribution helps to explain annual variation in CEO optimism:
CEO optimism increases more as a result of good firm performance than it decreases as a
result of poor CEO performance. Furthermore, there is evidence that those CEOs whose
optimism increases as a result of superior industry-adjusted performance are not subject
to bias but instead appear to be reacting to their ability or to their firms’ specific
conditions. The corporate investment and financing decisions of Justified Optimists
should therefore be no worse, or better, than those of CEOs who are not exhibiting
optimistic behavior, which is what this paper finds. Justified Optimists invest more than
unbiased CEOs but their investment decisions are no more sensitive to cash flow than
those of unbiased CEOs; Justified Optimists are more likely to engage in M&A activity
but the market reacts positively to this activity; Justified Optimists do pay out lower
dividends than unbiased CEOs but this difference decreases if the market recognizes a
firm’s growth opportunities.
The literature generally treats CEO overconfidence and optimism as a permanent trait and
the corporate investment and financing decisions associated with CEOs classified as
overconfident or optimistic are generally treated as inferior to those of CEOs who are not
classified as overconfident or optimistic. This paper demonstrates that overconfident
behavior is actually exhibited relatively infrequently by CEOs who are classified as
permanently overconfident: 57.7% of overconfident CEOs exhibited the characteristic
behavior in less than 67% of the years where the behavior could be classified.

53
This paper helps to identify when optimistic behavior is likely to be the result of bias and
when it is likely to be a rational response to a firm’s specific conditions. Identifying
CEOs whose optimism is justifiable may aid investors in their evaluation of CEO
decisions and improve capital market efficiency. Identifying CEOs whose optimism is
not justifiable may aid research into how corporate governance and contracting can
modify the behaviors of biased CEOs. Lastly, this paper may help CEOs themselves to
better evaluate their own performance and identify potential biases.

54
REFERENCES
Ben-David, I., Graham, J. R., & Harvey, C. R. (2007). Managerial overconfidence and corporate policies (No. w13711). National Bureau of Economic Research. Billett, M. T., & Qian, Y. (2008). Are overconfident CEOs born or made? Evidence of self-attribution bias from frequent acquirers. Management Science, 54(6), 1037-1051. Campbell, T. C., Gallmeyer, M., Johnson, S. A., Rutherford, J., & Stanley, B. W. (2011). CEO optimism and forced turnover. Journal of Financial Economics, 101(3), 695-712. Chamberlain, G. (1980). Analysis of Covariance with Qualitative Data. Review of Economic Studies, 47, 1980, 225-238. Cicero, D. C. (2009). The manipulation of executive stock option exercise strategies: Information timing and backdating. The Journal of Finance, 64(6), 2627-2663. Daniel, K., Hirshleifer, D., & Subrahmanyam, A. (1998). Investor psychology and security market under‐and overreactions. The Journal of Finance, 53(6), 1839-1885. Deshmukh, S., Goel, A. M., & Howe, K. M. (2013). CEO overconfidence and dividend policy. Journal of Financial Intermediation, 22(3), 440-463. Gervais, S., Heaton, J. B., & Odean, T. (2011). Overconfidence, compensation contracts, and capital budgeting. The Journal of Finance, 66(5), 1735-1777. Graham, J. R., Harvey, C. R., & Puri, M. (2013). Managerial attitudes and corporate actions. Journal of Financial Economics, 109(1), 103-121. Hackbarth, D. (2008). Managerial traits and capital structure decisions. Journal of Financial and Quantitative Analysis, 43(04), 843-881. Hall, B. J., & Murphy, K. J. (2002). Stock options for undiversified executives. Journal of Accounting and Economics, 33(1), 3-42. Heaton, J. B. (2002). Managerial optimism and corporate finance. Financial Management 31, 33-45. Hilary, G., & Menzly, L. (2006). Does past success lead analysts to become overconfident? Management Science, 52(4), 489-500.

55
Hirshleifer, D. (2001). Investor psychology and asset pricing. The Journal of Finance, 56(4), 1533-1597. Hirshleifer, D., Low, A. & Teoh, S. H. (2012). Are overconfident CEOs better innovators? The Journal of Finance, 67(4), 1457-1498. Jensen, M. C. (1986). Agency cost of free cash flow, corporate finance, and takeovers. Corporate Finance, and Takeovers. American Economic Review, 76(2). Kolasinski, A. C., & Li, X. (2013). Can strong boards and trading their own firm’s stock help CEOs make better decisions? Evidence from acquisitions by overconfident CEOs. Journal of Financial and Quantitative Analysis, 48(04), 1173-1206. Langer, E. J., J. Roth. (1975). Heads I win, tails it's chance: The illusion of control as a function of the sequence of outcomes in a purely chance task. Journal of Personality and
Social Psychology, 32, 951–955.
Malmendier, U., & Tate, G. (2005). CEO overconfidence and corporate investment. The Journal of Finance, 60(6), 2661-2700. Malmendier, U., & Tate, G. (2008). Who makes acquisitions? CEO overconfidence and the market's reaction. Journal of Financial Economics, 89(1), 20-43. Malmendier, U., Tate, G., & Yan, J. (2011). Overconfidence and early‐life experiences: the effect of managerial traits on corporate financial policies. The Journal of Finance, 66(5), 1687-1733. Roll, R. (1986). The hubris hypothesis of corporate takeovers. Journal of Business, 197-216. Van den Steen, E. (2004). Rational overoptimism (and other biases). American Economic Review, 1141-1151. Wang, W., Shin, Y. C., & Francis, B. B. (2012). Are CFOs’ trades more informative than CEOs’ trades?. Journal of Financial and Quantitative Analysis, 47(04), 743-762. Walton, R., It's not optimism when you know you're right: optimism, attribution and corporate investment policy (September 15, 2015). Available at SSRN: http://ssrn.com/abstract=2698383 or http://dx.doi.org/10.2139/ssrn.2698383