optimising the automated vision inspection system of
TRANSCRIPT

Optimising the automated visioninspection system of battery sheetsDeveloping the quality inspection at Northvolt AB
Master’s thesis in production engineering
GURU PRASATH SIVAKUMAR
DEPARTMENT OF INDUSTRIAL AND MATERIAL SCIENCES
CHALMERS UNIVERSITY OF TECHNOLOGYGothenburg, Sweden 2021www.chalmers.se


Master’s thesis in Industrial and Materials Science 2021
Optimising the automated visioninspection system of battery sheets
Developing the quality inspection at Northvolt AB
GURU PRASATH SIVAKUMAR
Department of Industrial and Materials ScienceChalmers University of Technology
Gothenburg, Sweden 2021

Identify a suitable machine learning method for detection of anomalies on the bat-tery sheets, aka jumbo roll through vision inspection system and investigate thepotential usage of the data collected by the vision inspection system for improvingthe battery manufacturing process at Northvolt AB.
© GURU PRASATH SIVAKUMAR, 2021.
Supervisor: Arpita Chari, Department of Industial and Materials ScienceExaminer: Mélanie Despeisse, Department of Industial and Materials Science
Master’s Thesis 2021Department of Industrial and Materials ScienceChalmers University of TechnologySE-412 96 GothenburgTelephone +46 31 772 1000
Cover: Electrode coated cathode jumbo roll examined by the vision inspection cam-era at Northvolt Labs.
Typeset in LATEX, template by Magnus GustaverPrinted by Chalmers ReproserviceGothenburg, Sweden 2021
iv

AbstractThe utilisation of lithium-ion batteries in the field of Electric Vehicles (EVs) has in-creased its global demand. Northvolt, a Swedish lithium-ion battery manufactureris setting up Europe’s largest battery manufacturing (in terms of battery capacity)facility at Skellefteå, Sweden.
The electrode manufacturing process stage in the battery production line at North-volt Ett will perform the quality operation through a vision inspection system, whichis being developed in-house at Northvolt Labs. This thesis is focused on identifying asuitable machine learning model through which the anomalies can be detected; also,to investigate how the big data collected through the vision inspection system canbe further utilised for improving the battery manufacturing process at Northvolt Ett.
In total, five research questions on anomaly detection and big data usage were for-mulated. Qualitative study was performed to understand the various stakeholderrequirements, challenges in detecting anomalies, manufacturing process constraintsetc. at Northvolt. Experts from different working backgrounds at Northvolt wereinterviewed and over 50 research articles were analysed to answer the research ques-tions.
Deep learning was found to be a suitable method for anomaly detection and variousdeep learning techniques such as Convolutional Neural Network (CNN), GenerativeAdversarial Network (GAN) can be used to detect anomalies and predict the typeof anomaly on a high-level classification. A framework is proposed for transformingthe data collected through vision inspection into meaningful value for improving thebattery manufacturing process at Northvolt Ett. Overall, it was understood thatthe behaviour of the machine learning/deep learning model is greatly influenced bythe richness of the input data.
Keywords: Vision Inspection, Anomaly Detection, Deep Learning, ConvolutionalNeural Network, Big Data Analysis.
v


AcknowledgementsFirst and foremost, I would like to take this opportunity to thank the companyNorthvolt, Kyle Chan - Director of Automation & Amy Harrison - Talent Acqui-sition Coordinator, for providing me with an opportunity to carry out this masterthesis despite the hurdles faced due to the global pandemic of COVID-19.
Extending my gratitude to Ida Ejenestrand, Technical Project Manager and thesisSupervisor at Northvolt for having unfaltering confidence in me, providing guid-ance, inspiration and making my work feel important. Thanks to Simon Ågren,Ron Evans & Hampus Rosvall for their insights and ideas. The support that theyprovided during this master thesis is inestimable.
Further, I would like to appreciate the support which I received from ChalmersUniversity of Technology & Anders Skoogh, Director of Master’s Programme inProduction Engineering. Sincere thanks to Arpita Chari, Supervisor at ChalmersUniversity of technology for the continuous support, willingness to help at any timeand guiding me in the right direction throughout the thesis period.
Finally, I would like to thank my family and friends at Northvolt for their greatencouragement and support.
Guru Prasath Sivakumar,Stockholm, June 2021
vii


List of abbreviationsLi-ion : Lithium-ion
GWh : Gigawatt-hours
CIS : Contact Image Sensor
AI : Artificial Intelligence
ML : Machine Learning
DL : Deep Learning
NN : Neural Network
ANN : Artificial Neural Network
CNN : Convolutional Neural Network
GAN : Generative Adversarial Network
BDA : Big Data Analysis
CPU : Central Processing Unit
GPU : Graphical Processing Unit
IoT : Internet of Things
CPS : Cyber Physical System
ix


Glossary of termsJumbo roll - A large roll of copper or aluminium foil on which the electrode is coated.
Jelly roll - Stacked layers of anode and cathode with a separator between each layer.
Gigafactory - Terminology used to address a battery manufacturing site.
Product Genealogy - To record and store all the production process result of a par-ticular product.
xi


Contents
List of Figures xv
List of Tables xvii
1 Introduction 11.1 Background . . . . . . . . . . . . . . . . . . . . . . . . . . . . . . . . 11.2 Purpose . . . . . . . . . . . . . . . . . . . . . . . . . . . . . . . . . . 21.3 Research questions . . . . . . . . . . . . . . . . . . . . . . . . . . . . 41.4 Delimitations . . . . . . . . . . . . . . . . . . . . . . . . . . . . . . . 5
2 Theory 72.1 Lithium-ion battery . . . . . . . . . . . . . . . . . . . . . . . . . . . . 7
2.1.1 Working of lithium-ion battery . . . . . . . . . . . . . . . . . 92.2 Battery manufacturing at Northvolt . . . . . . . . . . . . . . . . . . . 102.3 Computer Vision . . . . . . . . . . . . . . . . . . . . . . . . . . . . . 11
2.3.1 Vision inspection equipment at Northvolt . . . . . . . . . . . . 112.4 Artificial Intelligence . . . . . . . . . . . . . . . . . . . . . . . . . . . 13
2.4.1 Machine learning . . . . . . . . . . . . . . . . . . . . . . . . . 132.4.2 Deep learning . . . . . . . . . . . . . . . . . . . . . . . . . . . 142.4.3 Neural Network . . . . . . . . . . . . . . . . . . . . . . . . . . 14
2.4.3.1 Activation function . . . . . . . . . . . . . . . . . . . 162.4.3.2 Backpropagation . . . . . . . . . . . . . . . . . . . . 182.4.3.3 Convolutional Neural Network - CNN . . . . . . . . 19
2.5 Industry 4.0 . . . . . . . . . . . . . . . . . . . . . . . . . . . . . . . . 222.5.1 Big Data . . . . . . . . . . . . . . . . . . . . . . . . . . . . . . 23
3 Methodology 253.1 Research approach . . . . . . . . . . . . . . . . . . . . . . . . . . . . 253.2 Methods . . . . . . . . . . . . . . . . . . . . . . . . . . . . . . . . . . 26
3.2.1 Literature Study . . . . . . . . . . . . . . . . . . . . . . . . . 263.2.2 Qualitative study . . . . . . . . . . . . . . . . . . . . . . . . . 27
3.3 Ethics . . . . . . . . . . . . . . . . . . . . . . . . . . . . . . . . . . . 29
4 Results 314.1 Anomaly Detection . . . . . . . . . . . . . . . . . . . . . . . . . . . . 31
4.1.1 Image Impainting . . . . . . . . . . . . . . . . . . . . . . . . . 314.1.2 Autoencoder . . . . . . . . . . . . . . . . . . . . . . . . . . . . 34
xiii

Contents
4.1.3 Image classification . . . . . . . . . . . . . . . . . . . . . . . . 354.2 Anomalies and data . . . . . . . . . . . . . . . . . . . . . . . . . . . . 37
4.2.1 Types of anomalies . . . . . . . . . . . . . . . . . . . . . . . . 374.2.2 Training data . . . . . . . . . . . . . . . . . . . . . . . . . . . 374.2.3 Image Augmentation . . . . . . . . . . . . . . . . . . . . . . . 39
4.3 Big Data Analysis . . . . . . . . . . . . . . . . . . . . . . . . . . . . . 39
5 Discussion 415.1 Answers . . . . . . . . . . . . . . . . . . . . . . . . . . . . . . . . . . 41
5.1.1 Research Question 1 . . . . . . . . . . . . . . . . . . . . . . . 415.1.2 Research Question 2 . . . . . . . . . . . . . . . . . . . . . . . 43
5.2 Recommendations to Northvolt . . . . . . . . . . . . . . . . . . . . . 455.3 Limitations of the study . . . . . . . . . . . . . . . . . . . . . . . . . 45
6 Conclusion 47
Bibliography 49
A Appendix I
xiv

List of Figures
1.1 Global battery industry growth by application and region. [2] . . . . 21.2 Lithium-ion battery gigafactories in Europe. [4] . . . . . . . . . . . . 21.3 Battery manufacturing stages at Northvolt [11] . . . . . . . . . . . . . 31.4 Focus of thesis in the vertical integration of Northvolt . . . . . . . . . 5
2.1 Structure of cylindrical lithium-ion battery [7] . . . . . . . . . . . . . 82.2 Northvolt’s cylindrical and prismatic cells [8] . . . . . . . . . . . . . . 82.3 Working of a lithium ion battery [10] . . . . . . . . . . . . . . . . . . 92.4 Vertical Integration of battery manufacturing at Northvolt . . . . . . 102.5 Camera mounted on top of the frame to capture images of electrode
coated battery sheets at Northvolt Labs[11] . . . . . . . . . . . . . . . 112.6 Contact Image Sensor (CIS) [14] . . . . . . . . . . . . . . . . . . . . . 122.7 Cathode jumbo roll passing through guide rollers at Northvolt labs[11] 122.8 Electrode coated anode jumbo roll at Northvolt labs[11] . . . . . . . . 132.9 Hierarchy of AI, ML and DL [16] . . . . . . . . . . . . . . . . . . . . 142.10 Neural network architecture [19] . . . . . . . . . . . . . . . . . . . . . 152.11 Single layer neural network [19] . . . . . . . . . . . . . . . . . . . . . 152.12 Components of an artificial neuron [21] . . . . . . . . . . . . . . . . . 162.13 Sigmoid function curve [21] . . . . . . . . . . . . . . . . . . . . . . . 172.14 Tanh function curve [21] . . . . . . . . . . . . . . . . . . . . . . . . . 172.15 ReLu function curve [21] . . . . . . . . . . . . . . . . . . . . . . . . . 182.16 Leaky ReLu function curve [21] . . . . . . . . . . . . . . . . . . . . . 182.17 Outline of CNN [34] . . . . . . . . . . . . . . . . . . . . . . . . . . . 192.18 Example of Tensor[33] . . . . . . . . . . . . . . . . . . . . . . . . . . 202.19 Convolution operation-1[33] . . . . . . . . . . . . . . . . . . . . . . . 202.20 Convolution operation-2[33] . . . . . . . . . . . . . . . . . . . . . . . 212.21 Padding[33] . . . . . . . . . . . . . . . . . . . . . . . . . . . . . . . . 212.22 Pooling[34] . . . . . . . . . . . . . . . . . . . . . . . . . . . . . . . . . 22
3.1 Framework for research [27] . . . . . . . . . . . . . . . . . . . . . . . 253.2 Overview of method . . . . . . . . . . . . . . . . . . . . . . . . . . . 263.3 Literature map . . . . . . . . . . . . . . . . . . . . . . . . . . . . . . 273.4 Data Analysis. Adjusted illustration, originally from [27] . . . . . . . 29
4.1 U net architecture [39] . . . . . . . . . . . . . . . . . . . . . . . . . . 324.2 Model of full resolution image & patch extraction . . . . . . . . . . . 33
xv

List of Figures
4.3 (a) Extracted patch with an anomaly (b) Extracted patch with it’scentre region masked (c) Masked region reconstructed through MLmodel (d) Pixel difference between (a) & (c) . . . . . . . . . . . . . . 33
4.4 Architecture of autoencoder [42] . . . . . . . . . . . . . . . . . . . . . 344.5 Summary of AlexNet architecture [46] . . . . . . . . . . . . . . . . . . 364.6 Summary of VGG16 architecture [47] . . . . . . . . . . . . . . . . . . 364.7 Summary of LeNet architecture [48] . . . . . . . . . . . . . . . . . . 364.8 EPOCH . . . . . . . . . . . . . . . . . . . . . . . . . . . . . . . . . . 384.9 Architecture of GAN [41] . . . . . . . . . . . . . . . . . . . . . . . . 39
5.1 Data to actionable knowledge conversion [28] . . . . . . . . . . . . . . 44
A.1 Architecture of AlexNet [46] . . . . . . . . . . . . . . . . . . . . . . . IA.2 Architecture of VGG16 [47] . . . . . . . . . . . . . . . . . . . . . . . IA.3 Architecture of LeNet [48] . . . . . . . . . . . . . . . . . . . . . . . . II
xvi

List of Tables
2.1 Theory section - overview . . . . . . . . . . . . . . . . . . . . . . . . 72.2 Parameters and their hyper-parameters in CNN [33] . . . . . . . . . . 19
3.1 Data collection approaches . . . . . . . . . . . . . . . . . . . . . . . . 283.2 Interviews . . . . . . . . . . . . . . . . . . . . . . . . . . . . . . . . . 28
4.1 Challenges of big data characteristics . . . . . . . . . . . . . . . . . . 40
xvii

List of Tables
xviii

1Introduction
This chapter presents the reader with a background about the need for batteriesand Northvolt, purpose of the thesis, research questions and delimitations.
1.1 BackgroundThe world has reached an alarming level of greenhouse gases, which is a major reasonfor climate change. In the year 2015, top nations across the world gathered at thecity of Paris and signed a climate agreement. It was agreed that for the increasingthreat of climate change, the global response should be a shift towards the usage ofsustainable energy to hold the increasing global average temperature to below 2°C,above pre-industrial levels [1]. Some of the major causes for rise in greenhouse gasesare electricity generation, transportation etc.
The transition towards the generation and usage of renewable energy is rapid asthey help to counter the global problem of climate change. Right now, the biggestchallenge that many countries and leading industries face are shortage in the storagesystem for the energy generated through renewable methods such as hydropower, so-lar power etc. Over the years, batteries have proven to be an ideal option for energystorage. According to a report published by the World Economic Forum (WEF)[2],the global demand for lithium-ion batteries in the year 2020 was 282 GWh asshown in figure 1.1 and the projected demand by 2030 is 2623 GWh; growth by afactor of 14. This demand includes the usage of batteries in many different applica-tions such as electric mobility, consumer electronics etc. [2].
To meet the European demand for lithium-ion batteries, many Asian-based lithium-ion battery manufacturers are entering the European market and are setting upfactories in different countries. Their strategies are to produce the batteries in theshortest period to meet the growing demand. Figure 1.2 represents the upcomingbattery manufacturers in Europe. Northvolt, a Swedish company founded in the year2016 has a revolutionary concept to produce and recycle the batteries in a sustainableway by using renewable energy. In this way, the greenhouse emission from energygeneration can be significantly reduced and scarcity of materials used in the batteriescan be avoided. A road map was laid by the company in the year 2017 to constructEurope’s largest battery cell production factory referred to as Northvolt Ett atSkellefteå, Sweden which will be Europe’s first home grown gigafactory. Leadingautomobile manufacturers such as BMW, Volkswagen has already partnered up with
1

1. Introduction
the company to power their future electric car models. To meet the requirements,Northvolt Ett is set to have a capacity of 32 GWh by 2023 where different variantsof lithium-ion batteries will be produced according to customer specifications [3].
Figure 1.1: Global battery industry growth by applicationand region. [2]
Figure 1.2: Lithium-ion battery gigafactories in Europe. [4]
1.2 PurposeAt present, a demo/research-oriented battery production facility is functioning inVästerås, Sweden; referred to as Northvolt Labs. Various production process in bat-tery manufacturing at Northvolt such as electrode manufacturing, cell assembly &battery system, as shown in figure 1.3 require an automated inspection system for
2

1. Introduction
performing product quality inspection. The development of vision inspection sys-tem is focused towards three stages in the electrode manufacturing process, namelycoating, pressing and slitting. The vision inspection system in the coating process inVästerås is currently outsourced, but Northvolt has plans to develop a vision inspec-tion system in-house which will be installed in the manufacturing lines at NorthvoltEtt.
Figure 1.3: Battery manufacturing stages at Northvolt [11]
Three major tasks are expected to be driven by the vision inspection system; anomalydetection, width measurement and reading of Data Matrix Code (DMC). The pur-pose of the thesis is to identify a suitable method of machine learning for detectinganomalies using the vision inspection system. The scope of the thesis also includesinvestigating the further use of data (collected by the vision inspection system) apartfrom anomaly detection.
The objectives of the thesis are as follows:
• Study and analyse different machine learning methods that are suitable forthe detection of anomalies on the battery sheets.
• Perform qualitative study to understand the constraints, challenges and op-portunities in using machine learning models for vision inspection.
• Understand the battery manufacturing process at Northvolt and identify the
3

1. Introduction
opportunities for usage of the data collected by the vision inspection systemfor anomaly detection.
• Recommend a suitable machine learning model for anomaly detection anda framework to convert the data collected from the vision inspection intomeaningful values.
1.3 Research questionsIn order to fulfil the purpose of the thesis, two main research questions were formu-lated, i.e. RQ1 & RQ2. These questions were further subdivided into RQ 1.1, RQ1.2 & RQ 2.1.
To find a suitable machine learning method for anomaly detection on the batterysheets in the battery manufacturing process, various possible anomalies which mightoccur on the battery sheets from the different battery manufacturing stages haveto be studied. Since the manufacturing processes are yet to be standardised andestablished, there is a non-availability of data related to the anomalies that occur inthe battery sheets during the production process. Feedback plays a pivotal role inthe development of a system. To improve anomaly detection by machine learningmodel, a feedback loop with human input from domain experts can be incorporated.This motivates the first research question:
Research Question 1:How to detect anomalies on the battery sheets using a machine learning model?
Sub-question 1.1:What is considered to be an anomaly in battery sheets?
Sub-question 1.2:Does incorporating a feedback loop helps in better classification of the anomalies?
Northvolt considers product genealogy as a core value for improving the business.This requires the collection of data from the raw material stage to the completebattery cell manufacturing stage. As all the manufacturing processes at Northvoltare being designed to fit within the standards of Industry 4.0, the vision inspectionequipment can be optimized in the collection of data to provide insights on themanufacturing quality and identify a potential issue that might occur in differentmanufacturing stages. This motivates the second research question:
Research Question 2:What benefit does the data from the vision inspection system provide to the con-nected factory of Northvolt Ett?
Sub-question 2.1:How can the data collected by the vision inspection system be translated into mean-ingful quantitative and qualitative values?
4

1. Introduction
1.4 DelimitationsThe focus of this thesis was only on the anomaly detection function of the visioninspection system in the electrode coating process stage as shown in figure 1.4. Asthe majority of the study was planned to be performed with respect to the pilot visioninspection system which is being developed, the focus was on concept generation andvalidation than implementation and impact measurement. Since the optimization ofthe system is more dependent on the algorithm and the machine learning model onwhich it works, improvising the physical components of the vision inspection systemsuch as a camera, GPU and frame grabber were given less attention.
Figure 1.4: Focus of thesis in the vertical integration ofNorthvolt
5

1. Introduction
6

2Theory
This chapter covers the theoretical explanation to comprehend the thesis work.Table 2.1 provides an overview of this chapter.
Table 2.1: Theory section - overview
Section Title Description Relevancy2.1 Lithium ion battery Reason for preference of
lithium ion battery and itsworking principle
Research question 1 & 2
2.2 Battery manufactur-ing at Northvolt
Outlook of various stagesin battery manufacturing atNorthvolt
Research question 1 & 2
2.3 Computer vision Role of computer vision inquality inspection & de-scription of Northvolt’s in-house developed vision in-spection system
Research question 1
2.4 Artificial Intelligence Working of neural network,components of an artificialneuron, convolution neuralnetwork and its workingprinciple
Research question 1
2.5 Industry 4.0 Introduction to Industry 4.0& big data
Research question 2
2.1 Lithium-ion batteryBatteries are devices that help energy storage and produce Direct Current (DC)by converting the chemical energy to electrical energy to power the connected load[5]. Two major types of batteries are primary cells and secondary cells [5]. Primarycells are non-rechargeable batteries [5]. Therefore, these batteries can discharge theenergy only once [5]. However, secondary cells are rechargeable batteries and arewidely used in many applications to reduce the frequency of battery replacementupon energy depletion [5]. For effective usage of critically available raw materialsand increased usage (number of cycles), rechargeable batteries are the best solutionto address the global energy storage problem. Among the rechargeable batteries, the
7

2. Theory
most popular type of battery is Lithium-ion (Li-ion). These batteries have becomethe unanimous choice by major battery manufacturers in the world. A few factorsthat favour the choice of lithium-based battery are [6]:
• Lithium is the third lightest element in the periodic table.• Among all elements, lithium has the greatest reduction potential (ability to
lose/gain electron) and high reactivity.
These factors help Li-ion batteries to achieve high power density and volumetriccapacity [6]. Li-ion batteries comprise of cathode and anode with a separator inbetween, as shown in figure 2.1 [7]. In general, the cathodes are aluminium foil
Figure 2.1: Structure of cylindrical lithium-ion battery [7]
coated with an active material containing lithium while anodes are copper foil that iscoated with active material containing graphite [7]. The separator is a non-conductorkeeps that keeps the cathode and anode away from direct contact [7]. The activematerials which are also generally known as electrodes are applied to the cathodeand anode respectively before they are processed into different types of cells. A rollof cathode, anode and separator together is referred to as a jelly roll at Northvolt.These jelly rolls are cut into larger rectangular pieces for prismatic cells and smallerrectangular pieces for cylindrical cells as shown in figure 2.2. A metal case coversthe jelly roll and is filled with electrolyte liquid before sealing [7].
Figure 2.2: Northvolt’s cylindrical and prismatic cells [8]
8

2. Theory
2.1.1 Working of lithium-ion battery
These batteries work on the concept of electrochemical potential, which is the ten-dency of a material to lose electrons [7]. Lithium has the highest tendency to losethe one electron which is present in its outermost shell [7]. Layers of lithium atomsdeposit on the cathode [9]. When it is connected to a positive terminal of the powersource, electrons from the lithium atom will be released [9]. As the electrolyte allowsonly the lithium ions to pass through, these electrons which are released from thelithium atoms flow through the circuit and reach the negative terminal [9]. Theseelectrons deposit on the graphite layer which is present in the anode [9]. Once theelectrons reach the graphite layer, the lithium ions in the positive terminal flowthrough the electrolyte and reach the graphite layer [9]. This movement of electronsand ions from the positive terminal to the negative terminal constitutes to charg-ing/recharging of a battery [9].
Since the ions and electrons are in an unstable state, they try to get back to thepositive terminal of the battery [9]. Thus, by replacing the power source to a load,the lithium-ion travel back to the positive terminal through the electrolyte whilethe electrons flow through the circuit of the load [9]. This movement of electronsfrom the negative to positive terminal results in an electrical current [9]. Figure 2.3shows the working of a lithium-ion battery.
Figure 2.3: Working of a lithium ion battery [10]
9
2. Theory
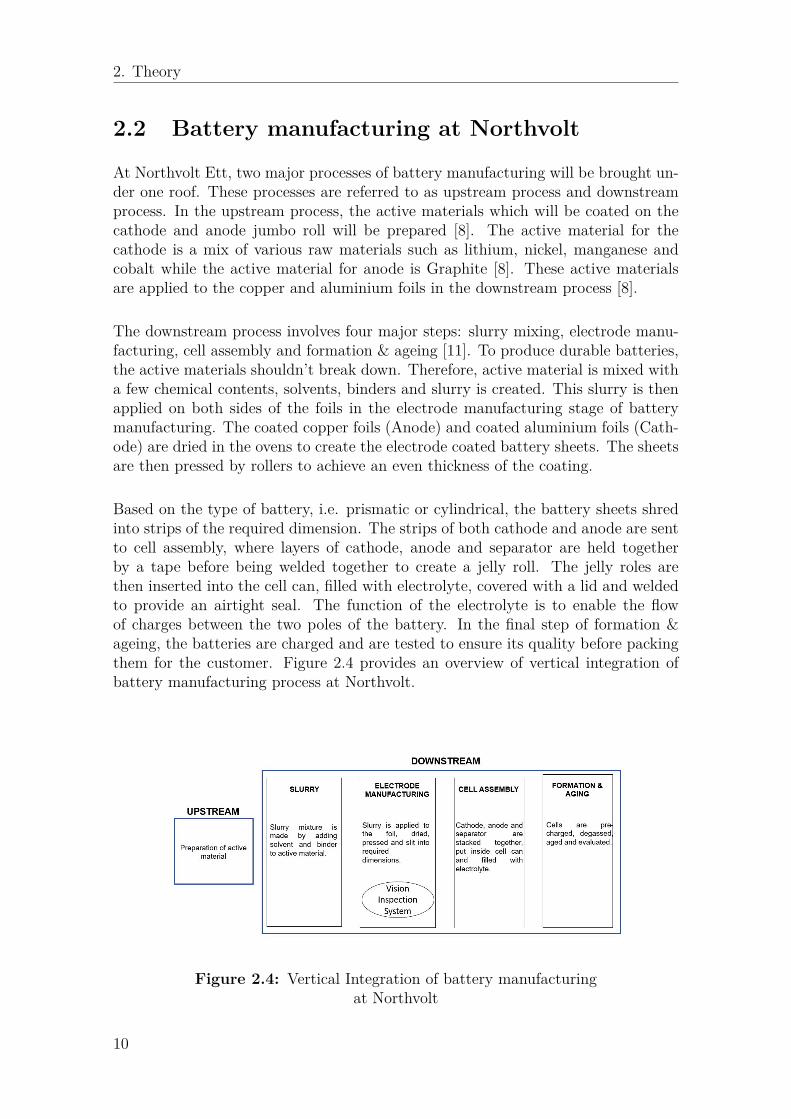
2.2 Battery manufacturing at Northvolt
At Northvolt Ett, two major processes of battery manufacturing will be brought un-der one roof. These processes are referred to as upstream process and downstreamprocess. In the upstream process, the active materials which will be coated on thecathode and anode jumbo roll will be prepared [8]. The active material for thecathode is a mix of various raw materials such as lithium, nickel, manganese andcobalt while the active material for anode is Graphite [8]. These active materialsare applied to the copper and aluminium foils in the downstream process [8].
The downstream process involves four major steps: slurry mixing, electrode manu-facturing, cell assembly and formation & ageing [11]. To produce durable batteries,the active materials shouldn’t break down. Therefore, active material is mixed witha few chemical contents, solvents, binders and slurry is created. This slurry is thenapplied on both sides of the foils in the electrode manufacturing stage of batterymanufacturing. The coated copper foils (Anode) and coated aluminium foils (Cath-ode) are dried in the ovens to create the electrode coated battery sheets. The sheetsare then pressed by rollers to achieve an even thickness of the coating.
Based on the type of battery, i.e. prismatic or cylindrical, the battery sheets shredinto strips of the required dimension. The strips of both cathode and anode are sentto cell assembly, where layers of cathode, anode and separator are held togetherby a tape before being welded together to create a jelly roll. The jelly roles arethen inserted into the cell can, filled with electrolyte, covered with a lid and weldedto provide an airtight seal. The function of the electrolyte is to enable the flowof charges between the two poles of the battery. In the final step of formation &ageing, the batteries are charged and are tested to ensure its quality before packingthem for the customer. Figure 2.4 provides an overview of vertical integration ofbattery manufacturing process at Northvolt.
Figure 2.4: Vertical Integration of battery manufacturingat Northvolt
10

2. Theory
2.3 Computer Vision
In manufacturing industries, quality control is integral to the organisation’s success.Over the years, demand for products with high quality and cheaper prices has in-creased which puts pressure on the manufacturers to have a robust quality controlsystem [12]. An automated quality inspection aid in the early detection of deviationoccurring in the manufacturing process and therefore the quantity of waste can beminimised. Among the automated quality control, computer vision is rising to be apopular choice as they help in non-contact, highly accurate complex feature analysis[12].
2.3.1 Vision inspection equipment at Northvolt
To perform quality inspection on battery sheets at various stages of electrode manu-facturing at Northvolt Ett, a visual inspection system is being developed. Differenttypes of vision inspection equipment are being designed to fit at certain processstages of battery manufacturing. The key components of the vision inspection equip-ment are frames, Contact Image Sensor (CIS), encoders and guide rollers. Figure2.5 represents the camera used in the coating process stage of battery manufacturingat Northvolt labs, which will be replaced with a CIS as shown in the figure 2.6.
Figure 2.5: Camera mounted on top of the frame tocapture images of electrode coated battery sheets at
Northvolt Labs[11]
11
2. Theory
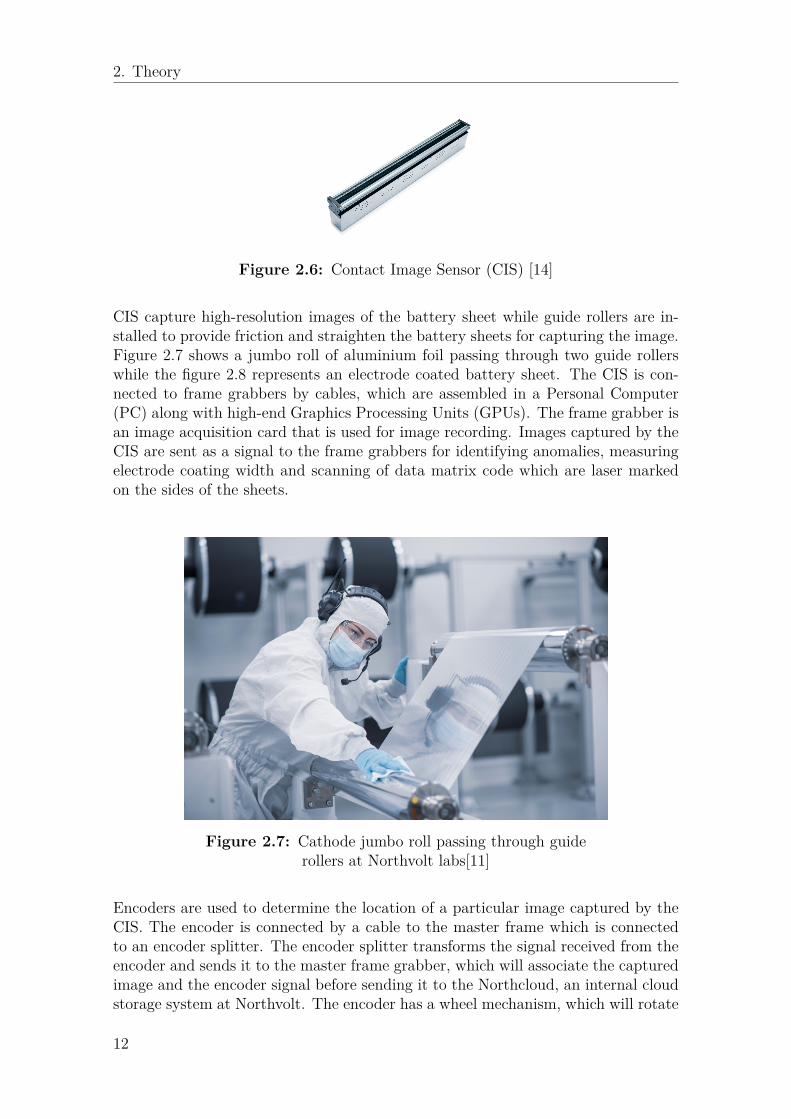
Figure 2.6: Contact Image Sensor (CIS) [14]
CIS capture high-resolution images of the battery sheet while guide rollers are in-stalled to provide friction and straighten the battery sheets for capturing the image.Figure 2.7 shows a jumbo roll of aluminium foil passing through two guide rollerswhile the figure 2.8 represents an electrode coated battery sheet. The CIS is con-nected to frame grabbers by cables, which are assembled in a Personal Computer(PC) along with high-end Graphics Processing Units (GPUs). The frame grabber isan image acquisition card that is used for image recording. Images captured by theCIS are sent as a signal to the frame grabbers for identifying anomalies, measuringelectrode coating width and scanning of data matrix code which are laser markedon the sides of the sheets.
Figure 2.7: Cathode jumbo roll passing through guiderollers at Northvolt labs[11]
Encoders are used to determine the location of a particular image captured by theCIS. The encoder is connected by a cable to the master frame which is connectedto an encoder splitter. The encoder splitter transforms the signal received from theencoder and sends it to the master frame grabber, which will associate the capturedimage and the encoder signal before sending it to the Northcloud, an internal cloudstorage system at Northvolt. The encoder has a wheel mechanism, which will rotate
12

2. Theory
when the battery sheets pass through the guide rollers. The encoder wheel will bein contact with the battery sheets (on one side in the uncoated area) and based onits rotation, the signals are sent to the encoder splitter which is then transformedto provide the location identity and time stamp for the captured image.
Figure 2.8: Electrode coated anode jumbo roll atNorthvolt labs[11]
2.4 Artificial Intelligence
Technological advancements such as Artificial Intelligence (AI) help humans to solvereal-time problems quicker with high accuracy by developing the machines to thinklike humans [13]. This can be achieved through machine learning and deep learning.
AI can be defined as the ability of a machine to think and make a decision for agiven problem without any human intervention [15]. AI systems are classified intothree types based on their ability to emulate human behaviours [15]. They are Ar-tificial Narrow Intelligence (ANI), Artificial General Intelligence (AGI), ArtificialSuper Intelligence (ASI) [15]. At present, only an ANI system exists and are alsoknown as weak AI as it can perform only a single task which it is programmed todo [15].
2.4.1 Machine learningMachine Learning (ML), which is a subset of AI shown in the figure 2.9 can learnand improve automatically based on the experiences and it doesn’t require emphaticprogramming [15]. ML systems are built using statistical learning algorithms[15].ML algorithms are classified into four types namely supervised learning, unsuper-vised learning, semi-supervised learning and reinforcement learning [17].
13

2. Theory
Figure 2.9: Hierarchy of AI, ML and DL [16]
In the supervised learning method, an algorithm is created by utilising the input dataset (labelled) and its corresponding response [15]. This algorithm trains a model topredict the response for the new data set [15]. In case of non-availability of a labelleddata set and its response, unsupervised learning can be used. The algorithm learnsabout unsorted information from the data set by finding differences and similaritiesin the pattern of the data [15]. There might be some cases in which more unlabelleddata are available than labelled data. In such scenarios, semi-supervised learning canbe used in which unlabelled data are used to extract information[17]. Reinforcementlearning is a type of machine learning algorithm developed on a trial and errormethod by continuously interacting with the environment and use feedback to learn[15].
2.4.2 Deep learning
Deep Learning (DL) is a technique of ML that is inspired by the functioning ofthe human brain[15]. The deep learning model functions through a neural network,which helps in filtering the input data to predict and classify the information[15].It functions based on neural network architecture [15].
2.4.3 Neural Network
In general, Neural Network (NN) is also known as an Artificial Neural Network(ANN) [18]. This network learns from the data through interconnected nodes andthe system can be trained to classify data and recognise pattern [18].
Neural network architecture is made of 3 basic layers: an input layer, an outputlayer and a hidden layer[18]. The number of hidden layers can be varied dependingon the complexity of the problem. The general architecture of a neural network isshown in the figure 2.10 [19].
14

2. Theory
Figure 2.10: Neural network architecture [19]
The mapping between the different layers can be either linear or non-linear transfor-mation [19]. In general, neural networks are constructed for classifier applications.The figure 2.11 represents a single layer network, which is widely used for binaryclassification [19]. The output of the neuron Y is [+1,1] as it is a single node [19].The goal of constructing such a network is to create an accurate mapping betweeninput data vector xj and to the output Yj [19]. In a single layer network, linearmapping is an easier option i.e. AX .= Y.
X is a column of the matrix of the input images while Y is a column of its corre-sponding labels [19]. Since the output is a single node, both A & Y matrices canbe reduced to vectors [19]. The matrix (vector) A, which is the linear map betweenthe input image and output layer can be determined by solving pseudo-inverse ofthe matrix X i.e. A .= Y X -1[19].
Figure 2.11: Single layer neural network [19]
As most of the problems faced by industries are complex, multi-layer neural net-
15

2. Theory
works are constructed which has more than one hidden layer. Thus the input neu-rons are mapped to the output neuron by non-linear transformation [19]. Non-lineartransformation functions are commonly denoted by y = f (A, x), where f (·) is anactivation function for the mapping [19]. An activation function, also known as atransfer function is used to decide whether a neuron should be in an active or inac-tive state [20]. It is determined by the sum of the weights and added bias, whichbrings in non-linearity of the output of the neuron [20]. The activation functionhelps in transferring the output in the range of either (0,1) , or (1,1) [20].
A neuron has five components: input, weight, bias, summation function, activa-tion function which is shown in figure 2.12 [21]. Inputs are the set of data for whichthe output has to be predicted. The input can be represented as an attribute orfeature in a data set [21]. The weight of input helps in understanding the impor-tance of a feature [21]. Weights with larger value have importance in the outputprediction [21]. The activation function is used for non-linearity in the model whilethe summation function is used to tally the inputs and its corresponding weightstogether [21]. When the value of the weight is changed, the steepness of the acti-vation curve changes which doesn’t help in achieving the range of output [0,1] [21].Thus, bias which is referred to as y-intercept in the line equation, is used to shiftthe activation function towards left or right to get the desired output [21].
Figure 2.12: Components of an artificial neuron [21]
2.4.3.1 Activation function
Activation functions are classified into linear and non-linear activation function [21].In linear activation function, the activation function is directly proportional to theinput [21]. It is denoted by the equation F (x) = ax , in which a is a fixed constantvalue and x is the input for activation function [21]. Non-linear activation functionsare classified into many different types among which four types are widely usedin industries and academia. They’re sigmoid function, hyperbolic tangent function(Tanh), rectified linear unit function (ReLU) and leaky rectified linear unit function
16

2. Theory
(Leaky ReLU) [21].
Sigmoid activation function is the most widely used activation function and givesthe output in the range of 0 to 1 [21]. Though it is the most widely used activationfunction, it is avoided in some cases due to its ’vanishing gradients’ [21]. Figure 2.13represents the curve of sigmoid function from which it is evident that the output issteep [21]. Changes in input by a smaller value nearer to 0 can result in a largerchange in the output; but at the either end of the curve, the gradient is small [21].
Figure 2.13: Sigmoid function curve [21]
Tangent hyperbolic function commonly referred as Tanh has a function curve asshown in the figure 2.14 in which the output is zero-centred [21]. Since it’s gradientis stronger than that of the sigmoid and also gives output in the range of -1 to 1, ithas no vanishing gradient problems [21].
Figure 2.14: Tanh function curve [21]
Rectified linear unit, also known as ReLu has become the most popular activationfunction in the field of deep learning [21]. The figure 2.15 shows the curve of theReLu function from which it can be seen that the curve looks linear. However, it isnon-linear and also avoids the vanishing gradient problem [21].
17

2. Theory
Figure 2.15: ReLu function curve [21]
As the gradient was zero for the negative inputs, this activation function faceda problem with the adjustment of weight for in making an optimized model [21].Hence, leaky ReLu was introduced and the curve of leaky ReLu is shown in thefigure 2.16 . This model will not saturate for any particular input [21].
Figure 2.16: Leaky ReLu function curve [21]
2.4.3.2 Backpropagation
The network weights, which was initialised with random values need to be deter-mined for prediction of the output with high relevance and accuracy; also to min-imise the misclassification [8]. The backpropagation algorithm helps to determinethe optimal weight of the network [8]. Referred to as backprop in general, as theadjustment to the weights of neurons start from the penultimate layer (last hiddenlayer) and it works on chain rule of differentiation [8]. The initial weights of thenetwork should have a random value and not zero [8]. As the sum of weight andbias gives value to a neuron, the value of weight being zero results in the valuesof all neurons being zero [8]. By feeding, the value of the neuron to the activationfunction, the value of every neuron for predicting the output is the same [8]. As thepurpose of each neuron is to identify a particular feature from the image (input),neurons holding the same value in a particular layer will not be able to learn to iden-tify any particular feature during the back propagation due to identical gradients[8].
18

2. Theory
2.4.3.3 Convolutional Neural Network - CNN
Today when someone suggests deep learning technique to a solve a problem, it ismost likely that they address the convolutional neural network (CNN) [8]. A CNNarchitecture can include any number of hidden layers. But the key layers in a CNNare convolution layers, pooling layers, padding layers, feature maps and fully con-nected layers [33]. The process of transforming the given input data into the outputthrough a number of layers (convolution, pooling, fully connected) is referred to asforward propagation [33]. Figure 2.17 represents an outline of CNN. The architec-ture of a CNN can be divided into two sections: feature extraction and classification[34]. All the above mentioned key layers are built within the feature extraction stageof a CNN architecture. The convolution layer is the fundamental layer of CNN thathelps in the extraction of features from an image through convolution and activationfunction [33]. The table 2.2 shows the parameters and some of their hyper parame-ters associated with different layers in a neural network [33]. These parameters areset before the training of CNN [33].
Figure 2.17: Outline of CNN [34]
Table 2.2: Parameters and their hyper-parameters in CNN [33]
Layer Parameter Hyper-parameterPooling layer None Stride, padding, type of pooling & filter sizeConvolution layer Kernel No. of Kernel & size, stride, padding.Fully connected layer Weight Activation functionOther layers None Learning rate, weight initialization, loss function
Convolution is a linear operation [33]. It is achieved by applying kernel across thetensor [33]. A tensor can be defined as an array of numbers determined for eachpixel in an image [33]. Figure 2.18 represents the tensor for an image that has thenumber 8 [33]. In deep learning techniques, computers take an image as an arrayof numbers. This array is created based on the pixel brightness of each pixel in animage. The pixel value can either range from 0 to 1 or 0 to 255 (depends on the
19

2. Theory
user’s preference) where 0 represents a dark pixel and the highest number representsa bright pixel.
Figure 2.18: Example of Tensor[33]
Kernels are an array of numbers that are used to extract a particular feature froman image to predict the output [33]. Hence, each kernel layer vary in number ofarrays. Element wise multiplication between the elements of the tensor & kernelfollowed by a summation of the values result in a feature map. Figure 2.19 repre-sents a feature map in which the 9 elements (highlighted) are multiplied with thecorresponding element in the kernel; the product of each element-wise multiplicationis then summed to achieve the value for the first element in the feature map [33].
Figure 2.19: Convolution operation-1[33]
To obtain value for the remaining elements in the feature map, the stride is per-formed. The stride can be defined as a parameter that controls the amount of pixelmovement in an image. By comparing the figure 2.19 with figure 2.20, one canunderstand that the stride value is 1 as the pixel movement is by 1. In the caseof stride value being 2, the first layer for element-wise multiplication will be the
20

2. Theory
third layer of the input image. The movement of stride happens both vertically andhorizontally to achieve a feature map. Sharing the kernel across the image gives amajor benefit of reducing the number of parameters in the model and it results inhigh efficiency [33].
Figure 2.20: Convolution operation-2[33]
The creation of a feature map helps in the dimensional reduction of the input imagewithout loss of key parameters [33]. For high accuracy in image analysis, paddinglayers are added to the input image [33]. Padding can be defined as the addition oflayers to the border of an image [33]. These layers hold the value of zero as they justassist in better analysis of the image and doesn’t hold any parameter of the inputimage [33]. When the padding value is 1, it represents a layer around the border ofan image is added. Figure 2.21 shows CNN operation performed on an input imagewith padding of 1.
Figure 2.21: Padding[33]
To reduce the dimensions of the feature map, a pooling operation is performed [34].In practice, two types of pooling method are used depending on the application;Maximum pooling and average pooling [34]. In maximum pooling, patches are
21

2. Theory
extracted from the feature maps and the maximum value from each value is used inoutput by discarding other values [34]. Figure 2.22 shows the values for a maximumpooling layer and an average pooling layer of the same feature map. In averagepooling, feature maps are down-sampled by taking the average of all elements in afeature map. Average pooling is popular as it has two major advantages [34].
• Reduction in number of parameters• Inputs of variable size can be accepted by the CNN.
Figure 2.22: Pooling[34]
2.5 Industry 4.0Industry 4.0 is one of the most widely discussed topics in the industrial sector andacademics. The attention towards industry 4.0 can be of two aspects [22]:
• It’s the first industrial revolution which is not observed post-development butpredicted theoretically.
• It promises to improve operational efficiency, which will have a huge economicimpact.
Industry 4.0 refers to the fourth industrial revolution that the world will see in thenear future. The first industrial revolution dates back to the 18th century duringwhich manual work has been transformed into mechanical production facilities [23].Electrification and Taylorism (System of scientific management) paved way for thesecond industrial revolution [23]. At present, a large number of industries across theglobe are designed to fit in the third industrial revolution, which is often referred toas the digital revolution [23]. The production processes are automated and the in-dustries make use of electronics advancement and information technology [23]. Thefourth-generation focuses on a paradigm shift towards a decentralised productionprocess from a centrally controlled process [23]. The term ’Industry 4.0’ is derivedfrom the word ’Industrie 4.0’ which was coined by a working group with representa-tives from academia, industry and politics at the Hannover fair in Germany in 2011[23]. In 2013, the working group recommended three components for implementa-tion which will act as the primary pillar for Industry 4.0. The three components
22

2. Theory
are smart factories, Internet of Things (IoT) and Cyber Physical Systems (CPS) [24].
IoT is a key enabler for the fourth generation of industry as it enables the con-nection between the virtual world and the physical world [23]. This connection isachieved through the CPS as it helps in the integration of physical processes andcomputational processes by using embedded computers and networks [25]. Integrat-ing the IoT and CPS helps in achieving a smart factory that assists the machinesand workers in task execution [24]. The nine pillars of Industry 4.0 will help theproduction facility to achieve fully integrated, automated and optimised productionprocess [26]. The nine pillars of Industry 4.0 are [26]
• Big data analytics• Autonomous robots• System Integration• Simulation• Industrial internet of things• Cyber security and cyber physical systems• The cloud• Additive manufacturing• Augmented reality
2.5.1 Big DataBig Data can be defined as the collection and analysis of large data sets [28]. Thedata sets can be analysed computationally to extract information for decision mak-ing [28]. The five Vs of big data are [28]:
• Volume - size of the data• Velocity - data in-flow pace (from machine, network etc.)• Variety - structured & unstructured data• Veracity - uncertainty of data• Value - economical benefits
Big data analytics is an approach to manage, process & analyse 5Vs of data to ob-tain actionable information for performance improvement [28]. Insights that can beextracted from the big data will help an organisation in making smarter decisions[29]. The insights from the big data cannot be automatically extracted [29]. A col-laboration between the data analyst and business managers is required to processthe big data into knowledge using the data analytics tool [29].
A major reason for the growth of big data is the speed at which data is generatedand collected [28]. However, this data is underutilised and a study [30] shows thatorganisations analyse only 0.5 % of the collected data.
23

2. Theory
24

3Methodology
This chapter covers the research approach, method and ethics followed.
3.1 Research approachThe first step to be performed in any research project is the selection of a researchapproach, which can be defined as the drafting of plans and procedure for the re-search which includes data collection, data analysis and interpretation [27]. Creswellproposed three different types of research approach which are qualitative method,quantitative method and mixed-method [27]. He also proposed a framework for re-search, as shown in figure 3.1, which explains the three components involved in anyresearch approach.
As the manufacturing of lithium-ion batteries for the transportation and energysector is in its preliminary stages, the number of research studies performed in thisfield is less. Therefore, this research was designed to be an exploratory study forwhich qualitative research approach is more suitable [27].
Figure 3.1: Framework for research [27]
25

3. Methodology
3.2 MethodsThe steps followed during the different stages of the thesis are explained in thefollowing sections. An overview of the method followed is shown in figure 3.2.
Figure 3.2: Overview of method
3.2.1 Literature StudyA review of literature on the topic of research needs to be performed as it helpsto understand the results of similar studies performed by others, fill in the missingknowledge and also for comparing the results of different findings [27]. At first,the topic of research has to be established to decide the consideration of literature[27]. As this research focuses on identifying ML techniques for anomaly detectionon electrode coated battery sheets in battery manufacturing and the opportunitiesto incorporate standards of industry 4.0, literature review was performed on thefollowing topics:
• Lithium-ion batteries• Quality inspection in battery manufacturing• Vision inspection & computer vision• Anomaly detection• Image impainting• Deep learning & neural network• Industry 4.0• Big data
26

3. Methodology
Creswell recommends a seven-step approach to conduct the literature review. Thevital steps are identification of keywords, identifying the useful literature, designinga literature map and summarise the literature [27]. The above mentioned topics(for a literature review) were used as keywords to find the relevant literature. TheScopus database was used to find the literature. To find the most relevant articles,scientific papers and books, the keywords were used in various combinations. Someof the combinations are ‘Anomaly detection’ & ‘deep learning’, ‘Vision inspection’ &‘neural network’ etc. The filtering criteria were the year of publication and language.Articles and journals that are published after 2014 and in the English language wereselected. Based on the title and abstract, articles and publications were furtherskimmed. The Snowball method of finding literature from the bibliography sectionof literature was also performed to collect more literature that has high relevancyto the topic of study.
A literature map helps to summarise the research work which was conducted in thepast and helps in presenting how the proposed research extends or replicates previ-ous research [27]. This map can be presented in different ways. Popular methodsare flowchart, hierarchical structure and series of circles. Figure 3.2 represents theliterature map which was created by following the guidelines in [27].
Figure 3.3: Literature map
3.2.2 Qualitative studyThe term ’Qualitative study’ is framed as it includes open-ended questions and morenon-numerical data [27]. A qualitative study generally involves collection of datafrom the participants/stakeholders, analysis of the data to create a general themefor interpreting the meaning of the data and validating the data [27]. This studytypically involves various data collection techniques as each has its advantages &limitations. The different data collection methods used in the research project areobservations, interviews, documents & audio-Visual materials.
27

3. Methodology
For each of the above-mentioned data collection type, there are several approachesto collect the data [27]. Table 3.1 shows the different data collection approachesused in this research.
Table 3.1: Data collection approaches
Interviews1. Conducting unstructured interviews with open-ended questions.2. Conducting semi-structured interviews and create interview notes.Observations1. Field study by conducting an observation of the battery manufacturing process.2. Field study by spending more time with the domain experts.Documents1. Studying of journals during the research stage.2. Analysing internal documents related to the vision system at Northvolt.Audio-Visual materials1. Examining photographs of defects and quality samples.2. Examining videos of battery manufacturing processes at Northvolt.
Five formal structured interviews were conducted to collect data. The selected ex-perts and their field of work are mentioned in the table 3.2. These experts areselected as they play a major role in the development, commissioning and evaluat-ing the performance of vision inspection system post commissioning. In order tounderstand the experts’ field of work and to frame questions for the formal struc-tured interview, a few unstructured interviews were conducted with the experts.Upon understanding their respective role and current work, literature was studiedto formulate the questions for the formal structured interview. Some of the topicson which the interviews were conducted with respective experts is described in table3.2.
Table 3.2: Interviews
Expert Domain Topic of discussionExpert 1 Machine learning Image impainting, neural network
& it’s componentsExpert 2 Software development Image capture, GPU perfor-
mance, big data & APIExpert 3 Process quality Anomaly types, quality inspec-
tion process & feedback systemExpert 4 Quality and product Anomalies & it’s root cause, in-
spection stages, image augmenta-tion & defect data
Expert 5 Project management (technical) Image augumentation, neuralnetwork, feedback system &feasibility of ML models
28

3. Methodology
Data analysis in a qualitative study should happen simultaneously with data collec-tion to sense the meaning of collecting data [27]. As all the observed or identifiedinformation cannot be used in the study, data analysis will help in focusing on essen-tial information for the research and disregard the other information [27]. Codingin data analysis can be defined as the process of organising the collected data intocategories to interpret the meaning of the data. Figure 3.4 shows the steps carriedout for analysing the data.
Figure 3.4: Data Analysis. Adjusted illustration, originallyfrom [27]
Data validation is the final step in a research study before presenting the results. Ithelps the researcher to understand the accuracy of the information derived from theresearch [27]. In general, there are eight different types of data validation technique[27]. Triangulation technique was used in this research study to validate the collecteddata. This technique was chosen as the data for this research study was collectedfrom different sources.
3.3 EthicsFor conducting a responsible research project, one must always ensure that ethicsis being followed throughout the project work. Every aspect of the research designmust include ethics [31]. In this research project, the utmost care has been takenin following the agreed confidentiality, intellectual property, integrity etc. All theinformation that is mentioned in this report is either already published by Northvolt,which are available for public access or it has been approved by Northvolt to bepublished in the report. During the qualitative study, no interviewees were obligedto answer the questions which were considered to be confidential to the company.
29

3. Methodology
30

4Results
The key findings from the field study, literature and the results of qualitative studyare presented in this chapter.
4.1 Anomaly DetectionManual surface inspection of a product in any production environment has becomea tedious task as it leads to subjective assessments and overlooked errors; henceautomation of the surface inspection is being widely preferred [37]. The anomalydetection on the electrode coated battery sheets in the battery manufacturing pro-cess at Northvolt can be associated with surface defect inspection, as the goal ofboth anomaly detection (in general) and surface inspection (in general) is to iden-tify abnormal patterns/ detection of pattern which deviate from the normal pattern.Therefore, the manufacturer must have a well defined quality standard which ex-plains the quality acceptance criteria for the product i.e. distinction of permittedsurface. As the production of batteries at Northvolt Ett is yet to commence, thequality standards which are used as reference for development of Machine Learning(ML) model for anomaly detection are being defined based on the production outputof batteries from Northvolt Labs.
The current strategy (of the company) is to perform anomaly detection in a two stepprocess. First, a Deep Learning (DL) model will be used to identify the abnormali-ties in the battery sheets. After identifying the abnormalities, the image (data) willbe sent to a second DL model which will classify whether the detected abnormalityis an anomaly or not. The first model, which is to identify the abnormalities is beingtrained on a fault free/good material sample, while the second model for classifyingwhether anomaly or not is still under development.
Among the several ML & DL approaches, the initial choice by Northvolt for devel-opment of a model to detect the anomaly was image impainting, which is based onDL technique.
4.1.1 Image ImpaintingImage impainting can be defined as a DL process of completing an image by re-covering the missing region [38]. In other context, image impainiting is also a DL
31

4. Results
process to remove unwanted objects from an image [38]. Therefore the purpose ofimage impainting can be classified into three categories: Image restoration, imageediting and image coding for transmission [38]. The image impainting model usedfor anomaly detection falls under image restoration.
In this technique, the input images are corrupted/masked, i.e. certain pixel whichmight have important attributes are removed and the region remains empty. Thisimage is fed into a neural network which helps in restoring the original image byfilling in the masked region. Among the several types of neural network architecturesthat can be used for image impainting, an architecture similar to U net was selected.Figure 4.4 shows the standard U net architecture.
Figure 4.1: U net architecture [39]
In order to carry out the process of image impainting to detect the anomalies onthe battery sheets, the image captured by CIS has to be to be scaled down intosmall patches with a smaller resolution. This is because the image captured by theCIS will have an image resolution of 600 dpi, which is a very high resolution. Foranalysis of a high resolution image, the computational power requirement is highand the prediction time is longer. Hence scaling down the high resolution image isa better way to perform image analysis. The goal of the anomaly detection is todetect the abnormalities from the image, not to conclude whether the whole imageis normal or abnormal. Therefore, by extracting a small patch from a whole imagehelps in creating a bounding box around the anomaly region and makes it easier toidentify the anomaly present in the battery sheet.
Small patches from original high resolution image can be extracted through a neuralnetwork by a fixed patch size & stride value. Figure 4.2 shows the model represen-
32
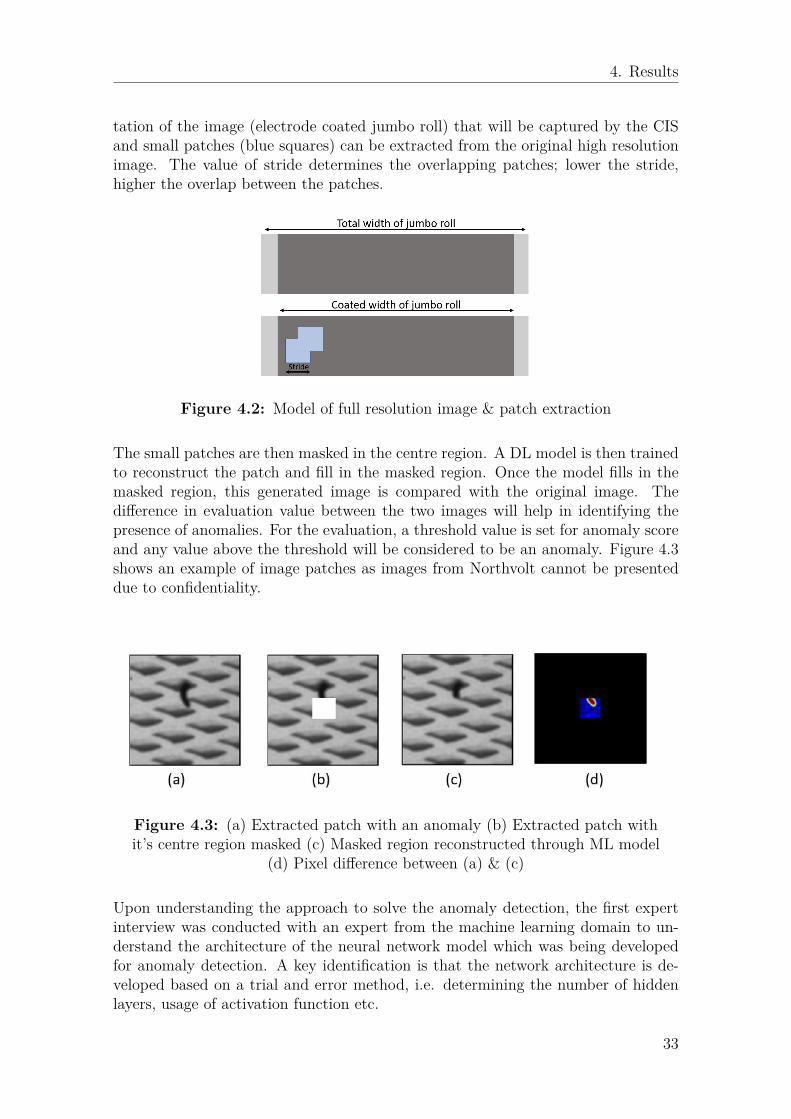
4. Results
tation of the image (electrode coated jumbo roll) that will be captured by the CISand small patches (blue squares) can be extracted from the original high resolutionimage. The value of stride determines the overlapping patches; lower the stride,higher the overlap between the patches.
Figure 4.2: Model of full resolution image & patch extraction
The small patches are then masked in the centre region. A DL model is then trainedto reconstruct the patch and fill in the masked region. Once the model fills in themasked region, this generated image is compared with the original image. Thedifference in evaluation value between the two images will help in identifying thepresence of anomalies. For the evaluation, a threshold value is set for anomaly scoreand any value above the threshold will be considered to be an anomaly. Figure 4.3shows an example of image patches as images from Northvolt cannot be presenteddue to confidentiality.
Figure 4.3: (a) Extracted patch with an anomaly (b) Extracted patch withit’s centre region masked (c) Masked region reconstructed through ML model
(d) Pixel difference between (a) & (c)
Upon understanding the approach to solve the anomaly detection, the first expertinterview was conducted with an expert from the machine learning domain to un-derstand the architecture of the neural network model which was being developedfor anomaly detection. A key identification is that the network architecture is de-veloped based on a trial and error method, i.e. determining the number of hiddenlayers, usage of activation function etc.
33

4. Results
4.1.2 AutoencoderBy understanding the U net architecture for image impainting, some of the possibleidentified issues which can arise are:
• Masked region can create problems due to batch normalisation.• The boundaries near the masked region can also be treated as masked region,
especially in the lower resolution images.• The image resolution can be low after the reconstruction through the U net
might.
Therefore an alternative architecture for U net was identified. Autoencoders areunsupervised method which has three components in it’s architecture as shown infigure 4.4. The components are encoder, bottleneck and decoder. The encodercompress the input data into lower dimension and create a latent space. The com-pression of input image is processed by convolution. Bottleneck, which is a hiddenlayer remembers the latent space. Latent spaces are the most important feature/at-tribute of an image that are retained after the compression of input image. Thedecoder decompresses the image back to it’s original dimension through convolutiontranspose. Though the architecture and working of U net and autoencoder look thesame, the primary difference between the approaches is that autoencoder convertsthe high dimensional image into a low dimensional image and then reconstructs.TheU net architecture will perform image to image translation.
Figure 4.4: Architecture of autoencoder [42]
Autoencoders can be classified into various types depending on the application. Forimage impainting, denoising autoencoders must be used as it gives the output of acomplete image when a corrupted/masked image is given as an input. To performthe image completion, the deep learning model must be trained with huge data tocreate a powerful latent space [42].
34

4. Results
As the objective of these architectures is to learn a representation to minimise thereconstruction loss, the latent space/feature representation has to be a small. Inthis way, the autoencoders can outperform the U net architecture. The architecturefor autoencoders can be varied, i.e., the number of hidden layers can be chosen de-pending on the application. A deep autoencoder with high number of hidden layerswill result in faster training and can also be achieved with less training data. Theidentified abnormalities can be highlighted on the image by creating a bounding box.
The autoencoder can reconstruct an image better than U net architecture and helpsto identify the abnormalities. However, the requirements are to identify whetherthe abnormality is an anomaly or not. In case of an anomaly, the model must alsoclassify it into the most suitable type of anomaly. The identification of anomalycan be achieved through a binary image classification - Convolution Neural Network(CNN).
4.1.3 Image classification
The preference of DL over ML in the computer vision application is due to theability of the neural network to train on its own based on the training data. CNNpredominately use deep learning approach. Deep learning anomaly detection is oftwo types: multi class anomaly detection and one class anomaly detection [40]. Inone class anomaly detection, a model is trained using only the non faulty images;whereas multi class anomaly detection models are trained using both faulty andfault free samples [40]. For building a DL model to predict the anomalies andclassify different types of anomalies, multi class anomaly detection method can beused and the most preferred architecture for this type is CNN [40]. Various types ofCNN architecture have been developed in recent years. Most architectures involveconvolutional layer, pooling layers, feature map generation and fully connected layer.The difference between the different architectures are:
• Sequence in which the convolution operation is performed• Number of convolutional layers and pooling layers• Kernel size and stride value• Size of the image input.
Research studies show that three types of neural network have been widely pre-ferred for image classification and object recognition applications. They are AlexNet,VGG16 & LeNet. All three types of neural networks were studied to identify theadvantages and disadvantages in the context of anomaly detection. Figures 4.5,4.6 & 4.7 represent the sequence of convolution operation and hyper parametersin AlexNet, VGG16 & LeNet respectively. The sequence of convolution operationand their hyper parameters were derived from the architecture for all three types ofneural network which can be referred to in Appendix A.
35

4. Results
Figure 4.5: Summary of AlexNet architecture [46]
Figure 4.6: Summary of VGG16 architecture [47]
Figure 4.7: Summary of LeNet architecture [48]
36

4. Results
4.2 Anomalies and data
4.2.1 Types of anomaliesThe focus was shifted to understanding the anomalies which have to be detectedby the DL model. The available documents and visual materials at Northvolt werestudied to frame questions for two formal structured expert interviews. One of theinterviewee was responsible for the process quality while the other interviewee wasresponsible for product quality.
Based on the data collected from both the interviews, the anomalies which have tobe detected through vision inspection can be categorised into two criteria namelyvisual criteria and dimensional criteria. Visual criteria include anomalies that canbe identified by the deviation on the coated surface and these anomalies can be la-belled with the most suitable classification. However, dimensional criteria anomalieshave to be classified based on the length & depth of the anomaly.
The two types of anomalies, i.e. visual criteria and dimensional criteria can be col-lectively classified as low-level anomaly. High-level anomaly can be defined as a setof low-level anomalies grouped together. Low-level anomaly helps in understandingan anomaly in detail and also help in identifying the root cause. High-level anomalyhelps in identifying the frequency of a set of low-level anomalies to understand theprocess deviation.
The data on performance of the battery and risk of safety which can arise due tothe anomalies were also collected. In case of a new anomaly identified at coatingprocess stage in Northvolt labs, the material (battery sheet) is taken to the qualitylaboratory for examining the new anomaly. However, this activity is not possiblein the production line at Northvolt Ett as the flow of material (electrode sheet) isexpected to be at a rate of 80m/min and the material can be 3000 metres long aftercoating. Therefore a quality standard for the electrode coated battery sheet has tobe established and the data of various types of anomalies have to be collected if theDL model has to categorise the anomaly into different types.
4.2.2 Training dataThe data that are currently used to train the DL model to identify the abnormalitiesare images of non-defective/fault free samples samples of electrode coated batterysheets. As image impainting model is used to predict the presence of abnormality,a data set with fault free samples will be sufficient. However, if the model has toidentify and further classify the anomaly, labelled data of defective samples shouldalso be used in the training of the model. The data used to train any ML/DL modelis categorised into three sets: test set, training set & validation set. The images inthe training set will be used to train a model. After the training, test set of data willbe used to evaluate the performance of the model. This process is repeated until
37

4. Results
the model has an high prediction accuracy. The final model will be evaluated usingthe data in the validation set.
Figure 4.8 represents an EPOCH and this figure was created based on the datacollected during the qualitative study. EPOCH can be defined as the number ofbatches of input data set used to train a ML/DL network. Feeding the networkwith all the training data at once will not help in optimising the weights and biasesof the neuron for accurate prediction. Hence the available data in the training sethave to be divided into batches and fed in batches to train the network.
Figure 4.8: EPOCH
When a model is trained by repetition of the same data, it leads to over-fitting ofdata, i.e. the model developed to predict an unseen image might fail as it mightbecome accustomed to the data provided for training. Therefore, it is important touse new data every time to optimise the model and data used in the training setshould not be used in the test set/validation set and vice versa. A key issue in thecollection of images (data) at Northvolt Labs is that the current vision inspectionsystem utilises a camera, while the vision inspection system at Northvolt Ett willutilise a Contact Image Sensor (CIS). As the camera in the vision inspection equip-ment at Northvolt Labs has a deep focal length and requires a long light path, theyare mounted at a certain height and therefore the image quality might not be suit-able for collection of faulty samples. However, CIS will be mounted at a clearanceheight of < 10mm as the contact image sensor captures the image as electrical signals(LED light reflected by the battery sheets will contact the sensor and this reflectionpath is adjusted by a rod lens). Thus the image acquired through the CIS has avery high resolution & quality and this data will help in building a better DL model.
To address the lack of data for training, image augmentation can be used, i.e. syn-thesis of artificial image to be used as data for developing the model. The resultsof the expert interviews were mixed as the experts from the field of process qualityand product quality said that it is not possible to replicate the a original defect by
38

4. Results
synthesis while the other experts believe that it is the best way to carry forward thedevelopment of the model.
4.2.3 Image AugmentationAs there is a shortage in the data availability for building a DL model to cate-gorise the identified anomalies, image augmentation can be performed to createmore data which can be used in training, test and validation data sets of the model.For performing image augmentation, various deep learning approaches can be used.Generative Adversarial Network (GAN) has proven to be the best approach for im-age augmentation as it provided greater results at various applications compared tothe other DL approaches. Figure 4.9 represents the model of a GAN.
Figure 4.9: Architecture of GAN [41]
GAN has two main components: Generator and Discriminator [41]. Original samplesare directly fed to the discriminator. For creating fake samples, latent space whichhas the most important attributes from the fault free sample image is passed throughthe generator. Both discriminator and generator are neural networks. Once a fakesample is created, it can be fed to the neural network of discriminator. After analysis,the discriminator will output whether the input image is real or fake. Thus thediscriminator model is trained and optimised until it classifies the fake samplesare real samples. This in turn means that the generator creates indistinguishablefake samples that can be used in the training data set. The latent space whichis considered as the input for the generator for the image can be created throughautoencoders.
4.3 Big Data AnalysisIn the theory section 2.6, it was mentioned that the big data has 5 Vs which arevolume, velocity, veracity, variety and value, which can also be called big data char-acteristics. From the detailed literature study, it can be concluded that most of the
39

4. Results
articles, research papers stress only upon 4 V, leaving value, while some publica-tions included 6th V which is variability. Each of the big data characterstics haschallenges, some of which are explained in the table 4.1 [43].
Table 4.1: Challenges of big data characteristics
Character ChallengesVolume Non-linearity, variance and bias, class imbalanceVelocity Data availability, real time processingVariety Data locality, data heterogeneity, noise in dataVeracity Data uncertainty, noise in data
The big data, which are collected in large data sets can provide insights into the pro-cess from which it is collected through the creation of knowledge. Information canbe converted into valuable knowledge through patterns, insights and can thereforesolve problems to improve productivity and also in identifying the opportunities todevelop the work method [44]. The important feature of knowledge creation is itsrelevancy to the knowledge of the existing information [44].
The information is considered as the central part of knowledge creation and an in-formation is converted into knowledge when a particular context is added to theinformation [44]. Knowledge can be categorized into two types: explicit knowledgeand implicit knowledge [44]. Explicit knowledge is important in the big data anal-ysis as this knowledge can be stored, processed and shared as a data [44].
Process mining is a Big Data Analysis (BDA) technique that is used to discover andmonitor the process data for improving the process [45]. An organisation can per-form process mining in three different ways [45]. Organisations can create a processmodel depicting the actual behaviour of the recorded data [45]. Organisations cancompare the present behaviour with the prior model to detect the deviation of theprocess from the actual target [45]. The existing process model can be improved bythe organisation based on the available information [45].
Different process mining techniques such as data pre processing, design analysis, etc.has to be used when process mining is applied to a regulated production process[45]. The production process at Northvolt Ett is highly regulated and it can providea huge amount of data in a structured and detailed manner. But the human centricbehavioural process might not be tracked in a digital method and therefore it createsa challenge to develop this data collection in-order to avoid the incomplete data set[45].
40

5Discussion
In this chapters, the findings, which are presented in the results section are discussedand how they answer the research questions. Recommendations for future work arealso presented.
5.1 Answers
5.1.1 Research Question 1Each of the neural networks mentioned in the results chapter has both advantagesand disadvantages. One of the most common disadvantage with all neural networkmethods is that it requires high computational power for training the model. Fromthe interview with a software development expert, the need for high computationalpower was identified. Regular computers can be linked to external hardware withhigh performance GPU for training the model. By linking an external GPU, anycomplex neural network can be trained as the CPU transfers memory to GPU mem-ory for performing the computations.
Various open source platforms such as tensorflow, keras are available for traininga neural network. These open source platforms are libraries which have back endcalculations required for training a neural network. Therefore the networks can betrained on this platform as the coding for the network is simplified. The user justneeds to call specific libraries through codes and tune the parameters to train themodel. In this way, time can be saved in modelling the network. Usage of highperformance GPUs will also help in lower computational and training time.
In general, computer vision is performed to identify an object from a given image.The majority of the computer vision tasks function based on neural network archi-tectures. Based on the neural networks used, computer vision tasks can be classifiedinto three categories: Image classification, Object Localisation and Object Detec-tion [43]. As the complex purpose of vision inspection is to classify the anomalies, itcan be categorised into image classification for which neural networks are the mostpreferred architecture.
From the literature study it was observed that the programmers choose a neuralnetwork based on the application and then shape the network for that particularapplication. This is why numerous types of CNN are in existence. Developing a
41

5. Discussion
model in this approach will add bias to the model being developed as a formalstakeholder analysis has not been performed before the development of the modelfor a particular application. Thus the research work filled in the gap as variousstakeholders of vision inspection system were interviewed as a part of the qualita-tive study.
RQ 1: How to detect anomalies on the battery sheets using a machine learningmodel?
The anomalies on the battery sheets can be detected through various deep learningtechniques. The image captured by the CIS can be fed into a neural network modelwhich has been trained with different data. The selection of neural network modelplays the key role as it directly affects the training time and computation require-ment. The image impainting technique can be used to find the abnormalities presentin the image. Performing the image impainting through autoencoders will help inachieving faster and better results. Following the approach of image impainting willresult in development of three different models to identify, classify and categorisethe anomalies.
A binary prediction CNN can be used to directly classify an image as anomaly ornot. This can be achieved by training the network with faulty and fault free samplesas it transforms from one class to multi class anomaly detection. A second modelcan be used for high level classification of the anomalies. One major problem withCNN is that it does not have a longer memory. This means that the model willfail to classify the anomalies accurately if it has not performed the same predictionin recent time. As the processes in battery manufacturing will be optimised basedon the leanings to avoid anomalies, using a low level classification model will notprovide satisfactory results as anomalies might not occur after process optimisation.Hence high level anomaly prediction has to be used for better performance.
The mitigating solution for low-level anomaly detection is by using a Long shortTerm Memory (LSTM) algorithm. It helps in creating a cell state of the model andkeep the information upon learning. But for the initial stages of battery production,high-level anomaly detection can be preferred. LeNet network will be the most suit-able CNN as the input size of image for the network is 32x32, which is close to thesize of the patch extracted from the high resolution image. Another advantage isthat the network was developed using a grey scale image and the image which willbe fed to the model for prediction and classification of the anomaly is also grey scale.
RQ 1.1: What is considered to be an anomaly in the battery sheets?
In battery sheets, anomalies are deviations that occur on the surface of the activematerial. All observed deviations might not be necessarily anomaly. A deviation isconsidered to be anomaly when the usage of material (battery sheet) which has a de-viation will hinder the performance of Li-ion battery. Despite different materials andchemical compositions used to create active material, the anomalies on the cathode
42

5. Discussion
and anode can be classified as same. These anomalies can be classified into high-level and low-level anomalies. High-level anomalies are a set of low-level anomalieswhich resembles the same. Low-level anomalies are collection of all anomalies whichcan arise on the surface of electrode coated battery sheets.
RQ 1.2: Does incorporating a feedback loop helps in better classification of theanomalies?
The second DL model which is being developed for classifying the abnormalities asanomaly or not, will include a feedback loop through which user can grade the im-age frame as OK (Not an anomaly) or NG (Anomaly). This feedback loop will nothelp in achieving in higher accuracy of prediction as human (operator) results mightbe biased as it is as subjective assessment. However, incorporating of the feedbackloop will help in labelling the images as anomaly or not which are found to haveabnormalities. These images can later be used to transform the model training intoa supervised method as neural network methods are forms of unsupervised learning.
5.1.2 Research Question 2Current technologies help in collecting vast amounts of data at every process stagein the manufacturing at a lower cost. Though the collected data has been utilised atsome stage for measuring the performance of the product or process quality, thesedata create a vast pool and therefore makes it difficult to convert the data into value.Hence, the huge amount of big data doesn’t necessarily makes it advantageous.
The attention must be given to a continuous analysis of big data and take necessaryaction to avoid risk situations from the manufacturing. Number of unstructureddiscussions and a structured interview with an expert from the software field wereconducted to gain insights on how the data collection flow through Northcloud (cloudused within the factory) from one process to the other.
Another major problem with the big data is that the format in which the data iscollected from the different manufacturing stages; they are not standard. Some datacan be fit into a spreadsheet while data collected from the vision inspection systeminclude text data and image data.
A major misconception that is very common in big data analytics are differencesbetween data, information and knowledge [28]. Clear understanding of the threethree constructs help in converting the data into meaning values.
By following the framework suggested in [28], the anomaly data along with thewidth dimension data which will be collected from the vision inspection system canbe translated into knowledge based on which decision can be made. Big data thatare collected has a greater value and meaning at the time of collection. Some datamight hold any context in future and therefore it cannot be converted into an action-
43
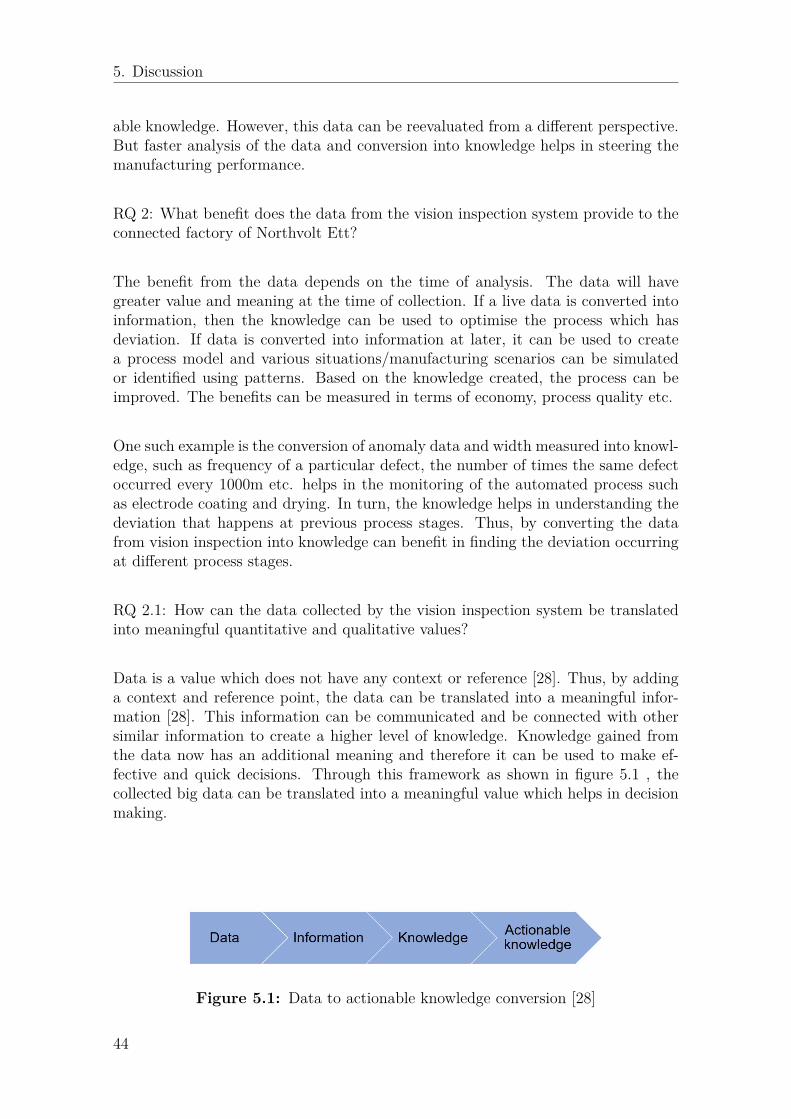
5. Discussion
able knowledge. However, this data can be reevaluated from a different perspective.But faster analysis of the data and conversion into knowledge helps in steering themanufacturing performance.
RQ 2: What benefit does the data from the vision inspection system provide to theconnected factory of Northvolt Ett?
The benefit from the data depends on the time of analysis. The data will havegreater value and meaning at the time of collection. If a live data is converted intoinformation, then the knowledge can be used to optimise the process which hasdeviation. If data is converted into information at later, it can be used to createa process model and various situations/manufacturing scenarios can be simulatedor identified using patterns. Based on the knowledge created, the process can beimproved. The benefits can be measured in terms of economy, process quality etc.
One such example is the conversion of anomaly data and width measured into knowl-edge, such as frequency of a particular defect, the number of times the same defectoccurred every 1000m etc. helps in the monitoring of the automated process suchas electrode coating and drying. In turn, the knowledge helps in understanding thedeviation that happens at previous process stages. Thus, by converting the datafrom vision inspection into knowledge can benefit in finding the deviation occurringat different process stages.
RQ 2.1: How can the data collected by the vision inspection system be translatedinto meaningful quantitative and qualitative values?
Data is a value which does not have any context or reference [28]. Thus, by addinga context and reference point, the data can be translated into a meaningful infor-mation [28]. This information can be communicated and be connected with othersimilar information to create a higher level of knowledge. Knowledge gained fromthe data now has an additional meaning and therefore it can be used to make ef-fective and quick decisions. Through this framework as shown in figure 5.1 , thecollected big data can be translated into a meaningful value which helps in decisionmaking.
Figure 5.1: Data to actionable knowledge conversion [28]
44

5. Discussion
5.2 Recommendations to NorthvoltIn this thesis more focus and attention was given to the ML or DL method by whichthe anomaly detection can be performed. One of the key takeaway from this re-search is that data will play the most important role in the vision inspection systemat Northvolt Ett. Using a CIS rather than a camera to capture high resolutionimages helps in better analysis of the anomaly detection, width measurement andreading of Data Matrix Code (DMC). Optimising the condition for capturing theimage has similar importance.
The CIS has two identified factors that can be studied under various conditions tofind the optimal value of LED light for image capturing.
• Intensity of the LED light which gets reflected from the battery sheets.• Storing time or exposure time of the LED light
The mounting of CIS also plays a significant role in the image quality. Some of thelow level anomalies might be be visible if the image captured by the CIS is perpen-dicular to the battery sheet. Therefore various mounting positions and the imagecaptured in those positions can be compared and results can be drawn.
The DL recommended models can be deployed and the influence of data can bestudied. Different activation functions can be called in the same neural networkarchitecture and the behaviour of the model can be evaluated. Comparison betweenthe generated anomaly image and original anomaly image can be performed to eval-uate the developed DL model.
It is also possible to integrate all three functions of the vision inspection system i.e.anomaly detection, scanning of data matrix code and width measurement in onemode. End-to-end deep learning approach will help in creating an ensemble modelto perform the required function. However training of this model requires a hugeset of data.
5.3 Limitations of the studyThere were several uncertainties due to the ongoing global pandemic. Hence, theresearch question was formed to favour the study in a qualitative research. The datacollection for research question 1 was delayed and therefore the data collection forresearch question 2 was limited. As large scale lithium-ion battery manufacturing isan upcoming sector, there’s a lack of research that was performed on this topic andtherefore the data collection was delayed. For a better understanding of stakeholderrequirements, a survey method of collecting data along with the interviews couldhave been used for faster data collection.
45

5. Discussion
46

6Conclusion
This research study was conducted aiming to find a suitable ML model for anomalydetection on the electrode coated battery sheets in the battery manufacturing stageof Northvolt Ett. The study was performed in Northvolt Labs, where a vision in-spection system is being developed in-house and this system will be used in thebattery production stages of coating, presssing and slitting at Northvolt Ett.
The research questions were aimed at identifying the most suitable ML method foranomaly detection, understanding the anomaly, use of feedback loop to improve theML model and ways to transform the collected data to provide value to the batterymanufacturing operation at Northvolt Ett. The research approach was a qualita-tive method due to the exploratory study. The research method includes a detailedliterature study on various topics such as computer vision, anomaly detection, bigdata etc.
In the qualitative study, data collection was achieved through different approachessuch as interviews, observations, documents and audio-visual materials. Five formalstructured interviews were conducted alongside several unstructured discussions. Bymapping all the collected data from both literature study and qualitative study, an-swers to the research question were derived.
By utilising the image captured through CIS in the vision inspection system, anoma-lies can be detected through deep learning architectures such as LeNet. Upon iden-tification of anomalies, the input can be fed into second deep learning architectureto classify the type of anomaly (high level). As the captured images are high res-olution, the images have to be scaled before analysis. If the availability of data isinsufficient to train the model for anomaly detection, GAN can be used to create alarge set of images (fake data) for training the model.
All the observed abnormalities on the coated battery sheet cannot be classifiedas anomalies. The abnormalities/defective pattern which might hinder the perfor-mance or safety of batteries can be concluded as anomalies. These anomalies can becategorised as visual based and dimensional based anomalies which can be furtherclassified in low level and high level. Using a feedback loop to improve the MLmodel for anomaly prediction is not favourable due to the subjective assessment ofusers. However the feedback loop will help in collecting labelled data.
The collected data can be converted into an information by adding a context. This
47

6. Conclusion
information will help in creating knowledge, based on which several managementdecisions can be made for improving the production process. The benefit gainedcan be measured in terms of economy, process quality etc.
From this research it was understood that data plays a major role in the anomalyidentification than the type of DL method used for detection. Richness in data helpsin creating better models for detecting the anomalies, creating multiple models foranomaly detection, anomaly classification etc. Detailed study on stakeholder re-quirements has to be performed to find a suitable method or approach for anomalydetection. Identification of optimal condition and method for capturing the datawill help Northvolt to optimize the anomaly detection by using the recommendedDL methods.
48

Bibliography
[1] European Commission (2015). Paris Agreement, accessed 6 March 2021,<https://ec.europa.eu/clima/policies/international/negotiations/paris_en>
[2] World Economic Forum (2019). A vision for sustainablebattery value chain in 2030, accessed 4 February 2021,<http://www3.weforum.org/docs/WEF_A_Vision_for_a_Sustainable_Battery_Value_Chain_in_2030_Report.pdf>
[3] Northvolt (2017). Northvolt partners with Swedish municipalities for thenext generation of European battery manufacturing, accessed 4 Febru-ary 2021, <https://northvolt.com/newsroom/Northvolt-partners-with-Swedish-muncipalities-for-the-next-generation-of-European-battery-manufacturing>
[4] Orovel (2020). Li-on Battery Gigafactories in Europe, accessed 4 February2021, <https://www.orovel.net/insights/li-on-battery-gigafactories-in-europe-june-2020>
[5] Morris, M., Tosunoglu, S., (2012). Comparision of rechargeable battery tech-nologies. ASME Early Career Technical Journal. 11. 148-155.
[6] Naoki Nitta, Feixiang Wu, Jung Tae Lee, Gleb Yushin, Li-ion battery materials:present and future, Materials Today, Volume 18, Issue 5, 2015, Pages 252-264,ISSN 1369-7021, https://doi.org/10.1016/j.mattod.2014.10.040.
[7] Bankole, O. E., Gong, C., & Lei, L., (2013). Battery Recycling Technologies:Recycling Waste Lithium Ion Batteries with the Impact on the EnvironmentIn-View. Journal of Environment and Ecology.
[8] Northvolt (2021). Solution, accessed 5 April 2021,<https://northvolt.com/solutions>
[9] Let’s talk science (2019). How does a lithium-Ion battery work?, accessed4 February 2021, <https://letstalkscience.ca/educational-resources/stem-in-context/how-does-a-lithium-ion-battery-work>
[10] Wandt, Johannes. (2017). Operando Characterization of Fundamental ReactionMechanisms and Degradation Processes in Lithium-Ion and Lithium-OxygenBatteries.
[11] Northvolt (2021). Northvolt Ett Skellefteå, accessed 5 April 2021,<https://static.northvolt.com/Booklet-Eng.pdf>
[12] Dinis, Joao & Correia, Bento & Roger, Davies & Paulo, Heleno. (2002). AMachine Vision Quality Control System for Industrial Acrylic Fibre Production.EURASIP Journal on Advances in Signal Processing. 2002.
[13] Sachin Krishan Khanna (2019). Machine Learning v/s Deep Learning. Inter-national Research Journal of Engineering and Technology. Volume 6 Issue 2
49
Bibliography
[14] Stemmer Imaging (2021). Line scan bars (aka contact image sensors - CIS),accessed 5 April 2021, <https://www.stemmer-imaging.com/en/knowledge-base/cameras-contact-image-sensors-cis/>
[15] Rupali Roy (2020).AI, ML, and DL: How not to get them mixed!, accessed18 April 2021, <https://towardsdatascience.com/understanding-the-difference-between-ai-ml-and-dl-cceb63252a6c>
[16] Design News (2019). Solution, accessed 20 April 2021,<https://www.designnews.com/electronics-test/4-reasons-use-artificial-intelligence-your-next-embedded-design>
[17] Celik, O. (2018). A Research on Machine Learning Methods and Its Applica-tions. Journal of Educational Technology and Online Learning, 1(3), 25-40.
[18] MATLAB (2020). What is a neural network, accessed 20 April 2021,<https://se.mathworks.com/discovery/neural-network.html>
[19] Brunton, Steven & Kutz, J. (2019). Data Driven Science & Engineering: Ma-chine Learning, Dynamical Systems, and Control. Cambridge. Chapter 6: Neu-ral Networks and Deep Learning
[20] Feng, Jianli & Lu, Shengnan. (2019). Performance Analysis of Various Acti-vation Functions in Artificial Neural Networks. Journal of Physics: ConferenceSeries. 1237. 022030. 10.1088/1742-6596/1237/2/022030.
[21] Towards Data Science (2020). What’s The Role Of Weights And Bias In a Neu-ral Network?, accessed 20 April 2021, <https://towardsdatascience.com/whats-the-role-of-weights-and-bias-in-a-neural-network-4cf7e9888a0f>
[22] Drath, Rainer & Horch, Alexander. (2014). Industrie 4.0: Hit orHype? [Industry Forum]. Industrial Electronics Magazine, IEEE. 8. 56-58.10.1109/MIE.2014.2312079.
[23] Hermann, Mario & Pentek, Tobias & Otto, Boris. (2015). Design Principles forIndustrie 4.0 Scenarios: A Literature Review. 10.13140/RG.2.2.29269.22248.
[24] Industry 4.0 working group. (2013). Recommendations for implementing thestrategic initiative INDUSTRIE 4.0.
[25] Lee, Edward. (2008). Cyber Physical Systems: Design Challenges. ElectricalEngineering and Computer Sciences. 363-369. 10.1109/ISORC.2008.25.
[26] Vaidya, Saurabh & Ambad, Prashant & Bhosle, Santosh. (2018). Industry 4.0– A Glimpse. 20. 233-238. 10.1016/j.promfg.2018.02.034.
[27] Creswell, J. W. (2014). Research design: qualitative, quantitative, and mixedmethods approaches. 4th ed. Thousand Oaks, California: SAGE Publications.
[28] Bumblauskas, Daniel & Nold, Herb & Bumblauskas, Paul & Igou, Amy. (2017).Big data analytics: transforming data to action. Business Process ManagementJournal. 23. 10.1108/BPMJ-03-2016-0056.
[29] Fatma, C., Fatima, B., Hafida, B. A New Model for Integrat-ing Big Data into Phases of Decision-Making Process. Procedia Com-puter Science, Volume 151, 2019, Pages 636-642, ISSN 1877-0509,https://doi.org/10.1016/j.procs.2019.04.085.
[30] Sommer, B. (2015), “The big impact of Big Data on accounting”, presenta-tion at AAA Annual Meeting, American Accounting Association, Chicago, IL,August 8-12.
50

Bibliography
[31] Bickman, L., & Rog, D. J. (2009). The SAGE handbookof applied social research methods. SAGE Publications, Inc.,https://www.doi.org/10.4135/9781483348858
[32] Maxwell, J. A. (2005). Qualitative research design: An interactive approach(2nd ed.).Thousand Oaks, CA: Sage.
[33] Yamashita, R., Nishio, M., Do, R.K.G. et al. Convolutional neural networks:an overview and application in radiology. Insights Imaging 9, 611–629 (2018).https://doi.org/10.1007/s13244-018-0639-9
[34] Medium (2020). Binary Image classifier CNN using TensorFlow, accessed05 May 2021, <https://medium.com/techiepedia/binary-image-classifier-cnn-using-tensorflow-a3f5d6746697>
[35] Zhou, Yi. (2019). Sentiment classifcation with deep neural networks.[36] Haselmann, Matthias & Gruber, Dieter & Tabatabai, Paul. (2018). Anomaly
Detection using Deep Learning based Image Completion.[37] Pathak, D., Krahenbuhl, P., Donahue, J., & Darrell, T., & Efros, A.
(2016). Context Encoders: Feature Learning by Inpainting. 2536-2544.10.1109/CVPR.2016.278.
[38] El Harrouss, O., Almaadeed, N., Al-ma’adeed, S., & Akbari, Y.. (2020). Im-age Inpainting: A Review. Neural Processing Letters. 51. 10.1007/s11063-019-10163-0.
[39] Ronneberger, O., Fischer, P., & Brox, T. (2015). U-Net: Convolutional Net-works for Biomedical Image Segmentation. LNCS. 9351. 234-241. 10.1007/978-3-319-24574-428.
[40] Y. Jiang, W. Wang and C. Zhao, "A Machine Vision-based RealtimeAnomaly Detection Method for Industrial Products Using Deep Learning,"2019 Chinese Automation Congress (CAC), 2019, pp. 4842-4847, doi:10.1109/CAC48633.2019.8997079.
[41] Ian J. Goodfellow, Jean Pouget-Abadie, Mehdi Mirza, Bing Xu, David Warde-Farley, Sherjil Ozair, Aaron Courville, and Yoshua Bengio. 2014. Generativeadversarial nets. In Proceedings of the 27th International Conference on NeuralInformation Processing Systems - Volume 2 (NIPS’14). MIT Press, Cambridge,MA, USA, 2672–2680.
[42] Sublime, J. & Kalinicheva, E. (2019). Automatic Post-Disaster Damage Map-ping Using Deep-Learning Techniques for Change Detection: Case Study of theTohoku Tsunami. Remote Sensing. 11. 1123. 10.3390/rs11091123.
[43] A. L’Heureux, K. Grolinger, H. F. Elyamany and M. A. M. Capretz, "MachineLearning With Big Data: Challenges and Approaches," in IEEE Access, vol. 5,pp. 7776-7797, 2017, doi: 10.1109/ACCESS.2017.2696365.
[44] Fredriksson, Cecilia. (2018). Big data creating new knowledge as support indecision-making: practical examples of big data use and consequences of us-ing big data as decision support. Journal of Decision Systems. 27. 1-18.10.1080/12460125.2018.1459068.
[45] Eggers, Julia & Hein, Andreas. (2020). Turning Big Data Into Value: A Lit-erature Review on Business Value Realization From Process Mining.
[46] Krizhevsky, A., Sutskever, I. & Hinton, G. E. (2012). ImageNet Classificationwith Deep Convolutional Neural Networks. In F. Pereira, C. J. C. Burges, L.
51

Bibliography
Bottou & K. Q. Weinberger (ed.), Advances in Neural Information ProcessingSystems 25 (pp. 1097–1105) . Curran Associates, Inc. .
[47] Y. Lecun, L. Bottou, Y. Bengio and P. Haffner, "Gradient-based learning ap-plied to document recognition," in Proceedings of the IEEE, vol. 86, no. 11, pp.2278-2324, Nov. 1998, doi: 10.1109/5.726791.
[48] S. Liu and W. Deng, "Very deep convolutional neural network basedimage classification using small training sample size," 2015 3rd IAPRAsian Conference on Pattern Recognition (ACPR), 2015, pp. 730-734, doi:10.1109/ACPR.2015.7486599.
52

AAppendix
Figure A.1: Architecture of AlexNet [46]
Figure A.2: Architecture of VGG16 [47]
I

A. Appendix
Figure A.3: Architecture of LeNet [48]
II

DEPARTMENT OF SOME SUBJECT OR TECHNOLOGYCHALMERS UNIVERSITY OF TECHNOLOGYGothenburg, Swedenwww.chalmers.se