optimising deep-level mine refrigeration control for
TRANSCRIPT

Optimising deep-level mine
refrigeration control for sustainable
cost savings
PFH Peach
22815600
Dissertation submitted in fulfilment of the requirements for the
degree Master of Engineering in Mechanical Engineering at the
Potchefstroom Campus of the North-West University
Supervisor: Prof M Kleingeld
May 2017

Optimising deep-level mine refrigeration control for sustainable cost savings ii
ABSTRACT
Title: Optimising deep-level mine refrigeration control for sustainable cost savings
Author: Mr PFH Peach
Supervisor: Prof M Kleingeld
Degree: Master of Engineering (Mechanical)
Keywords: gold mine, sustainability, demand side management, load management,
control optimisation, refrigeration, cost savings
Declined productivity and increased operational costs have seen South African deep-level
gold mines become marginal operations during the past few years. The price of electricity is
one of the major contributors to an increase in the operational costs. This is mainly due to gold
mining depending heavily on electricity for its operations and the price of electricity increasing
at higher-than-inflation rates.
The past few years also saw South Africa’s power utility, Eskom, struggling to keep up with its
economy and to adequately supply the electricity demand. Ageing infrastructure and
mismanagement led to power outages being experienced throughout the country. Since gold
mining is such an electricity-intensive operation, it is very sensitive to Eskom’s ability to meet
the demand. During peak periods, Eskom regularly operates without adequate reserve
margins, subsequently reverting to load curtailment of large users in order to ensure grid
stability. This directly influences the productivity of industries such as gold mines.
The problems experienced by Eskom led to the establishment of Demand Side Management
(DSM). Energy Services Companies (ESCos) are employed by Eskom to implement DSM
initiatives on large electricity consumers such as gold mines. However, research proves that
implemented load management initiatives (part of DSM) were not sustainable in the past. This
is mainly due to the structure of the old DSM model, which only required ESCos to maintain
targeted savings for a period of three months after implementation.
The DSM model was revised in recent years to ensure that the performances of implemented
load management initiatives are more sustainable. The revised DSM model, however, brought
new challenges for ESCos as they are forced to sustain the performances of implemented
projects for a period of 36 months. Project funding for infrastructure and implementation time
were also drastically reduced with the new model. This presented the need for ESCos to
develop creative and sustainable load management techniques that will be cost effective and
easy to implement.

Optimising deep-level mine refrigeration control for sustainable cost savings iii
One of these techniques is developing optimised control strategies for the electricity
consuming systems of deep-level mines. Due to their large electricity consumption patterns,
two deep-level gold mine refrigeration systems were identified for optimised control. The
development commenced by determining the theoretical impact of the developed optimised
control strategies through verified simulation models. The simulation results were then
validated in the form of practical tests on the respective refrigeration systems. Validation
proved the accuracy of the optimised strategies with a correlation error of 2% for Mine D and
3% for Mine R, measured against the average summer evening peak period load reduction.
The optimised control strategies were implemented on the refrigeration systems of Mine D
and Mine R. By the time of this study, load management proved to be sustainable for a
consecutive period of eight months at Mine D and nine months at Mine R. An average evening
peak period load reduction of 7.28 MW (Mine D) and 2.00 MW (Mine R) was measured at the
respective mines. This accumulates to financial cost savings of R 1.17 million (Mine D) and
R 143 000 (Mine R) over the respective measuring periods. Assuming sustainability over a
period of 36 months, a total financial saving of approximately R 6 million is expected.
The study proved that sustainable cost savings on deep-level gold mine refrigeration systems
are possible through the implementation of optimised control strategies. It is, however,
important to note that the sustainability is not solely measured on cost savings, but also
determined by the effect of load management on system operational parameters such as
temperatures, dam levels and safety regulations.

Optimising deep-level mine refrigeration control for sustainable cost savings iv
ACKNOWLEDGEMENTS
Firstly, I want to thank the Lord for blessing me with the talents to pursue my dreams. Without
Him this venture would not have been possible.
To Enermanage (Pty) Ltd, TEMM International (Pty) Ltd and HVAC International (Pty) Ltd,
thank you for the opportunity, financial assistance and support to complete this study. Thank
you to Prof. Eddie Mathews and Prof. Marius Kleingeld for making it possible for me to
complete this study.
To Dr Johan Bredenkamp, for all your assistance, encouragement and late nights reviewing
my work, I thank you. Your inputs and guidance is invaluable to me.
To my parents, Carel and Marietjie, thank you for all the support and love you gave me through
the years, and especially during the course of this study. Without you I would not be the man
I am today.
To my sister, Retha, even though you were far away during the course of this study, you never
hesitated to help. Thank you for all the love, support, and Skype sessions to distract me from
all the hard work.
Finally I would like to thank all of my colleagues and friends who supported me during the last
two years. I am truly blessed to have such wonderful people in my life.

Optimising deep-level mine refrigeration control for sustainable cost savings v
TABLE OF CONTENTS
Abstract ............................................................................................................................... ii
Acknowledgements ........................................................................................................... iv
Table of Contents ................................................................................................................ v
List of Figures ................................................................................................................... vii
List of Tables ....................................................................................................................... x
List of Equations ................................................................................................................ xi
List of Symbols ................................................................................................................. xii
List of units ...................................................................................................................... xiii
List of abbreviations ........................................................................................................ xiv
1 Introduction ............................................................................................................. 2
1.1 South African gold mining and the economy .................................................... 2
1.2 Electricity supply and deep-level gold-mining demand ..................................... 8
1.3 Electricity usage and load management on deep-level gold mines ................ 10
1.4 Demand side management model ................................................................. 12
1.5 Problem statement ......................................................................................... 14
1.6 Objectives of study......................................................................................... 14
1.7 Document overview ....................................................................................... 15
2 Refrigeration in the deep-level mining environment ............................................... 18
2.1 Introduction .................................................................................................... 18
2.2 Refrigeration concept in deep-level gold mines .............................................. 18
2.3 Deep-level mine refrigeration operation ......................................................... 20
2.4 Load management on deep-level mine refrigeration systems ........................ 30
2.5 Thermal hydraulic system modelling .............................................................. 33
2.6 Conclusion ..................................................................................................... 48
3 Optimising refrigeration control for sustainable cost savings ................................. 50
3.1 Introduction .................................................................................................... 50
3.2 Identifying load reduction potential ................................................................. 51
3.3 Developing baselines and adjustment models ............................................... 58
3.4 Developing a load shift control strategy.......................................................... 61
3.5 Optimising the load shift control strategy ........................................................ 64
3.6 Implementing the optimised control strategy .................................................. 65
3.7 Conclusion ..................................................................................................... 66
4 Implementing optimised control strategies on mine refrigeration systems ............. 68
4.1 Introduction .................................................................................................... 68
4.2 Identifying load reduction potential ................................................................. 68
4.3 Developing baselines and adjustment models ............................................... 71
4.4 Developing a load shift control strategy.......................................................... 73
4.5 Optimising the load shift control strategy ........................................................ 79
4.6 Implementing the optimised control strategy .................................................. 87
4.7 Conclusion ..................................................................................................... 88
5 Conclusion and recommendations ........................................................................ 91
5.1 Summary ....................................................................................................... 91

Optimising deep-level mine refrigeration control for sustainable cost savings vi
5.2 Recommendations for future work ................................................................. 94
Reference List ................................................................................................................... 96
Appendix A: Simulation overview & inputs................................................................... 101
Appendix B: Case Study 1 verification .......................................................................... 110
Appendix C: Case Study 2 development and optimisation .......................................... 113
Appendix D: Case study 2 implementation ................................................................... 136

Optimising deep-level mine refrigeration control for sustainable cost savings vii
LIST OF FIGURES
Figure 1: Geological location of mining operations within the Witwatersrand Basin [1] .......... 2
Figure 2: South African gold production, 1980-2015 [3], [4] ................................................... 3
Figure 3: Gold production growth rate of top producers (2002 – 2013) [5] ............................. 4
Figure 4: Productivity and labour cost per employee (1990 – 2014) [5] ................................. 5
Figure 5: Typical gold mine group expenditure (2014 data) [4] .............................................. 6
Figure 6: Cost inflation affecting gold mining [5] .................................................................... 6
Figure 7: Financial performance of South African gold mines (2015 2nd Quarter) [2] ............. 7
Figure 8: South African electricity usage breakdown ............................................................. 8
Figure 9: Gold mine electricity usage breakdown [16] ......................................................... 10
Figure 10: Eskom average daily demand profile [17] ........................................................... 11
Figure 11: Eskom TOU tariff structure [18] .......................................................................... 11
Figure 12: ESCo relationship triangle .................................................................................. 12
Figure 13: Simplified layout of a vapour-compression refrigeration cycle [23] ..................... 19
Figure 14: Vapour compression refrigeration cycle P-h diagram [24] .................................. 20
Figure 15: Simplified layout of a gold mine refrigeration system .......................................... 21
Figure 16: Mechanical draft cooling towers ......................................................................... 22
Figure 17: Warm and cold dams ......................................................................................... 23
Figure 18: Vapour-compression chiller [30] ......................................................................... 24
Figure 19: Surface cold storage dams ................................................................................. 25
Figure 20: BAC fans and tower ........................................................................................... 26
Figure 21: Centrifugal pump and electrical motor set .......................................................... 27
Figure 22: Series configured chillers ................................................................................... 28
Figure 23: Parallel configured chillers ................................................................................. 29
Figure 24: Parallel-series configured chillers ....................................................................... 30
Figure 25: Water-cooled chiller schematic ........................................................................... 35
Figure 26: Pump schematic................................................................................................. 37
Figure 27: Cooling tower schematic .................................................................................... 40
Figure 28: Dam (thermal storage) schematic ...................................................................... 42
Figure 29: Simplified illustration of a thermal hydraulic system simulated in PTB ................ 46
Figure 30: Control optimisation methodology ...................................................................... 50
Figure 31: Potential load management identification ........................................................... 52
Figure 32: Simplified refrigeration system layout ................................................................. 55
Figure 33: Electrical power baseline example ..................................................................... 59
Figure 34: Service level adjustment illustration.................................................................... 60
Figure 35: Refrigeration components shutdown sequence .................................................. 62
Optimising deep-level mine refrigeration control for sustainable cost savings viii
Figure 36: Optimising load shift control strategy .................................................................. 65
Figure 37: Refrigeration system power consumption – Mine D ............................................ 68
Figure 38: Layout for normal summer operation – Mine D ................................................... 70
Figure 39: Electrical power baseline – Mine D .................................................................... 72
Figure 40: Simulated power consumption – Mine D ............................................................ 74
Figure 41: Cold storage dam temperature – Mine D ............................................................ 74
Figure 42: Main # BAC outlet air temperature – Mine D ...................................................... 75
Figure 43: Vent # BAC outlet air temperature – Mine D ....................................................... 75
Figure 44: Power consumption comparison – Mine D ......................................................... 77
Figure 45: Cold storage dam temperature comparison – Mine D ........................................ 77
Figure 46: Main # BAC outlet air temperature comparison – Mine D ................................... 78
Figure 47: Vent # BAC outlet air temperature comparison – Mine D ................................... 78
Figure 48: 20L Station dry-bulb air temperature – Mine D ................................................... 79
Figure 49: Optimised load shift control strategy – Mine D ................................................... 80
Figure 50: Simulated power consumption for the optimised control strategy – Mine D ........ 81
Figure 51: Cold storage dam temperature – Mine D ............................................................ 82
Figure 52: Main # BAC outlet air temperature – Mine D ...................................................... 82
Figure 53: Vent # BAC outlet air temperature – Mine D ....................................................... 83
Figure 54: Power consumption comparison – Mine D ......................................................... 84
Figure 55: Cold storage dam temperature comparison – Mine D ........................................ 85
Figure 56: Main # BAC outlet air temperature comparison – Mine D ................................... 85
Figure 57: Vent # BAC outlet air temperature comparison – Mine D ................................... 86
Figure 58: 20L Station dry-bulb air temperature– Mine D .................................................... 86
Figure 59: Post implementation power profile – Mine D ...................................................... 87
Figure 60: Mine D simulation layout .................................................................................. 105
Figure 61: Mine R simulation layout .................................................................................. 109
Figure 62: Power consumption verification – Mine D ......................................................... 110
Figure 63: Cold dam level verification – Mine D ................................................................ 111
Figure 64: Cold dam temperature verification – Mine D ..................................................... 111
Figure 65: Main BAC outlet air temperature verification – Mine D ..................................... 112
Figure 66: Vent BAC outlet air temperature verification – Mine D ...................................... 112
Figure 67: Refrigeration system power consumption – Mine R .......................................... 113
Figure 68: Normal summer operating layout – Mine R ...................................................... 115
Figure 69: Electrical power baseline – Mine R .................................................................. 117
Figure 70: Power consumption verification – Mine R ......................................................... 119
Figure 71: Cold storage dam level verification – Mine R .................................................... 120
Figure 72: Cold storage dam temperature verification – Mine R ........................................ 120

Optimising deep-level mine refrigeration control for sustainable cost savings ix
Figure 73: BAC outlet air temperature verification – Mine R .............................................. 121
Figure 74: Simulated power consumption – Mine R .......................................................... 122
Figure 75: Cold storage dam level– Mine R ...................................................................... 122
Figure 76: Cold storage dam temperature – Mine R .......................................................... 123
Figure 77: BAC outlet air temperature – Mine R ................................................................ 124
Figure 78: Power consumption comparison – Mine R ....................................................... 125
Figure 79: Cold storage dam level comparison – Mine R .................................................. 126
Figure 80: Cold storage dam temperature comparison – Mine R ...................................... 126
Figure 81: BAC outlet air temperature comparison – Mine R ............................................. 127
Figure 82: 2010L Station dry-bulb air temperature – Mine R ............................................. 127
Figure 83: Optimised load shift control strategy – Mine R ................................................. 128
Figure 84: Simulated power consumption for the optimised control strategy – Mine R ...... 129
Figure 85: Cold storage dam level – Mine R ..................................................................... 130
Figure 86: Cold storage dam temperature – Mine R .......................................................... 131
Figure 87: BAC outlet air temperature – Mine R ................................................................ 131
Figure 88: Power consumption comparison – Mine R ....................................................... 132
Figure 89: Cold storage dam level comparison – Mine R .................................................. 133
Figure 90: Cold storage dam temperature comparison – Mine R ...................................... 133
Figure 91: BAC outlet air temperature comparison – Mine R ............................................. 134
Figure 92: 2010L Station dry-bulb air temperature – Mine R ............................................. 134
Figure 93: Post implementation power profile – Mine R .................................................... 136

Optimising deep-level mine refrigeration control for sustainable cost savings x
LIST OF TABLES
Table 1: Changes to DSM model [19], [20] .......................................................................... 13
Table 2: Previously implemented load management projects matrix [31], [32], [37], [38] ..... 32
Table 3: Simulation software package evaluation ................................................................ 47
Table 4: Major components of a gold mine refrigeration system .......................................... 53
Table 5: Possible constraints during implementation of load shift initiatives on gold mines . 56
Table 6: Refrigeration system component shutdown sequence example ............................ 62
Table 7: Major components in refrigeration system – Mine D .............................................. 69
Table 8: Refrigeration system constraints – Mine D ............................................................ 71
Table 9: Operational baseline – Mine D .............................................................................. 72
Table 10: Load shift control strategy – Mine D .................................................................... 73
Table 11: Control strategy validation – Mine D .................................................................... 76
Table 12: Optimised load shift control strategy – Mine D ..................................................... 80
Table 13: Optimised control strategy validation – Mine D .................................................... 83
Table 14: Implementation validation – Mine D ..................................................................... 88
Table 15: Control strategies validation results ..................................................................... 92
Table 16: Optimised control strategies validation results ..................................................... 93
Table 17: Simulation inputs – Mine D ................................................................................ 101
Table 18: Simulation inputs – Mine R ................................................................................ 106
Table 19: Simulation verification – Mine D ........................................................................ 110
Table 20: Major components in refrigeration system – Mine R .......................................... 114
Table 21: Refrigeration system constraints – Mine R ........................................................ 116
Table 22: Operational baseline – Mine R .......................................................................... 117
Table 23: Load shift control strategy – Mine R .................................................................. 118
Table 24: Simulation verification – Mine R ........................................................................ 119
Table 25: Control strategy validation – Mine R .................................................................. 124
Table 26: Optimised load shift control strategy – Mine R ................................................... 129
Table 27: Optimised control strategy validation – Mine R .................................................. 132
Table 28: Implementation validation – Mine R ................................................................... 137

Optimising deep-level mine refrigeration control for sustainable cost savings xi
LIST OF EQUATIONS
Equation 1: Explicit chiller cooling capacity (Cc) .................................................................. 35
Equation 2: Explicit chiller power consumption .................................................................... 36
Equation 3: Evaporator water outlet temperature ................................................................ 37
Equation 4: Condenser water outlet temperature ................................................................ 37
Equation 5: Flow coefficient ................................................................................................ 38
Equation 6: Pressure head coefficient ................................................................................. 38
Equation 7: Pressure head polynomial regression .............................................................. 38
Equation 8: Pump efficiency ................................................................................................ 38
Equation 9: Heat transfer to water due to compression in pump ......................................... 39
Equation 10: Water temperature rise over pump ................................................................. 39
Equation 11: Pump electrical power .................................................................................... 39
Equation 12: Water mass flow and cooling capacity relation ............................................... 40
Equation 13: Constant A ..................................................................................................... 41
Equation 14: Gradient C ...................................................................................................... 41
Equation 15: Constant D ..................................................................................................... 41
Equation 16: Cooling capacity of cooling tower ................................................................... 41
Equation 17: Outlet water temperature – cooling tower ....................................................... 41
Equation 18: Outlet air enthalpy – cooling tower ................................................................. 42
Equation 19: Basic thermal storage dam equation .............................................................. 43
Equation 20: Solar air temperature...................................................................................... 43
Equation 21: Basic thermal storage dam equation – Step 2 ................................................ 43
Equation 22: Basic thermal storage dam equation – Step 3 ................................................ 43
Equation 23: Thermal storage dam temperature ................................................................. 44
Equation 24: Thermal storage dam volume ......................................................................... 44
Equation 25: Evening peak to average ratio ........................................................................ 52
Equation 26: Service level adjustment factor ....................................................................... 59
Equation 27: Scaled baseline calculation ............................................................................ 60
Equation 28: Evening peak to average ratio – Mine D ......................................................... 69
Equation 29: Evening peak to average ratio – Mine R ....................................................... 113

Optimising deep-level mine refrigeration control for sustainable cost savings xii
LIST OF SYMBOLS
# Denotes a mining shaft
$ United States Dollar
% Percentage
α Absorption coefficient
Cpw Specific heat capacity of water
ΔR Unit of thermal resistance
D Pump rotor diameter
dP Differential pressure
ε Emittance
η Efficiency
G Irradiation
h Enthalpy
h0 Convection heat transfer coefficient
m Mass flow
n Rotational speed
P Electrical power
Q Heat
R South African Rand
ρ Density
t Temperature
U Overall heat transfer coefficient
v Volume
Win Electrical power input

Optimising deep-level mine refrigeration control for sustainable cost savings xiii
LIST OF UNITS
°C Degrees centigrade
g/t Grams per tonne
K Kelvin
kg/m3 Kilogram per cubic meter
kg/s Kilogram per second
kJ/kg Kilojoule per kilogram
kJ/kg∙K Kilojoule per kilogram Kelvin
km Kilometer
kW Kilowatt
l/s Liters per second
m Meters
m2∙K/W Square meter Kelvin per Watt
m3 Cubic meters
MW Megawatt
oz Ounce
Pa Pascal
W/m2 Watt per square meter
W/m2∙K Watt per square meter Kelvin

Optimising deep-level mine refrigeration control for sustainable cost savings xiv
LIST OF ABBREVIATIONS
BAC Bulk air cooler
CCT Condenser cooling tower
DSM Demand side management
EE Energy efficiency
ESCo Energy services company
Eskom Electricity Supply Commission of South Africa
GDP Gross domestic product
HVAC Heating ventilation and air Conditioning
KPI Key performance indicator
LM Load management
PA Performance assessment
PCT Pre-cooling tower
PTB Process Toolbox by TEMM International
SCADA Supervisory control and data acquisition
SLA Service level adjustments
TES Thermal energy storage
TOU Time-of-use
VFD Variable frequency drive

Chapter 1
Optimising deep-level mine refrigeration control for sustainable cost savings 1
Chapter 1

Chapter 1
Optimising deep-level mine refrigeration control for sustainable cost savings 2
1 Introduction
1.1 South African gold mining and the economy
1.1.1 Background
During the 19th century the first South African gold reef was discovered in the Witwatersrand
area [1]. The basin stretches in an elliptical arc crossing approximately 400 km through three
provinces (Gauteng, Free State and North West) [1]. Since its discovery, the Witwatersrand
Basin contributed approximately 33% of global gold production (over two billion ounces), and
remains one of the world’s largest gold resources [2]. Figure 1 shows the geological location
of various South African gold mining operations within the Witwatersrand Basin.
Figure 1: Geological location of mining operations within the Witwatersrand Basin [1]

Chapter 1
Optimising deep-level mine refrigeration control for sustainable cost savings 3
During 1980, South Africa was the largest gold producer in the world with 675 000 kg of gold
produced [3]. South African gold production, however, declined with a significant 87% from
the mid 1980s [3]. Figure 2 shows the decline in gold production during this period.
Figure 2: South African gold production, 1980-2015 [3], [4]
Since 2002, South Africa’s gold output declined faster than any other of the top gold producing
countries in the world. Figure 3 compares the gold production growth among the top gold
producing countries in the world from 2002 to 2013. South Africa is currently the sixth largest
gold producer in the world, down from first place in less than a decade [2]. South Africa has,
however, the world’s largest gold ore deposits, while contributing only 5.3% to global
production (2013 statistics) [5].
0
100
200
300
400
500
600
700
800
19
80
19
81
19
82
19
83
19
84
19
85
19
86
19
87
19
88
19
89
19
90
19
91
19
92
19
93
19
94
19
95
19
96
19
97
19
98
19
99
20
00
20
01
20
02
20
03
20
04
20
05
20
06
20
07
20
08
20
09
20
10
20
11
20
12
20
13
20
14
20
15
Go
ld p
rod
uce
d (
ton
ne)
Year
South African Gold Production

Chapter 1
Optimising deep-level mine refrigeration control for sustainable cost savings 4
Figure 3: Gold production growth rate of top producers (2002 – 2013) [5]
Gold’s contribution to South Africa’s Gross Domestic Product (GDP) declined from 3.8% in
1993 to 1.7% in 2013 [3]. The reduction is aligned with the production decrease (50% decline)
experienced over the same period [1]. Gold accounted for 12.5% of all mineral sales in 2014,
down from 67% in 1980 [3]. These mineral sales have decreased with 40% between 2012 and
2016. It is evident from these figures that the gold mining industry is experiencing challenges
to remain productive in modern day mining. The challenges are discussed in the following
section.
1.1.2 Challenges in the gold mining industry
The decline in production can be mainly attributed to factors such as falling gold prices,
declining ore grades, industrial action (strikes) and reduced productivity [4].
Productivity per gold mine employee has also declined over the years. This can be attributed
to factors such as increased operating depth and travelling time to operating areas. As
travelling time increases, productive mining time decreases [6]. South African gold mines are
estimated to be productive for 274 days of the year (75%). Of those 274 days, workers are
only active for two-thirds of each day [5].
-10-8-6-4-202468
10
% a
vera
ge a
nn
ual
gro
wth
Rate of growth in gold production for key countries (2002 -2013)

Chapter 1
Optimising deep-level mine refrigeration control for sustainable cost savings 5
Despite the decline in productivity, labour costs have increased substantially during the last
decade. Figure 4 depicts the increased labour cost and reduced production per employee
since 1990 [5].
Figure 4: Productivity and labour cost per employee (1990 – 2014) [5]
The weak financial performance of gold mines is worsened with the increases in operating
costs [4]. Large contributors to increased operating costs are labour and electricity [4]. This is
mainly due to the substantial annual increases in these portions of a deep-level mine’s
operating costs in recent years. Figure 5 illustrates the breakdown of a typical gold mining
group’s operating costs (2014 data) [4]. As indicated, labour and electricity comprise just over
half of the total expenditure.
0
50
100
150
200
250
300
1990 1994 1998 2002 2006 2010 2014
kg g
old
per
em
plo
yee
Year
Productivity and wages
Productivity, kg per employee indexed Real labour costs per kg produced indexed

Chapter 1
Optimising deep-level mine refrigeration control for sustainable cost savings 6
Figure 5: Typical gold mine group expenditure (2014 data) [4]
Figure 6 shows the cost inflation affecting various sectors within the gold mining sector for the
period 2008 – 2014. It is evident that electricity shows some of the highest cost inflation.
Further it is noticed that the majority of mining’s operating costs increases at a higher-than-
inflation rate. Increased production costs, especially at the current rate, can eventually force
weaker-performing mines to close down [5].
Figure 6: Cost inflation affecting gold mining [5]
Electricity12%
Taxes2%
Economic development
1%
Rehabilitation1%
Salaries and Wages
40%
Consumables26%
Capital Expenditure
18%
Typical Gold Mine Group Expenditure
0
5
10
15
20
25
Unitproduction
cost
Electricity Diesel Reinforcingsteel
Labour Structural steel Miningmachinery
%
Cost inflation affecting the mining sector (annual average 2008 - 2014)
2008 - 2014 2014

Chapter 1
Optimising deep-level mine refrigeration control for sustainable cost savings 7
The above-mentioned factors all contribute to the decline in productivity of gold mining in
South Africa. Increases in major expenses along with declining production has reached the
point where the majority of South African gold mines are marginal operations [2]. The financial
performance of various South African gold mines can be seen in Figure 7 – indicating
operating cost per ounce of gold mined for multiple South African gold mines. Profitable mines
are indicated by green bars and non-profitable indicated by red. The gold price per ounce of
gold is indicated by the gold bar.
Figure 7: Financial performance of South African gold mines (2015 2nd Quarter) [2]
Despite the concerning statistics presented in this section, gold mining still plays an important
part in the South African economy [4]. Gold mining employs thousands of people and supports
millions of dependants in the form of employee families [5]. Gold mines therefore need to find
creative measures to offset increasing operating costs and increase profitability. Due to the
0 200 400 600 800 1000 1200 1400 1600 1800 2000
Mine V
Mine U
Mine T
Mine S
Mine R
Mine Q
Mine P
Mine O
Mine N
Mine M
Mine L
Gold Price
Mine K
Mine J
Mine I
Mine H
Mine G
Mine F
Mine E
Mine D
Mine C
Mine B
Mine A
Operating cost per oz gold produced ($)
Min
e
Financial Performance of South African Gold Mines
Current gold price per
ounce of gold

Chapter 1
Optimising deep-level mine refrigeration control for sustainable cost savings 8
aggressive nature in which operating costs are increasing, especially that of electricity, one
initiative that can be employed to reduce the impact of operating costs on profitability, is to
reduce gold mining’s electricity demand.
1.2 Electricity supply and deep-level gold-mining demand
1.2.1 South Africa’s electricity generating capacity
The electricity supply commission of South Africa (Eskom) supplies roughly 95% of the
country’s electricity needs [7], [8], [9]. Eskom’s total nominal generating capacity for 2015 was
42 090 MW, the majority contributed by coal-fired power stations [7]. Since the gold-mining
sector depends heavily on electricity for its operations, it is dependent on Eskom for its
electricity.
1.2.2 Gold mining electricity demand
The mining sector in South Africa consumes 14.7% of the country’s total electricity demand
(based on 2014/2015 electricity sales data from Eskom) [10]. From this, gold mines consume
almost half of the mining industry’s total electricity demand [11]. Gold mining’s electricity usage
equates to almost 7% of the country’s total electricity consumption. Figure 8 shows the
breakdown of electricity consumers within South Africa and its mining sector.
Figure 8: South African electricity usage breakdown
Municipalities44.6%
Residential5.7%
Commercial4.7%
Industrial26.2%
Agricultural2.6%
Rail1.5%
Gold6.9%
Platinum group metals4.8%
Other2.9%Mining
14.7%

Chapter 1
Optimising deep-level mine refrigeration control for sustainable cost savings 9
As the mining industry is such a large consumer of electricity in South Africa, proved by Figure
8, it becomes evident that an uninterrupted supply of electricity is required for full productivity.
This is not always the case as Eskom experiences challenges from time to time to meet South
Africa’s electricity demand.
1.2.3 Challenges faced by Eskom
Eskom’s ability to supply the country’s electricity demand has come under scrutiny in 2008,
2014 and more recently in 2015 when scheduled load shedding had to be implemented.
Eskom failed to add any generating capacity to the electricity grid from the early 1990s due to
having a reserve margin of almost 40% [12]. Mismanagement and a lack of maintenance also
contributed to these problems [13]. Steady growth in electricity demand of 3.5% per annum
meant that, in 2003, the reserve margin degraded to the point where unplanned outages could
severely compromise the system’s integrity. In 2005 this eventuality arrived and load had to
be shed in the Western Cape, followed by country-wide load shedding in 2008 [12].
Eskom is currently constructing two large coal-fired power stations (Medupi and Kusile) with
a combined electrical generating capacity of 9 600MW [14]. These power stations are due to
be commissioned in 2019 [14]. Despite the construction of new power plants, there are still
concerns in terms of Eskom’s supply capacity. This is mainly due to the fact that Eskom will
start decommissioning several of its older plants from 2020 onwards. Eskom CEO Brian
Dames stated in 2012: "By 2020 we will start decommissioning at least 10 000MW of power
plants because they will have reached the end of their lifespan." There still looms an enormous
risk for large electricity consumers in South Africa in regards to reliable electricity supply [14].
It is apparent that South Africa’s electricity grid remains unstable in light of the discussions
above. Eskom frequently struggles to maintain an adequate reserve margin of 15%, leaving
the system vulnerable to unplanned outages [8]. When the demand needs to be reduced,
large consumers are usually the first to be curtailed [8]. This is a major concern for the mining
industry, and gold mines in particular, as they rely heavily on electricity for its operations, and
subsequently its productivity.
To achieve a large impact with load management, large consumers need to be targeted for
best results. Seeing that gold mines are one of the largest single users of electricity in South
Africa, they are ideal targets to implement such initiatives. By implementing load management
on large electricity users, Eskom’s reserve margin can be increased during peak periods. The
following section will break down a typical gold mine’s electricity usage to determine where
load management will have the maximum impact.

Chapter 1
Optimising deep-level mine refrigeration control for sustainable cost savings 10
1.3 Electricity usage and load management on deep-level gold mines
1.3.1 Electricity usage breakdown
Figure 9 depicts the electricity usage breakdown of a typical gold mine into its various systems.
According to Figure 9, one of the largest electricity consuming systems on South African gold
mines is refrigeration and ventilation, consuming up to 28% of the total electricity demand.
This is mainly due to the extreme depths of some of the deep-level gold mines [5]. Virgin rock
temperatures can reach over 50°C in some of these mines [5]. Large refrigeration machines
and ventilation fans are therefore required to regulate the underground environmental
temperatures. This is to ensure a safe working environment for mine employees as regulated
by law [15].
Figure 9: Gold mine electricity usage breakdown [16]
1.3.2 Load management on gold mine systems
In order to maximise the impact of load managing initiatives, large electricity consumers such
as refrigeration and ventilation are usually targeted. This load management focuses on shifting
electrical load out of the “peak” periods when Eskom struggles to meet the demand with an
inadequate reserve margin. Peak periods are when the electricity demand for the country is
at its maximum, indicated by Figure 10.
Refrigeration & Ventilation
28%
Compressed air19%
Dewatering16%
Ore Loading12%
Hoisting5%
Ore Processing16%
Other4%

Chapter 1
Optimising deep-level mine refrigeration control for sustainable cost savings 11
Figure 10: Eskom average daily demand profile [17]
When viewing the average daily winter and summer demand in Figure 10, two “peaks” become
visible. Eskom defines these “peaks” as high demand periods and subsequently charge large
consumers more during these times [18]. Figure 11 shows how the Time-of-Use (TOU) tariff
is structured in both summer and winter (denoted as low demand season and high demand
season, respectively). Eskom implements this TOU tariff structure to force large consumers to
reduce their demand during these peak periods, in turn stabilising the national power grid.
Figure 11: Eskom TOU tariff structure [18]
20000
22000
24000
26000
28000
30000
32000
34000
36000
38000
00
:00
01
:00
02
:00
03
:00
04
:00
05
:00
06
:00
07
:00
08
:00
09
:00
10
:00
11
:00
12
:00
13
:00
14
:00
15
:00
16
:00
17
:00
18
:00
19
:00
20
:00
21
:00
22
:00
23
:00
Po
wer
(M
W)
Time
Typical Summer and Winter load profiles
Average Winter Day Average Summer Day

Chapter 1
Optimising deep-level mine refrigeration control for sustainable cost savings 12
Since the electricity cost is higher during these peak periods, large consumers try to reduce
their usage as far as possible during these times. This is where the Eskom DSM model
originated, contracting a third party to ensure reduced load during peak periods. The next
section will discuss these third parties (ESCos) and the DSM model to which they need to
comply during the implementation of load reduction projects.
1.4 Demand side management model
1.4.1 ESCos background
ESCos use their expertise to reduce the electricity consumption of large consumers, such as
gold mines, during certain periods of the day. By providing funding for ESCos, Eskom
encourages the implementation of load management initiatives. Figure 12 indicates the
relationship between Eskom, gold mines and the ESCo.
Figure 12: ESCo relationship triangle
ESCo
Eskom Gold mine
Cost Savings
Business opportunities
Fundin
gReduce
dem
and
Supply electricity
Buy electricity

Chapter 1
Optimising deep-level mine refrigeration control for sustainable cost savings 13
By identifying large electricity consumers on gold mines, such as refrigeration, a strategy can
be developed to ensure lower overall electricity demand during peak periods. Considering
large electricity consumers on gold mines for DSM projects can therefore alleviate the
pressure on the already strained power grid. Due to refrigeration being one of the largest single
consumers of a gold mine’s electricity, it is expected to see the maximum impact when
considering these systems for DSM.
1.4.2 Revised DSM model
DSM projects usually require large amounts of capital to upgrade or install infrastructure to
realise the electricity cost-saving potential. Eskom awards DSM initiatives and associated
funding to ESCos based on their DSM model. This model was, however, revised in 2015,
specifically with sustainability and ESCo liability in mind. The changes from the old model to
the revised model are indicated in Table 1 [19], [20].
Table 1: Changes to DSM model [19], [20]
Old model Revised model
(2015 onwards)
Project types >100 kW energy
efficiency and load
management
>500 kW load management
Pre-implementation funding Up to R5 million/MW None
Performance assessment (PA)
[ESCo liability]
3 months 36 months
Client contractual period 5 years after PA None
ESCo payment finalisation Payment processed after
PA period
Processed quarterly
Payments processed
after each PA period
(12 in total) based on
performance
The lack of pre-implementation funding and an extended performance assessment period
challenged ESCos to develop creative techniques to implement successful and sustainable
DSM initiatives.

Chapter 1
Optimising deep-level mine refrigeration control for sustainable cost savings 14
1.5 Problem statement
The South African gold mining industry faces multiple challenges, which influences their
productivity and profit margins. One of the challenges is increasing operating costs, of which
electricity is a concern due to the gold mining industry’s intensive use and higher-than-inflation
increases. Gold-mining groups have reached the point where most of their operations are
marginal.
In addition to high electricity costs, gold mines also face problems on their electricity demand
side. This is mainly due to Eskom, the main supplier of electricity to South African gold mines,
struggling to adequately supply the demand. Since gold mining is such an electricity intensive
operation, it is very sensitive to Eskom’s ability to meet the demand. During peak periods
Eskom regularly operates without adequate reserve margins, subsequently reverting to load
curtailment of large users in order to ensure grid stability. This directly influences the
productivity of the gold mines.
These challenges highlight the importance of load management initiatives on gold mines,
especially on electricity-intensive systems such as refrigeration and ventilation. Load
management initiatives would ensure a reduction in gold mine operating costs and in turn
increase profit margins. Eskom will also benefit from these initiatives as a reduced demand
during peak periods will ensure a stable reserve margin for the country.
ESCos play an important role between the gold mining industry and Eskom, as they
complement both parties through DSM initiatives and load management. The revised DSM
model has, however, challenged ESCos to optimise the implementation of these initiatives.
There is therefore a need for ESCos to develop creative load management techniques that
will be cost effective, easy to implement and sustainable over a minimum period of 36 months.
In this way gold mines will benefit from the cost savings and Eskom will be able to improve
the supply reserve margin. From an ESCo’s point of view, by sustainably implementing these
initiatives, continued involvement in DSM can be secured.
1.6 Objectives of study
The main objective of the study is to investigate the implementation of sustainable load-
management initiatives on the electricity-intensive systems of deep-level gold mines. The
implementation of the projects is under the regulations of the new Eskom DSM model. This
complicates the sustainability of the projects’ performance over a period of 36 months as there
is limited funding available for sufficient infrastructure and upgrades. This study will, therefore,

Chapter 1
Optimising deep-level mine refrigeration control for sustainable cost savings 15
focus on low-cost techniques such as optimising the control on deep-level mine systems for
sustainable cost savings.
As refrigeration and ventilation are the largest electricity consumers on typical deep-level gold
mines, control optimisation will be implemented on these particular systems. Load
management projects on the refrigeration and ventilation systems of two separate gold mines
will be identified. To validate the feasibility of the study, these projects must be implemented
under the new Eskom DSM model.
To prove the feasibility of optimising deep-level gold mine refrigeration control for sustainable
cost savings, the following criteria need to be adhered to:
Low-cost – As limited funding is available these projects need to be implemented with
little to no capital expenditure.
Complexity – Design of optimised control strategies need to be simple to eliminate
complex implementation.
Sustainability – Optimised control needs to ensure that implemented projects remain
sustainable over long periods of time.
1.7 Document overview
Chapter 1
Background is given on the South African gold-mining industry and its role in the economy.
Electricity intensity of gold mines is highlighted and refrigeration as one of the largest electricity
consumers is discussed. Challenges with the revised Eskom DSM model are highlighted and
formulated to develop the problem statement. Finally, the objectives of the study are stated.
Chapter 2
The chapter commences with a background on the concept of refrigeration in deep-level gold
mines. The operation of deep-level mine refrigeration systems is discussed, including the
different components and configurations. Previously implemented load management
initiatives on deep-level mine refrigeration systems are investigated with the focus on their
sustainability. Finally, the importance of mathematical modelling and simulations are
discussed as it forms an integral part in the development of the methodology.
Chapter 3

Chapter 1
Optimising deep-level mine refrigeration control for sustainable cost savings 16
Information gathered in Chapter 2 is used to develop the methodology for optimised control
strategies on deep-level gold mine refrigeration systems. The methodology includes
identifying load-reduction potential, developing baselines and adjustment models, developing
control strategies and optimising the strategies through simulations and testing.
Chapter 4
In Chapter 4, optimised control strategies are implemented on the refrigeration systems of two
South African deep-level gold mines, Mine D and Mine R. The results presented in Chapter 4
serve as the motivation for the successful implementation of optimised control strategies in
terms of sustainability, which is the main objective of the study.
Chapter 5
Chapter 5 provides an executive summary on the feasibility of implementing optimised control
strategies on deep-level gold mine refrigeration systems. Finally, the recommendations for
future work on this topic are provided.

Chapter 2
Optimising deep-level mine refrigeration control for sustainable cost savings 17
Chapter 2

Chapter 2
Optimising deep-level mine refrigeration control for sustainable cost savings 18
2 Refrigeration in the deep-level mining environment
2.1 Introduction
As highlighted in Chapter 1, refrigeration and ventilation is one of the largest electricity
consumers of a deep-level mine. The study therefore focuses on the sustainable
implementation of load management initiatives on these systems of deep-level mines. This is
to ensure sustainable and maximised electricity demand impact, especially under the new
Eskom DSM model [16].
In order to develop a sustainable cost-saving strategy on deep-level mine refrigeration
systems, it is important to understand and interpret the concept, operation and configuration
of such systems. It is also important to understand the implementation of different load
management strategies. Previously implemented strategies will therefore be investigated to
determine the shortcomings in terms of sustainability. Finally, the importance of thermal
hydraulic modelling and its contribution to developing effective and sustainable strategies with
low cost and short implementation periods will be highlighted in this chapter.
2.2 Refrigeration concept in deep-level gold mines
2.2.1 Preamble
As set out in the Mine Health and Safety Act No. 967 of 1996, underground temperatures need
to remain under 27.5°C wet-bulb in the working areas and under 32.5°C wet-bulb in the
stopes1 [15]. Virgin rock temperatures in deep-level mines can reach up to 50°C [21]. This
highlights the importance of refrigeration and ventilation systems on deep-level mines to keep
operational temperatures within health and safety regulations [22]. The following sections
investigate the fundamentals, operation, components and configurations of deep-level mine
refrigeration systems.
2.2.2 Vapour-compression refrigeration cycle fundamentals
Figure 13 shows a simplified schematic of a refrigeration compression cycle. Superheated,
low pressure refrigerant vapour enters the compressor at point 1. At point 2 the vapour leaves
the compressor and enters the condenser as a high pressure vapour. The condenser
exchanges heat (QH) with cooling water or the environment. At point 3 the refrigerant is a
condensed high pressure liquid. As the refrigerant flows to point 4 over an expansion valve,
the high pressure liquid flashes to cold vapour. Any remaining low pressure and temperature
1 Inclined areas where the ore containing the valuable minerals is extracted for processing.

Chapter 2
Optimising deep-level mine refrigeration control for sustainable cost savings 19
liquid is vaporised in the evaporator as heat (QL) is absorbed from the refrigerated water or
environment [23].
Figure 13: Simplified layout of a vapour-compression refrigeration cycle [23]
Figure 14 illustrates the P-h (pressure versus enthalpy) diagram for the ideal vapour-
compression refrigeration cycle. The amount of cooling (QL) for any specific system is
determined by the amount of heat (enthalpy) that can be absorbed by the system between
points 4 and 1 (indicated by QL on Figure 13) [23].
Condenser
Compressor
Evaporator
QH
QL
1
23
4
WinExpansion
valve

Chapter 2
Optimising deep-level mine refrigeration control for sustainable cost savings 20
Figure 14: Vapour compression refrigeration cycle P-h diagram [24]
From small household appliances to large industrial cooling systems, the basic principle of
cooling is based on the vapour-compression cycle. The different components and their
configurations need to be examined to better understand deep-level mine refrigeration
systems. The following section focuses on incorporating this cycle within deep-level mine
refrigeration systems for practical use.
2.3 Deep-level mine refrigeration operation
2.3.1 Gold mine refrigeration and ventilation systems
Figure 15 depicts a basic layout of a typical deep-level gold mine refrigeration system. The
major components (indicated by circled numbers) will be discussed in more detail in this
section. An overview on the different refrigeration system configurations in the deep-level
mining industry is also provided.

Chapter 2
Optimising deep-level mine refrigeration control for sustainable cost savings 21
Figure 15: Simplified layout of a gold mine refrigeration system
Pre-cooling tower (PCT) (1)
The pre-cooling towers are used to cool down the hot water pumped from underground. It is
usually designed to cool down the water to a minimum of 2°C above the ambient wet-bulb
temperature [25]. The temperature decrease is due to sensible and latent heat transfer [26].
These towers use motor driven mechanical fans (usually mounted at the top of the tower) to
facilitate heat transfer between warm water and cooler ambient air. The warm water is sprayed
into the tower as a fine mist over a corrugated fill. The corrugated fill increases the surface
contact area and heat transfer time between the water and ambient air [26]. Figure 16 shows
a typical cooling tower setup.
CCT Dam
Warm Dam
Cold Dam
PCT Dam
Chilled Water to Underground
Hot Water from Underground
BAC Dam
2
1
3
5
6
4
7
Cooling tower
Dam
LEGEND
Fridge plant
Motor
Pump
Hot Water
Warm Water
Cold Water
Bulk air coolerBAC
Condenser cooling towerCCT
Pre-cooling towerPCT

Chapter 2
Optimising deep-level mine refrigeration control for sustainable cost savings 22
Figure 16: Mechanical draft cooling towers
Warm dam (2)
The water from the PCTs is transferred to the warm dam. The main purpose of the warm dam
is to provide water storage capacity. This provides a safety barrier to ensure uninterrupted
supply of water to the chillers and consequently to the underground operations [27]. Figure 17
shows surface storage dams on a gold mine.

Chapter 2
Optimising deep-level mine refrigeration control for sustainable cost savings 23
Figure 17: Warm and cold dams
Chiller (3)
The chillers use the vapour-compression cycle, discussed in section 2.2.2, to supply cooling
to the mine in the form of chilled water. These chillers make up the largest portion of the
refrigeration system, comprising up to 66% of the entire system’s electrical load [26]. The
water from the warm dam is drawn through the evaporator side of the refrigeration plant
(chiller). This water exits at a lower temperature due to heat exchange between the water and
refrigerant gas.
Most chillers used on deep-level gold mines use tube-in-shell heat exchangers [28]. The tubes
are contained within a pressure vessel, which acts as the shell. The water flows through the
tubes while refrigerant gas is passed over them within the pressure vessel [29]. Figure 18
shows a typical chiller with its insulated evaporator vessel.

Chapter 2
Optimising deep-level mine refrigeration control for sustainable cost savings 24
Figure 18: Vapour-compression chiller [30]
As warm water enters the chiller’s evaporator, heat is rejected to the refrigerant gas, in turn
cooling the water. As the gas is compressed to a high pressure vapour by the chiller’s
compressor, heat is rejected from the high pressure liquid to the water in the chiller’s
condenser [23].
Condenser cooling tower (CCT) (4)2
Condenser cooling towers operate on the same principal as pre-cooling towers. The warm
condenser outlet water from the chiller is cooled in a condenser cooling tower. The condenser
cooling towers have sump dams where the cooled water is collected and returned to the
condenser vessel of the chiller (semi-closed loop) [26]. Basically the condenser cooling towers
are used to reject the heat absorbed from the refrigerant in the condenser vessel of the chiller
[31].
Cold dam (Thermal storage) (5)
As with the warm dam, the cold dam is used as a storage mechanism. The difference is the
cold dam stores the electrical energy, consumed by the chillers, thermally in the form of chilled
2 Photo not provided due to towers operating on same principle as pre-cooling towers.

Chapter 2
Optimising deep-level mine refrigeration control for sustainable cost savings 25
water [27]. This storage ensures a constant supply of cold water to mining operations even
when the refrigeration system is offline. These dams act as “electrical capacitors” within the
refrigeration system [32]. Figure 19 depicts typical gold mine refrigeration storage dams.
Figure 19: Surface cold storage dams
Thermal storage is vital during the implementation of load management initiatives on
refrigeration systems [27]. Load management requires the refrigeration system to operate at
a reduced capacity or be entirely switched off during certain periods. When this happens, the
flow of cold water stops. During these periods water is supplied from the cold storage dams,
resulting in their levels decreasing.
Bulk Air Cooler (BAC) (6)
The operation of a BAC is very similar to that of a cooling tower, except in a BAC the chilled
water is used to cool down the ambient air. The BAC not only cools the ambient air, but also
serves as a dehumidifier [28]. This cooled and dehumidified air is sent underground to cool

Chapter 2
Optimising deep-level mine refrigeration control for sustainable cost savings 26
and supply adequate ventilation to the mine. The warm BAC outlet water is pumped back to
the warm dam from where the refrigeration cycle repeats itself [33]. Figure 20 shows a typical
BAC, with the mechanical fans and cooling tower visible.
Figure 20: BAC fans and tower
In addition to BAC fans transferring cool and dehumidified air underground, large ventilation
fans (not present in layout) are also used to create a negative air pressure draft through the
mine [34]. This draft ensures that the cold air from the BACs is transferred through the mine
[34].
Pumps (7)
Centrifugal pumps are generally used throughout a mine’s refrigeration system to transfer
water between the different components [28]. These can either be conventional pumps with a
fixed operating speed, supplying a constant flow of water, or pumps fitted with Variable
Frequency Drives (VFDs) to vary the flow output [35]. Figure 21 illustrates a typical transfer
pump and electrical motor set used on deep-level mine refrigeration systems.

Chapter 2
Optimising deep-level mine refrigeration control for sustainable cost savings 27
Figure 21: Centrifugal pump and electrical motor set
All the components within a deep-level mine’s refrigeration system have been identified and
discussed. Depending on the mine’s specific cold water requirements, these components can
be arranged in different combinations. The following section will discuss the different
refrigeration configurations present on deep-level mines.
2.3.2 Refrigeration system configurations
Due to their importance within the refrigeration system, the configuration of the chillers is an
important factor. The chiller configuration determines the amount of water that can be chilled,
as well as the minimum evaporator outlet temperature. There are three different configurations
for chillers in a deep-level mine’s refrigeration system, namely:
Series configuration
Parallel configuration
Parallel-series configuration
The different configurations are determined by the magnitude of the mine and its cooling
requirements [28]. Each of the three configurations is discussed in more detail below:

Chapter 2
Optimising deep-level mine refrigeration control for sustainable cost savings 28
Series configuration
Figure 22 illustrates series configured chillers in a refrigeration system. The water outlet
temperature can be controlled by means of running one or both chillers. This configuration is
mainly used when a constant flow of water is supplied to the chillers. As ambient conditions
vary between summer and winter, one of the chillers can be switched off when less or more
cooling capacity is required [36].
Figure 22: Series configured chillers
Parallel configuration
Figure 23 illustrates parallel configured chillers. When increased cooling is required, the water
flow through parallel chillers can be reduced by means of VFD pumps. This configuration is
mainly used when the water flow rate is varied to determine the outlet temperature. When
chilled water demand is low, one of the chillers and its auxiliary pumps can be switched off
and isolated, thus reducing the amount of water that is supplied to the system at the same
temperature [36].
Series

Chapter 2
Optimising deep-level mine refrigeration control for sustainable cost savings 29
Figure 23: Parallel configured chillers
Parallel-series configuration
As illustrated by Figure 24, the final configuration is a combination of both parallel and series
configured chillers. Varying the cooling can be achieved by running only one, or both chillers
in each parallel leg. This configuration allows more water to be chilled to a lower temperature
than either the series or parallel configurations. Parallel-series configurations are used when
very low temperatures need to be supplied at high flow outputs [28]. If the cooling requirement
is reduced, one of the chillers can be switched off. Both chillers in one of the parallel legs can
also be switched off if the chilled water or cooling demand drastically reduces [36].
Parallel

Chapter 2
Optimising deep-level mine refrigeration control for sustainable cost savings 30
Figure 24: Parallel-series configured chillers
This section discussed the basic components and operation of deep-level mine refrigeration
systems. The different refrigeration configurations were also discussed. The next section
focuses on the implementation of load management initiatives on deep-level mine refrigeration
systems.
2.4 Load management on deep-level mine refrigeration systems
By understanding the operation of deep-level mine refrigeration systems and its components,
load management potential can be determined. It was found in literature that load
management can be implemented on deep-level mine refrigeration systems if the following
criteria is adhered to [37]:
Adequate thermal storage, in particular for the chilled water
Adequate chilled water supply to consumers, while switching off chillers
Adequate comeback load and flow capacity to recover operational parameters
Multiple load management studies and initiatives implemented on deep-level mine
refrigeration systems were investigated. The sustainability of these initiatives is of concern as
the majority were implemented under the old Eskom DSM model. The identified initiatives are
evaluated on the following criteria:
Implementation cost
Parallel-series

Chapter 2
Optimising deep-level mine refrigeration control for sustainable cost savings 31
Implementation time
Load management impact (MW)
Sustainability
Study 1 (2007)
Schutte identified thermal storage as a key component to enable load management on
refrigeration systems. The critical prerequisites required to implement load management on
mine refrigeration systems were also identified. Findings were used to implement load
management on a case study. A mathematical model of a deep-level mine refrigeration system
was developed to aid with further research in the field [37].
Schutte recommended including the BACs into the load shift control strategy and monitoring
the effects thereof. Facilitating water flow control by means of underground control to reduce
chilled water consumption was also recommended [37].
Study 2 (2007)
Van der Bijl used integrated simulation models to investigate the potential for load
management initiatives on deep-level gold mine refrigeration systems. The importance of
mathematical and simulation models in the fast and effective identification of load
management potential on refrigeration systems were highlighted [32].
Further testing of the “generic” control strategy on more refrigeration systems was
recommended along with the need to optimise these strategies for improved cost savings [32].
Study 3 (2015)
Engels focused on the cost savings achievable by combining energy efficiency and load
management initiatives. Although the overall cost savings achieved deemed the project
feasible, the load shift was routinely interrupted due to underground chilled water demand.
The load shift part of the project was unsustainable from inception [31].
Engels highlighted the need to include the underground chilled water demand in the control
strategy to maximise load management potential [31].
Study 4 (2015)
Vermeulen investigated the implementation of a load management project without
implementation costs and achieved load shifting manually. A simulation model was used to

Chapter 2
Optimising deep-level mine refrigeration control for sustainable cost savings 32
determine the load management scope, which enhanced the implementation period of the
project. Vermeulen mentioned that sustainability could become an issue due to manual load
shifting instead of automated control [38].
Recommendations from the study included adding the BACs to the load management
strategy. Implementing real-time monitoring of underground temperatures was also suggested
to monitor the impact of load management over longer periods of time [38].
Project results matrix
A variety of load management projects implemented on deep-level mine refrigeration system
were also investigated. Table 2 summarises various aspects of these projects, as highlighted
by the criteria discussed earlier in this section.
Table 2: Previously implemented load management projects matrix [31], [32], [37], [38]
Pro
ject
ES
Co
mo
de
l
Pro
ject
typ
e
Imp
lem
en
tati
on
du
rati
on
(Mo
nth
s)
Imp
lem
en
tati
on
co
st
(R m
illio
n)
Lo
ad
Sh
ift
ach
ieve
d
(MW
)
Imp
lem
en
tati
on
co
st/
load
sh
ift
ach
ieved
(R/M
W)
Su
sta
ina
bilit
y
(Mo
nth
s)
Mine 1 [32] Old Load shift 12+ 3.08 3.86 798 000 18
Mine 2 [37] Old Load shift 12+ 4.18 4.5 929 000 12
Mine 3 [32] Old Load shift 12+ 1.17 4.0 292 500 12
Mine 4 [31] Old Load shift &
Energy
efficiency
8 4.37 3.5 1 248 500 03
Mine 5 [38] Revised Load shift 0 0 3.7 0 64
Mine 6 [28] Old Load shift 8 3.9 4.0 975 000 05
3 Project active for eight months at the time of this study 4 Project active for six months at the time of this study 5 Project active for 23 months at the time of this study

Chapter 2
Optimising deep-level mine refrigeration control for sustainable cost savings 33
From Table 2 it becomes evident that the implementation cost against the achieved load shift
for projects under the old DSM model was very high (on average R 848 000 per MW). In
addition to the high implementation cost, load management cost savings under the previous
DSM model were not sustainable.
Under the old DSM model, the clients were responsible to maintain the project savings after
the three-month performance assessment period conducted by the ESCo. This resulted in the
deterioration of the project’s performance [19]. Although this is mainly due to a lack of project
maintenance, it severely affects the sustainability of load management on refrigeration
systems.
The project implemented on the refrigeration system of Mine 5 proved to have low
implementation costs and time. Vermeulen proved that this is ascribed to the value of a
simulated control strategy [38]. This simulated strategy was implemented manually on the
refrigeration system at Mine 5.
As indicated by Table 2, the implementation of load management projects under the old DSM
model required a lot of time and effort. Adequate simulation models proved to have a
significant impact on addressing these issues during project implementation, but sustainability
remains an issue. By incorporating some of the recommendations made in the investigated
studies within a simulation model, an effective and sustainable control strategy can be
developed. The next section will therefore focus on modelling and simulating thermal hydraulic
systems and how effective their use is in practical applications.
2.5 Thermal hydraulic system modelling
2.5.1 Preamble
Determining the potential impact of a control strategy on a mine’s refrigeration system prior to
implementation is important. Control strategies on mine refrigeration systems can be
evaluated by using mathematical modelling within simulation software. By predicting the
outcome of a control strategy by means of simulation would help mine personnel to make an
informed decision when implementing load management initiatives.
Under the new Eskom DSM model where funding for projects are limited, low cost, accurate
and time-efficient implementation of sustainable load management initiatives became crucial.
Accurate simulations and modelling are therefore very important to accomplish this. This
section highlights the mathematical equations used to model thermal hydraulic equipment

Chapter 2
Optimising deep-level mine refrigeration control for sustainable cost savings 34
found on mine refrigeration systems. This information will be used to determine which
simulation software package is most suitable for the purpose of this study.
2.5.2 Mathematical equation modelling
To be able to select an appropriate simulation software package, the mathematical equations
used to model major components within an industrial refrigeration system needs to be
investigated. This will also aid in understanding the mathematics behind refrigeration and
cooling components. The mathematical modelling of four major refrigeration components will
be discussed. These components are listed as follows:
Chillers
Pumps
Cooling towers
Dams (thermal storage)

Chapter 2
Optimising deep-level mine refrigeration control for sustainable cost savings 35
Chillers
The schematic illustrated by Figure 25 represents the operation of a chiller. The schematic
explains how to determine the outlet evaporator and condenser water temperature of a chiller
[32], [39], [40].
Figure 25: Water-cooled chiller schematic
The specific equation for cooling capacity of a chiller yields [32]:
Equation 1: Explicit chiller cooling capacity (Cc)
𝑄𝑒 = 𝑓(𝑎0 + 𝑎1𝑡𝑐𝑖 + 𝑎2𝑡𝑒𝑖)
With
𝑎0 = 𝐶𝑐 − (𝑎1𝑡𝑐𝑖 + 𝑎2𝑡𝑒𝑖)
𝑎1 = −0.01𝐶𝑐 + 0.2289
𝑎2 = −0.0266𝐶𝑐 + 2.8714
Condenser
Evaporator
Water-cooler
Warm water Cold water
Tci
Teo
Tco
Tei

Chapter 2
Optimising deep-level mine refrigeration control for sustainable cost savings 36
And
𝑡𝑐𝑖 = Condenser water inlet temperature [K]
𝑡𝑒𝑖 = Evaporator water inlet temperature [K]
𝐶𝐶 = Cooling capacity [kJ/kg]
The coefficient a0 is calculated at a specific operating point obtained from measurements. The
remaining coefficients a1 and a2 were found to be linear over a range of chillers in regards to
cooling capacity. This results in only one operating point being required to determine the model
of a specific chiller [32]. The power consumption of a chiller is calculated as follows:
Equation 2: Explicit chiller power consumption
𝑃 = 𝑓(𝑏0 + 𝑏1𝑡𝑐𝑖 + 𝑏2𝑡𝑒𝑖)
With
𝑏0 = 𝑃 − (𝑏1𝑡𝑐𝑖 + 𝑏2𝑡𝑒𝑖)
𝑏1 = 0.0124𝑃 + 0.4207
𝑏2 = 0.007𝑃 + 0.3549
And
𝑡𝑐𝑖 = Condenser water inlet temperature [K]
𝑡𝑒𝑖 = Evaporator water inlet temperature [K]
𝑃 = Compressor power [kW]
The coefficient b0 is calculated at a specific operating point obtained from measurements. The
remaining coefficients b1 and b2 were found to be linear over a range of chillers in regards to
compressor power. This results in only one operating point being required to determine the
model of a specific chiller [32].
By combining the equations above, the outlet temperature of the evaporator and condenser
water can be determined with the help of the following equations:

Chapter 2
Optimising deep-level mine refrigeration control for sustainable cost savings 37
Equation 3: Evaporator water outlet temperature
𝑡𝑤𝑒(𝑒𝑣𝑎𝑝) = 𝑡𝑤𝑖(𝑒𝑣𝑎𝑝) −𝑄𝑒
𝑚𝑤(𝑒𝑣𝑎𝑝)𝑐𝑝𝑤
Equation 4: Condenser water outlet temperature
𝑡𝑤𝑒(𝑐𝑜𝑛𝑑) = 𝑡𝑤𝑖(𝑐𝑜𝑛𝑑) −𝑄𝑒 + 𝑃
𝑚𝑤(𝑐𝑜𝑛𝑑)𝑐𝑝𝑤
With
𝑡𝑤𝑒 = Water outlet temperature [K]
𝑡𝑤𝑖 = Water inlet temperature [K]
𝑄𝑒 = Cooling capacity [kJ/kg]
𝑃 = Compressor power [kW]
𝑚 = Water mass flow [kg/s]
𝑐𝑝𝑤 = Specific heat of water taken as 4.186 [kJ/kg∙K]
Pumps
Figure 26 shows a basic schematic of a centrifugal pump. The following model describes how
to obtain the heat rise over a centrifugal pump as well as the pump’s electrical power
consumption [32], [41].
Figure 26: Pump schematic
Water in
Water out

Chapter 2
Optimising deep-level mine refrigeration control for sustainable cost savings 38
This model is based on the two non-dimensional variables below, derived from using the
Buckingham-Pi theorem [42], [43].
Equation 5: Flow coefficient
𝐾𝑓 =�̇�
𝜌𝑛𝐷3
Equation 6: Pressure head coefficient
𝐾ℎ =𝑑𝑃
𝜌𝑛2𝐷3
With
�̇� = Water mass flow [kg/s]
𝑑𝑃 = Static pressure increase [Pa]
𝜌 = Water density taken as 1000 [kg/m3]
𝑛 = Pump rotational speed [rev/s]
𝐷 = Pump rotor diameter [m]
These two equations are used to specify the characteristics of any centrifugal pump [32], [42],
[43]. By using polynomial regression the following equations are derived:
Equation 7: Pressure head polynomial regression
𝐾ℎ = 𝑎0 + 𝑎1𝐾𝑓 + 𝑎2𝐾𝑓2+. . +𝑎𝑘𝐾𝑓
𝑘
With ak the k+1 correlation coefficient, determined from data tables. Depending on the relation
between Kf and Kh, the order of the polynomial equation will vary between models. Similarly
the efficiency can be calculated as:
Equation 8: Pump efficiency
𝜂𝑃 = 𝑏0 + 𝑏1𝐾𝑓 + 𝑏2𝐾𝑓2+. . +𝑏𝑘𝐾𝑓
𝑘
Subsequently the temperature rise over the pump can be calculated with the following
equations:

Chapter 2
Optimising deep-level mine refrigeration control for sustainable cost savings 39
Equation 9: Heat transfer to water due to compression in pump
𝑄 = (1 − 𝜂𝑃)�̇�𝑑𝑃
𝜌 𝜂𝑃
With
𝜂𝑃 = Pump efficiency [%]
�̇� = Water mass flow [kg/s]
𝑑𝑃 = Static pressure rise [Pa]
𝜌 = Water density taken as 1000 [kg/m3]
Equation 10: Water temperature rise over pump
𝑡𝑒 = 𝑡𝑖 +𝑄
�̇�𝐶𝑝𝑤
With
𝑡𝑒 = Water outlet temperature [K]
𝑡𝑖 = Water inlet temperature [K]
�̇� = Water mass flow [kg/s]
𝐶𝑝𝑤 = Specific heat of water taken as 4.186 [kJ/kg∙K]
The required electrical power can also be calculated as:
Equation 11: Pump electrical power
𝑃 = 𝑘�̇�𝑑𝑃
𝜌𝜂𝑃𝜂𝑀
With
𝑘 = Pump stages [-]
�̇� = Water mass flow [kg/s]
𝑑𝑃 = Static pressure rise [Pa]
𝜌 = Water density taken as 1000 [kg/m3]
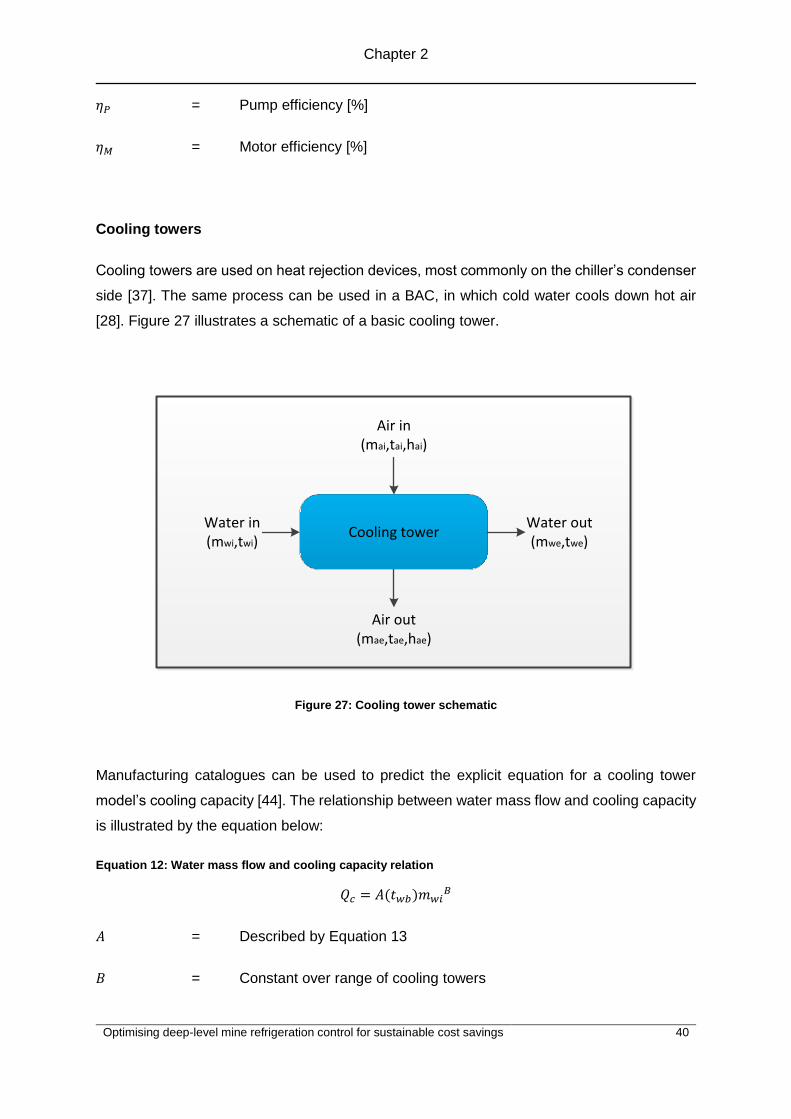
Chapter 2
Optimising deep-level mine refrigeration control for sustainable cost savings 40
𝜂𝑃 = Pump efficiency [%]
𝜂𝑀 = Motor efficiency [%]
Cooling towers
Cooling towers are used on heat rejection devices, most commonly on the chiller’s condenser
side [37]. The same process can be used in a BAC, in which cold water cools down hot air
[28]. Figure 27 illustrates a schematic of a basic cooling tower.
Figure 27: Cooling tower schematic
Manufacturing catalogues can be used to predict the explicit equation for a cooling tower
model’s cooling capacity [44]. The relationship between water mass flow and cooling capacity
is illustrated by the equation below:
Equation 12: Water mass flow and cooling capacity relation
𝑄𝑐 = 𝐴(𝑡𝑤𝑏)𝑚𝑤𝑖𝐵
𝐴 = Described by Equation 13
𝐵 = Constant over range of cooling towers
Cooling towerWater in(mwi,twi)
Water out(mwe,twe)
Air in(mai,tai,hai)
Air out(mae,tae,hae)

Chapter 2
Optimising deep-level mine refrigeration control for sustainable cost savings 41
𝑡𝑤𝑏 = Ambient wet-bulb temperature
𝑚𝑤𝑖 = Water mass flow through tower
The constant A is a function of the ambient wet-bulb temperature of the air in the cooling tower
and given by the following equation:
Equation 13: Constant A
𝐴 = 𝐶(𝑡𝑤𝑖)𝑡𝑤𝑏 + 𝐷(𝑡𝑤𝑖)
The gradient and constant (C and D) are dependent on the water inlet temperature and given
by the following equations:
Equation 14: Gradient C
𝐶 = 𝑎0𝑡𝑤𝑖 + 𝑎1
Equation 15: Constant D
𝐷 = 𝑎2𝑡𝑤𝑖 + 𝑎3
The cooling capacity of the tower can be calculated empirically by substituting variables A, B
and C into Equation 12 as indicated below, where a0 to a3 are empirical curve fit coefficients.
Equation 16: Cooling capacity of cooling tower
𝑄𝑐 = [(𝑎0 + 𝑎1𝑡𝑤𝑖)𝑡𝑤𝑏 + 𝑎2𝑡𝑤𝑖 + 𝑎3] 𝑚𝑤𝑖𝐵
When the cooling capacity is calculated, it can be used to determine the outlet water
temperature and air enthalpy with the following equations:
Equation 17: Outlet water temperature – cooling tower
𝑡𝑤𝑒 = 𝑡𝑤𝑖 −𝑄𝑐
𝑚𝑤𝐶𝑝𝑤
With
𝑡𝑤𝑖 = Water inlet temperature [K]
𝑄𝑐 = Cooling capacity [kJ/kg]
𝑚𝑤 = Water mass flow [kg/s]
𝐶𝑝𝑤 = Specific heat of water taken as 4.186 [kJ/kg∙K]

Chapter 2
Optimising deep-level mine refrigeration control for sustainable cost savings 42
Equation 18: Outlet air enthalpy – cooling tower
ℎ𝑎𝑒 = ℎ𝑎𝑖 +𝑄𝑐
𝑚𝑎
With
ℎ𝑎𝑖 = Air inlet enthalpy [kJ/kg]
𝑄𝑐 = Cooling capacity [kJ/kg]
𝑚𝑎 = Air mass flow [kg/s]
The temperature of the outlet air (tae) can now be determined by using psychrometric charts,
assuming the outlet air is fully saturated [44].
Dams (thermal storage)
The final major component to be modelled is the storage dams. Figure 28 shows the schematic
of a thermal storage dam [32], [44]. For the purposes of this model, the assumption is made
that the thermal storage dam reacts in the same way as an electrical capacitor [45].
Dam(V0,TD,%)
Ti,mi
Ts
TD,m0
Figure 28: Dam (thermal storage) schematic
Multiple variables affect the temperature within a storage dam. This includes initial volume,
initial temperature and solar air temperature [44]. The solar air temperature (Ts) includes
absorption and emittance of air in contact with the dam wall. The convection coefficient of the
dam wall is also part of the solar air temperature [44]. By taking the heat transfer mentioned
above into account (including the heat transfer of the dam’s exposed areas), the following
equation can be derived:

Chapter 2
Optimising deep-level mine refrigeration control for sustainable cost savings 43
Equation 19: Basic thermal storage dam equation
𝐶 𝑑𝑇
𝑑𝑡= 𝑚𝑖𝐶𝑝𝑤(𝑇𝑖 − 𝑇𝐷) + 𝑈𝐴(𝑇𝑠 − 𝑇𝐷)
With the solar temperature given by the following equation [45]:
Equation 20: Solar air temperature
𝑇𝑠 = 𝑇𝐴 + 𝛼𝐺𝑡
ℎ0−
𝜀Δ𝑅
ℎ0
With
𝑇𝐴 = Ambient dry-bulb temperature [K]
𝛼𝐺𝑡
ℎ0 = Absorption heat transfer of air [-]
𝜀Δ𝑅
ℎ0 = Emittance heat transfer of air [-]
By factorising Equation 19 and separating the results, the following equation can be obtained
[32]:
Equation 21: Basic thermal storage dam equation – Step 2
𝐶 𝑑𝑇
𝑑𝑡= −𝑇𝐷 ∙ 𝑎 + 𝑏
With
𝑎 = 𝑚𝑖𝐶𝑝𝑤 + 𝑈𝐴
𝑏 = 𝑚𝑖𝐶𝑝𝑤𝑇𝑖 + 𝑈𝐴𝑇𝑠
𝐶 = 𝐶0 + (𝑚𝑖 − 𝑚0)𝐶𝑝𝑤∆𝑡
𝐶0 = 𝑉0 ∙ 𝐶𝑝𝑤
By rearranging the equations above, the following equation can be obtained:
Equation 22: Basic thermal storage dam equation – Step 3
∫1
𝑇𝐷 ∙ 𝑎 − 𝑏 𝑑𝑇 = ∫
−1
𝐶𝑑𝑡
1
0
𝑇𝐷
𝑇𝐷0

Chapter 2
Optimising deep-level mine refrigeration control for sustainable cost savings 44
When integration is complete, the exponential rules can be used to obtain the following
equation:
Equation 23: Thermal storage dam temperature
𝑇𝐷 = 1
𝑎((𝑇𝐷0
∙ 𝑎 − 𝑏)𝑒−𝑎Δ𝑡
𝐶 + 𝑏)
With
𝐶 = 𝑚𝑎𝑥, 𝑖𝑓 𝐶 ≥ 𝑚𝑎𝑥
𝑚0 = 0, 𝑖𝑓𝐶 ≤ 0
The dam volume is another important factor to consider in the thermal storage system. As inlet
and outlet flow varies over time, the volume (dam level) dynamically changes. The following
equation models the dam volume [44]:
Equation 24: Thermal storage dam volume
𝑉𝑡 = 𝑉𝑡−1 +(𝑚𝑖 − 𝑚𝑜)∆𝑡
1000
With
𝑚0 = 0, 𝑖𝑓𝑉𝑡−1 = 0
𝑚𝑖 = 0, 𝑉𝑡 = 𝑉𝑇 , 𝑖𝑓 𝑉𝑡−1 ≥ 𝑉𝑇
This model requires the user to input information such as initial conditions, total volume and
basic design of the dam.
The mathematical models explained in this section have become more accessible through
simulation packages. These simulation packages incorporate the described models into
optimised software that reduces the time spent on modelling a refrigeration system. The
different commercially available simulation packages are evaluated in the next section as it
forms an integral part of this study.
2.5.3 Simulation software for deep-level mine refrigeration systems
In the past, simulation software packages were not commonly available for mine refrigeration
systems, forcing researchers to use commercial HVAC (Heating, Ventilation and Air
Conditioning) packages [46]. In recent years, more and more simulation software packages
are specifically designed to simplify and simulate mine refrigeration systems. One particular

Chapter 2
Optimising deep-level mine refrigeration control for sustainable cost savings 45
study identified over forty-five such packages [30]. The most commonly available simulation
packages developed for mine refrigeration systems are discussed as follows:
ENVIRON
ENVIRON is commonly used throughout the mining industry. It simulates the airflow
underground and aids in the design of mine ventilation. Hourly profiles required to simulate
Eskom’s TOU tariff structure is, however, not available with this package. The main use of
ENVIRON is to specify the cooling capacity required for adequate cooling of the underground
environment [32].
VUMA (Ventilation of Underground Mine Atmospheres)
This software package can be used to simulate ventilation and water-cooling applications in
large mines. VUMA is one of the few software packages that can fully analyse thermodynamic
effects in underground mining environments. It also aids in analysing the heat and gas
distribution throughout a mine.
This software is mainly used to optimise the refrigeration and ventilation systems of mines. It
requires a large amount of input data to deliver accurate results. Trained and qualified
personnel are required to operate the software and obtain accurate results [32], [28], [47].
Process Toolbox (PTB)
Process Toolbox (PTB) is a thermal hydraulic simulation software package. It is used to
simulate a mine’s refrigeration, dewatering and compressed air system. The software has the
capability to determine optimal operation of equipment and to calculate potential cost savings
from proposed load management initiatives. PTB also enables the design, analysis and
optimisation of a system’s performance [48].
PTB features a Graphical User Interface that enables the drag and drop of system components
[48]. Each system comprises pipes and nodes to calculate the flow and thermal hydraulic
properties, respectively [48]. In addition to this, the four major components described in section
2.5.2 are all available in PTB [48]. Figure 29 below illustrates a simplified layout of a thermal
hydraulic system simulated with PTB.

Chapter 2
Optimising deep-level mine refrigeration control for sustainable cost savings 46
Figure 29: Simplified illustration of a thermal hydraulic system simulated in PTB
Previous studies by Oberholzer [28], Vermeulen [38] and Mare [49] on mine refrigeration
systems proved the accuracy of the PTB simulation software. A summary of the three studies
are provided as follows:
Oberholzer simulated the successful reconfiguration of a deep-level gold mine
refrigeration system for improved operation. The simulated and actual results
corresponded.
Vermeulen simulated cost-effective management techniques to realise cost savings
on mine refrigeration systems. The simulated and actual results corresponded.
Mare simulated the optimised control for improved energy savings on mine
refrigeration systems. The simulated and actual results corresponded.
The simulation software packages were evaluated according to each one’s advantages and
disadvantages. The evaluation assists in identifying the most suitable package for the
purposes of this study. Table 3 shows the evaluation of the simulation packages.
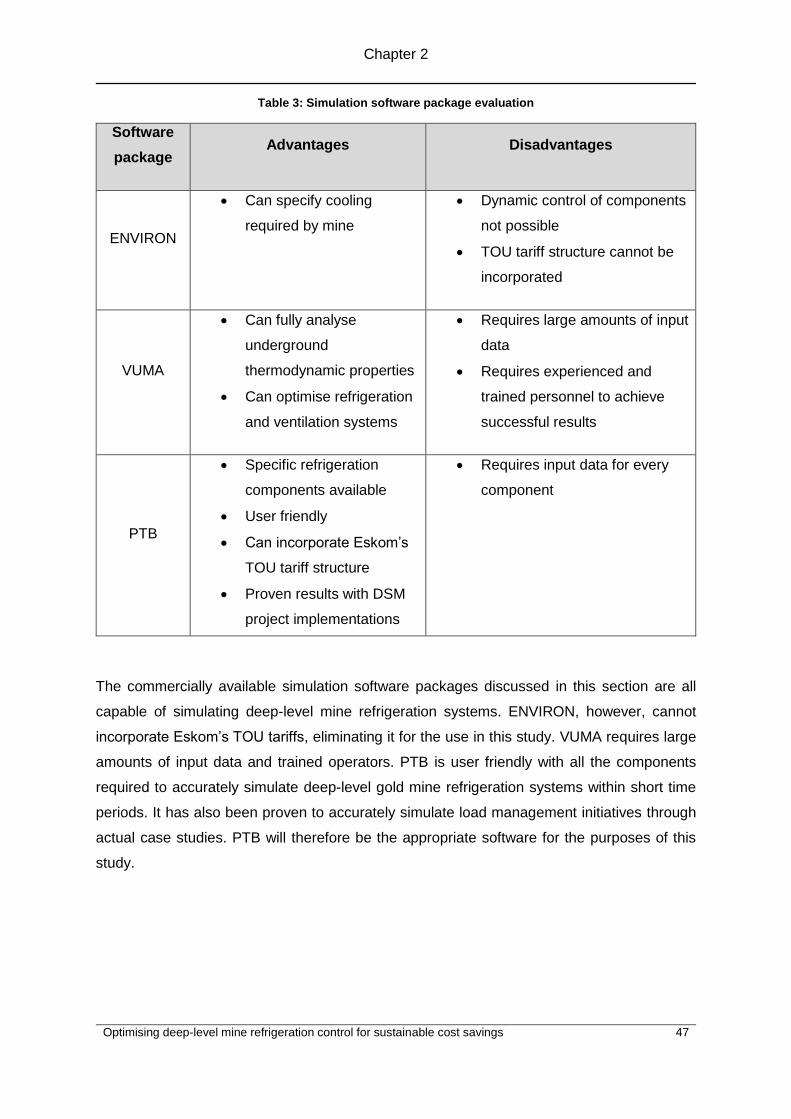
Chapter 2
Optimising deep-level mine refrigeration control for sustainable cost savings 47
Table 3: Simulation software package evaluation
Software
package Advantages Disadvantages
ENVIRON
Can specify cooling
required by mine
Dynamic control of components
not possible
TOU tariff structure cannot be
incorporated
VUMA
Can fully analyse
underground
thermodynamic properties
Can optimise refrigeration
and ventilation systems
Requires large amounts of input
data
Requires experienced and
trained personnel to achieve
successful results
PTB
Specific refrigeration
components available
User friendly
Can incorporate Eskom’s
TOU tariff structure
Proven results with DSM
project implementations
Requires input data for every
component
The commercially available simulation software packages discussed in this section are all
capable of simulating deep-level mine refrigeration systems. ENVIRON, however, cannot
incorporate Eskom’s TOU tariffs, eliminating it for the use in this study. VUMA requires large
amounts of input data and trained operators. PTB is user friendly with all the components
required to accurately simulate deep-level gold mine refrigeration systems within short time
periods. It has also been proven to accurately simulate load management initiatives through
actual case studies. PTB will therefore be the appropriate software for the purposes of this
study.

Chapter 2
Optimising deep-level mine refrigeration control for sustainable cost savings 48
2.6 Conclusion
To be able to accurately simulate a control strategy on mine refrigeration systems for
sustainable performance, it was required to thoroughly understand the basic concept of mine
refrigeration. The general operation, components and configurations were also discussed to
provide an overview on mine refrigeration systems.
Previously implemented load management initiatives were also investigated to highlight the
differences between the old and new Eskom DSM model. The initiatives were critically
analysed in terms of implementation cost, time and sustainability of delivered cost savings.
Finally, modelling and simulation of refrigeration systems were studied to enable informed
decisions on software packages during the development of sustainable control strategies.
The information gathered in Chapter 2 will be used to develop and optimise a control strategy
to realise sustainable cost savings on deep-level gold mine refrigeration systems. The strategy
will be aligned with the criteria set by the new Eskom DSM model, which are limited funding,
short implementation periods and sustainable cost savings over long periods of time.

Chapter 3
Optimising deep-level mine refrigeration control for sustainable cost savings 49
Chapter 3

Chapter 3
Optimising deep-level mine refrigeration control for sustainable cost savings 50
3 Optimising refrigeration control for sustainable cost
savings
3.1 Introduction
The information gathered in Chapter 2 will be used to develop a methodology for an optimised
control strategy to ensure sustainable cost savings on mine refrigeration systems. Figure 30
depicts a visual representation of the methodology that will be discussed in this chapter.
Figure 30: Control optimisation methodology
Baseline
development
Identify
Develop strategy
Validate
• Identify load reduction potential
• Characterise refrigeration system
• Determine system constraints
• Develop electrical baselines • Develop operational baselines
• Develop refrigeration control strategy
• Simulate developed strategy • Verify simulation
• Validate simulated strategy
Simulate
Implement • Implement validated strategy
Op
tim
ise
(Repeat
ste
p 3
– 5
)

Chapter 3
Optimising deep-level mine refrigeration control for sustainable cost savings 51
The first step is to identify load management potential on a deep-level mine refrigeration
system. Suitable electrical and operational baselines then need to be developed to measure
cost savings and operational changes after implementation of optimised control strategies.
The next step is to develop, simulate, verify and validate a control strategy to determine the
theoretical impact on the practical system.
To improve cost savings and overall system operation, steps 3 to 5 must be repeated, which
is also defined as optimisation of the control strategy. Finally, the optimised control strategy
can be implemented on the refrigeration system. These steps of the methodology will be
discussed in detail in the following sections.
3.2 Identifying load reduction potential
3.2.1 Electrical power usage
Due to gold mines operating on Eskom’s Megaflex TOU tariff structure, cost savings are
realised by shifting the load out of Eskom’s peak periods. Potential scope will therefore be
determined by estimating the potential of reducing a refrigeration system’s electricity demand
during this time.
The first step is to consult with mine personnel to determine the scope for load management
on the particular system. Electrical power data must be collected and analysed to verify the
potential. It will become apparent from the power data whether scope is present as illustrated
by the following examples.
An hourly average daily power profile is used to determine potential load management scope.
The theoretical load shift is the average power usage during the Eskom evening peak hours
of 18:00 and 19:00 (17:00 and 18:00 in winter). Figure 31 indicates two profiles where potential
load management scope is present. Although one profile (indicated by the dotted line)
indicates an existing load shift, further scope exists due to electrical power still being used
during the peak period. This indicates the need to optimise the control to maximise the cost
savings.

Chapter 3
Optimising deep-level mine refrigeration control for sustainable cost savings 52
Figure 31: Potential load management identification
Calculating an evening peak to average power usage ratio can support the power profiles in
determining potential scope for load shifting. Equation 25 illustrates the calculation in
determining the evening peak to average ratio. A ratio of one indicates a “flat” profile, as
illustrated by the blue line in Figure 31. Ratios between 0.1 and 0.9 can indicate existing load
shifts. A ratio of 0 indicates no potential scope as it means all the load is shifted from the
evening peak period.
Equation 25: Evening peak to average ratio
𝑅𝑎𝑡𝑖𝑜 =
∑ 𝐸𝑣𝑒𝑛𝑖𝑛𝑔 𝑃𝑒𝑎𝑘 𝐸𝑛𝑒𝑟𝑔𝑦 𝑈𝑠𝑎𝑔𝑒2
∑ 𝑇𝑜𝑡𝑎𝑙 𝐸𝑛𝑒𝑟𝑔𝑦 𝑈𝑠𝑎𝑔𝑒24
[−]
The potential cost savings through load management are determined from the amount of load
(kWh) that can be shifted from the evening peak period. Once the cost-saving potential has
been determined, the next step is to characterise the refrigeration system. This includes the
following:
listing major components and their installed capacities;
examining the layout and operation of the system; and
identifying the system constraints
00
:00
01
:00
02
:00
03
:00
04
:00
05
:00
06
:00
07
:00
08
:00
09
:00
10
:00
11
:00
12
:00
13
:00
14
:00
15
:00
16
:00
17
:00
18
:00
19
:00
20
:00
21
:00
22
:00
23
:00
Po
wer
Time
Refrigeration Power Profile Example
No load management present Load management present

Chapter 3
Optimising deep-level mine refrigeration control for sustainable cost savings 53
Once the system has been characterised, the feasibility of a potential load management
project can be determined. The inner detail of the characterisation procedure is discussed as
follows:
3.2.2 Listing major components and data collection
A site visit can be arranged to verify all the components and their installed capacities. Mine
personnel may be ideal to assist with the task. SCADA layouts can also be obtained to assist
in characterising the refrigeration system. Table 4 lists the major components present in a
general deep-level gold mine refrigeration system and the data that should be collected for
each component.
Table 4: Major components of a gold mine refrigeration system
Component Required Data
Fridge Plants (Chillers)
Compressor motor installed capacity [kW]
Evaporator inlet and outlet temperature [°C]
Condenser inlet and outlet temperature [°C]
Evaporator and condenser flow rate [l/s]
Pumps
Pump motor installed capacity [kW]
Pump flow rate [l/s]
Pumping elevation [m]
Cooling towers and
BACs
Water inlet and outlet temperatures [°C]
Air inlet and outlet temperature [°C]
Water flow rate [l/s]
Air flow rate [kg/s]
Cooling tower and BAC
Fans
Fan motor installed capacity [kW]
Air flow rate [kg/s]
Dams
Water temperature [°C]
Volume [m3]
Operating levels [%]
Configuration

Chapter 3
Optimising deep-level mine refrigeration control for sustainable cost savings 54
Valves Valve positions
Automated capabilities
In addition to the information mentioned in Table 4, ambient temperature data at the location
of the specific refrigeration system are also required. Ambient conditions are required as it
determines the performance of cooling towers (and therefore the chillers) and the temperature
of the air being sent underground by the BACs.
The information described in this section is required to accurately simulate and verify the
refrigeration system’s operation and potential impact of load shift control strategies. Accurate
simulations will also engender credibility of proposed control strategies to optimise the system.
Once all the information has been collected, the next step is to interpret all the components
into a system layout to simplify and understand the operation.
3.2.3 Refrigeration system layout and operation
Figure 32 shows an example of a simplified deep-level gold mine refrigeration system layout
(for reference purposes, the same layout as presented in chapter 2 is used). Once all the
components have been included into the layout, the potential scope for load management can
be verified by evaluating the current operation of the system. It is important to note that
refrigeration system operations and layouts may vary between different mines.

Chapter 3
Optimising deep-level mine refrigeration control for sustainable cost savings 55
Figure 32: Simplified refrigeration system layout
It is crucial to compile an accurate layout of the components, pipe reticulation and water
storage configuration. This will aid in determining whether the current operation can be
adapted to incorporate a load shift during Eskom’s evening peak periods. The next step is to
determine whether any constraints within the system will prohibit the implementation of a load
management strategy.
3.2.4 System constraints
Switching off components in large refrigeration systems affects operational conditions within
the system. It is, therefore, important to identify and understand the constraints as it influences
implementation of load management initiatives. Table 5 summarises the most common
constraints and related risks when determining the load shift potential on deep-level gold mine
refrigeration systems. A brief description of each constraint is provided after
Table 5.
CCT Dam
Warm Dam
Cold Dam
PCT Dam
Chilled Water to Underground
Hot Water from Underground
BAC Dam
Cooling tower
Dam
LEGEND
Fridge plant
Motor
Pump
Hot Water
Warm Water
Cold Water
Valve
Bulk air coolerBAC
Condenser cooling towerCCT
Pre-cooling towerPCT

Chapter 3
Optimising deep-level mine refrigeration control for sustainable cost savings 56
Table 5: Possible constraints during implementation of load shift initiatives on gold mines
Constraint Risk
Cold water storage capacity Moderate
Cold water storage condition Low
Maximum operating flow for comeback load Moderate
Lack of isolation valves Moderate
Safe underground environmental conditions High
Machine mechanical issues Moderate
Mine personnel cooperation Moderate
Cold water storage capacity (Moderate Risk)
By switching off some of the components in the refrigeration system, the continuous flow of
cold water to storage dams is interrupted. If there is any cold water demand during these
periods, water needs to be supplied from the storage dams. It is vital to ensure that there is
enough cold water storage capacity to ensure the required water demand is met during the
evening load shift period. As soon as components need to be started during peak periods due
to a cold water supply shortage, the load management initiative becomes unsustainable.
Cold water storage condition (Low Risk)
The physical condition of the storage dam indicates how well the cold water inside is insulated.
If it is, for example, a closed dam, the water will retain temperatures much better than an open
dam. When cold water storage temperatures rise to an unacceptable level, the refrigeration
system will have to be started, irrespective of how much storage capacity is available. When
this happens the initiative becomes unsustainable. Adequate insulation is therefore important
to ensure that the temperatures of the stored water remain acceptable.
Maximum operating flow for comeback load (Moderate Risk)
The cold water storage levels need to be recovered after load shifting periods. The
refrigeration system’s output therefore needs to be increased after the load shift to recover

Chapter 3
Optimising deep-level mine refrigeration control for sustainable cost savings 57
cold water storage levels and temperatures. If the maximum capacity of the refrigeration
system is not sufficient to achieve this, load shift sustainability will be negatively affected.
Lack of isolation valves (Moderate Risk)
Depending on the configuration of the refrigeration system, cold water storage dams need to
be isolated from warmer water in the system. If there are no isolation valves installed to
accomplish this task, warmer water will mix with chilled water and the system temperatures
will increase. If these temperatures rise to unacceptable levels, the refrigeration system will
need to be started to reduce system temperatures. This directly influences load shift
sustainability.
When the temperature in the storage dams significantly increases after a load shift, it becomes
necessary to continuously run the refrigeration system until the temperature decreases. In
some cases it affects the following days’ load shifts as temperatures may take a couple of
days to recover. This in turn influences the sustainability.
Safe underground environmental conditions (High Risk)
Due to the cold water demand of Bulk Air Coolers (BACs), switching off the refrigeration
system and BACs’ cold water supply may result in an increase in underground temperatures.
If the underground temperatures increase beyond unsafe levels, the refrigeration system will
be started, as a safe working environment is of utmost importance for deep-level gold mines.
In some instances, mine personnel request tests to be conducted to verify that the
temperatures are not negatively affected by switching off refrigeration components for short
periods of time (two hours).
Machine mechanical issues (Moderate Risk)
Due to the age of most refrigeration systems on South African gold mines, some components
may experience issues when regularly stopped or started. Regular maintenance should,
however, prevent start-up problems on these components. In some cases certain components
will have to be excluded from the load shift due to high repair or replacement costs. Although
this will result in reduced cost savings, ensuring all the refrigeration equipment is operational
at all times will increase the sustainability.
Mine personnel cooperation (Moderate Risk)
Refrigeration and adequate ventilation remain one of the most important aspects when it
comes to safe deep-level mining. Mine personnel are not always willing to switch of

Chapter 3
Optimising deep-level mine refrigeration control for sustainable cost savings 58
refrigeration components due to the extreme underground environmental conditions. The
cooperation of mine personnel therefore plays a crucial role in sustainable load management
initiatives.
Once all of the constraints have been identified and the associated risks mitigated, scope for
a load shift initiative can be confirmed. If scope is confirmed to be present, the next step will
be to develop baselines from historical data. The baselines will serve as benchmarks which
future performance and sustainably of the load management initiative are measured to. The
next section provides the detail of developing baselines and the associated baseline
adjustment techniques.
3.3 Developing baselines and adjustment models
3.3.1 Preamble
Two types of baselines will be developed, namely: an electrical power baseline and system
operational baselines. The electrical power baseline will be used to determine the cost savings
achieved after implementation of load management initiatives. The operational baselines will
be used to determine the project’s sustainability in terms of operational indicators such as dam
levels and system temperatures. Due to the seasonal variances, a suitable baseline
adjustment method will also be required for the electrical power baseline.
3.3.2 Electrical power baseline
The electrical power baseline consists of a half-hourly average daily profile of the entire
refrigeration system’s power consumption. A summer (September to May) baseline is
compiled for the purposes of this study. Figure 33 shows an example of an electrical power
baseline for a deep-level mine refrigeration system.

Chapter 3
Optimising deep-level mine refrigeration control for sustainable cost savings 59
Figure 33: Electrical power baseline example
The baselines will be used to determine the impact of load management on the operating cost
of the refrigeration system. Due to operational changes and dynamic power consumption
profiles of mine refrigeration systems, a Service Level Adjustment (SLA) method is required.
The details behind SLA are discussed in the following section.
3.3.3 Service level adjustments
SLA for the electrical power baselines is required to ensure credible cost savings are
calculated and reported. Since load management initiatives do not necessarily result in net
energy savings, energy neutral scaling will be used for service level adjustments6 [50]. The
adjustments are based on daily kilowatt hour neutrality as indicated by the following equations.
Equation 26: Service level adjustment factor
𝑺𝑳𝑨𝒇 = ∑𝒌𝑾𝒉𝑨𝒄𝒕𝒖𝒂𝒍𝒊
𝒌𝑾𝒉𝑩𝒂𝒔𝒆𝒍𝒊𝒏𝒆𝒊
𝟒𝟕
𝒊=𝟎
[−]
Where:
𝑘𝑊ℎ𝐴𝑐𝑡𝑢𝑎𝑙𝑖 = Half-hourly actual energy consumption
𝑘𝑊ℎ𝐵𝑎𝑠𝑒𝑙𝑖𝑛𝑒𝑖 = Half-hourly baseline energy consumption
6 Standard M&V procedure for load management initiatives
0
2000
4000
6000
8000
10000
00
:00
01
:00
02
:00
03
:00
04
:00
05
:00
06
:00
07
:00
08
:00
09
:00
10
:00
11
:00
12
:00
13
:00
14
:00
15
:00
16
:00
17
:00
18
:00
19
:00
20
:00
21
:00
22
:00
23
:00
Po
wer
(kW
)
Time
Electrical Power Baseline Example

Chapter 3
Optimising deep-level mine refrigeration control for sustainable cost savings 60
Equation 27: Scaled baseline calculation
𝑺𝒄𝒂𝒍𝒆𝒅 𝑩𝒂𝒔𝒆𝒍𝒊𝒏𝒆𝒊 = 𝑺𝑳𝑨𝒇 × 𝑶𝒓𝒊𝒈𝒊𝒏𝒂𝒍 𝑩𝒂𝒔𝒆𝒍𝒊𝒏𝒆𝒊 [𝒌𝑾]
Where:
𝑖 = Half-hourly intervals for each day
By using Equation 26 and Equation 27, a suitably scaled baseline can be determined for the
baseline example illustrated by Figure 33. Figure 34 illustrates the concept of SLA for this
particular baseline.
Figure 34: Service level adjustment illustration
The electrical power baseline is finalised with the establishment of a suitable SLA method.
The next step will involve determining operational baselines for the refrigeration system.
3.3.4 Operational baselines
Operational baselines must be developed to determine the effect of load management on the
operational parameters of the refrigeration system. Key Performance Indicators (KPI) must be
identified and set limits must be determined. To ensure sustainability of a daily load shift, KPIs
need to be monitored to ensure they remain within the daily prescribed limits.
0
2750
5500
8250
11000
00
:00
01
:00
02
:00
03
:00
04
:00
05
:00
06
:00
07
:00
08
:00
09
:00
10
:00
11
:00
12
:00
13
:00
14
:00
15
:00
16
:00
17
:00
18
:00
19
:00
20
:00
21
:00
22
:00
23
:00
Po
wer
(kW
)
Time
Service Level Adjustment Example
Baseline Scaled baseline Actual
Chapter 3
Optimising deep-level mine refrigeration control for sustainable cost savings 61
The KPIs that need to be identified are:
Cold water storage level
Cold water storage temperature
BAC outlet air temperature
Underground ambient temperature
The next step is to develop, simulate and implement a sustainable control strategy to reduce
the refrigeration system’s electricity demand during Eskom’s evening peak periods.
3.4 Developing a load shift control strategy
3.4.1 Preamble
The information gathered and mentioned in the preceding sections is used to develop a
sustainable load shift control strategy for the refrigeration system. The developed strategy
must be simulated, verified and optimised prior to implementation.
3.4.2 Developing the control strategy
The development of the control strategy will mainly focus on the sequence in which the
refrigeration components are switched off during Eskom’s evening peak period. An important
factor to consider while developing the control strategy is low costs. Only existing infrastructure
should be considered in the development, as any additional infrastructure will attract unwanted
implementation costs. Figure 35 illustrates the typical shutdown sequence (indicated by circled
numbers) for a load management initiative on deep-level mine refrigeration systems.

Chapter 3
Optimising deep-level mine refrigeration control for sustainable cost savings 62
Figure 35: Refrigeration components shutdown sequence
Figure 35 indicates the sequence in which the refrigeration system components need to be
switched off before Eskom’s evening peak period. Firstly the chillers should be switched off,
followed by any auxiliary pumps that are not required. Finally, the fans in the cooling towers
and BACs should be switched off. The constraints associated with this example are listed in
Table 6.
Table 6: Refrigeration system component shutdown sequence example
Shutdown
sequence Component
Power
consumption
[kW]
Possible constraints
1 Chillers 500 – 8000
Start-up issues
Cold water temperature
Cold water dam level
CCT Dam
Warm Dam
Cold Dam
PCT Dam
Chilled Water to Underground
Hot Water from Underground
BAC Dam
Cooling tower
Dam
LEGEND
Fridge plant
Motor
Pump
Hot Water
Warm Water
Cold Water
Valve
1
2
3
4
4
2
22
Cooling tower
Dam
LEGEND
Fridge plant
Motor
Pump
Hot Water
Warm Water
Cold Water
Valve
Bulk air coolerBAC
Condenser cooling towerCCT
Pre-cooling towerPCT

Chapter 3
Optimising deep-level mine refrigeration control for sustainable cost savings 63
2 Auxiliary pumps 30 – 800
Start-up issues
Minimum dam level
requirements
Maximum dam capacity
3
Condenser
pumps and tower
fans
20 – 800
Start-up issues
Minimum dam level
requirements
Maximum flow rate
4 BAC tower fans 20 – 500
Start-up issues
Reduced airflow to underground
Underground air temperature
The chillers are switched off first due to being the largest electricity consumer within the
refrigeration system. To ensure warm water does not mix with the cold water in the storage
dams, any auxiliary pumps not required are switched off. When the chillers are offline, there
is no need to run the condenser pumps and cooling tower fans, as no heat exchange is
required in the chillers. Finally, the BAC fans can be switched off in order to reduce the amount
of uncooled air being sent underground. After Eskom’s evening peak period, the components
are started-up in reverse order.
It is important to remember that a deep-level mine refrigeration system is very large and
complex. Switching off any of the components may result in negative effects within the system.
Simulations must, therefore, be developed to determine the theoretical impact of the proposed
control strategy on a practical system.
3.4.3 Simulating the control strategy
The next step is to simulate the developed control strategy to determine the feasibility of cost
savings and operational impact on the practical system. To achieve this, the simulation
package Process Toolbox (PTB) will be used, as motivated by literature in Chapter 2 [28], [38],
[49]. The data collected in Section 3.2.2 are used to replicate the existing refrigeration system
in PTB. The Eskom TOU tariff structure is incorporated by simulating the system in hourly
intervals for a period of 24 hours.
To verify the accuracy of the simulation, actual historical data can be used and compared to
the simulated results. Verification will require the simulation to match the actual electrical

Chapter 3
Optimising deep-level mine refrigeration control for sustainable cost savings 64
power data and KPIs. Once the simulation has been verified, the proposed load shift control
strategy can be simulated.
Simulating the KPIs and ensuring that they remain below the prescribed limits within the
simulation will confirm the sustainability of the control strategy. The simulated values also
need to adhere to all the constraints identified and described in Section 3.2.4. This will ensure
that the load management strategy remains sustainable over long periods of time.
The following section discusses the validation of the developed strategy on a practical
refrigeration system.
3.4.4 Validating the control strategy
After the new control strategy has been simulated, the next step is to physically test the
strategy. This will validate the results obtained through simulation and ensure credibility of the
developed solution. The following parameters need to be monitored during the test:
refrigeration system power consumption
ambient air temperature
BAC outlet air temperature
water storage temperature
water storage level
underground environmental temperature (various underground levels if possible)
After the tests for the new control strategy have been completed, the relevant test data can
be compared to the results obtained from the simulation. This will serve as an indication of the
simulation’s accuracy and ensure credibility in the developed solution for sustainable cost
savings. Once validation is completed, the proposed strategy can be optimised for maximised
and sustainable performance.
3.5 Optimising the load shift control strategy
To address the problems faced by gold mines and Eskom, stated in Chapter 1, the developed
control strategy requires further optimisation to remain sustainable when implemented. The
optimisation focuses on maximising the cost-saving potential of the control strategy with a
minimal impact on the operational conditions of refrigeration. Optimisation will also ensure that
gold mines benefit from maximised cost savings, Eskom from an increased reserve margin in
peak periods and ESCos from continued DSM involvement. Figure 36 shows the procedure
to be followed during the optimisation of the strategy.

Chapter 3
Optimising deep-level mine refrigeration control for sustainable cost savings 65
Figure 36: Optimising load shift control strategy
When optimising the control strategy, the methodology remains mostly the same as with the
original development. The main difference is altering the system’s configuration and control
while utilising existing infrastructure to keep costs to a minimum. As discussed, the
optimisation should ideally lead to increased cost savings and a reduced impact on the KPIs.
The reduced impact will improve the sustainability of the load shift. The next and final step is
to implement the optimised control strategy.
3.6 Implementing the optimised control strategy
Once the optimised control strategy simulation has been validated, it needs to be
implemented. Implementation will require the identified refrigeration system to be operated on
the optimise control strategy. Most refrigeration systems on deep-level gold mines can be
operated from a mine’s SCADA system, which contributes to the successful execution of the
control strategy. Mine personnel must ensure refrigeration components are switched off in the
correct sequence during Eskom’s evening peak periods. Any configuration changes required
during the load shift must also be implemented by mine personnel.
If the optimised control strategy involves changing the configuration of the refrigeration
system, suitable training needs to be arranged. Mine control room operators will require
training to ensure a thorough understanding of the control strategy. Monitoring the correct
KPIs during and after load shifts should also be clarified to mine personnel. By understanding
the control strategy and its effects on the refrigeration system, mine employees can efficiently
and sustainably implement manual load shifts.
1. Optimise 3. Validate
• Configuration
• Control
• Existing infrastructure
2. Simulate
Simulate optimised strategy • KPIs
• Power usage
4. Implement

Chapter 3
Optimising deep-level mine refrigeration control for sustainable cost savings 66
The sustainability of the project depends on the impact of the load shifting on the KPIs.
Although the verified simulations may indicate that the KPIs are not affected by load
management, they still need to be continuously monitored during and after implementation.
3.7 Conclusion
A methodology for an optimised control strategy to ensure sustainable cost savings on deep-
level mine refrigeration systems was developed as described in this chapter. The methodology
mainly consists of identifying potential scope, characterising the refrigeration system,
developing an optimised control strategy and implementing the optimised control strategy on
a practical system.
The development of the optimised control strategy is based on the revised Eskom DSM model.
The methodology therefore adheres to the objective stated in Chapter 1, which is to develop
a low-cost, simplified and sustainable control strategy for maximised cost savings.
Implementing the methodology will ensure that gold mines benefit from maximised costs
savings, Eskom from an increased reserve margin in peak periods and ESCos from continued
DSM involvement .
The next section will focus on the actual implementation of the proposed methodology on two
case studies.

Chapter 4
Optimising deep-level mine refrigeration control for sustainable cost savings 67
Chapter 4

Chapter 4
Optimising deep-level mine refrigeration control for sustainable cost savings 68
4 Implementing optimised control strategies on mine
refrigeration systems
4.1 Introduction
The methodology developed in Chapter 3 was used to develop optimised control strategies of
two deep-level gold mine refrigeration systems. Due to confidentiality, the respective mines
are further referred to as Mine D and Mine R.
Due to the lower ambient conditions during winter months, most mines use their refrigeration
systems at a reduced capacity during this period. For the purposes of this study, the two case
studies will only focus on the summer operation of the refrigeration systems. This chapter will
also only focus on the results obtained from Mine D. The results of the case study implemented
on Mine R are provided in Appendix C of this document.
4.2 Identifying load reduction potential
4.2.1 Electrical power usage
The electrical power usage profile for Mine D was compiled with three months’ pre-
implementation data. The electrical power profile can be seen in Figure 37.
Figure 37: Refrigeration system power consumption – Mine D
0
1000
2000
3000
4000
5000
6000
7000
8000
00
:00
01
:00
02
:00
03
:00
04
:00
05
:00
06
:00
07
:00
08
:00
09
:00
10
:00
11
:00
12
:00
13
:00
14
:00
15
:00
16
:00
17
:00
18
:00
19
:00
20
:00
21
:00
22
:00
23
:00
Syst
em P
ow
er (
kW)
Time
Refrigeration System Power Consumption - Mine D

Chapter 4
Optimising deep-level mine refrigeration control for sustainable cost savings 69
From the average daily power consumption profile illustrated by Figure 37 it is evident that
scope is present for a load shift on Mine D’s refrigeration system. The evening peak to average
power ratio supports this finding.
Equation 28: Evening peak to average ratio – Mine D
𝑅𝑎𝑡𝑖𝑜 =
∑ 𝐸𝑣𝑒𝑛𝑖𝑛𝑔 𝑃𝑒𝑎𝑘 𝐸𝑛𝑒𝑟𝑔𝑦 𝑈𝑠𝑎𝑔𝑒2
∑ 𝑇𝑜𝑡𝑎𝑙 𝐸𝑛𝑒𝑟𝑔𝑦 𝑈𝑠𝑎𝑔𝑒24
𝑅𝑎𝑡𝑖𝑜 = 7133 [𝑘𝑊]
6922 [𝑘𝑊]
𝑅𝑎𝑡𝑖𝑜 = 1.03 [−]
4.2.2 Listing major components and data collection
Table 7 indicates the major components of Mine D’s refrigeration system. The detailed
component characteristic tables for both mines are available in Appendix A.
Table 7: Major components in refrigeration system – Mine D
Component Quantity
Fridge plants 4
Evaporator pumps 3
Condenser pumps 5
Pre-cooling transfer pumps 2
BAC transfer pumps 4
Pre-cooling fans 4
BAC fans 4
Condenser cooling fans 4
Dams (excluding sump dams) 4
Isolation valves 3

Chapter 4
Optimising deep-level mine refrigeration control for sustainable cost savings 70
4.2.3 Refrigeration system layout and operation
Figure 38 indicates the layout of Mine D’s refrigeration system. Normal operating conditions
consist of running four chillers, three evaporator pumps and three condenser pumps during
the summer months. All the condenser cooling towers and BAC fans run through all seasons
of the year. During winter months Mine D uses their refrigeration system at half capacity, using
only two chillers. The assumption is made that load management will be plausible during
winter if it is proven successful in summer months due to the lower ambient temperatures.
Figure 38: Layout for normal summer operation – Mine D
4.2.4 System constraints
During the investigation the following constraints were identified at Mine D:
Chiller start-up issues
Main # BAC sump dam capacity
Condenser cooling tower fan start-up issues
Underground environmental temperature
Vent # BAC Main # BAC
1
2
3
4
M anifold
To Underground
From PCT
Warm Dam
Cold Dam A
Cold Dam B
PCT Dam
Refrigeration System – Mine D
Running / Open
Off / Closed
Cooling tower
Dam
LEGEND
Fridge plant
Motor
Pump
Hot Water
Warm Water
Cold Water
Valve
CCT 2CCT 1
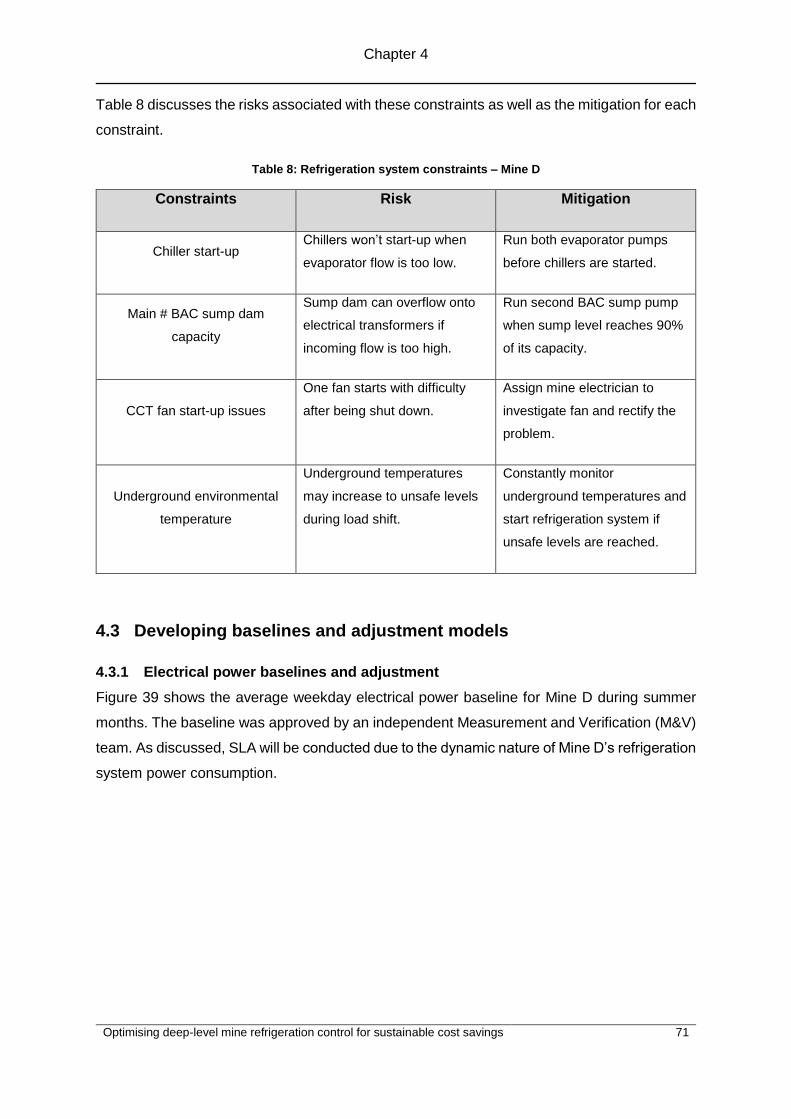
Chapter 4
Optimising deep-level mine refrigeration control for sustainable cost savings 71
Table 8 discusses the risks associated with these constraints as well as the mitigation for each
constraint.
Table 8: Refrigeration system constraints – Mine D
Constraints Risk Mitigation
Chiller start-up Chillers won’t start-up when
evaporator flow is too low.
Run both evaporator pumps
before chillers are started.
Main # BAC sump dam
capacity
Sump dam can overflow onto
electrical transformers if
incoming flow is too high.
Run second BAC sump pump
when sump level reaches 90%
of its capacity.
CCT fan start-up issues
One fan starts with difficulty
after being shut down.
Assign mine electrician to
investigate fan and rectify the
problem.
Underground environmental
temperature
Underground temperatures
may increase to unsafe levels
during load shift.
Constantly monitor
underground temperatures and
start refrigeration system if
unsafe levels are reached.
4.3 Developing baselines and adjustment models
4.3.1 Electrical power baselines and adjustment
Figure 39 shows the average weekday electrical power baseline for Mine D during summer
months. The baseline was approved by an independent Measurement and Verification (M&V)
team. As discussed, SLA will be conducted due to the dynamic nature of Mine D’s refrigeration
system power consumption.

Chapter 4
Optimising deep-level mine refrigeration control for sustainable cost savings 72
Figure 39: Electrical power baseline – Mine D
4.3.2 Operational baselines
Table 9 lists the four most important KPIs and the respective minimum and maximum for daily
average parameters. The identified limits for the KPIs remain constant during summer and
winter months.
Table 9: Operational baseline – Mine D
KPI Minimum Maximum
Cold water storage level 80% 100%
Cold water storage temperature - 5 °C
BAC air temperature sent underground - 12 °C
Underground ambient temperature (dry-bulb) - 30 °C
0
1000
2000
3000
4000
5000
6000
7000
8000
00
:00
01
:00
02
:00
03
:00
04
:00
05
:00
06
:00
07
:00
08
:00
09
:00
10
:00
11
:00
12
:00
13
:00
14
:00
15
:00
16
:00
17
:00
18
:00
19
:00
20
:00
21
:00
22
:00
23
:00
Syst
em P
ow
er (
kW)
Time
Summer Electrical Power Baseline - Mine D

Chapter 4
Optimising deep-level mine refrigeration control for sustainable cost savings 73
4.4 Developing a load shift control strategy
4.4.1 Developing the control strategy
Table 10 shows the developed control strategy for Mine D’s refrigeration system. The
evaporator pumps were kept running during evening peak period to ensure the cold dam level
remained constant.
Table 10: Load shift control strategy – Mine D
Installed
quantity Component
Normal
operating
status
Evening peak
period status
Shutdown
sequence
4 Fridge plants 3 0 1
3 Evaporator pumps 2 2 -
5 Condenser pumps 3 0 2a
4 Condenser cooling tower
fans
4 0 2b
4 BAC transfer pumps* 2 2 -
4 BAC fans 4 0 3
* Controlled automatically on BAC sump dam level
4.4.2 Simulating the control strategy
The simulation for Mine D’s refrigeration system was verified against actual data for a normal
operating day. Detail on the simulation verification for Mine D is available in Appendix B. The
average error between the simulated and actual KPIs was 1.4%. After verification deemed the
simulation accurate, the developed control strategy was simulated. The simulation results in
terms of electric power and KPIs are provided as follows:
Figure 40 shows the proposed power consumption of Mine D’s refrigeration system. The chiller
water outlet temperature was set at 1.1 °C. An average load shift of 4.7 MW was achieved
through the simulation.

Chapter 4
Optimising deep-level mine refrigeration control for sustainable cost savings 74
Figure 40: Simulated power consumption – Mine D
Figure 41 shows that the simulated cold storage dam temperature increased rapidly during
the load shift. This is due to the evaporator pumps running to ensure a constant cold storage
dam level. Warmer water is therefore constantly added to the cold storage dam. Although the
maximum limit for the cold dam temperature was not reached, the increase threatens the
sustainability of the project.
Figure 41: Cold storage dam temperature – Mine D
0
1000
2000
3000
4000
5000
6000
7000
8000
00
:00
01
:00
02
:00
03
:00
04
:00
05
:00
06
:00
07
:00
08
:00
09
:00
10
:00
11
:00
12
:00
13
:00
14
:00
15
:00
16
:00
17
:00
18
:00
19
:00
20
:00
21
:00
22
:00
23
:00
Po
wer
(kW
)
Time
Simulated Power Consumption
Baseline Simulated
0
0.5
1
1.5
2
2.5
3
3.5
4
4.5
5
00
:00
01
:00
02
:00
03
:00
04
:00
05
:00
06
:00
07
:00
08
:00
09
:00
10
:00
11
:00
12
:00
13
:00
14
:00
15
:00
16
:00
17
:00
18
:00
19
:00
20
:00
21
:00
22
:00
23
:00
Tem
per
atu
re (
°C)
Time
Cold Storage Dam Temperature

Chapter 4
Optimising deep-level mine refrigeration control for sustainable cost savings 75
As expected, the BACs’ outlet air temperature increased when the refrigeration system was
shut down during Eskom’s evening peak period. The increase in temperature is illustrated in
Figure 42 and Figure 43 for the Main # BAC and Vent # BAC respectively. The Main # BAC
remained below its maximum limit, while the Vent # BAC’s outlet air temperature increased to
just over 12 °C.
Figure 42: Main # BAC outlet air temperature – Mine D
Figure 43: Vent # BAC outlet air temperature – Mine D
0
2
4
6
8
10
12
00
:00
01
:00
02
:00
03
:00
04
:00
05
:00
06
:00
07
:00
08
:00
09
:00
10
:00
11
:00
12
:00
13
:00
14
:00
15
:00
16
:00
17
:00
18
:00
19
:00
20
:00
21
:00
22
:00
23
:00
Tem
per
atu
re (
°C)
Time
Main # BAC Outlet Air Temperature
0
2
4
6
8
10
12
14
00
:00
01
:00
02
:00
03
:00
04
:00
05
:00
06
:00
07
:00
08
:00
09
:00
10
:00
11
:00
12
:00
13
:00
14
:00
15
:00
16
:00
17
:00
18
:00
19
:00
20
:00
21
:00
22
:00
23
:00
Tem
per
atu
re (
°C)
Time
Vent # BAC Outlet Air Temperature

Chapter 4
Optimising deep-level mine refrigeration control for sustainable cost savings 76
4.4.3 Validating the control strategy
The simulated strategy was implemented on Mine D’s refrigeration system for validation. Table
11 provides an average comparison of the simulation with the actual test data. Figure 44 to
Figure 47 provide the comparison of the power consumption and various KPIs over a 24-hour
profile.
Table 11: Control strategy validation – Mine D
Comparison Simulated Test Percentage Error
Power consumption 7608 [kW] 7659 [kW] 3.65 [%]
Load shift 4707 [kW] 4062 [kW] 13.70 [%]
Cold storage dam
temperature
3.19 [°C] 3.15 [°C] 1.29 [%]
Main # BAC outlet air
temperature
6.95 [°C] 7.26 [°C] 4.34 [%]
Vent # BAC outlet air
temperature
10.11 [°C] 8.60 [°C] 17.75 [%]
As seen in Table 11, the largest errors between the simulated and actual values occurred for
the predicted load shift and Vent # BAC outlet air temperature. The main reason for the load
shift prediction error was that the actual tests involved switching off the refrigeration
components from 18:00, resulting in some components running during the first 15 minutes of
the evening peak period, whereas the simulation instantaneously switches off all components
at the start of the Eskom evening peak period (18:00). This resulted in the large error between
the simulated and actual load shift.
The difference between the actual and simulated Vent # BAC temperatures can be ascribed
to the simulation not employing heat exchange dynamically on piping. A set amount of heat
needed to be added to the simulation to compensate for the sun shining on uninsulated pipes.
The actual Vent # BAC temperature, however, remained below the maximum limit during the
load shift. The Main # BAC is situated much closer to the chiller complex, and subsequently
was not affected by the same issue on the specific test day.

Chapter 4
Optimising deep-level mine refrigeration control for sustainable cost savings 77
The heat added to the pipes was identified during the simulation verification, specific to the
weather conditions of that day. This was not changed during the control strategy simulations
as it could not be accurately predicted. This results in the different errors being experienced
between the simulations as weather conditions differed for each.
The average daily profiles of the comparisons summarised in Table 11 are provided as follows:
Figure 44: Power consumption comparison – Mine D
Figure 45: Cold storage dam temperature comparison – Mine D
0
1000
2000
3000
4000
5000
6000
7000
8000
9000
00
:00
01
:00
02
:00
03
:00
04
:00
05
:00
06
:00
07
:00
08
:00
09
:00
10
:00
11
:00
12
:00
13
:00
14
:00
15
:00
16
:00
17
:00
18
:00
19
:00
20
:00
21
:00
22
:00
23
:00
Po
wer
(kW
)
Time
Power Consumption Comparison
Simulated Actual
0
1
2
3
4
5
6
00
:00
01
:00
02
:00
03
:00
04
:00
05
:00
06
:00
07
:00
08
:00
09
:00
10
:00
11
:00
12
:00
13
:00
14
:00
15
:00
16
:00
17
:00
18
:00
19
:00
20
:00
21
:00
22
:00
23
:00
Tem
per
atu
re (
°C)
Time
Cold Storage Dam Temperature
Simulated Actual

Chapter 4
Optimising deep-level mine refrigeration control for sustainable cost savings 78
Figure 46: Main # BAC outlet air temperature comparison – Mine D
Figure 47: Vent # BAC outlet air temperature comparison – Mine D
The temperature at the 20 level (20L) station was monitored during the test. The 20L station
was chosen as it is the deepest level on the mine and had real-time temperature monitoring
present at the time of testing. Figure 48 shows that the temperature remained constant and
the load shift had almost no impact on the underground temperature.
0
2
4
6
8
10
12
140
0:0
0
01
:00
02
:00
03
:00
04
:00
05
:00
06
:00
07
:00
08
:00
09
:00
10
:00
11
:00
12
:00
13
:00
14
:00
15
:00
16
:00
17
:00
18
:00
19
:00
20
:00
21
:00
22
:00
23
:00
Tem
per
atu
re (
°C)
Time
Main # BAC Outlet Air Temperature
Simulated Actual
0
2
4
6
8
10
12
14
00
:00
01
:00
02
:00
03
:00
04
:00
05
:00
06
:00
07
:00
08
:00
09
:00
10
:00
11
:00
12
:00
13
:00
14
:00
15
:00
16
:00
17
:00
18
:00
19
:00
20
:00
21
:00
22
:00
23
:00
Tem
per
atu
re (
°C)
Time
Vent # BAC Outlet Air Temperature
Simulated Actual

Chapter 4
Optimising deep-level mine refrigeration control for sustainable cost savings 79
Figure 48: 20L Station dry-bulb air temperature – Mine D
The simulation model proved to be accurate within a small degree of error after validation was
completed. The next step was to optimise the control strategy in order to improve cost savings
and reduce the effect thereof on the KPIs. The next section discusses the results obtained
through optimisation.
4.5 Optimising the load shift control strategy
4.5.1 Developing the optimised control strategy
Optimising the control strategy entails controlling the cold storage dam and recirculation valves
(indicated by Figure 49) during the load shift. After all the components have been switched off
at the beginning of the load shift, the cold storage dam valve is closed. At the same time the
recirculation valve is opened. This ensures that warmer water is not introduced into the cold
storage dam directly after the load shift. As soon as the chiller exit water temperature reaches
the temperature of the cold storage dam water after start-up, the storage dam valve is opened
again. The recirculation valve is then set back to automatic control.
The optimisation also involves switching off the evaporator pumps during the Eskom evening
peak periods. Figure 49 illustrates the concept of the optimised control strategy.
0
5
10
15
20
25
300
0:0
0
01
:00
02
:00
03
:00
04
:00
05
:00
06
:00
07
:00
08
:00
09
:00
10
:00
11
:00
12
:00
13
:00
14
:00
15
:00
16
:00
17
:00
18
:00
19
:00
20
:00
21
:00
22
:00
23
:00
Dry
-bu
lb t
emp
erat
ure
(°C
)
Time
20L Station Air Temperature

Chapter 4
Optimising deep-level mine refrigeration control for sustainable cost savings 80
Figure 49: Optimised load shift control strategy – Mine D
Table 12 indicates the optimised control strategy for Mine D’s refrigeration system.
Table 12: Optimised load shift control strategy – Mine D
Installed
quantity Component
Normal
operating
status
Evening peak
period status
Shutdown
sequence
4 Fridge plants 3 0 1
3 Evaporator pumps 2 0 2
5 Condenser pumps 3 0 3a
4 Condenser cooling tower
fans
4 0 3b
4 BAC transfer pumps* 2 2 -
4 BAC fans 4 0 4
* Controlled automatically on BAC sump dam level
Vent # BAC Main # BAC
1
2
3
4
M anifold
To Underground
From PCT
Warm Dam
Cold Dam A
Cold Dam B
PCT Dam
Optimised Control Strategy
Running / Open
Off / Closed
Cooling tower
Dam
LEGEND
Fridge plant
Motor
Pump
Hot Water
Warm Water
Cold Water
Valve
CCT 2CCT 1
1
2
3
4

Chapter 4
Optimising deep-level mine refrigeration control for sustainable cost savings 81
The next step was to simulate the optimised control strategy to determine the theoretical
impact on Mine D’s refrigeration system.
4.5.2 Simulating the optimised control strategy
Figure 50 shows the simulated power consumption for the optimised control strategy on Mine
D’s refrigeration system. The simulation proved that a potential load shift of 7.12 MW is
possible.
Figure 50: Simulated power consumption for the optimised control strategy – Mine D
Figure 51 shows that the cold storage dam temperature does not increase as much with the
optimised strategy. This is due to the cold storage dam being isolated during and shortly after
the load shift. This results in no warm water being introduced to the cold storage dam. The
cold storage dam level also remains above 80% during the peak periods and recovers
immediately after the refrigeration system is started. The optimised control strategy improves
the sustainability of the load shift as it can be implemented daily without affecting the cold
storage dam water temperature or cold water supply to underground operations.
0
1000
2000
3000
4000
5000
6000
7000
8000
9000
10000
00
:00
01
:00
02
:00
03
:00
04
:00
05
:00
06
:00
07
:00
08
:00
09
:00
10
:00
11
:00
12
:00
13
:00
14
:00
15
:00
16
:00
17
:00
18
:00
19
:00
20
:00
21
:00
22
:00
23
:00
Po
wer
(kW
)
Time
Simulated Power Consumption
Baseline Simulated

Chapter 4
Optimising deep-level mine refrigeration control for sustainable cost savings 82
Figure 51: Cold storage dam temperature – Mine D
The outlet air temperature of both the Main- and Vent # BACs increases to approximately
20 °C during the simulated load shift. However, since the fans are also switched off, this
warmer air will not be introduced underground. The outlet temperature for both BACs,
however, recovered within one hour after the load shift. The simulated Main # and Vent # BAC
outlet air temperatures are depicted by Figure 52 and Figure 53, respectively.
Figure 52: Main # BAC outlet air temperature – Mine D
0
0.5
1
1.5
2
2.5
3
3.5
4
4.50
0:0
0
01
:00
02
:00
03
:00
04
:00
05
:00
06
:00
07
:00
08
:00
09
:00
10
:00
11
:00
12
:00
13
:00
14
:00
15
:00
16
:00
17
:00
18
:00
19
:00
20
:00
21
:00
22
:00
23
:00
Tem
per
atu
re (
°C)
Time
Cold Storage Dam Temperature
0
5
10
15
20
25
00
:00
01
:00
02
:00
03
:00
04
:00
05
:00
06
:00
07
:00
08
:00
09
:00
10
:00
11
:00
12
:00
13
:00
14
:00
15
:00
16
:00
17
:00
18
:00
19
:00
20
:00
21
:00
22
:00
23
:00
Tem
per
atu
re (
°C)
Time
Main # BAC Outlet Air Temperature

Chapter 4
Optimising deep-level mine refrigeration control for sustainable cost savings 83
Figure 53: Vent # BAC outlet air temperature – Mine D
The next step was to validate the actual impact of the optimised control strategy prior to
implementation on Mine D’s refrigeration system.
4.5.3 Validating the optimised control strategy
The simulated optimised strategy was implemented on Mine D’s refrigeration system for
validation. Table 13 provides an average comparison of the simulation with the actual test
data. Figure 54 to Figure 57 provide the comparison of the power consumption and various
KPIs over a 24-hour profile.
Table 13: Optimised control strategy validation – Mine D
Comparison Simulated Test Percentage Error
Power consumption 6975 [kW] 7112 [kW] 1.94 [%]
Load shift 7118 [kW] 6989 [kW] 1.82 [%]
Cold storage dam
temperature
3.43 [°C] 3.75 [°C] 8.45 [%]
Main # BAC outlet air
temperature
9.69 [°C] 9.21 [°C] 5.17 [%]
Vent # BAC outlet air
temperature
11.26 [°C] 10.96 [°C] 2.73 [%]
0
5
10
15
20
250
0:0
0
01
:00
02
:00
03
:00
04
:00
05
:00
06
:00
07
:00
08
:00
09
:00
10
:00
11
:00
12
:00
13
:00
14
:00
15
:00
16
:00
17
:00
18
:00
19
:00
20
:00
21
:00
22
:00
23
:00
Tem
per
atu
re (
°C)
Time
Vent # BAC Outlet Air Temperature

Chapter 4
Optimising deep-level mine refrigeration control for sustainable cost savings 84
The shutdown procedure for the refrigeration components was commenced at 17:45 for the
optimised control strategy test. This ensured all components were switched off at the start of
the Eskom evening peak period, resulting in a smaller percentage error for the load shift. The
actual power consumption is higher than the simulated value between 08:00 and 15:00 due
to ambient weather data not being taken on the refrigeration site. The actual refrigeration
system uses more power due to a higher local ambient temperature than used in the
simulation. The deviation between actual and simulated power between 20:00 and 21:00 is
due to the simulation instantly starting up all equipment, whereas in actuality this process
takes approximately 30 minutes.
The difference between the actual and simulated cold storage dam temperature is due to the
simulation recirculating a fixed amount of water, whereas the actual refrigeration system
increases the flow to recover the dam level faster. This results in the actual dam level
recovering faster than simulated. Although actual cold storage dam level data was not
available, it remained above the minimum prescribed level throughout the test day. The error
between the actual and simulated Main # BAC air outlet temperature can be attributed to the
heat exchange not reacting dynamically as explained in section 4.4.3.
The average daily profiles of the comparisons summarised in Table 13 are provided as follows:
Figure 54: Power consumption comparison – Mine D
0
1000
2000
3000
4000
5000
6000
7000
8000
9000
10000
00
:00
01
:00
02
:00
03
:00
04
:00
05
:00
06
:00
07
:00
08
:00
09
:00
10
:00
11
:00
12
:00
13
:00
14
:00
15
:00
16
:00
17
:00
18
:00
19
:00
20
:00
21
:00
22
:00
23
:00
Po
wer
(kW
)
Time
Power Consumption Comparison
Simulated Actual

Chapter 4
Optimising deep-level mine refrigeration control for sustainable cost savings 85
Figure 55: Cold storage dam temperature comparison – Mine D
Figure 56: Main # BAC outlet air temperature comparison – Mine D
0
0.5
1
1.5
2
2.53
3.5
4
4.5
50
0:0
0
01
:00
02
:00
03
:00
04
:00
05
:00
06
:00
07
:00
08
:00
09
:00
10
:00
11
:00
12
:00
13
:00
14
:00
15
:00
16
:00
17
:00
18
:00
19
:00
20
:00
21
:00
22
:00
23
:00
Tem
per
atu
re (
°C)
Time
Cold Storage Dam Temperature
Simulated Actual
0
5
10
15
20
25
00
:00
01
:00
02
:00
03
:00
04
:00
05
:00
06
:00
07
:00
08
:00
09
:00
10
:00
11
:00
12
:00
13
:00
14
:00
15
:00
16
:00
17
:00
18
:00
19
:00
20
:00
21
:00
22
:00
23
:00
Tem
per
atu
re (
°C)
Time
Main # BAC Outlet Air Temperature
Simulated Actual

Chapter 4
Optimising deep-level mine refrigeration control for sustainable cost savings 86
Figure 57: Vent # BAC outlet air temperature comparison – Mine D
The temperature at the 20L station was monitored during the test. As illustrated in Figure 58,
the temperature remained constant and the load shift had almost no impact on the
underground temperature.
Figure 58: 20L Station dry-bulb air temperature– Mine D
0
5
10
15
20
250
0:0
0
01
:00
02
:00
03
:00
04
:00
05
:00
06
:00
07
:00
08
:00
09
:00
10
:00
11
:00
12
:00
13
:00
14
:00
15
:00
16
:00
17
:00
18
:00
19
:00
20
:00
21
:00
22
:00
23
:00
Tem
per
atu
re (
°C)
Time
Vent # BAC Outlet Air Temperature
Simulated Actual
0
5
10
15
20
25
30
00
:00
01
:00
02
:00
03
:00
04
:00
05
:00
06
:00
07
:00
08
:00
09
:00
10
:00
11
:00
12
:00
13
:00
14
:00
15
:00
16
:00
17
:00
18
:00
19
:00
20
:00
21
:00
22
:00
23
:00
Dry
-bu
lb t
emp
erat
ure
(°C
)
Time
20L Station Air Temperature

Chapter 4
Optimising deep-level mine refrigeration control for sustainable cost savings 87
Figure 55 to Figure 58 show that the optimised control strategy had no lasting impact on the
operations of Mine D’s refrigeration system. Although some temperatures increased during
the load shift, they all recovered within four hours after the load shift. Most importantly, the
underground ambient temperatures were not affected by load shifting. This is an indication
that the optimised control strategy can be implemented sustainably over long periods of time.
4.6 Implementing the optimised control strategy
4.6.1 Preamble
Optimised simulations and feasibility tests proved that load management can be sustainably
implemented on deep-level gold mine refrigeration systems. The optimised control strategy
was implemented on the refrigeration system of Mine D. The implementation details in terms
of cost, time and sustainability are highlighted for Case study 1. The implementation details of
Case study 2 are available in Appendix D.
4.6.2 Case Study 1
Mine personnel were trained to implement the optimised control strategy on a daily basis. This
resulted in the optimised strategy to be implemented within one month. Furthermore, only
existing infrastructure was utilised, meaning that no implementation costs were incurred.
Figure 59 illustrates the baseline and post-implementation power profile, averaged over a
period of eight months. The post implementation profile includes summer.
Figure 59: Post implementation power profile – Mine D
0
1000
2000
3000
4000
5000
6000
7000
8000
00
:00
01
:00
02
:00
03
:00
04
:00
05
:00
06
:00
07
:00
08
:00
09
:00
10
:00
11
:00
12
:00
13
:00
14
:00
15
:00
16
:00
17
:00
18
:00
19
:00
20
:00
21
:00
22
:00
23
:00
Po
wer
(kW
)
Time
Post Implimentation Electrical Power Profile
Post implementation Baseline

Chapter 4
Optimising deep-level mine refrigeration control for sustainable cost savings 88
The presence of the evening peak period load shift indicates the project was implemented
sustainably. Cost savings up to date realised to R 1 170 000. Cost savings based on the
evening peak period load shift is expected to result in an approximate annual financial saving
of R 1 755 000. The mine started implementing a morning load shift on the refrigeration system
after the implementation of the evening load shift. The cost savings amounted to R 3 million
annually when including the morning load shift. It has not been included in this discussion as
it falls outside the scope of this study.
Table 14 compares the predicted and achieved (post-implementation) summer evening peak
period load shift and annual cost savings. The predicted average summer load shift correlates
closely to the achieved reduction with an average error of approximately 2%. The average
annual cost savings realised by the evening peak period load shift falls within an approximate
error of 1%.
Table 14: Implementation validation – Mine D
Predicted summer evening peak load
shift
Achieved summer evening peak load
shift
7.12 MW 7.28 MW
Predicted annual cost savings Achieved annual cost savings*
R 1 770 000 R 1 755 0007
*Based on eight months post-implementation data
4.7 Conclusion
Simulations were used to develop optimised control strategies for the refrigeration systems of
two deep-level gold mines. The simulations indicated that load management techniques could
be implemented without affecting the operational parameters of the refrigeration systems. The
predicted results of the simulations were validated in the form of practical tests prior to
permanent implementation. The validation proved an average error of 2% between the
simulated and actual results.
The optimised control strategies were implemented on the respective refrigeration systems of
Mine D and Mine R. The control strategies were easily incorporated within the systems at a
7 Savings resulting from Eskom evening peak period load shift only, excludes morning load shift savings

Chapter 4
Optimising deep-level mine refrigeration control for sustainable cost savings 89
low cost and short implementation period. Furthermore, the optimised control strategies
proved to have a sustainable load shift over a consecutive eight month period for both
refrigeration systems (still in progress by the time of the study). The sustainability was
confirmed by validating the actual summer load shift to the predicted summer load shift after
eight months. The average error was confirmed at 2% for Mine D and 3% for Mine R.
Optimised control strategies proved to have a significant impact on the sustainability of load
management initiatives on deep-level mine refrigeration systems. The sustainability ultimately
contributes to continuous cost savings for the gold-mining industry, a stable reserve margin
for Eskom and the assurance for ESCos to perform under the new Eskom DSM model.

Chapter 5
Optimising deep-level mine refrigeration control for sustainable cost savings 90
Chapter 5

Chapter 5
Optimising deep-level mine refrigeration control for sustainable cost savings 91
5 Conclusion and recommendations
5.1 Summary
The productivity and profitability of the South African gold-mining industry are influenced by
numerous challenges. One of the challenges is the cost of electricity due to the gold mining
industry’s intensive use and higher-than-inflation increases. This challenge, however,
presents large potential for gold mines to reduce operating costs in the form of load
management initiatives. On the other hand, not only the mines benefit from these initiatives,
but it also enables Eskom to sustain its electricity reserve margin during peak periods.
Refrigeration systems were highlighted as the largest electricity consumers on South African
deep-level gold mines. Due to its intensive electricity usage, these systems offer large
potential for cost and load reduction through the implementation of load management
initiatives. For this reason, a large variety of load management projects have been
implemented on these particular systems in the past by ESCos as part of the Eskom DSM
model.
Historically, implemented load management initiatives were, however, not sustainable in terms
of load shifting and financial cost savings for the mines. This is mainly due to the old DSM
model only requiring ESCos to maintain targeted savings for a period of three months after
implementation. Eskom, however, revised the DSM model to address the issue and
challenged ESCos to implement low budget projects that would be sustainable for at least 36
months. This presented the need for ESCos to develop sustainable load management
techniques that will be cost effective and easy to implement.
This study therefore focused on developing and simulating optimised control strategies for
deep-level mine refrigeration systems. The development mainly focused on low-cost
strategies that would be easy to implement and would ensure maximised cost savings over at
least 36 months. It was also important to develop the optimised strategies in such a manner
that it would not influence the safety regulations of deep-level gold mines in terms of
acceptable underground temperatures.
Control strategies were developed for the refrigeration systems of two South African gold
mines. The strategies were simulated to determine the theoretical impact of the control
strategies on the respective refrigeration systems. The simulations were verified with actual
data of the refrigeration systems to ensure credibility of the developed control strategies’
potential impact. The potential results of the simulated strategies, in terms of load shift

Chapter 5
Optimising deep-level mine refrigeration control for sustainable cost savings 92
achieved and operational impact, were validated with actual tests. Table 15 shows a summary
of the validation results.
Table 15: Control strategies validation results
Comparison
Case study 1 Case study 2
Simulated Test Percentage
Error Simulated Test
Percentage
Error
Average power
consumption 7608 [kW]
7659
[kW] 3.65 [%] 2264 [kW]
2182
[kW] 3.59 [%]
Average
summer load
shift
4707 [kW] 4062
[kW] 13.70 [%] 1780 [kW]
1700
[kW] 4.47 [%]
Cold storage
dam
temperature
increase over
evening peak
period
0.94 [°C] 1 [°C] 6 [%] 1.53 [°C] 1.58
[°C] 3.3 [%]
The tests concluded low cost and fast implementation for the developed control strategies.
The issue of sustainability was, however, not addressed through the sole development of the
control strategies. The simulation and tests proved that the cold storage dam temperature for
both Mine D and Mine R increased during the load shift. Implementing these strategies on a
daily basis could lead to a systematic increase in the average cold storage dam temperatures.
This increase in temperature would have compromised the sustainability of the load shift.
To ensure sustainability of the load management initiatives, optimisation of the control
strategies was required. The optimisation consisted of altering the configuration and control of
the refrigeration systems using only existing infrastructure. Through control optimisation, the
cold storage water could be isolated from warmer water. This would result in smaller increases
of the cold storage dam temperatures over the course of each load shift. The optimised control
strategies were also simulated and validated with actual tests. Table 16 shows the results of
the validation.

Chapter 5
Optimising deep-level mine refrigeration control for sustainable cost savings 93
Table 16: Optimised control strategies validation results
Comparison
Case study 1 Case study 2
Simulated Test Percentage
Error Simulated Test
Percentage
Error
Average power
consumption 6975 [kW]
7112
[kW] 1.94 [%] 2258 [kW]
2217
[kW] 1.80 [%]
Average
summer load
shift
7118 [kW] 6989
[kW] 1.82 [%] 1939 [kW]
1938
[kW] 0.05 [%]
Cold storage
dam
temperature
increase over
evening peak
period
0.11 [°C] 0.15
[°C] 27 [%]8 0.9 [°C]
0.5
[°C] 44.4 [%]7
The optimised control strategies were implemented on the refrigeration systems of Mine D
and Mine R. By the time of this study, load management proved to be sustainable for a
consecutive period of eight months at Mine D and nine months at Mine R. An average evening
peak period load reduction of 7.28 MW (Mine D) and 2.00 MW (Mine R) was measured at the
respective mines. This accumulates to financial cost savings of R 1.17 million (Mine D) and
R 143 000 (Mine R) over the respective measuring periods. Assuming sustainability over a
period of 36 months, a total financial saving of approximately R 6 million is expected. The
expected annual cost savings is R 1.76 million for Mine D and R 215 000 for Mine R.
Optimised control strategies further resulted in low cost and fast implementation of load
management initiatives. There was also minimal effect on the cold storage dam temperatures,
which ensured sustainability of load shifting. More components were also switched off in each
refrigeration system to facilitate the isolation of cold water from warm water sources.
8 Note the large percentage is ascribed to the differences between very small values.

Chapter 5
Optimising deep-level mine refrigeration control for sustainable cost savings 94
The study concludes that low-cost, easy to implement and sustainable load management
initiatives can be implemented on deep-level gold mine refrigeration systems through
optimised control strategies. Gold mines will benefit from the cost savings to improve profit
margins while Eskom will improve their supply reserve margin. From an ESCo’s point of view,
by sustainably implementing these initiatives, continued involvement in DSM is secured.
5.2 Recommendations for future work
Due to the successful implementation of the optimised control strategies on mine refrigeration
systems, the feasibility of expanding this methodology to other electricity intensive systems of
deep-level mines should be investigated. The compressed air and dewatering systems of gold
mines are ideal targets as they consume a large portion of the total electricity usage on a gold
mine.
It is also recommended to expand the use of optimised control strategies on energy efficiency
initiatives. During this study the optimised control strategies were implemented to maximise
and sustain the cost savings of load management initiatives. Utilising optimised control
strategies to realise sustainable energy efficiency would result in larger cost savings for clients
and contribute to sustaining the Eskom reserve margin over a 24-hour period.
This study only focused on optimising refrigeration control strategies during summer months.
Although load management was implemented during winter months on Mine D, optimising and
simulating a winter control strategy should be investigated as it may lead to increased cost
savings and improved operation. Implementing load management during the morning peak
periods should also be investigated to further increase the cost savings potential.
Load management sustainability was proven for up to nine months for this study, which is
already much longer than initiatives implemented under the old Eskom DSM model. The aim
is, however, to maintain the performance of the load management initiatives for a minimum
period of 36 months. Since sustainability was one of the main objectives of this study, it is
recommended that the load management initiatives’ performances be tracked for the
remainder of the period.
By optimising the control strategies of implementing load management initiatives on the two
identified case studies, the overall impact on operational parameters were reduced. This
reduced the comeback load required to recover the refrigeration system to normal operating
conditions after load shifts. This may be an indication that energy savings are present due to
overall improved refrigeration system control. This should, however, be investigated.

Chapter 5
Optimising deep-level mine refrigeration control for sustainable cost savings 95
Due to similar operations to gold mines, the possibility of implementing optimised control
strategies for cost savings on platinum mine refrigeration systems can be investigated.
Optimised control can even be expanded to any other industry using large refrigeration
systems within their operations.

Reference list
Optimising deep-level mine refrigeration control for sustainable cost savings 96
REFERENCE LIST
[1] “Chamber of mines-Gold,” 2015. [Online]. Available:
http://www.chamberofmines.org.za/sa-mining/gold. [Accessed: 05-Mar-2016].
[2] K. Crowley, “South African Gold on the Brink With Half of Mines Losing Money,”
Bloomberg Business, 2015. [Online]. Available:
http://www.bloomberg.com/news/articles/2015-09-08/south-africa-gold-industry-fades-
as-margin-squeeze-erodes-output. [Accessed: 07-Mar-2016].
[3] M. A. McCrae, “The stunning collapse of gold production in South Africa,” 2015.
[Online]. Available: http://www.mining.com/the-stunning-collapse-of-gold-production-
in-south-africa/. [Accessed: 07-Mar-2016].
[4] J. I. G. Bredenkamp, M. J. Mathews, and J. C. Vosloo, “An integrated energy
management strategy for the deep-level gold mining industry,” in Conference on the
Industrial and Commercial Use of Energy, ICUE, 2016, no. August, pp. 133–138.
[5] “SOUTH AFRICAN GOLD , TODAY AND TOMORROW.” [Online]. Available:
http://www.thisisgold.co.za/facts-and-figures/fact-sheets. [Accessed: 08-Mar-2016].
[6] “MINING AND MINERAL PROCESSING Remains Vital for African Economy.pdf,”
Eng. Min. J., vol. 205, no. 5, pp. 21–30.
[7] “Company Information,” Eskom company information. [Online]. Available:
http://www.eskom.co.za/OurCompany/CompanyInformation/Pages/Company_Informa
tion_1.aspx. [Accessed: 10-Mar-2016].
[8] K. Crowley, “Eskom Declares Power Emergency, Asks South Africa to Cut Use,”
Bloomberg Business, 2014. [Online]. Available:
http://www.bloomberg.com/news/articles/2014-02-20/eskom-declares-power-
emergency-and-asks-south-africa-to-cut-use. [Accessed: 22-Mar-2016].
[9] P. Cohen, Mike; Burkhardt, “How Eskom lost its lustre,” Fin24, 2015. [Online].
Available: http://www.fin24.com/Economy/Eskom/How-Eskom-lost-its-lustre-
20150608. [Accessed: 22-Mar-2016].
[10] Eskom, “Eskom fact sheets 2015,” 2015. [Online]. Available:
http://www.eskom.co.za/IR2015/Documents/Eskom_fact_sheets_2015.pdf.

Reference list
Optimising deep-level mine refrigeration control for sustainable cost savings 97
[11] Eskom DSM, “Towards an energy efficient mining sector,” The Energy Efficiency
series, 2010. [Online]. Available:
http://www.eskom.co.za/sites/idm/Documents/121040ESKD_Mining_Brochure_paths.
pdf. [Accessed: 12-Mar-2016].
[12] H. Trollip, A. Butler, J. Burton, T. Caetano, and C. Godinho, “Energy security in South
Africa,” Mitig. Action Plans Scenar. i, no. 17, p. 45, 2014.
[13] D. de Vos, “Eskom’s dim understanding of the market,” Mail & Guardian, 2013.
[Online]. Available: http://mg.co.za/article/2013-05-03-00-eskoms-dim-understanding-
of-the-market. [Accessed: 18-Apr-2016].
[14] S. Mantshantsha, “Eskom to decommission generating units,” Financial mail, 2012.
[Online]. Available: http://www.financialmail.co.za/economy/2012/12/12/eskom-to-
decommission-generating-units. [Accessed: 22-Mar-2016].
[15] RSA Goverment, “Mine Health And Safety act 1996,” no. 967, 1996.
[16] L. F. van der Zee and R. Pelzer, “Modelling of electricity cost risks and opportunities
in the gold mining industry,” Dissertation submitted in partial fulfillment of the
requirements for the degree of PHILOSOPHIAE DOCTOR of ENGINEERING,
Potchefstroom Campus of the North West University, 2014.
[17] “8 slides about Eskom you should see,” Fin24. [Online]. Available:
http://www.fin24.com/Economy/Eskom/8-slides-about-eskom-you-should-see-
20151116. [Accessed: 18-Apr-2016].
[18] Eskom, “Schedule of standard prices for Eskom tariffs,” 2015. [Online]. Available:
http://www.eskom.co.za/CustomerCare/TariffsAndCharges/WhatsNew/Documents/Sc
heduleStdPrices2015_16_27Feb2015.pdf. [Accessed: 16-Apr-2016].
[19] “Eskom Demand Management Funding Models,” Eskom IDM Business Unit, 2011.
[Online]. Available: http://www.ameu.co.za/Portals/16/Documents/EEDSM and
Renewable Energy/Eskom IDM funding options - 2011 12 13.pdf. [Accessed: 18-Apr-
2016].
[20] “Funding through ESCo Model,” Eskom IDM Business Unit. [Online]. Available:
http://www.eskom.co.za/sites/idm/Business/Pages/Funding.aspx. [Accessed: 19-Apr-
2016].

Reference list
Optimising deep-level mine refrigeration control for sustainable cost savings 98
[21] D. Stephenson, “Distibution of water in deep gold mines in South Africa,” Int. J. Mine
Water, vol. II, no. 2, pp. 21–30, 1983.
[22] M. Karsten and L. Mackay, “Underground environmental challenges in deep platinum
mining and some suggested solutions,” South. African Inst. Min. Metall., pp. 177–192,
2012.
[23] R. E. Sonntag, C. Borgnakke, and G. J. Van Wylen, Fundamentals of
Thermodynamics, Sixth edit. Wiley, 2002.
[24] “Refrigeration Compressors and Air Conditioning Compressors Information.” [Online].
Available:
http://www.globalspec.com/learnmore/building_construction/hvac/ventilation/refrigerati
on_compressors_air_conditioning_compressors. [Accessed: 04-Sep-2016].
[25] A. J. Schutte, R. Pelzer, and E. H. Mathews, “Improving cooling system efficiency with
pre-cooling,” 9th Ind. Commer. Use Energy Conf. Conf., vol. 9, pp. 1–4, 2012.
[26] G. E. du Plessis, E. H. Mathews, and J. C. Vosloo, “A variable water flow energy
efficiency strategy for mine cooling systems,” in Proc. of the 10th Industrial and
Commercial Use of Energy (ICUE) Conference, Cape Town, 2013.
[27] A. J. Schutte, R. Pelzer, and M. Kleingeld, “DEMAND-SIDE ENERGY
MANAGEMENT OF A CASCADE MINE SURFACE REFRIGERATION SYSTEM,” in
Proc. of the 5th Industrial and Commercial Use of Energy (ICUE) Conference, Cape
Town, 2008.
[28] K. J. Oberholzer and M. Kleingeld, “Reconfiguring mine cooling auxiliaries for optimal
operation,” Dissertation submitted in fulfillment of the requirements for the degree of
MASTER of ENGINEERING, Potchefstroom Campus of the North West University,
2016.
[29] Y. A. Cengel, Heat and Mass Transfer: A Practical Approach. New York, NY:
McGraw-Hill, 2006.
[30] “Adaptive Frequency Drive for chillers.” Ingersoll Rand, p. 2, 2011.
[31] J. Engles and M. Kleingeld, “Cost effective control of a platinum mine cooling system
using combined DSM strategies,” Dissertation submitted in fulfillment of the
requirements for the degree of MASTER of ENGINEERING, Potchefstroom Campus

Reference list
Optimising deep-level mine refrigeration control for sustainable cost savings 99
of the North West University, 2015.
[32] J. Van der bijl and M. Kleingeld, “Sustainable DSM on Deep Mine Refrigeration
Systems - A Novel Approach,” Dissertation submitted in partial fulfillment of the
requirements for the degree of PHILOSOPHIAE DOCTOR of ENGINEERING,
Potchefstroom Campus of the North West University, 2007.
[33] G. E. Du Plessis, L. Liebenberg, and E. H. Mathews, “The use of variable speed
drives for cost-effective energy savings in South African mine cooling systems,” Appl.
Energy, vol. 111, pp. 16–27.
[34] A. J. Schutte and M. Kleingeld, “An intergrated energy-efficiency strategy for deep-
mine ventilation and refrigeration,” Dissertation submitted in partial fulfillment of the
requirements for the degree of PHILOSOPHIAE DOCTOR of ENGINEERING,
Potchefstroom Campus of the North West University, 2013.
[35] F. M. White, Fluid Mechanics, Sixth Edit. Boston: McGraw-Hill, 2008.
[36] J. Van der Walt and E. M. De Kock, “Developments in the engineering of refrigeration
installations for cooling mines,” Int. J. Refrig., vol. 7, no. 1, pp. 27–40, 1984.
[37] A. J. Schutte and M. Kleingeld, “Demand side managment of a cascade mine surface
refridgeration system,” Dissertation submitted in fulfillment of the requirements for the
degree of MASTER of ENGINEERING, Potchefstroom Campus of the North West
University, 2007.
[38] J. Vermeulen and J. F. van Rensburg, “Cost effective management strategies for
platinum mine cooling systems,” Dissertation submitted in fulfillment of the
requirements for the degree of MASTER of ENGINEERING, Potchefstroom Campus
of the North West University, 2015.
[39] M. den Boef, “Integrated thermal simulation of underground mobile cooling systems,”
Dissertation submitted in fulfillment of the requirements for the degree of MASTER of
ENGINEERING, Potchefstroom Campus of the North West University, 2001.
[40] D. C. Arndt, “Integrated dynamic simulation of large thermal systems,” Dissertation
submitted in fulfillment of the requirements for the degree of PHILOSOPHIAE
DOCTOR of ENGINEERING, University of Pretoria, 2000.
[41] P. G. Rousseau and J. H. R. Moodie, “Computer program for energy policy support

Reference list
Optimising deep-level mine refrigeration control for sustainable cost savings 100
and energy savings in buildings: Appendix to the final report,” 1995.
[42] D. F. Y. B.R. Munson T.H. Okiishi, Fundamentals of Fluid Mechanics fith edition.
United States of America: Wiley, 2006.
[43] A. T. Sayers, Hydraulic and compressible flow turbomachines. London: McGraw-Hill,
1990.
[44] R. Els and E. H. Mathews, “POTENTIAL FOR LOAD SHIFTING VENTILATION AND
COOLING SYSTEMS,” Dissertation submitted in fulfillment of the requirements for the
degree of MASTER of ENGINEERING, University of Pretoria, 2000.
[45] T. L. Bergmann, F. P. Incropera, D. P. DeWitt, and A. S. Lavine, Fundementals of
heat and mass transfer. John Wiley & Sons, 2011.
[46] C. Swart, “Optimising the operations of underground mine refrigeration plants and
ventilation fans for minimum electricity cost,” Thesis, North-West University, Pretoria,
2003.
[47] W. M. Marx, F. H. Von Glehn, S. J. Bluhm, and M. Biffi, “VUMA - A mine ventilation
and cooling network simulation tool,” in International Mine Ventilation Congress, 2001.
[48] D. Arndt, PROCESS TOOLBOX THERMAL HYDRAULIC SIMULATION FLOW
SOLVER - USER MANUAL. 2015.
[49] P. Mare, J. H. Marais, and J. Van Rensburg, “Improved implementation strategies to
sustain energy saving measures on mine cooling systems,” in Proceedings of the
Conference on the Industrial and Commercial Use of Energy, ICUE, 2015, vol. 2015–
Sep, pp. 102–109.
[50] W. Booysen and M. Kleingeld, “Measurement and verification of industrial DSM
projects,” Dissertation submitted in partial fulfillment of the requirements for the
degree of PHILOSOPHIAE DOCTOR of ENGINEERING, Potchefstroom Campus of
the North West University, 2014.

Appendix A
Optimising deep-level mine refrigeration control for sustainable cost savings 101
Appendix A: Simulation overview & inputs
The values contained in Table 17 and Table 18 indicate the design inputs for all refrigeration
system machinery required for the simulation and its verification. Actual simulated values may
differ due to operational changes in the refrigeration system and changes in efficiency. This is
due to the systems not necessarily operating at the same service level as when they were first
installed. Figure 60 and Figure 61 show the refrigeration layouts within PTB for each case
study.
Table 17: Simulation inputs – Mine D
Component Required Data
Fridge Plants (Chillers)
Compressor motor installed capacity 1850 [kW]
Evaporator inlet temperature 12 [°C]
Evaporator outlet temperature 5 [°C]
Condenser inlet temperature 22 [°C]
Condenser outlet temperature 30 [°C]
Evaporator flow rate 450 [l/s]
Condenser flow rate 650 [l/s]
Pumps
Evaporator pump motor installed capacity 650 [kW]
Evaporator pump flow 450 [l/s]
Evaporator pumping head 5 [m]
Condenser pump motor installed capacity 400 [kW]
Condenser pump flow 650 [l/s]
Condenser pumping head 5 [m]
BAC pump motor installed capacity 150 [kW]
BAC pump flow 200 [l/s]

Appendix A
Optimising deep-level mine refrigeration control for sustainable cost savings 102
Component Required Data
BAC pumping head 10 [m]
Pre-cooling pump motor installed capacity 100 [kW]
Pre-cooling pump flow 350 [l/s]
Pre-cooling pumping head 5 [m]
Cooling towers and
BACs
BAC water inlet temperature 5 [°C]
BAC water outlet temperature 11 [°C]
BAC air inlet temperature Ambient
BAC air outlet temperature 9 [°C]
BAC water flow rate 200 [l/s]
BAC airflow rate 200 [l/s]
CCT water inlet temperature 30 [°C]
CCT water outlet temperature 22 [°C]
CCT air inlet temperature Ambient
CCT air outlet temperature N/A
CCT water flow rate 650 [l/s]
CCT airflow rate 390 [kg/s]
PCT water inlet temperature 28 [°C]
PCT water outlet temperature 20 [°C]
PCT air inlet temperature Ambient
PCT air outlet temperature N/A
PCT water flow rate 350 [l/s]

Appendix A
Optimising deep-level mine refrigeration control for sustainable cost savings 103
Component Required Data
PCT airflow rate 350 [kg/s]
Fans
BAC fan motor power 150 [kW]
BAC fan airflow rate 100 [kg/s]
CCT fan motor power 150 [kW]
CCT fan airflow rate 195 [kg/s]
PCT fan motor power 100 [kW]
PCT fan airflow rate 350 [kg/s]
Dams
Main BAC sump dam water temperature 11 [°C]
Main BAC sump dam volume 624 [m3]
Main BAC sump dam operating levels 40% ~ 90%
Vent BAC sump dam water temperature 11 [°C]
Vent BAC sump dam volume 924 [m3]
Vent BAC sump dam operating levels 40% ~ 90%
CCT dam water temperature 22 [°C]
CCT dam volume 1755 [m3]
CCT dam operating levels 85%
PCT dam water temperature 20 [°C]
PCT dam volume 1755 [m3]
PCT dam operating levels 85%
Cold dam water temperature 5 [°C]
Cold dam volume 2500 [m3] x2

Appendix A
Optimising deep-level mine refrigeration control for sustainable cost savings 104
Component Required Data
Cold dam operating levels 90%
Warm dam water temperature 12 [°C]
Warm dam volume 2500 [m3]
Warm dam operating levels 85%
The following valves are used within the system:
Automated Vent # BAC isolation/throttling valve
Automated cold dam isolation/throttling valve
Automated recycling valve at fridge plant exit towards evaporator inlet

Appendix A
Optimising deep-level mine refrigeration control for sustainable cost savings 105
Figure 60: Mine D simulation layout

Appendix A
Optimising deep-level mine refrigeration control for sustainable cost savings 106
Table 18: Simulation inputs – Mine R
Component Required Data
Fridge Plants (Chillers)
Compressor motor installed capacity 1500 [kW]
Evaporator inlet temperature 9 [°C]
Evaporator outlet temperature 4 [°C]
Condenser inlet temperature 22 [°C]
Condenser outlet temperature 26 [°C]
Evaporator flow rate 265 [l/s]
Condenser flow rate 380 [l/s]
Pumps
Evaporator pump motor installed capacity 75 [kW]
Evaporator pump flow 265 [l/s]
Evaporator pumping head 5 [m]
Condenser pump motor installed capacity 90 [kW]
Condenser pump flow 380 [l/s]
Condenser pumping head 5 [m]
BAC pump motor installed capacity 110 [kW]
BAC pump flow 400 [l/s]
BAC pumping head 10 [m]
Pre-cooling pump motor installed capacity 175 [kW]
Pre-cooling pump flow 210 [l/s]
Pre-cooling pumping head 5 [m]
BAC water inlet temperature 5 [°C]
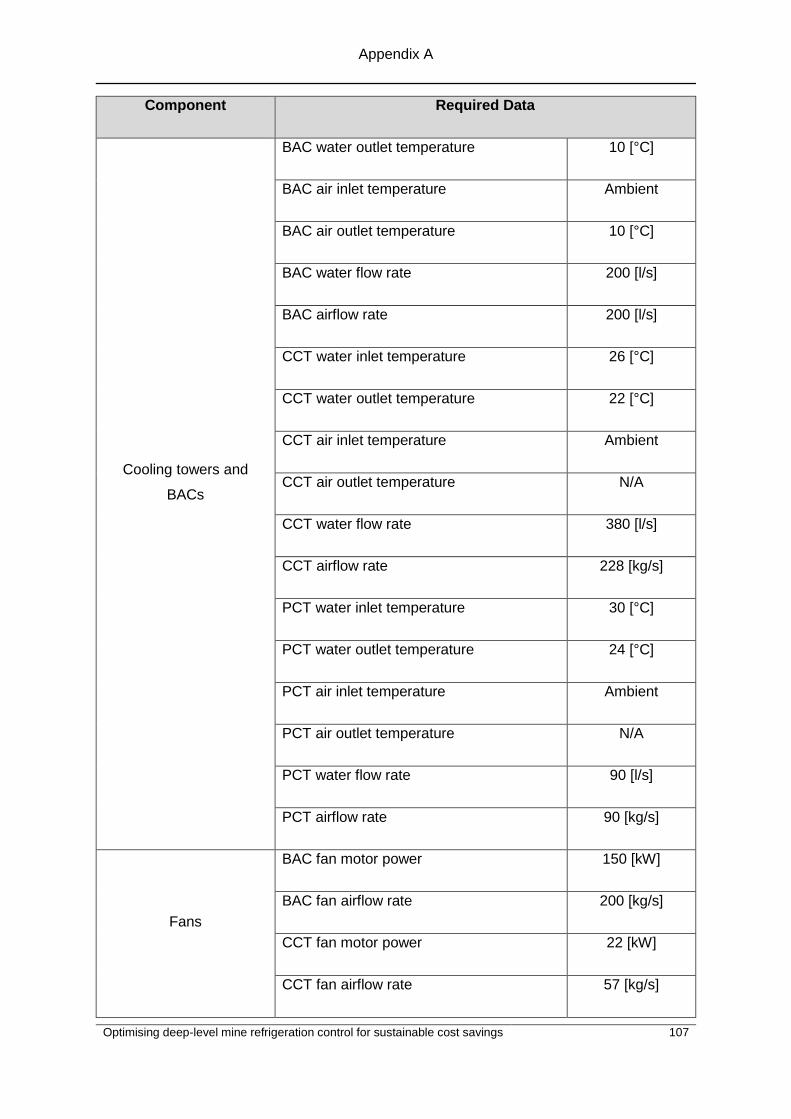
Appendix A
Optimising deep-level mine refrigeration control for sustainable cost savings 107
Component Required Data
Cooling towers and
BACs
BAC water outlet temperature 10 [°C]
BAC air inlet temperature Ambient
BAC air outlet temperature 10 [°C]
BAC water flow rate 200 [l/s]
BAC airflow rate 200 [l/s]
CCT water inlet temperature 26 [°C]
CCT water outlet temperature 22 [°C]
CCT air inlet temperature Ambient
CCT air outlet temperature N/A
CCT water flow rate 380 [l/s]
CCT airflow rate 228 [kg/s]
PCT water inlet temperature 30 [°C]
PCT water outlet temperature 24 [°C]
PCT air inlet temperature Ambient
PCT air outlet temperature N/A
PCT water flow rate 90 [l/s]
PCT airflow rate 90 [kg/s]
Fans
BAC fan motor power 150 [kW]
BAC fan airflow rate 200 [kg/s]
CCT fan motor power 22 [kW]
CCT fan airflow rate 57 [kg/s]

Appendix A
Optimising deep-level mine refrigeration control for sustainable cost savings 108
Component Required Data
PCT fan motor power 45 [kW]
PCT fan airflow rate 90 [kg/s]
Dams
BAC dam water temperature 13 [°C]
BAC dam volume 5000 [m3]
BAC dam operating levels 60% ~ 75%
CCT sump dam water temperature 22 [°C]
CCT sump dam volume 80 [m3]
CCT sump dam operating levels 60%
PCT dam water temperature 24 [°C]
PCT dam volume 7500 [m3]
PCT dam operating levels 85%
Cold dam water temperature 5 [°C]
Cold dam volume 2000 [m3]
Cold dam operating levels 90%
The following valves are used within the system:
Manual shut-off valve at cold dam exit
Automated recycling valve at BAC exit towards evaporator inlet
Automated recycling valve at cold dam exit towards evaporator inlet

Appendix A
Optimising deep-level mine refrigeration control for sustainable cost savings 109
Figure 61: Mine R simulation layout

Appendix B
Optimising deep-level mine refrigeration control for sustainable cost savings 110
Appendix B: Case Study 1 verification
Mine D’s refrigeration system’s normal operation was simulated and verified against the actual
data. Table 19 below compares the daily average value of the power and various KPIs
between the actual data and simulated results. The 24 hour profiles are also compared below
for each of the variables listed in Table 19.
Table 19: Simulation verification – Mine D
Comparison Simulated Actual Percentage Error
Power consumption 7608 [kW] 7659 [kW] 0.66 [%]
Cold dam level* 90.43 [%] - -
Cold dam temperature 2.91 [°C] 2.89 [°C] 0.71 [%]
Main BAC outlet air
temperature
8.51 [°C] 8.75 [°C] 0.97 [%]
Vent BAC outlet air
temperature
10.58 [°C] 10.25 [°C] 3.25 [%]
*Actual data not available
Figure 62: Power consumption verification – Mine D
0
1000
2000
3000
4000
5000
6000
7000
8000
9000
00
:00
01
:00
02
:00
03
:00
04
:00
05
:00
06
:00
07
:00
08
:00
09
:00
10
:00
11
:00
12
:00
13
:00
14
:00
15
:00
16
:00
17
:00
18
:00
19
:00
20
:00
21
:00
22
:00
23
:00
Po
wer
(kW
)
Time
Power Consumption
Simulated Actual

Appendix B
Optimising deep-level mine refrigeration control for sustainable cost savings 111
Figure 63: Cold dam level verification – Mine D
Figure 64: Cold dam temperature verification – Mine D
0
10
20
30
40
5060
70
80
90
100
00
:00
01
:00
02
:00
03
:00
04
:00
05
:00
06
:00
07
:00
08
:00
09
:00
10
:00
11
:00
12
:00
13
:00
14
:00
15
:00
16
:00
17
:00
18
:00
19
:00
20
:00
21
:00
22
:00
23
:00
Tem
per
atu
re (
°C)
Time
Cold Dam Level*
Simulated
0
0.5
1
1.52
2.5
3
3.5
4
4.5
5
00
:00
01
:00
02
:00
03
:00
04
:00
05
:00
06
:00
07
:00
08
:00
09
:00
10
:00
11
:00
12
:00
13
:00
14
:00
15
:00
16
:00
17
:00
18
:00
19
:00
20
:00
21
:00
22
:00
23
:00
Tem
per
atu
re (
°C)
Time
Cold Dam Temperature
Simulated Actual

Appendix B
Optimising deep-level mine refrigeration control for sustainable cost savings 112
Figure 65: Main BAC outlet air temperature verification – Mine D
Figure 66: Vent BAC outlet air temperature verification – Mine D
0
2
4
6
8
10
120
0:0
0
01
:00
02
:00
03
:00
04
:00
05
:00
06
:00
07
:00
08
:00
09
:00
10
:00
11
:00
12
:00
13
:00
14
:00
15
:00
16
:00
17
:00
18
:00
19
:00
20
:00
21
:00
22
:00
23
:00
Tem
per
atu
re (
°C)
Time
Main # BAC Outlet Air Temperature
Simulated Actual
0
2
4
6
8
10
12
14
16
00
:00
01
:00
02
:00
03
:00
04
:00
05
:00
06
:00
07
:00
08
:00
09
:00
10
:00
11
:00
12
:00
13
:00
14
:00
15
:00
16
:00
17
:00
18
:00
19
:00
20
:00
21
:00
22
:00
23
:00
Tem
per
atu
re (
°C)
Time
Vent # BAC Outlet Air Temperature
Simulated Actual

Appendix C
Optimising deep-level mine refrigeration control for sustainable cost savings 113
Appendix C: Case Study 2 development and
optimisation
1.1 Identifying load reduction potential
1.1.1 Electrical power usage
The electrical power usage profile for Mine R was compiled with three months’ pre-
implementation data. The electrical power profile can be seen in Figure 67.
Figure 67: Refrigeration system power consumption – Mine R
From the average daily power consumption profile illustrated by Figure 67, it is evident that
scope is present for a load shift on Mine R’s refrigeration system. The evening peak to average
power ratio supports this finding.
Equation 29: Evening peak to average ratio – Mine R
𝑅𝑎𝑡𝑖𝑜 =
∑ 𝐸𝑣𝑒𝑛𝑖𝑛𝑔 𝑃𝑒𝑎𝑘 𝐸𝑛𝑒𝑟𝑔𝑦 𝑈𝑠𝑎𝑔𝑒2
∑ 𝑇𝑜𝑡𝑎𝑙 𝐸𝑛𝑒𝑟𝑔𝑦 𝑈𝑠𝑎𝑔𝑒24
𝑅𝑎𝑡𝑖𝑜 = 1909 [𝑘𝑊]
1991 [𝑘𝑊]
𝑅𝑎𝑡𝑖𝑜 = 0.96 [−]
0
500
1000
1500
2000
2500
00
:00
01
:00
02
:00
03
:00
04
:00
05
:00
06
:00
07
:00
08
:00
09
:00
10
:00
11
:00
12
:00
13
:00
14
:00
15
:00
16
:00
17
:00
18
:00
19
:00
20
:00
21
:00
22
:00
23
:00
Po
wer
(kW
)
Time
Refrigeration System Power Consumption - Mine R

Appendix C
Optimising deep-level mine refrigeration control for sustainable cost savings 114
1.1.2 Listing major components and data collection
Table 20 indicates the major components of Mine R’s refrigeration system. The detailed
component characteristic tables for both mines are available in Appendix A.
Table 20: Major components in refrigeration system – Mine R
Component Quantity
Fridge plant 3
Evaporator pumps 3
Condenser pumps 3
Pre-cooling transfer pumps 2
BAC transfer pumps 2
Pre-cooling fans 2
BAC fans 2
Condenser cooling fans 12
Dams (excluding sump dams) 3
Isolation valves 1
1.1.3 Refrigeration system layout and operation
Figure 68 indicates the layout of Mine R’s refrigeration system. Normal operating conditions
consist of running two chillers, two evaporator pumps and two condenser pumps during the
summer months. Six condenser cooling towers and both BAC fans are used as well. During
the winter months Mine R switches off their entire refrigeration system.

Appendix C
Optimising deep-level mine refrigeration control for sustainable cost savings 115
Figure 68: Normal summer operating layout – Mine R
1.1.4 System constraints
During the investigation the following constraints were identified at Mine R:
Cold water storage capacity
Lack of automated isolation valves
Underground environmental temperature
BAC fan start-up issues
Table 21 discusses the risk associated with these constraints as well as the mitigation for each
constraint.
Refrigeration System – Mine R
Cold Dam
CCT Dam CCT Dam CCT Dam To Underground
From Underground
BAC DamPCT Dam
Running / Open
Off / Closed
Cooling tower
Dam
LEGEND
Fridge plant
Motor
Pump
Hot Water
Warm Water
Cold Water
Valve

Appendix C
Optimising deep-level mine refrigeration control for sustainable cost savings 116
Table 21: Refrigeration system constraints – Mine R
Constraints Risk Mitigation
Cold water storage capacity
Cold water storage dam level
decreases when chillers and
evaporator pumps are
switched off.
Monitor dam level to ensure it
remains above 60% during
load shift.
Lack of automated isolation
valves
Cold water cannot be isolated
from warmer water
automatically.
Manually close off isolation
valve with each load shift.
Underground environmental
temperature
Underground temperatures
may increase to unsafe levels
during load shift.
Constantly monitor
underground temperatures and
start refrigeration system if
unsafe levels are reached.
BAC fan start-up problems
Fans suffer from excess
vibration when started.
Remove BAC fans from control
strategy due to risk of
breakdown.
1.2 Developing baselines and adjustment models
1.2.1 Electrical power baselines and adjustment
Figure 69 shows the average weekday electrical power baseline for Mine R during summer
months. The baseline was approved by an independent M&V team. As discussed, SLA will be
conducted due to the dynamic nature of Mine R’s refrigeration system power consumption.

Appendix C
Optimising deep-level mine refrigeration control for sustainable cost savings 117
Figure 69: Electrical power baseline – Mine R
1.2.2 Operational baselines
Table 22 lists the four most important KPIs and the respective minimum and maximum for
daily average parameters. The identified limits for the KPIs remain constant during summer
and winter months.
Table 22: Operational baseline – Mine R
KPI Minimum Maximum
Cold water storage level 60% 100%
Cold water storage temperature - 6 °C
BAC air temperature sent underground - 12 °C
Underground ambient temperature (dry-bulb) - 32 °C
0
500
1000
1500
2000
2500
00
:00
01
:00
02
:00
03
:00
04
:00
05
:00
06
:00
07
:00
08
:00
09
:00
10
:00
11
:00
12
:00
13
:00
14
:00
15
:00
16
:00
17
:00
18
:00
19
:00
20
:00
21
:00
22
:00
23
:00
Po
wer
(kW
)
Time
Summer Electrical Power Baseline - Mine R

Appendix C
Optimising deep-level mine refrigeration control for sustainable cost savings 118
1.3 Developing a load shift control strategy
1.3.1 Developing the control strategy
The control strategy for Mine R can be seen in Table 23, indicating the operating status of the
refrigeration components during the peak period. The evaporator and BAC transfer pumps
were kept running during peak periods to prevent the BAC dam from overflowing.
Table 23: Load shift control strategy – Mine R
Installed
quantity Component
Normal
operating
status
Evening peak
period status
Shutdown
sequence
3 Fridge plants 2 0 1
3 Evaporator pumps 2 2 -
3 Condenser pumps 2 0 3a
12 Condenser cooling tower
fans
6 0 3b
2 BAC transfer pumps 1 1 2
2 BAC fans 2 2 -
1.3.2 Simulation verification
The simulation for Mine R’s refrigeration system was verified against actual data for a normal
operating day. Table 24 below compares the daily average value of KPIs between the actual
data and simulated results. The 24 hour profiles are also compared below for each of the
variables listed in Table 24.

Appendix C
Optimising deep-level mine refrigeration control for sustainable cost savings 119
Table 24: Simulation verification – Mine R
Comparison Simulated Actual Percentage Error
Power consumption 2315 [kW] 2359 [kW] 1.91 [%]
Cold dam level 86.61 [%] 86.54 [%] 0.09 [%]
Cold dam temperature 4.90 [°C] 4.81 [°C] 1.22 [%]
BAC outlet air temperature 9.81 [°C] 9.97 [°C] 1.64 [%]
Figure 70: Power consumption verification – Mine R
0
500
1000
1500
2000
2500
3000
3500
00
:00
01
:00
02
:00
03
:00
04
:00
05
:00
06
:00
07
:00
08
:00
09
:00
10
:00
11
:00
12
:00
13
:00
14
:00
15
:00
16
:00
17
:00
18
:00
19
:00
20
:00
21
:00
22
:00
23
:00
Po
wer
(kW
)
Time
Power Consumption
Simulated Actual

Appendix C
Optimising deep-level mine refrigeration control for sustainable cost savings 120
Figure 71: Cold storage dam level verification – Mine R
Figure 72: Cold storage dam temperature verification – Mine R
0
10
20
30
40
5060
70
80
90
100
00
:00
01
:00
02
:00
03
:00
04
:00
05
:00
06
:00
07
:00
08
:00
09
:00
10
:00
11
:00
12
:00
13
:00
14
:00
15
:00
16
:00
17
:00
18
:00
19
:00
20
:00
21
:00
22
:00
23
:00
Leve
l (%
)
Time
Cold Storage Dam Level
Simulated Actual
0
1
2
3
4
5
6
7
00
:00
01
:00
02
:00
03
:00
04
:00
05
:00
06
:00
07
:00
08
:00
09
:00
10
:00
11
:00
12
:00
13
:00
14
:00
15
:00
16
:00
17
:00
18
:00
19
:00
20
:00
21
:00
22
:00
23
:00
Tem
per
atu
re (
°C)
Time
Cold Storage Dam Temperature
Simulated Actual

Appendix C
Optimising deep-level mine refrigeration control for sustainable cost savings 121
Figure 73: BAC outlet air temperature verification – Mine R
1.3.3 Simulating the control strategy
The average error between the simulated and actual KPIs was 1.2%. After verification deemed
the simulation accurate, the developed control strategy was simulated. The simulation results
in terms of electric power and KPIs are provided as follows:
Figure 74 shows the proposed power consumption of Mine R’s refrigeration system. The chiller
water outlet temperature was set at 4 °C. An average load shift of 1.78 MW was achieved
through simulation.
0
2
4
6
8
10
12
140
0:0
0
01
:00
02
:00
03
:00
04
:00
05
:00
06
:00
07
:00
08
:00
09
:00
10
:00
11
:00
12
:00
13
:00
14
:00
15
:00
16
:00
17
:00
18
:00
19
:00
20
:00
21
:00
22
:00
23
:00
Tem
per
atu
re (
°C)
Time
BAC Outlet Air Temperature
Simulated Actual

Appendix C
Optimising deep-level mine refrigeration control for sustainable cost savings 122
Figure 74: Simulated power consumption – Mine R
The average simulated cold storage dam level remained above 75% at all times during the
simulated period as can be seen in Figure 75.
Figure 75: Cold storage dam level– Mine R
0
500
1000
1500
2000
2500
3000
3500
00
:00
01
:00
02
:00
03
:00
04
:00
05
:00
06
:00
07
:00
08
:00
09
:00
10
:00
11
:00
12
:00
13
:00
14
:00
15
:00
16
:00
17
:00
18
:00
19
:00
20
:00
21
:00
22
:00
23
:00
Po
wer
(kW
)
Time
Simulated Power Consumption
Baseline Simulated
0
10
20
30
40
50
60
70
80
90
100
00
:00
01
:00
02
:00
03
:00
04
:00
05
:00
06
:00
07
:00
08
:00
09
:00
10
:00
11
:00
12
:00
13
:00
14
:00
15
:00
16
:00
17
:00
18
:00
19
:00
20
:00
21
:00
22
:00
23
:00
Leve
l (%
)
Time
Cold Storage Dam Level

Appendix C
Optimising deep-level mine refrigeration control for sustainable cost savings 123
Figure 76 shows that the simulated cold storage dam temperature increased rapidly during
the load shift. The increase in cold dam temperature during evening peak period is due to the
evaporator and BAC transfer pumps being left running to keep the BAC dam from overflowing.
As indicated by Figure 76, the average cold dam storage temperature is recovered within four
hours after the load shift.
Figure 76: Cold storage dam temperature – Mine R
Figure 77 illustrates that the BAC outlet air temperature increases during the load shift. This
is due to the BAC water inlet temperature increasing during this time. This temperature
increase is due to the evaporator and BAC transfer pumps left running during peak periods.
As indicated by Figure 77, the average BAC outlet air temperature is recovered within three
hours after the load shift.
0
1
2
3
4
5
6
7
8
9
10
00
:00
01
:00
02
:00
03
:00
04
:00
05
:00
06
:00
07
:00
08
:00
09
:00
10
:00
11
:00
12
:00
13
:00
14
:00
15
:00
16
:00
17
:00
18
:00
19
:00
20
:00
21
:00
22
:00
23
:00
Tem
per
atu
re (
°C)
Time
Cold Storage Dam Temperature

Appendix C
Optimising deep-level mine refrigeration control for sustainable cost savings 124
Figure 77: BAC outlet air temperature – Mine R
1.3.4 Validating the control strategy
The simulated strategy was implemented on the refrigeration system for validation. The graphs
below compare the power consumption and various KPIs from the simulation with the actual
test data. Table 25 provides an average comparison of the same data.
Table 25: Control strategy validation – Mine R
Comparison Simulated Test Percentage Error
Power consumption 2264 [kW] 2182 [kW] 3.59 [%]
Load shift 1780 [kW] 1700 [kW] 4.47 [%]
Cold dam level 84.40 [%] 84.13 [%] 0.32 [%]
Cold dam temperature 5.51 [°C] 5.35 [°C] 2.73 [%]
BAC outlet air temperature 9.79 [°C] 10.01 [°C] 2.30 [%]
0
2
4
6
8
10
12
14
160
0:0
0
01
:00
02
:00
03
:00
04
:00
05
:00
06
:00
07
:00
08
:00
09
:00
10
:00
11
:00
12
:00
13
:00
14
:00
15
:00
16
:00
17
:00
18
:00
19
:00
20
:00
21
:00
22
:00
23
:00
Tem
per
atu
re (
°C)
Time
BAC Outlet Air Temperature

Appendix C
Optimising deep-level mine refrigeration control for sustainable cost savings 125
The cold dam temperature increases above the maximum limit of 6 °C during the load shift,
negatively impacting the sustainability of the load shift. However, as indicated by Figure 80,
the temperature of the cold dam water recovers within two hours after the load shift.
Figure 81 shows the BAC air temperature sent underground. The simulation indicated that the
maximum allowable temperature was reached during the load shift, but recovered within an
hour after the load shift. The actual test results indicate the temperature was slightly lower,
not exceeding the maximum limit. This is due to the simulation not accounting for the exact
weather conditions of the specific test day.
The average daily profiles of the comparisons summarised in Table 25 are provided as follows:
Figure 78: Power consumption comparison – Mine R
0
500
1000
1500
2000
2500
3000
3500
00
:00
01
:00
02
:00
03
:00
04
:00
05
:00
06
:00
07
:00
08
:00
09
:00
10
:00
11
:00
12
:00
13
:00
14
:00
15
:00
16
:00
17
:00
18
:00
19
:00
20
:00
21
:00
22
:00
23
:00
Po
wer
(kW
)
Time
Power Consumption Comparison
Simulated Actual

Appendix C
Optimising deep-level mine refrigeration control for sustainable cost savings 126
Figure 79: Cold storage dam level comparison – Mine R
Figure 80: Cold storage dam temperature comparison – Mine R
0
10
20
30
40
5060
70
80
90
100
00
:00
01
:00
02
:00
03
:00
04
:00
05
:00
06
:00
07
:00
08
:00
09
:00
10
:00
11
:00
12
:00
13
:00
14
:00
15
:00
16
:00
17
:00
18
:00
19
:00
20
:00
21
:00
22
:00
23
:00
Leve
l (%
)
Time
Cold Storage Dam Level
Simulated Actual
0
1
2
34
5
6
7
8
9
10
00
:00
01
:00
02
:00
03
:00
04
:00
05
:00
06
:00
07
:00
08
:00
09
:00
10
:00
11
:00
12
:00
13
:00
14
:00
15
:00
16
:00
17
:00
18
:00
19
:00
20
:00
21
:00
22
:00
23
:00
Tem
per
atu
re (
°C)
Time
Cold Storage Dam Temperature
Simulated Actual

Appendix C
Optimising deep-level mine refrigeration control for sustainable cost savings 127
Figure 81: BAC outlet air temperature comparison – Mine R
The temperature at the 2010 level (2010L) station was monitored during the test. The 2010L
station was chosen as it is the deepest level on the mine that had real-time temperature
monitoring present at the time of testing. From Figure 82, the dry-bulb temperature remained
constant and the load shift had almost no impact on the underground temperature.
Figure 82: 2010L Station dry-bulb air temperature – Mine R
0
2
4
6
8
10
12
14
160
0:0
0
01
:00
02
:00
03
:00
04
:00
05
:00
06
:00
07
:00
08
:00
09
:00
10
:00
11
:00
12
:00
13
:00
14
:00
15
:00
16
:00
17
:00
18
:00
19
:00
20
:00
21
:00
22
:00
23
:00
Tem
per
atu
re (
°C)
Time
BAC Outlet Air Temperature
Simulated Actual
0
5
10
15
20
25
30
35
00
:00
01
:00
02
:00
03
:00
04
:00
05
:00
06
:00
07
:00
08
:00
09
:00
10
:00
11
:00
12
:00
13
:00
14
:00
15
:00
16
:00
17
:00
18
:00
19
:00
20
:00
21
:00
22
:00
23
:00
Dry
-bu
lb t
emp
erat
ure
(°C
)
Time
2010L Station Air Temperature

Appendix C
Optimising deep-level mine refrigeration control for sustainable cost savings 128
The simulation model was proved accurate and subsequently the control strategy was
optimised. The next section discusses the results obtained through optimisation.
1.4 Optimising the load shift control strategy
1.4.1 Developing the optimised control strategy
Optimising the control strategy entails closing the chill dam isolation valve during the load shift.
This will enable additional pumps to be shut down and cold water to be isolated from warmer
water. Figure 83 indicates the position of the cold dam isolation valve within the refrigeration
system.
Figure 83: Optimised load shift control strategy – Mine R
Table 26 indicates the optimised control strategy for Mine R’s refrigeration system.
Optimised Control Strategy
Cold Dam
CCT Dam CCT Dam CCT Dam To Underground
From Underground
BAC DamPCT Dam
Running / Open
Off / Closed
Cooling tower
Dam
LEGEND
Fridge plant
Motor
Pump
Hot Water
Warm Water
Cold Water
Valve

Appendix C
Optimising deep-level mine refrigeration control for sustainable cost savings 129
Table 26: Optimised load shift control strategy – Mine R
Installed
quantity Component
Normal
operating
status
Evening peak
period status
Shutdown
sequence
3 Fridge plants 2 0 1
3 Evaporator pumps 2 0 2
3 Condenser pumps 2 0 4a
12 Condenser cooling tower
fans
6 0 4b
2 BAC transfer pumps 1 0 3
2 BAC fans 2 2 -
1.4.2 Simulating the optimised control strategy
Figure 84 shows the simulated power consumption for the optimised control strategy on
Mine R’s refrigeration system. The simulation proved that a potential load shift of 1.94 MW is
possible.
Figure 84: Simulated power consumption for the optimised control strategy – Mine R
0
500
1000
1500
2000
2500
3000
3500
00
:00
01
:00
02
:00
03
:00
04
:00
05
:00
06
:00
07
:00
08
:00
09
:00
10
:00
11
:00
12
:00
13
:00
14
:00
15
:00
16
:00
17
:00
18
:00
19
:00
20
:00
21
:00
22
:00
23
:00
Po
wer
(kW
)
Time
Simulated Power Consumption
Baseline Simulated

Appendix C
Optimising deep-level mine refrigeration control for sustainable cost savings 130
Figure 85 indicates the average simulated cold storage dam level for the optimised control
strategy. The dam level remains above 80% throughout the simulation.
Figure 85: Cold storage dam level – Mine R
Figure 86 shows that the simulated cold storage dam temperature only increased by 2 °C, and
recovered within four hours after the load shift. Isolating the cold dam from the BAC dam
ensures that the cold and warm water do not mix, improving the sustainability of the load shift.
0
10
20
30
40
50
60
70
80
90
100
00
:00
01
:00
02
:00
03
:00
04
:00
05
:00
06
:00
07
:00
08
:00
09
:00
10
:00
11
:00
12
:00
13
:00
14
:00
15
:00
16
:00
17
:00
18
:00
19
:00
20
:00
21
:00
22
:00
23
:00
Leve
l (%
)
Time
Cold Storage Dam Level

Appendix C
Optimising deep-level mine refrigeration control for sustainable cost savings 131
Figure 86: Cold storage dam temperature – Mine R
Figure 87 indicates the simulated temperature increase during peak period for the optimised
strategy. This is due to the water flow to the BAC being stopped during evening peak period.
The temperature is recovered within two hours after the load shift. This can be attributed to
the lower cold storage dam temperature achieved by isolating it from warmer water.
Figure 87: BAC outlet air temperature – Mine R
0
1
2
3
4
5
6
7
80
0:0
0
01
:00
02
:00
03
:00
04
:00
05
:00
06
:00
07
:00
08
:00
09
:00
10
:00
11
:00
12
:00
13
:00
14
:00
15
:00
16
:00
17
:00
18
:00
19
:00
20
:00
21
:00
22
:00
23
:00
Tem
per
atu
re (
°C)
Time
Cold Storage Dam Temperature
0
2
4
6
8
10
12
14
16
18
00
:00
01
:00
02
:00
03
:00
04
:00
05
:00
06
:00
07
:00
08
:00
09
:00
10
:00
11
:00
12
:00
13
:00
14
:00
15
:00
16
:00
17
:00
18
:00
19
:00
20
:00
21
:00
22
:00
23
:00
Tem
per
atu
re (
°C)
Time
BAC Outlet Air Temperature

Appendix C
Optimising deep-level mine refrigeration control for sustainable cost savings 132
1.4.3 Validating the optimised control strategy
Table 27 below compares the daily average value of critical variables between the actual data
and simulated results. The 24 hour profiles are also compared below for each of the variables
listed in Table 27.
Table 27: Optimised control strategy validation – Mine R
Comparison Simulated Test Percentage Error
Power consumption 2258 [kW] 2217 [kW] 1.80 [%]
Load shift 1939 [kW] 1938 [kW] 0.05 [%]
Cold dam level 86.38 [%] 86.02 [%] 0.41 [%]
Cold dam temperature 5.31 [°C] 5.15 [°C] 3.09 [%]
BAC outlet air temperature 11.45 [°C] 10.91 [°C] 4.72 [%]
The average daily profiles of the comparisons summarised in Table 27 are provided as follows:
Figure 88: Power consumption comparison – Mine R
0
500
1000
1500
2000
2500
3000
3500
00
:00
01
:00
02
:00
03
:00
04
:00
05
:00
06
:00
07
:00
08
:00
09
:00
10
:00
11
:00
12
:00
13
:00
14
:00
15
:00
16
:00
17
:00
18
:00
19
:00
20
:00
21
:00
22
:00
23
:00
Po
wer
(kW
)
Time
Power Consumption Comparison
Simulated Actual
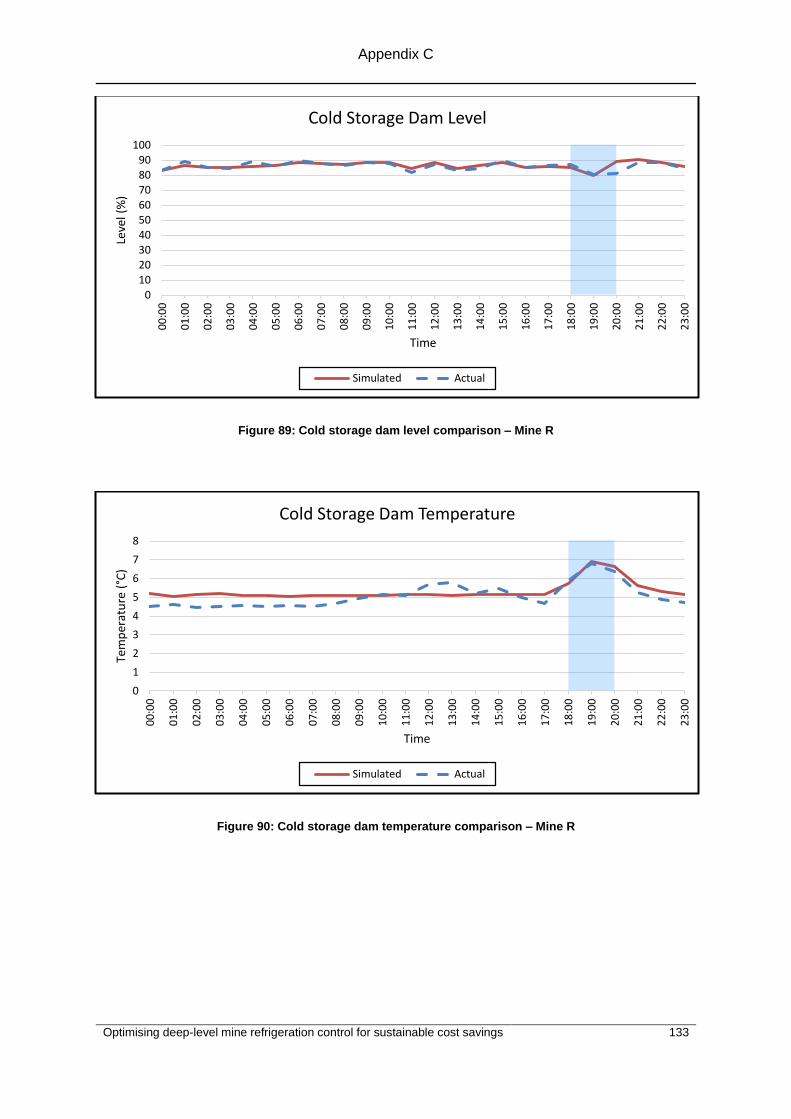
Appendix C
Optimising deep-level mine refrigeration control for sustainable cost savings 133
Figure 89: Cold storage dam level comparison – Mine R
Figure 90: Cold storage dam temperature comparison – Mine R
0
10
20
30
40
5060
70
80
90
100
00
:00
01
:00
02
:00
03
:00
04
:00
05
:00
06
:00
07
:00
08
:00
09
:00
10
:00
11
:00
12
:00
13
:00
14
:00
15
:00
16
:00
17
:00
18
:00
19
:00
20
:00
21
:00
22
:00
23
:00
Leve
l (%
)
Time
Cold Storage Dam Level
Simulated Actual
0
1
2
3
4
5
6
7
8
00
:00
01
:00
02
:00
03
:00
04
:00
05
:00
06
:00
07
:00
08
:00
09
:00
10
:00
11
:00
12
:00
13
:00
14
:00
15
:00
16
:00
17
:00
18
:00
19
:00
20
:00
21
:00
22
:00
23
:00
Tem
per
atu
re (
°C)
Time
Cold Storage Dam Temperature
Simulated Actual

Appendix C
Optimising deep-level mine refrigeration control for sustainable cost savings 134
Figure 91: BAC outlet air temperature comparison – Mine R
The temperature at the 2010L station was monitored during the test. From Figure 92, the dry-
bulb temperature remained constant and the load shift had almost no impact on the
underground temperature.
Figure 92: 2010L Station dry-bulb air temperature – Mine R
0
2
4
6
8
1012
14
16
18
200
0:0
0
01
:00
02
:00
03
:00
04
:00
05
:00
06
:00
07
:00
08
:00
09
:00
10
:00
11
:00
12
:00
13
:00
14
:00
15
:00
16
:00
17
:00
18
:00
19
:00
20
:00
21
:00
22
:00
23
:00
Tem
per
atu
re (
°C)
Time
BAC Outlet Air Temperature
Simulated Actual
0
5
10
15
20
25
30
35
00
:00
01
:00
02
:00
03
:00
04
:00
05
:00
06
:00
07
:00
08
:00
09
:00
10
:00
11
:00
12
:00
13
:00
14
:00
15
:00
16
:00
17
:00
18
:00
19
:00
20
:00
21
:00
22
:00
23
:00
Dry
-bu
lb t
emp
erat
ure
(°C
)
Time
2010L Station Air Temperature

Appendix C
Optimising deep-level mine refrigeration control for sustainable cost savings 135
Figure 89 to Figure 92 show that the optimised control strategy had no lasting impact on the
operation of Mine R’s refrigeration system.

Appendix D
Optimising deep-level mine refrigeration control for sustainable cost savings 136
Appendix D: Case study 2 implementation
Implementation consisted of simulating the optimised control strategy and validating it with
tests. Mine personnel were trained to implement the optimised control strategy on a daily
basis. This resulted in the optimised strategy to be implemented within one month. Only
existing infrastructure was utilised and no implementation costs were incurred.
Figure 93 illustrates the baseline and post-implementation power profile, averaged over a
period of nine months. The presence of the evening peak period load shift indicates the project
was implemented sustainably thus far. Cost savings based on the evening peak period load
shift shown in Figure 93 results in R 215 000 annually.
Figure 93: Post implementation power profile – Mine R
Table 28 compares the predicted and achieved (post-implementation) summer evening peak
period load shift and annual cost savings. The predicted average summer load shift correlates
closely with the achieved reduction with an average error of approximately 3%. The average
annual cost savings realised by the evening peak period load shift falls within an approximate
error of 8%.
0200
400
600
800
1000
12001400
1600
1800
2000
00
:00
01
:00
02
:00
03
:00
04
:00
05
:00
06
:00
07
:00
08
:00
09
:00
10
:00
11
:00
12
:00
13
:00
14
:00
15
:00
16
:00
17
:00
18
:00
19
:00
20
:00
21
:00
22
:00
23
:00
Po
wer
(kW
)
Time
Post Implementation Electrical Power Profile
Post Implementation Baseline

Appendix D
Optimising deep-level mine refrigeration control for sustainable cost savings 137
Table 28: Implementation validation – Mine R
Predicted summer evening peak load
shift
Achieved summer evening peak load
shift
1.94 MW 2.00 MW
Predicted annual cost savings Achieved annual cost savings*
R 232 000 R 215 000
*Based on nine months post-implementation data