optimising a fall out dust monitoring sampling programme
TRANSCRIPT

Vol. 7(4), pp. 128-139, April 2013
DOI: 10.5897/AJEST12.069
ISSN 1996-0786 © 2013 Academic Journals
http://www.academicjournals.org/AJEST
African Journal of Environmental Science and Technology
Full Length Research Paper
Optimising a fall out dust monitoring sampling programme at a cement manufacturing plant in South
Africa
Jacobus Engelbrecht1*, Jacobus Joubert1, Johannes Harmse1 and Charles Hongoro1,2
1Department of Environmental Health, Faculty of Science, Tshwane University of Technology, Private Bag X680,
PRETORIA 0001, South Africa. 2Health Systems Research Unit, South African Medical Research Council, South Africa.
Accepted 29 April, 2013
The aim of this study at the specific cement manufacturing plant and open cast mine was to develop a positioning guideline for monitoring equipment and to optimise the fall out dust sampling programme. A baseline study was conducted on existing practices and legal requirements relating to fall out dust monitoring. The different methods and techniques for the identification of particulate emission sources and the calculation of emission rates were evaluated in order to identify the simplest and most cost effective options. Due to the complexity of sampling particulate emissions, emission factors and existing stack monitoring results were used to calculate the emissions. The quantified point and fugitive emissions rates were used to populate a dust dispersion model and the modeling results were compared with the existing monitoring program results. Due to the complexity of actual measurements or applying the principles of a mass balance in the total cement manufacturing process to calculate emission rates it was found that the selected use of emission factors is a simpler and less costly method. The study concluded that, after superimposing the dispersion model to the results from the existing sampling positions, existing sampling positions are not optimally located. A guideline for the optimisation of a fall out dust monitoring program is proposed. Key words: Fall out dust monitoring, cement plant, optimising, air pollution sampling, fall out dust sampler locations.
INTRODUCTION Fall out dust sampling and monitoring is becoming one of the preferred methods to determine dust pollution impact from industries/or mines on the receiving environment (Lodge, 1988). Particulates can be divided into the following categories, namely: 1. Condensable material: Material in the vapour phase at stack temperature which condenses to form particles as the plume disperses.
2. Inhalable particles: Particles with a diameter greater than 10 µm that are usually deposited in the upper res-piratory system. 3. Respirable particles: Particles smaller than 10 µm but larger than 2.5 µm can generally get to as far as the larynx. PM10 (particulate matter) is particulate matter with a dia-meter of less than or equal to 10 µm. PM2.5 is particulate matter with a diameter of less than or equal to 2.5 µm (Loans, 2007).
*Corresponding author. E-mail: [email protected].

Dust that precipitates and is deposited in the environment is defined as any particulate matter that has an aerody-namic diameter between 10 and 100 µm (Loans, 2007). Such particulate matter is also referred to as total sus-pended particulate (TSP).
Fall out dust monitoring is a useful and cost effective method of providing trend analysis of dust deposition over a period of time. It also provides an indication of the main areas of dust generation and can be conducted for both health and nuisance purposes. Particulate matter (dust) emissions resulting from the cement manufacturing process is usually as a result of point and fugitive emis-sion sources (Davis, 2000). The nuisance dust close to cement processes is associated with haze and poor visibility. The dust from cement production contains small quantities of heavy metals (Vincent et al., 2006). Exam-ples of such heavy metals include: lead, mercury and chromium. These elements in cement dust may pose a great threat to the health of plants, animals and residents in and around the factory (Gbadebe and Bankole, 2007). Pollution from cement dust can result in marked reduction in vitamin levels and also increase heavy metal concent-rations in plants (Ade-Ademilua and Obalola, 2008). Fall out dust may negatively affect the soil in the area sur-rounding the cement manufacturing facility (Bilen, 2010). Cement dust can also cause damage to structures such as roof material by causing microbiological and chemical disintegration of such roof material (Tijani et al., 2005)
Standards for monitoring fall out dust monitoring sta-tions exist. Examples of such standards include: Ameri-can Society for Testing and Materials (ASTM) D 1739-98 and Australian Standards (AS) 3580.10.1 – 1991. Although the standards for dust deposition levels are set, the posi-tioning of monitoring equipment in the receiving environ-ment is not adequately prescribed. In many instances, industries/or mines position air quality monitor-ring equipment on the boundaries of its premises inter-preting ambient air quality impacts as dust deposition beyond its boundaries (Lodge, 1988). The loss of equipment beyond the fence due to vandalism or theft made this practice to be the best way out in the sampling of fall-out dust. Sampling sites to measure pollutant levels should be selected close to or representative of exposed populations, structures and plant (Vallero, 2008). Positioning of air quality monitoring equipment should be specific as per the results of an air quality modeling analyses that appro-priately locates air quality monitors (Arizona Department of Environmental Quality, 2004). The National Framework for Air Quality Management in the Republic of South Africa (South Africa, 2007) requires that the number and location for fall out dust sampling points should be at representative locations around the dust source and will include air quality monitoring equipment located at human residences, sensitive business, industrial or agricultural locations within a maximum distance of two kilometers from the source boundary.
In order to design an air quality monitoring plan it is important to understand what is to be monitored and to
Engelbrecht et al. 129 also investigate redundancies, gaps and inadequacies in the existing monitoring programme (Knight, 2007). This provides the opportunity to improve or change to potential alternatives to get more value from the monitoring results.
Due to the fact that positioning of fall out dust sampling equipment at cement manufacturing plants are presently based on professional judgment and not on scientific research, a research study to develop a dust deposition guideline that will guide and assist the cement industry with the placement of monitoring equipment was conduc-ted. The aim of the study at the specific cement manu-facturing plant and open cast mine was to develop a positioning guideline for monitoring equipment and to optimise the fall out dust sampling programme. The objectives of the study were to: 1: Conduct a literature study to understand the background and existing prac-tices of placement of fall out dust sampling points; 2: identify all the emission sources from the cement manu-facturing process and related activities and record these in an emissions inventory; 3: quantify the emission rates from such sources; 4: generate a dust dispersion model from the results and use such a model to optimise the fall out dust monitoring programme.
This paper focuses on the development of a positioning guideline for monitoring equipment and optimising the fall out dust sampling programme at a cement manufacturing plant and open cast mine. More specifically, it presents a detailed review of literature on existing practices of place-ment of fall out dust sampling points; It then identifies all the emission sources from a selected cement manufac-turing process and related activities recorded in an emissions inventory; quantify the emission rates from such sources; and generate a dust dispersion model from the results and used such a model to optimise the fall out dust monitoring programme. MATERIALS AND METHODS The study focused on the identification and quantification of all dust particulate emission sources, both point and fugitive related to the cement manufacturing operation at the Pretoria Portland Cement Plant De Hoek, located near the town of Piketberg, Western Cape, South Africa (Figure 1). The cement manufacturing plant included the following main processes and steps: 1. Mining- Open cast mine in which limestone is blasted and transported on haul roads 2. Crushing- Limestone is crushed and screened in primary and secondary crushers. The crushed limestone is transported and blended on material stockpiles. 3. Raw material handling- Raw materials received by road are stockpiled together with the limestone. 4. Raw material grinding- All raw materials are proportionally extracted and mixed. The mixed raw materials are ground and stored in silos. 5. Burning- The ground raw material is burned in thermal kilns to produce clinker. 6. Clinker grinding- Clinker is ground in finish mills to produce different types of cements. 7. Packaging and dispatching- Final products is transported, packed, stored and loaded to be dispatched. Figure 1 shows the

130 Afr. J. Environ. Sci. Technol.
Figure 1. Main processes at the case study facility (location indicated using Google Earth, 2011).
locations of the various main processes at the cement manufac-turing facility. The study excluded the sampling of dust particulate emission sources of external and neighbouring activities such as farming activities because it was not possible to quantify and qualify the emission rates from neighbouring activities. The main purpose of the monitoring programme is also to verify the impact of the cement manufacturing facility on its environment. Quantification of particulate emissions Emission rates from fugitive and point dust emission sources were calculated for use as input data to the dispersion model. These are described in turn. Equipment used to monitor point sources
Point sources are easier to quantify due to existing legal monitoring requirements. In most cases, point sources require continuous or periodic in stack monitoring. Results from continuous measurement are reported on a standardised basis in mg/Nm
3 (normal conditions
of 10% O2, 273 Kelvin and 101.3 kPa). The results in mg/Nm3 are
converted into an emission rate of grams per second to be used as input to the dispersion model. The four point sources at the case study facility are shown in Table 1. These were from the cement milling and kiln processes. Each of the two finishing mills and two kilns has its own stacks. All four stacks are equipped with conti-nuous in stack particulate emission monitoring equipment that can
generate reports at two minute, hourly and 24 h averages. In order to use results from the continuous in stack monitoring, it
is important to ensure that the data is valid. In addition to a correct monitoring method, the accuracy of the monitoring equipment needs to be verified. The method used for the verification of the continuous measurement of dust particulate from a point source was ISO 9096: 2003. ISO 9096 describes a reference method for the measurement of particulate matter (dust) concentration in waste gases (ISO, 2003). The isokinetic sampling results are compared with that of the automated monitoring systems to make the necessary adjustments to ensure that it is calibrated to give more accurate results. To verify that in stack particulate matter monitoring equipment is properly calibrated the calibration certificates were obtained for all monitoring equipment at the time of sampling. These calibration certificates were available for the installation as well as annual calibration. The condition of the in stack monitoring equipment was also confirmed by inspection and reports from the maintenance system. The maintenance system covers all supplier minimum service requirements to ensure that equipment is operational. From the 24 h average particulate emission levels (mg/Nm
3) an average emission rate was calculated and used as
input rate in the dispersion model. Annual emission data were used to calculate the average grams per second of dust emitted. Estimation of fugitive sources Due to the complexity of measuring fugitive particulate emissions in

Engelbrecht et al. 131 Table 1. Identified point sources and continuous monitoring methods.
Reference Number
Section Process Monitoring equipment Report
PRO2C Burning (kilns) Kiln 5 In stack continuous measurement instrument 2 min, 1 h and 24 h averages (mg/Nm
3)
Kiln 6 In stack continuous measurement instrument 2 min, 1 h and 24 h averages (mg/Nm
3)
PRO2E Finish milling (clinker grinding)
FM 5 In stack continuous measurement instrument 2 min, 1 h and 24 h averages (mg/Nm
3)
FM 6 In stack continuous measurement instrument 2 min, 1 h and 24 h averages (mg/Nm
3)
in a process like cement manufacturing, the emission levels were estimated by applying emission factors such as US EPA AP42 (United States Environmental Protection Agency Air Pollution 42) and Australian National Pollutant Inventory (NPI). Most of the emission factors applied is from the US EPA AP42 and where more appropriate, the factors from the Australian NPI were used. The sources of emission factors used are listed in Table 3. Both US EPA AP42 and Australian NPI provide the community, industry and government with free information about emission factors from different sources. Making use of emission factors (US EPA, 1995) to calculate emission rates are the more practical and cost effective methods for example, EPA-454/R-95-015, due to the complexity and cost of actual measurement. An emission factor is expressed as the weight of pollutant emitted divided by the unit weight, volume, distance or duration of the activity. Emission factors are used to estimate a source emission rate and the following equa-tions were used (USA EPA: 1995): E = A x EF x [1 – (ER/100)] Where: E = emissions, A = activity rate, EF = uncontrolled emission factor and ER = overall emission reduction efficiency (%). The following were considered in the calculations: annual pro-duction tonnages, quantity of activities listed in Table 3, activity duration, material moisture content, material silt content, number of days raining >0.254 ml, mean wind speed, time wind speed excee-ding 5.4 m/s, total hectares, certain prescribed constants or a pre-determined emission factor as prescribed by the selected methods. After calculation of the emission rates, the reduction factors were applied for those areas where controls are in place.
Sampling of fall out dust
The sampling method applied is based on the internationally accepted ASTM D 1739-98 American Society for Testing and Materials: Standard Test method for Collection and Measurement of Dust fall method. This test method covers a procedure for collection of fall out dust and its measurement (ASTM, 2004). It also prescri-bes that buckets be placed two meters above ground level. This test method describes determination of both water-soluble and insoluble particulate matter.
The sampling period was 30 days and conducted during 2009 to 2011. Samples were collected, filtered and weighed and reported as mg/m
2/day (total dust). A Global Positioning System (GPS) was
used to confirm the location of the existing sampling points. The location of the sampling points in relation to the cement
manufacturing activities is illustrated in Figure 2. The sampling points are concentrated north-west of the facility and around the open pit mining area. Limitations of the existing sampling points are that they are focused around the open cast mining and manufac-
turing activities only. One specific sampling point (SS) is far north in a neighboring town. The background aerial photograph reveals the other activities surrounding the cement manufacturing facility such as agriculture.
Ten sampling points were used to cover all prevailing wind directions in opposite directions (Table 3). The sampling period was 30 days. Samples were collected, filtered and weighed and repor-ted as mg/m
2/day. A GPS was used to confirm the location of the
existing sampling points. Modeling of air pollution monitoring and estimation results Emission factor results were converted to actual concentrations in the various units which are required for the modeling process. With actual results from the fugitive dust emission levels reported, a modeling report was drafted using Screen View. It is a user friendly interface for U.S. EPA screening model, SCREEN3 and contains several features to make modeling as easy as possible (Lakes Environmental, 2008). The emission levels were reported as micro grams per cubic meter (µg/m
3). Results showed the emission levels
at different distances from the source. The distances selected for this study were 5 to 5000 m to be able to confirm that the two kilometer radius is valid. The receptor height was selected as two meters as this is in line with the height of a typical fall out dust sampler. Other input data such as the height, length and width of emission generating source were also selected.
No direct or in directed interventions took place with individual human beings, therefore ethical approval was not necessary. Ethi-cal approval for the project was however obtained from the University.
RESULTS AND DISCUSSION
Point source emission modelling
The dust emission levels for the period 2009 to 2011 and stack details obtained from the in stack monitoring results were used to calculate emission rates. These rates were used as input data for the dust emission modeling of the identified four point sources.
Point source particulate emission rates
Point source emission rates were calculated from the in stack monitoring results (Table 2). Limestone is received from the lime quarry and introduced into a burning process (rotary kilns Kiln 5 and 6). Clinker is produced which is fed into two cement mills, finished mill FM5 and

132 Afr. J. Environ. Sci. Technol.
Table 2. Particulate emission rates from point sources.
Reference Number Section Process Average emission level (mg/Nm3) Calculated emission rate (g/s)
PRO2C Burning (kilns) Kiln 5 168.17 7.38
Kiln 6 73.73 4.34
PRO2E Cement milling FM 5 1 0.001
FM 6 15.35 0.114
Table 3. Stack data input data into dispersion model.
Stack Stack height (m) Stack inside diameter (m)
Stack gas exit velocity (m/s
-1)
Stack gas exit temperature (°K)
Kiln 5 (DK5) 61 2.19 11 393
Kiln 6 (DK6) 64.1 2.74 10.3 388
Finish Mill 5 (FM5)
30 0.7 6.8 364
Finish Mill 6 (FM6)
18 0.989 6.8 364
Figure 2. Location of existing fall out dust sampling points (Google Earth, 2011).

Engelbrecht et al. 133
P
art
icu
late
em
issio
n (
µg
/m3)
Figure 3. Kilns particulate emission modeling.
FM6. The variation in the emission levels of the different processes is mainly as a result of old versus newer tech-nologies. Both kilns are equipped with electrostatic preci-pitators where as the best technology today is a bag filter which is commissioned at the cement mills. Low emission from FM5 is an example of effective bag filter technology.
According to Table 2, the variation in the emission levels of the different processes is mainly as a result of old versus newer technologies. Both kilns (FM5 and FM6) are equipped with electrostatic precipitators where as the best technology today is a bag filter. Low emission from FM5 (1 mg/Nm
3) is an example of the effectiveness of
bag filter technology. Older technologies implemented at the burning kilns were electrostatic precipitators whereas bag filters that are commissioned at the cement mills (FM5 and FM6) have improved collection efficiency. Point source emission modeling results The emission rates and stack information were fed into the dispersion modeling software (Lakes Environmental, 2008). The results of the point source dispersion mode-ling were reported as micrograms per cubic meter (µg/m
3)
at the set distances of between 600 to 1000 meter distan-ces from the generating source. The particulate emission modeling from the four point sources is illustrated in Figures 3 and 4.
The highest concentrations of ambient dust levels from both kilns (DK5 and DK6) are between 600 and 1000 m
from point source. This is mainly as a result of the concentration, height and velocity at the point of release. Table 3 provides a summary of stack data that was used in the dispersion model.
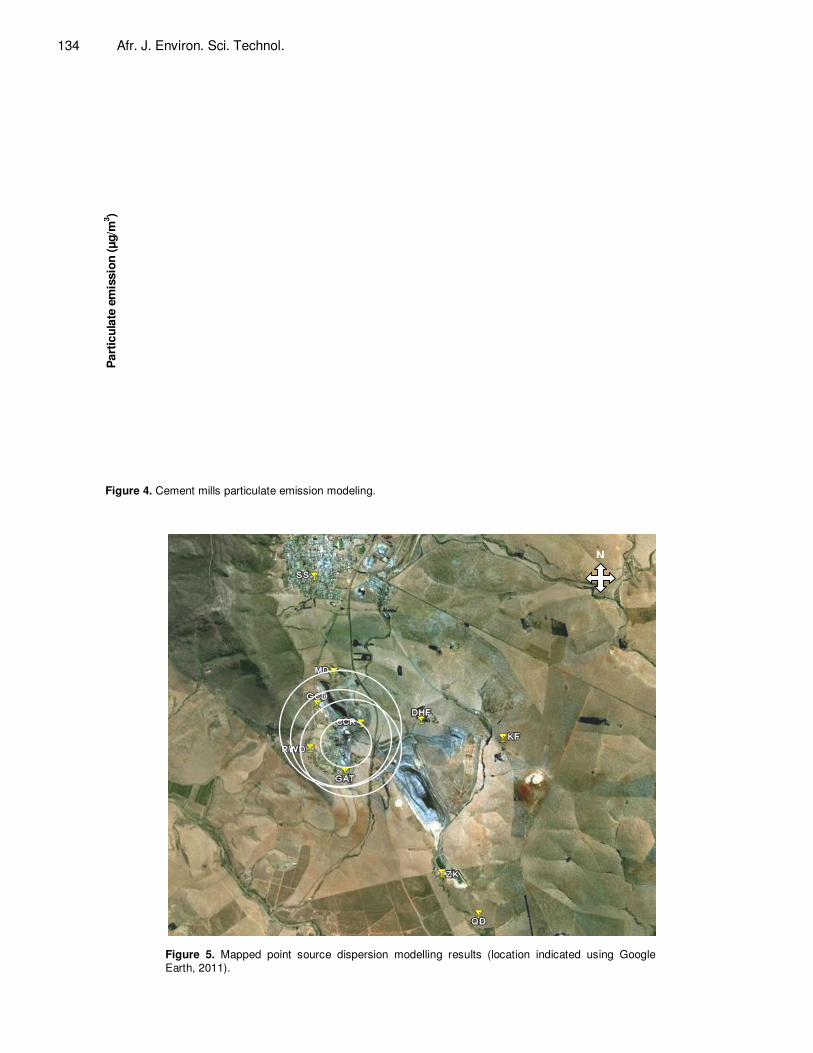
The highest concentrations of ambient dust levels from both mills (FM5 and FM6) are between 600 and 1000 m from the generating source (Figure 4). The results are much lower as compared to the kilns (Figure 3) due to the lower concentrations emitted by the milling process.
Point sources dust emission concentrations were all below the South African National Air Quality Standard of 300 µg/m
3 (24 h average) (SANS, 2005). Therefore, the
maximum emission levels (peaks) were used as impact range. The impact ranges were mapped to compare with the existing fall out dust sampling locations. As illustrated in Figure 3, the maximum impact was from kiln 5 (DK5) at 900 m. Figure 5 illustrates the relationship between the existing fall out dust sampling points and the impact from the dust emissions from the four point sources.
From the modeling results shown in Figure 5, it is clear that the existing fall out dust sampling locations are cor-rect (in relation to point sources) except for the one to the South close to the gate (sampling point GAT). The maxi-mum impact was more to the South. The sampling loca-tion in town to the North (sampling point SS), is not required as it will not be representative of the impact from the cement manufacturing plant. The point source model on its own cannot be used to relocate sampling equip- ment as the results from the fugitive emission sources
134 Afr. J. Environ. Sci. Technol.
Part
icu
late
em
issio
n (
µg/m
3)
Figure 4. Cement mills particulate emission modeling.
Figure 5. Mapped point source dispersion modelling results (location indicated using Google Earth, 2011).
N

Engelbrecht et al. 135 Table 4. Particulate emission rates from fugitive sources.
Source name Activity Source description Emission rates after
reduction factors (EF – ER %) g/s
Emission factor source
Mining Drilling Mark out blast holes and conduct drilling with a drill rig
0.0004917 US EPA
Mining Blasting Arranging and execute blasting 0.0019053 NPI
Mining Crushing and screening
Discharge into crusher bin (feeding crusher)
0.0773824 NPI
Crushing 0.2219685 NPI
Mining Transportation Transportation via belt conveyor (Transfer points) from primary crusher to surge pile
0.0773824 US EPA
Mining Stockpiling Discharge from belt conveyor to surge pile 0.1547648 US EPA
Mining Crushing and screening
Secondary crushing 0.1331811 NPI
Mining Stacking and storage of material
Transportation via belt conveyor (Transfer points)
0.3095297 US EPA
Discharge from belt to screening stockpile
0.0116074 US EPA
Stacker operations 0.0986626 US EPA
Production Raw material handling
Sand offloading 0.0000143 US EPA
Production Raw material handling
Reclaiming from stockpiles 0.0012485 US EPA
Production Raw material handling
Transportation via belt conveyor (Transfer points) - Stockpile to proportioning
0.0397552 US EPA
Production Raw material handling
Transportation via belt conveyor (Transfer points) Proportioning to Raw mill
0.0993880 US EPA
Production Burning Transportation via belt conveyor (Transfer points) - From stockpile to coal mill
0.0072091 US EPA
Cement Milling
Gypsum extraction and transportation
Transportation of Gypsum 0.0046857 US EPA
Packaging and Logistics
Material handling
FDG offloading at tippler 0.0000916 US EPA
FDG transportation via belt conveyor
0.0002749 US EPA
Packaging and Logistics
Material handling
Coal offloading at tippler 0.0287043 US EPA
Coal transportation (tippler to stockpile)
0.1435213 US EPA
Coal discharge onto stockpile 0.1435213 US EPA
Packaging and Logistics
Material handling Gypsum offloading from rail trucks 0.0010426 US EPA
can influence the model.
Fugitive source emission modelling
Fugitive source emission rates were calculated using emission factors as proposed by the US EPA 42 and the Australian NPI. Emission factor source is shown in Table 4.
Fugitive source emission modeling results
The emission rates were fed into the dispersion modeling software (Lakes Environmental, 2008). The results from the fugitive source dispersion modeling were reported as micrograms per cubic meter (µg/m
3) at different distances
from the generating source. The selected distance range
was 5 to 5 000 m, therefore all fugitive sources where the impact is five meters or less were excluded and regarded as insignificant.
From the modeling results shown in Figure 6, it is clear that the existing fall out dust sampling locations are in-adequate especially towards the northern and west-south - western directions of the operation. It also clear that the sampler located towards the south-east (sampling point QD) is not adding value.
Conclusions and recommendations
The study concluded that to optimise a fall out dust moni-toring programme, the following steps should be

136 Afr. J. Environ. Sci. Technol.
N
Figure 6. Mapped fugitive source dispersion modelling results (location indicated using Google Earth, 2011).
considered: 1. Identify all particulate emission generating sources. 2. Determine the particulate emission rates from fugitive sources by using emission factors. 3. Monitor emissions from point sources as a legal requirement. The results can be used to determine the emission rates of point sources. 4. Use the source characteristics and emission rates as input data for dispersion modeling. 5. Use the results of the dispersion modeling to deter-mine the location of samplers. 6. Keep the programme relevant by considering activity or emission rate changes and at least annually review the monitoring programme accordingly.
Historically, locations of fall out dust samplers have been guided by experience, observed effects or physical property boundaries. This study, however, confirmed that it is possible to locate samplers by utilising all available information and emission factors without spending vast capital and time on actual sampling. In summary, the steps for the developing of a location model (steps 1 to 4) and optimising a fall out dust sampling programme (Step 5) are illustrated in Figure 7.
Optimising the fall out dust monitoring programme Mapping the impact zones for both point and fugitive sources together with the existing sampling point loca-tions revealed the adequacy of such sampling points in detecting the impact of fall out dust from the activities.
The mapping of the results from the dispersion model did not consider prevailing wind directions, but consi-dered the location of the samplers. The prevailing wind directions were obtained from an onsite weather station, a Davis Vantage Pro2 type that is calibrated annually by a SANAS accredited facility.
The location of the existing fall out dust sampling points in yellow are adequate for the four point sources and do not require any change. With regard to fugitive source dust dispersion modeling results (Figure 6), it is also evident that the location of the sampling points is inade-quate. According to the modeling results, the optimal location of sampling points is indicated in red. The sam-pling point in blue (Figures 8 and 9) is the ideal position for the relocation of sampling point CCR. GPS was used to confirm the coordinates of the changed locations.
The study concentrated on the cement manufacturing process and related activities and it did not consider the

Engelbrecht et al. 137
1. Identify particulate sources
2a. Point sources (primary)
2b. Fugitive sources (secondary)
3a. Calculate emission rates from continuous or isokinetic
measurements
3b. Quantify emission rates by using emission factors
4. Dispersion model
5. Determine sampler locations (fall out dust)
Figure 7. Steps for optimising fall out dust sampler locations.
impact of adjacent activities such as agricultural or other mining (apart from the cement plant) activities because these were not major contributors to dust emissions in that area. Nonetheless, results from this case study can be used as a guideline for the categorisation (zoning) of use for properties surrounding the cement manufacturing plant. In order to further optimise the monitoring program, the following research agenda is suggested:
1. Comparison of results from the existing fall out dust monitoring programme with those from the newly optimised programme to verify adequacy and appropriateness. 2. Analyses of samples from fall out dust samplers to determine composition and characteristics of the particulates to trace its origin. 3. Collection and analyses samples of raw materials and at particulate emission generating sources and compari-son of the results with those of the fall out dust samples. The results can be used to confirm the origin of the particulates.
4. A comparative study between various dust emitting operations to reflect operational differences in South Africa.
The development of a guideline on how to optimise a fall out dust monitoring program for a cement manufac-turing operation requires knowledge of all relevant activi-ties and quantification of particulate emission rates that can be expected from such activities.
This information on sources and emission rates provide the input data for the dispersion model that will in turn reflect the impact areas of such particulate emissions. These models assist with the location of fall out dust samplers in order to adequately monitor and measure the impact from production activities. Due to the complexity of actual measurements or applying the principles of a mass balance in the total cement manufacturing process to calculate emission rates, it was found that the use of selected emission factors was a simpler and less costly method. Implementing the steps described above will

138 Afr. J. Environ. Sci. Technol.
Figure 8. Location of optimised sampling points in relation to point sources (location indicated using Google Earth, 2011).
Figure 9. Location of optimised sampling points in relation to fugitive sources.
N
N
N

contribute to optimisation of the fall out dust monitoring program at a cement manufacturing plant and any such similar plant with significant benefits for environmental planning and management. REFERENCES Ade-Ademilua OE, Obalola DA (2008). The effect of Cement Dust
Pollution on Celosia Argentea (Lagos Spinach) Plant. J. Environ. Sci. Technol. 6(22):1-24.
Arizona Department of Environmental Quality Air (ADEQ) (2004). Dispersion Modeling Guidelines for Arizona Air Quality Permits. Air quality division 1.2:5.
ASTM (2004). Standard Test Method for Collection and Measurement of Dustfall (Settleable Particulate Matter). American Society for Testing and Materials - ASTM D1739/ 98.
Bilen S (2010). Effect of cement dust pollution on microbial properties and enzyme activities in cultivated and no-till soils. Afr. J. Microbiol. Res. 4(22):2418-2425.
Davis WT (2000). Air Pollution Engineering Manual. United States of America.: John Wiley and Sons, Inc.
Gbadebe AM, Bankole OD (2007). Analysis of Potential Toxic Metals in Airborne Cement Dust Around Sagamu, Southwestern Nigeria. J. Appl. Sci. 7(1):35-40.
International Standards Organisation (2003). Stationary source emissions — Determination of concentration and mass flow rate of particulate material in gas-carrying ducts — Manual gravimetric method. International Organisation for Standardisation. ISO 9096.
Knight MS (2007). Historic air quality monitoring data review and proposed air quality monitoring plan – A report for the Asperance Port Authority [Online]. Available from: http://www.esperanceport.com.au/downloads/.../NickelShiploading_12Nov07.pdf [Accessed: 21/02/2009].
Engelbrecht et al. 139 Lakes Environmental (2008). Screen View™ - Freeware [Online].
Available from: http//www.environmental- expert.com/stse _resulteach_product.aspx. [Accessed: 25/10/ 2010].
Loans C (2007). Fall-out dust levels around two enterprises in the Western Cape of South Africa from 2001-2005 [Online]. Available from:http://wiredspace.wits.ac.za/bitstream/handle/10539/4792/Research%20Report%20-%20MPH%20-%20Chris%20Loans%20-%200416886J.pdf?sequence=1 [Accessed: 18/10/2009]. 2-3.
Lodge JP (1988). Methods of air sampling and analysis. New York USA: CRC Press. Sans (2005). South African National Standard. Ambient Air quality – Limits for common pollutants. SANS 1929:2005 Edition 1.1, Pretoria, South African Bureau of Standards.
South Africa (2007). The National Framework for Air Quality Management in the Republic of South Africa. pp.36-37.
Tijani AA, Ajobo O, Akinola AA (2005). Cement Production Externalities and Profitability of Crop Enterprises in Two Local Government Areas of Ogun State. Department of Agricultural Economics. 11(1):43-48.
US Epa (1995). Compilation of Air Pollutant Emission Factor. States Environmental Protection Agency, Office of Air Quality Planning and Standards. Volume 1: Stationary Point and Area Sources, fourth edition, AP-42. Section 11.6 Portland Cement Manufacturing [Online]. Available from: http://www.epa.gov/ttn/chief/ap42.html. [Accessed: 25/08/2010].
Vallero DA (2008). Fundamentals of Air Pollution. 4th ed. Academic press. p.469.
Vincent K, Passant N (2006). Assessment of heavy metal concentrations in the United Kingdom [Online]. Available from: http://www.uk-air.defra.gov.uk/reports/cat16/ 0604041205_heavy_ metal_issue1_final.pdf. [Accessed: 06/02/2010].