optimisation of urea complexation by box-behnken...
TRANSCRIPT

Sains Malaysiana 39(5)(2010): 795–803
Optimisation of Urea Complexation by Box-Behnken Design(Pengoptimuman Pengkompleksan Urea Menggunakan Reka Bentuk Box-Behnken)
CHIN YOONG FEI, JUMAT SALIMON* & MAMOT SAID
ABSTRACT
Urea complexation is a method favoured by researchers to separate fatty acids based on molecular structure. In this study, effects of urea amount, crystallisation temperature and crystallisation time on the final products of urea complexation were examined. Box-Behnken Design (BBD) was employed to study the significance of these factors and the optimum conditions for the technique were predicted and verified. Results showed that urea-to-polyunsaturated fatty acid (PUFA) mole ratio and crystallisation temperature were two significant variables for enrichment of PUFA in non-urea complexing fraction (NUCF). In a 17-point experimental design, percentage of saturated fatty acid (SFA) was reduced almost entirely from initial 4.49%, monounsaturated fatty acid (MUFA) reduced from 57.02% to 41.32%, while PUFA increased from 33.49% to 53.87% in NUCF. Optimum condition for maximum PUFA and minimum SFA and MUFA contents was predicted at urea-to-PUFA mole ratio of 20, crystallisation temperature of –20°C and crystallisation time of 29.67 h.
Keywords: Box-Behnken design (BBD); optimisation; polyunsaturated fatty acid (PUFA); urea complexation
ABSTRAK
Pengkompleksan urea merupakan kaedah yang sering digunakan oleh para penyelidik untuk memisahkan campuran asid lemak berdasarkan struktur molekul. Dalam kajian ini, kesan amaun urea, suhu penghabluran dan tempoh penghabluran terhadap hasil akhir pengkompleksan urea telah dikaji. Reka bentuk Box-Behnken (BBD) telah digunakan untuk mengkaji signifikasi faktor-faktor ini. Keadaan optimum faktor-faktor ini telah diramal dan disahkan. Keputusan menunjukkan nisbah mol urea-kepada-asid lemak poli tak tepu (PUFA) serta suhu penghabluran merupakan dua pembolehubah yang signifikan bagi peningkatan kandungan PUFA di dalam fraksi bukan pengkompleks urea (NUCF). Dalam suatu reka bentuk eksperimen 17 titik, hampir kesemua asid lemak tepu (SFA) telah disingkirkan daripada peratusan asal 4.49%, asid lemak mono tak tepu (MUFA) telah dikurangkan daripada 57.02% kepada 41.32%, manakala PUFA telah ditingkatkan daripada 33.49% kepada 53.87% di dalam NUCF. Keadaan optimum bagi pengasingan PUFA yang maksimum dan kandungan SFA dan MUFA yang minimum telah diramalkan pada nisbah mol urea-kepada-PUFA sebanyak 20 mol, suhu penghabluran –20°C dan tempoh penghabluran selama 29.67 jam.
Kata kunci: Asid lemak poli tak tepu (PUFA); pengkompleksan urea; pengoptimuman; reka bentuk Box-Behnken (BBD)
INTRODUCTION
The importance of polyunsaturated fatty acids (PUFA) in human nutrition and their effects has been widely reported and reviewed (Albertazzi & Coupland 2002; Diniz et al. 2004; Nageswari et al. 1999; Roynette et al. 2004). Most of these researches focused on the omega-3 and omega-6 fatty acids as these fatty acids are not synthesised by human body and have to be acquired through diet. These PUFA, which include linoleic and linolenic acids are classified as essential fatty acids (EFA) and play roles as precursors to hormone-like compounds known as eicosanoids. Eicosanoids are involved in many important biological processes in the human body (Shahidi & Wanasundara 1998). Linoleic acid is widely present in most vegetable oils, especially corn and sunflower oils, while major sources of linolenic acid are soybean and canola oils and leafy green vegetables (Hu 2001).
Among various methods to produce PUFA concentrates, the urea complexation is considered the simplest and most efficient technique for obtaining omega-3 PUFA concentrates in the form of free fatty acids (FFA). The process is considered simple, quick, inexpensive, robust, and environmental friendly (Hayes et al. 1998; Wanasundara & Shahidi 1999). This technique is widely used to separate mixtures of fatty acids according to their degree of unsaturation, or to separate straight-chained from branched acids. The other methods to fractionate PUFA are chromatographic methods, distillation method, enzymatic methods, low-temperature crystallisation and supercritical fluid extraction. However, these methods are slow, inefficient, expensive and often difficult to scale up (Hayes et al. 1998; Shahidi & Wanasundara 1998). In the present study, urea complexation was used to increase the content of PUFA (particularly linoleic and

796
linolenic acids) from a mixture of FFA. Box-Behnken Design (BBD) was used to evaluate the effect of three factors, i.e. urea-to-PUFA-mole ratio (X1), crystallisation temperature (X2), and crystallisation time (X3) on urea complexation. Fatty acids present in urea complexed fraction (UCF) and non-urea complexing fraction (NUCF) were analysed. The focus was on enriching PUFA, mainly C18:2 and C18:3 in vegetable oil. Box-Behnken Design was chosen as the experimental model as this design is deemed rotatable but requires fewer design points, design points are within the original factor ranges.
MATERIALS AND METHODS
The FFA mixture used in this research was hydrolysed from canola-sunflower oil blend that was produced by a local edible oil manufacturer. Fatty acid methyl ester (FAME) standards were purchased from Sigma. All chemicals used were of analytical grade. Saponification of oil was done according to methods by Syed Rahmatullah et al. (1994) and Senanayake and Shahidi (1999) with modifications. The oil was saponified with 1 N potassium hydroxide in aqueous ethanol 95% (v/v) and the unsaponifiable matters were extracted by n-hexane and discarded. Distilled water was added to the soap and then acidified with 6 N hydrochloric acid to release the FFA. These FFA were extracted three times, each by using 50 mL n-hexane. The combined solvent was washed with distilled water and dried over anhydrous sodium sulphate. Solvent was removed by rotary evaporator at 45°C and the FFA converted to FAME for GC analysis according to PORIM Method p3.4 (1995) (Siew et al. 1995). Fatty acid profile was analysed with Shimadzu GC-17A with a BPX70 column (30 m × 0.25 mm × 0.25 μm). Injection and detection (FID) temperatures were set at 260°C and 280°C, respectively and nitrogen was used as the carrier gas with flow rate of 0.3 mL/min. The split ratio was 1:39. BBD was used to create an experimental design with 17 design points. Three variables evaluated were urea-to-PUFA mole ratio, X1, crystallisation temperature, X2, and crystallisation time, X3. Table 1 shows a 17-trial experimental design with the three variables tested at three coded level, i.e. low (–1), middle (0) and high (+1). The coded values for urea-to-PUFA mole ratio (actual values in brackets) were: –1 (10.0), 0 (15.0), +1 (20), for crystallisation temperature: –1 (–20°C), 0 (5°C), +1 (30°C), and for crystallisation time: –1 (6 hr), 0 (27 hr), +1 (48 hr). All experiments were carried out randomly to minimise the effect of unexplained variability in the observed responses due to extraneous factors (Wanasundara & Shahidi 1999). Urea complexation was performed by dissolving 250 to 500 mmol of urea in 100 mL of ethanol by heating. After a clear, homogeneous solution had formed, 75 mmol of fatty acid was added into the solution with continuous stirring. The mixture was allowed to cool to
room temperature and then stored at different temperature (–20 to 30°C) for different duration (6 to 48 h) for further crystallisation according to the experimental design. All the samples were taken out from storage according to the experimental duration and filtered through sintered glass. The liquid NUCF were added an equal amount of distilled water and acidified with 6 N hydrochloric acid to between pH 4 and 5. It was then extracted 3 times with 30 mL of n-hexane. The combined n-hexane was then washed 3 times to remove remaining urea in the n-hexane and dried over anhydrous sodium sulphate. UCF of all samples were also collected and dissolved in distilled water. n-Hexane was used to extract the fatty acids in UCF. Solvent in all fatty acid samples (NUCF and UCF) were removed by rotary evaporator at 45°C and the fatty acid recovered were weighed and transformed into FAME for gas chromatography analyses. Design-Expert version 6.0.10 was used to analyse the data of urea complexation by fitting all the data to suitable regression models.
RESULTS AND DISCUSSION
The initial fatty acid mixture hydrolysed from the canola-sunflower oil blend was composed of 4.49% of palmitic (C16:0), 57.02% of oleic (C18:1), 27.65% of linoleic (C18:2) and 5.84% of linolenic (C18:3) acids. Other minor fatty acids made up the remaining composition of the fatty acid mixture. Average molecular weight of the fatty acids was 279.7 as obtained from saponification test of the original oil blend. Out of 75 mmol of FFA used in the samples, one-third or 25 mmol was PUFA (C18:2 and C18:3). Table 1 shows fatty acid composition in the UCF. Compared to the starting material, saturated fatty acid (SFA) percentage was significantly higher while PUFA was lower in all the samples. Highest percentage of SFA (27.2%) was observed for sample treated with 10 urea/PUFA ratio (mol/mol) at 5°C for 48 hours. This sample also had the lowest percentage of PUFA (8.84%) incorporated into urea complex. Samples loaded with highest amount of urea had the lowest percentages of SFA in UCF. Inclusion of more PUFA into UCF reduced the percentage of SFA in these samples. Table 1 shows data obtained from the experiment on fatty acid composition in the NUCF of all the samples. Results showed that the percentage of PUFA has increased to as much as 53.87% from 33.49% while SFA has been reduced considerably compared to the initial FFA mixture. In high-urea samples, the elimination of SFA was near completion in NUCF. However, total removal of SFA by urea complexation may be impossible because some of the SFA do not complex with urea during crystallisation (Liu et al. 2006; Shahidi & Wanasundara 1998). The results obtained from the experiment were analysed with linear or quadratic regression models. When any of these models were found to be insignificant

797
TAB
LE 1
. Box
-Beh
nken
Des
ign
arra
ngem
ent a
nd re
spon
ses f
or u
rea
com
plex
ing
frac
tion
(UC
F) a
nd n
on-u
rea
com
plex
ing
frac
tion
(NU
CF)
Varia
ble
leve
lsR
espo
nses
, YU
rea
com
plex
ing
frac
tion
(UC
F)N
on-u
rea
com
plex
ing
frac
tion
(NU
CF)
Run
no
.U
rea/
PUFA
a
(X1)
Tem
pb
(X2)
Tim
ec
(X3)
C16
:0(%
)C
18:0
(%)
Y 1, SF
A(C
16:0
+ C
18:0
) (%
)
C18
:2(%
)C
18:3
(%)
Y 2, M
UFA
C
18:1
(%
)
Y 3, PU
FA
(C18
:2 +
C18
:3)
(%)
Y 4, SF
A
C16
:0
(%)
Y 5, M
UFA
C
18:1
(%
)
C18
:2(%
)C
18:3
(%)
Y 6, PU
FA
(C18
:2 +
C18
:3)
(%)
110
3027
14.2
38.
3022
.53
10.7
42.
0656
.69
12.8
01.
4053
.94
32.8
07.
0439
.84
215
527
10.8
45.
1916
.03
9.79
1.87
66.3
811
.66
0.32
47.9
739
.07
8.23
47.3
03
20 –
20
278.
943.
8212
.76
11.1
12.
0868
.80
13.1
9n.
d41
.32
44.4
29.
4553
.87
415
527
11.3
65.
3916
.75
9.28
1.71
66.1
810
.99
0.35
48.1
438
.03
8.01
46.0
45
205
69.
774.
1313
.90
10.5
01.
9668
.72
12.4
60.
7643
.59
41.1
68.
8149
.97
610
–20
2712
.36
6.23
18.5
910
.07
1.93
61.7
212
.00
0.69
49.7
636
.25
7.66
43.9
17
105
613
.78
7.29
21.0
710
.13
1.95
58.8
812
.08
0.88
53.3
934
.50
7.24
41.7
48
155
2710
.71
5.14
15.8
510
.54
1.98
66.0
712
.52
0.31
47.5
239
.26
8.38
47.6
49
105
4817
.26
9.94
27.2
07.
421.
4255
.15
8.84
1.36
53.6
433
.82
7.06
40.8
810
205
489.
674.
4714
.14
9.12
1.64
69.1
610
.76
n.d.
43.9
442
.69
8.91
51.6
011
1530
612
.45
5.93
18.3
89.
921.
8562
.64
11.7
70.
4850
.34
37.0
47.
6844
.72
1215
–20
4811
.29
5.03
16.3
28.
571.
5666
.43
10.1
3n.
d.46
.92
40.1
48.
4448
.58
1320
3027
9.64
4.52
14.1
612
.00
2.25
66.3
814
.25
0.38
45.7
240
.49
8.72
49.2
114
155
2710
.44
4.59
15.0
312
.36
2.39
65.5
214
.75
0.33
47.4
639
.42
8.46
47.8
815
155
2710
.64
4.87
15.5
19.
581.
7967
.47
11.3
7n.
d.45
.88
41.0
68.
8849
.94
1615
–20
610
.73
4.96
15.6
99.
611.
7866
.90
11.3
90.
2246
.66
39.6
58.
3948
.04
1715
3048
14.1
67.
0821
.24
7.53
1.38
60.1
58.
910.
6251
.70
35.8
67.
4043
.26
C16
:0, p
alm
itic
acid
; C18
:0, s
tear
ic a
cid;
C18
:1, o
leic
aci
d; C
18:2
, lin
olei
c ac
id; C
18:3
, lin
olen
ic a
cid;
SFA
, sat
urat
ed fa
tty a
cid;
MU
FA, m
onou
nsat
urat
ed fa
tty a
cid;
PU
FA, p
olyu
nsat
urat
ed fa
tty a
cid;
n.d
., no
t det
ecte
da u
rea-
to-p
olyu
nsat
urat
ed fa
tty a
cid
(PU
FA) r
atio
(mol
/mol
);b c
ryst
allis
atio
n te
mpe
ratu
re (°
C);
c cry
stal
lisat
ion
time
(h);

798
to represent the data, minor modification was made on the models for better representation of data. Responses studied were SFA, monounsaturated fatty acid (MUFA), and PUFA percentages in both NUCF and UCF. All responses were fitted in quadratic regression model, except data for PUFA in NUCF and PUFA in UCF that were fitted in linear regression model and modified quadratic regression model respectively. Table 2 shows regression coefficients of predicted models for all the responses. The lack of fit F-value for all the responses showed that the lack of fit is not significant (p>0.05) relative to the pure error. This indicates that all the models predicted for the responses were adequate. Regression models for data on responses Y1, Y2, Y4, Y5, and Y6 were highly significant (p<0.01) with satisfactory R2. However R2 for Y3 was lower although the model was significant. Table 3 summarizes the analysis of variance (ANOVA) of all the responses of this study. For the content of SFA in UCF, linear terms of urea-to-PUFA ratio, crystallization temperature and quadratic term of crystallization time were highly significant (p<0.01) and linear term of crystallization time and interaction between urea-to-PUFA ratio and crystallization time were significant (p<0.05). Highly significant (p<0.01) terms of MUFA content in UCF were linear, while urea-to-PUFA ratio was quadnatic and of crystallization time was linear. Quadratic term of crystallization time was also significant (p<0.05) for MUFA content in UCF. As for PUFA content
in UCF, linear term of crystallization time was significant (p<0.05) while its quadratic term was highly significant (p<0.01). In NUCF, linear terms of urea-to-PUFA ratio and crystallization temperature, quadratic term of crystallization time, and interaction between urea-to-PUFA ratio and crystallization time were highly significant (p<0.01). Linear terms of urea-to-PUFA ratio and crystallization temperature and quadratic term of crystallization time were highly significant (p<0.01) for MUFA content in NUCF, while linear term of crystallization time was also significant at p<0.01. Lastly, linear terms of urea-to-PUFA ratio and crystallization temperature were highly significant (p<0.01). In all but one of all the responses, linear terms of urea-to-PUFA ratio and crystallization temperature were found to be highly significant. These results suggest that linear effect of urea ratio and crystallization temperatures are the primary determining factors for fatty acid separation by urea complexation. Liu et al. (2006) also concluded that these two variables had a very large effect on the results of their urea complexation study. Crystallization time was found to be the insignificant factor (P>0.05). This finding is in agreement with the results reported by other researchers that also concluded that crystallization time was not significant for the concentration of omega-3 fatty acids (Liu et al 2006; Wanasundara & Shahidi 1999). Final equation in terms of actual factors are:
TABLE 2. Regression coefficients of predicted models for response variables in urea complexation experiment of canola-sunflower fatty acids
VariablesCoefficients
SFA in UCF (%) (Y1)
MUFA in UCF (%) (Y2)
PUFA in UCF (%) (Y3)
SFA in NUCF (%) (Y4)
MUFA in NUCF (%) (Y5)
PUFA in NUCF (%) (Y6)
Intercept Linear
+34.89935 +36.52991 +14.54847 +3.89897 +67.76821 +34.27416
X1 –1.86431*** +3.12523*** –0.64870 –0.46204*** –1.49230*** +0.88150***X2 +0.11223*** –0.13059*** +0.00256400 +0.015637*** +0.065969*** –0.08685***X3 +0.010207** –0.016689 +0.17462** +0.029010 –0.27826** –0.018869QuadraticX11 +0.046920 –0.080080*** +0.025740 +0.015510*** +0.015420 –X22 +0.00000480000 –0.00151920 +2.53600 –0.0000516000 –1.51200 –X33 +0.00469501*** –0.00304875** –0.00423243*** +0.000227324 +0.00364059*** –Interaction X12 –0.00508000 +0.00542000 – –0.000660000 +0.000440000 –X13 – 0.014024** +0.00992857 – –0.00295238*** +0.00733333 –X23 +0.00106190 –0.000961905 – +0.000171429 +0.000523810 –X123 – – – – – –R2 0.9652 0.9692 0.7225 0.9656 0.9811 0.8854
X1 = urea-to-PUFA-mole ratio; X2 = crystallisation temperature; X3 = crystallisation time**P<0.05, ***P<0.01.

799
Y1 = 34.89935 – 1.86431X1 + 0.11223X2 + 0.010207X3 + 0 . 0 4 6 9 2 0 X 1
2 + 0 . 0 0 0 0 0 4 8 0 0 0 0 X 22 +
0.00469501X32 – 0.00508000X1X2 – 0.014024X1X3
+ 0.00106190X2X3
Y2 = 36.52991 + 3.12523X1 – 13.059X2 – 0.016689X3 – 0.080080X1
2 – 0.00151920X22 + 0.00304875X3
2 + 0 .00542000X 1X 2 + 0 .00992857X 1X 3 – 0.000961905X2X3
Y3 = 14.54847 – 0.64870X1 + 0.00256400X2 + 0.17462X3 + 0.025740X1
2 + 2.53600X22 + 0.00423243X3
2
Y4 = 3.89897 – 0.46204X1 + 0.015637X2 + 0.029010X3 + 0.015510X1
2 + 0.0000516000X22 + 0.000227324X3
2 – 0 .000660000X 1X 2 – 0 .00295238X 1X 3 + 0.000171429X2X3
Y5 = 67.76821 – 1.49230X1 + 0.065969X2 – 0.27826X3 + 0.015420X1
2 – 1.51200X22 + 0.00364059X3
2 – 0 .000440000X 1X 2 – 0 .00733333X 1X 3 + 0.000523810X2X3
Y6 = 34.27416 + 0.88150X1 – 0.08685X2 – 0.018869X3
Figures 1 to 6 are the Design-Expert plots for all the responses. In the solid UCF, performing the technique using low amount of urea without cooling would give the desired
high percentage of SFA as shown in Figure 1. MUFA (Figure 2) and PUFA (Figure 3) concentrations were also lower at this condition. However, by increasing the amount of urea and reducing crystallization temperature, more MUFA and PUFA would form urea adduct, reducing recoverable quantity of these unsaturated fatty acids in NUCF.
TABLE 3. Analysis of variance (ANOVA) of all the responses
Responses Degree of Freedom Sum of Squares Mean Square F-Value Prob>FY1 Model
ResidualLack of fitPure error
9734
217.957.866.231.63
24.221.122.080.41
21.58
5.10
0.0003
0.0748
Y2 ModelResidualLack of fitPure error
9734
291.479.277.222.05
32.391.322.410.51
24.46
4.70
0.0002
0.0845
Y3 ModelResidualLack of fitPure error
61064
29.4011.292.269.03
4.901.130.382.26
4.34
0.17
0.0205
0.9728
Y4 ModelResidualLack of fitPure error
9734
2.910.10
0.0170.087
0.320.015
5.708 × 10⁻³
0.022
21.82
0.26
0.0003
0.8491
Y5 ModelResidualLack of fitPure error
9734
191.763.690.483.20
21.310.530.160.80
40.47
0.20
< 0.0001
0.8902
Y6 ModelResidualLack of fitPure error
31394
194.3825.1617.217.95
64.791.941.911.99
33.48
0.96
< 0.0001
0.5616
FIGURE 1. Response surface for the effect of urea-to-PUFA ratio and crystallisation temperature on SFA in UCF.
Crystallisation time = 27 h
800
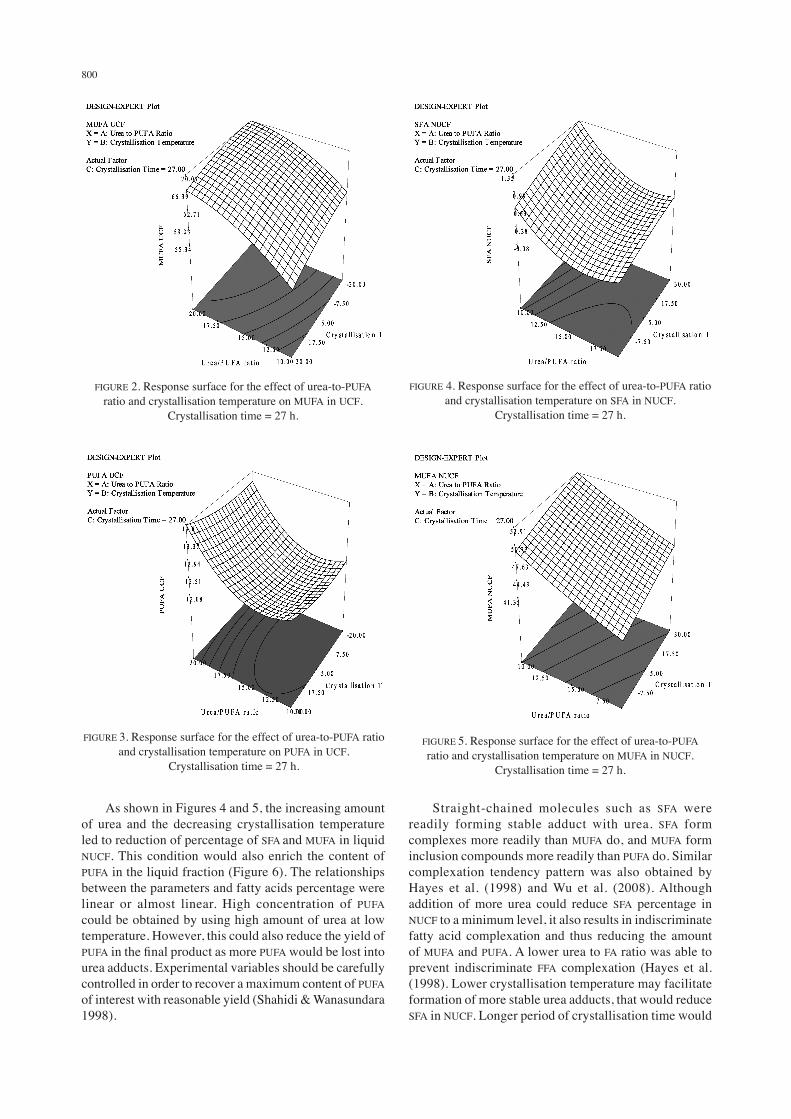
As shown in Figures 4 and 5, the increasing amount of urea and the decreasing crystallisation temperature led to reduction of percentage of SFA and MUFA in liquid NUCF. This condition would also enrich the content of PUFA in the liquid fraction (Figure 6). The relationships between the parameters and fatty acids percentage were linear or almost linear. High concentration of PUFA could be obtained by using high amount of urea at low temperature. However, this could also reduce the yield of PUFA in the final product as more PUFA would be lost into urea adducts. Experimental variables should be carefully controlled in order to recover a maximum content of PUFA of interest with reasonable yield (Shahidi & Wanasundara 1998).
Straight-chained molecules such as SFA were readily forming stable adduct with urea. SFA form complexes more readily than MUFA do, and MUFA form inclusion compounds more readily than PUFA do. Similar complexation tendency pattern was also obtained by Hayes et al. (1998) and Wu et al. (2008). Although addition of more urea could reduce SFA percentage in NUCF to a minimum level, it also results in indiscriminate fatty acid complexation and thus reducing the amount of MUFA and PUFA. A lower urea to FA ratio was able to prevent indiscriminate FFA complexation (Hayes et al. (1998). Lower crystallisation temperature may facilitate formation of more stable urea adducts, that would reduce SFA in NUCF. Longer period of crystallisation time would
FIGURE 2. Response surface for the effect of urea-to-PUFA ratio and crystallisation temperature on MUFA in UCF.
Crystallisation time = 27 h.
FIGURE 3. Response surface for the effect of urea-to-PUFA ratio and crystallisation temperature on PUFA in UCF.
Crystallisation time = 27 h.
FIGURE 4. Response surface for the effect of urea-to-PUFA ratio and crystallisation temperature on SFA in NUCF.
Crystallisation time = 27 h.
FIGURE 5. Response surface for the effect of urea-to-PUFA ratio and crystallisation temperature on MUFA in NUCF.
Crystallisation time = 27 h.

801
allow the crystals for further stabilisation. The parameters would have to be set at a reasonable level to achieve an acceptable yield of product with desired purity. Higher purity of PUFA will always give lower yield of NUCF. Optimum conditions of the experiment to obtain maximum concentration of PUFA and minimum concentration of both SFA and MUFA were predicted at urea-to-PUFA mole ratio of 20, crystallisation temperature of –20°C and 29.67 h of crystallisation time. At this condition, the final NUCF was predicted to contain 0% of
FIGURE 6. Response surface for the effect of urea-to-PUFA ratio and crystallisation temperature on PUFA in NUCF.
Crystallisation time = 27 h.
Actual
Pred
icte
d
FIGURE 7. Predicted vs. actual plot of Y1
SFA (C16:0), 41.52% of MUFA (C18:1) and 53.08% of PUFA (C18:2 and C18:3). Performing a verification experiment gave the result of 38.36% of C18:1, 47.49% of C18:2, and 10.34% of C18:3 (total C18:2 and C18:3 is 57.83%) with the NUCF yield of 41.53%. The observed value was reasonably close to the predicted value as shown in Figures 7-12.
Actual
Pred
icte
d
FIGURE 8. Predicted vs. actual plot of Y2
Actual
Pred
icte
d
FIGURE 9. Predicted vs. actual plot of Y3

802
CONCLUSION
Urea complexation is a common method used to separate a mixture of fatty acids based on their molecular structure. Straight-chained molecules are more readily forming urea adducts compared to branched or bend molecules such as linoleic acid. Factors that influence the fatty acid composition of the products include urea amount, crystallisation temperature, and crystallisation time. All of these factors have to be controlled to yield a reasonable
amount of product with a desirable purity of fatty acid of interest.
ACKNOWLEDGMENTS
This study was carried out with the support of Universiti Kebangsaan Malaysia via UKM-GUP-NBT-08-27-113 research grant and also the Ministry of Science, Technology & Innovation (MOSTI), Malaysia via 05-01-02-SF0199 grant and scholarship.
REFERENCES
Albertazzi, P. & Coupland, K. 2002. Polyunsaturated fatty acids. is there a role in postmenopausal osteoporosis prevention. Maturitas 42: 13-22.
Diniz, Y.S.A.D., Cicogna, A.C., Padovani, C.R., Santana, L.S., Faine, L.A. & Novelli, E.L.B. 2004. Diet rich in saturated and polyunsaturated fatty acids: Metabolic shifting and cardiac health. Nutrition 20: 230-234.
Hayes, D.G., Bengtsson, Y.C., Van Alstine, J.M. & Setterwall, F. 1998. Urea complexation for the rapid, ecologically responsible fractionation of fatty acids from seed oil. Journal of the American Oil Chemists’ Society 75: 1403-1409.
Hu, F.B. 2001. The Balance Between Omega-6 and Omega-3 Fatty acids and the risk of coronary heart disease. Nutrition 17(9): 741-742.
Liu Shucheng, Zhang Chaohua, Hong Pengzhi & Ji Hongwu. 2006. Concentration of docosahexaenoic acid (DHA) and eicosapentaenoic acid (EPA) of tuna oil by urea complexation: optimization of process parameters. Journal of Food Engineering 73: 203-209.
Nageswari, K., Banerjee, R. & Menon, V.P. 1999. Effect of saturated, omega-3 and omega-6 polyunsaturated fatty acids on myocardial infarction. Journal of Nutritional Biochemistry 10: 338-344.
Actual
Pred
icte
d
FIGURE 10. Predicted vs. actual plot of Y4
ActualPr
edic
ted
FIGURE 12. Predicted vs. actual plot of Y6
Actual
Pred
icte
d
FIGURE 11. Predicted vs. actual plot of Y5

803
Roynette, C.E., Calder, P.C., Dupertuis, Y.M. & Pichard, C. 2004. n-3 Polyunsaturated fatty acids and colon cancer prevention. Clinical Nutrition 23: 139-151.
Senanayake, S.P.J.N. & Shahidi, F. 1999. Enzymatic incorporation of docosahexaenoic acid into borage oil. Journal of American Oil Chemists’ Society 76(9): 1009-1015.
Shahidi, F. & Wanasundara, N. 1998. Omega-3 fatty acid concentrates: Nutritional aspects and production technologies. Trends in Food Science & Technology 9: 230-240.
Siew Wai Lin, Tang Thin Sue & Tan Yew Ai. 1995. PORIM Test Methods Vol. 1. Bandar Baru Bangi: PORIM.
Syed Rahmatullah, M.S.K., Shukla, V.K.S. & Mukherjee, K.D. 1994. γ-Linolenic acid concentrates from borage and evening primrose oil fatty acids via Lipase-Catalyzed Esterification. Journal of American Oil Chemists’ Society 71(6): 563-567.
Wanasundara, U.N. & Shahidi, F. 1999. Concentration of omega 3-polyunsaturated fatty acids of seal blubber oil by urea complexation: optimization of reaction conditions. Food Chemistry 65: 41-49.
Wu Mingyi, Ding Hui & Wang Song. 2008. Optimizing Conditions for the Purification of Linoleic Acid from Sunflower Oil by Urea Complex Fractionation. Journal of American Oil Chemists’ Society 85: 677-684.
School of Chemical Sciences & Food TechnologyFaculty of Science & TechnologyUniversiti Kebangsaan Malaysia 43600 UKM BangiSelangor D.E. Malaysia
*Corresponding author; email: [email protected]
Received: 14 April 2009 Accepted: 10 December 2009