optimal treatment strategy in mcrc · schmoll h-j, et al. ann oncol 2012;23:2479
TRANSCRIPT

Optimal Treatment Strategy
in mCRC
Prof. V. Heinemann CCCLMU, Klinikum Grosshadern
Ludwig-Maximilian-University of Munich, Germany

Group Clinical presentation Treatment goal Treatment
intensity
GROUP 0 Clearly R0-resectable liver and/or
lung metastases
Cure, decrease
risk of relapse
Nothing or
moderate
(FOLFOX)
GROUP 1
Not R0-resectable liver and/or
lung metastases only, may become
resectable after induction CT
Maximum
tumor shrinkage
Upfront most
active
combination
GROUP 2 Multiple metastases/sites, with rapid progression and/or tumor-related symptoms
Clinically relevant
tumor shrinkage
as soon as possible,
control PD
Upfront active
combination: at
least doublet
GROUP 3
- Multiple metastases/sites,
- no option for resection
- initially asymptomatic,
- less aggressive disease
- unfit
Prevent further
progression, low
toxicity
Watchful waiting
or sequential
approach (triplet
regimens only in
selected patients)
Clinical ESMO Groups 0 - 3
Schmoll H-J, et al. Ann Oncol 2012;23:2479–2516

How to procede in
resectable mCRC
(Group 0)
Goals: cure, prolongation of DFS and OS

Perioperative Chemotherapy in resectable liver metastasis
Perioperative
Chemo
Primary
Surgery Significance
3-year-PFS
resected patients 42.4% 33.2%
HR=0.73
P=0.025
3-year-PFS
eligible patients 36.2% 28.1%
HR=0.77
P=0.041
5-year OS rate eligible patients
52.4% 48.3% n.s.
Median OS HR = 0.88 (95% CI 0.68-1.14) n.s.
Nordlinger et al. Lancet 2008
Nordlinger, ASCO 2012, #3508
Surgery 6 x FOLFOX4 6 x FOLFOX4
Surgery
R primary endpoint = PFS ( ≤HR 0.71)
n = 364
Median Follow-up = 8.5 years
Neoadjuvant chemotherapy in resectable metastases has only been
investigated as a perioperative treatment

(years)
0 1 2 3 4 5 6
0
10
20
30
40
50
60
70
80
90
100
O N Number of patients at risk : Treatment
125 171 83 57 37 22 8
115 171 115 74 43 21 5
Surgery
Pre&Postop CT
Progression-free survival in eligible patients Nordlinger et al. Lancet 2008
HR= 0.77; CI: 0.60-1.00, p=0.041
LV5FU + Oxaliplatin Periop CT
28.1%
36.2%
+8.1% at 3 years
Surgery only

New EPOC Study: Trial Design in resectable and borderline resectable patients
Chemotherapy 12 weeks
Liver resection
Chemotherapy 12 weeks
Operable (including borderline operable)
colorectal liver metastases
Chemotherapy + Cetuximab 12 weeks
Liver resection
Chemotherapy + Cetuximab 12 weeks
R
Arm A (control)
Arm B (experimental)
Primrose J, et al. Lancet Oncology
Chemo
• FOLFOX (68% vs 67%)
• CAPOX (27% vs 24%)
KRAS wild-type
672 pts screened
272 pts randomised

New EPOC: Resectable liver metastasis
Primrose J, et al. Lancet Oncology 2014
Chemo
(n = 134)
Chemo +
Cetuximab
(n = 137)
Complete response 5.2% 5.1%
Partial response 48.5% 53.3%
ORR 54% 58%
Stable disease 19.4% 17.5%
Progressive disease 8.2% 7.3%
Not assessable 2.2% 1.5%
Message:
No advantage from the addition
of cetuximab in resectable
liver metastasis

Van Loon K, Venook AP JCO 2014
• 38 year old female patient
• KRAS wt, BRAF wt, MSS
• 13-cm lesion in the right liver lobe
with increased FDG-uptake
(SUVmax 11.8)
• Tumor in the hepatic flexure of
the colon with markedly
increased FDG uptake
Synchronous Liver Metastasis

Van Loon K, Venook AP JCO 2014
Plausible Treatment Paradigm for synchronous liver mets

Simultaneous Hepatopulmonary CRC Mets
Dave RV, et al. Br J Surgery 2014

How to procede in
initially non-resectable mCRC
(Group 1)
Goal: maximal tumor shrinkage = conversion to resectability
R0-resection;
prolongation of DFS and OS

total of 12 cycles
Chemotherapy +/- cetuximab in
unresectable liver metastasis
Chemo + Cet OP Chemo + Cet
Chemo OP Chemo
R N = 138
prim. endpoint = conversion to resection
total of 12 cycles

Le-Chi Ye, et al. JCO 2013
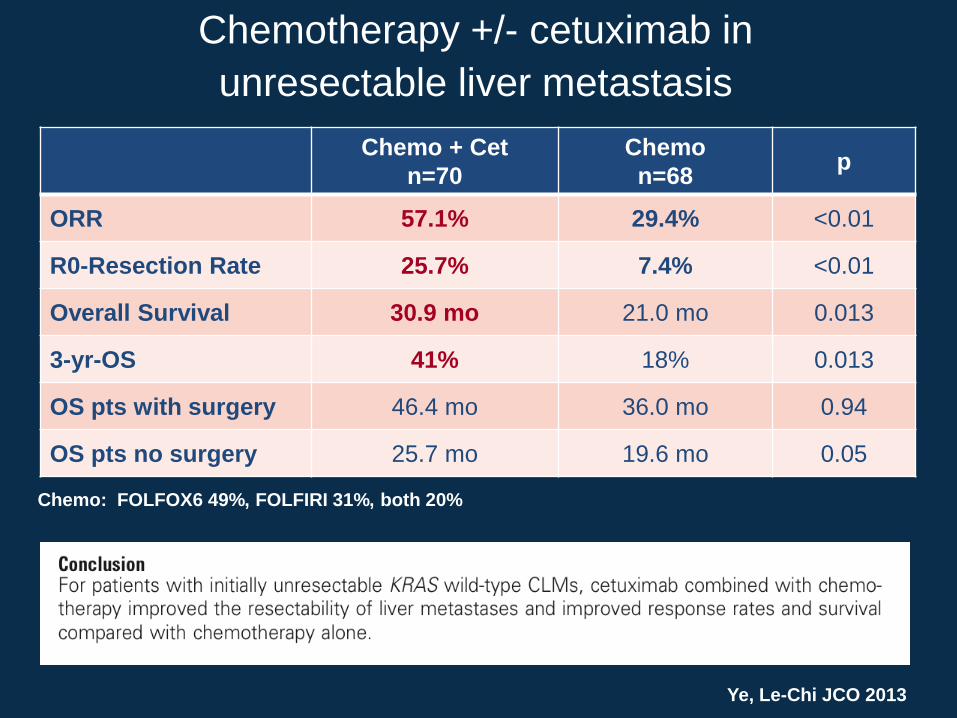
Chemotherapy +/- cetuximab in
unresectable liver metastasis
Chemotherapy: FOLFIRI or FOLFOX6
Chemo + Cet OP Chemo + Cet
Chemo OP Chemo
R N = 138
prim. endpoint = conversion to resection
total of 12 cycles
Chemo + Cet
n=70
Chemo
n=68 p
ORR 57.1% 29.4% <0.01
R0-Resection Rate 25.7% 7.4% <0.01
Overall Survival 30.9 mo 21.0 mo 0.013
3-yr-OS 41% 18% 0.013
OS pts with surgery 46.4 mo 36.0 mo 0.94
OS pts no surgery 25.7 mo 19.6 mo 0.05
Ye, Le-Chi JCO 2013
Chemo: FOLFOX6 49%, FOLFIRI 31%, both 20%
Chemotherapy +/- cetuximab in
unresectable liver metastasis

An optimal strategy is
to determine the RAS- and BRAF-
status of the tumor upfront
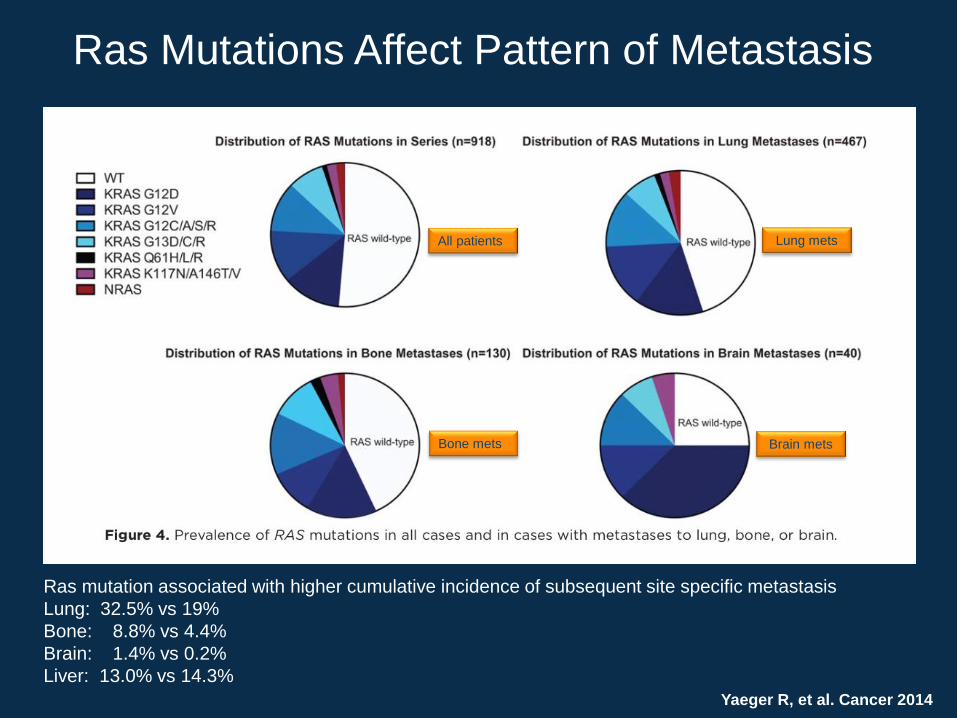
Ras Mutations Affect Pattern of Metastasis
Yaeger R, et al. Cancer 2014
All patients
Bone mets
Lung mets
Brain mets
Ras mutation associated with higher cumulative incidence of subsequent site specific metastasis
Lung: 32.5% vs 19%
Bone: 8.8% vs 4.4%
Brain: 1.4% vs 0.2%
Liver: 13.0% vs 14.3%

CRYSTAL: RAS wt selection extended the
ORR benefit with cetuximab + FOLFIRI
1. Van Cutsem E, et al. J Clin Oncol 2011;29:2011–2019
2. Ciardiello F et al. J Clin Oncol 32:5s, 2014 (suppl; abstr 3506)
3. Van Cutsem E, et al. Ann Oncol 2014;25(suppl 2):ii113
4. Erbitux SmPC June/2014
Resp
on
se r
ate
(%
)
0
10
20
30
40
50
60
70
FOLFIRI
(n=350)
Cetuximab +
FOLFIRI (n=316)
57
40
OR 2.069
p<0.001
Resp
on
se r
ate
(%
)
0
10
20
30
40
50
60
70
FOLFIRI
(n=189)
Cetuximab +
FOLFIRI (n=178)
66
39
OR 3.11
p<0.0001
*RAS evaluable in 430/666 (65%) patients with KRAS exon 2 wt
mCRC; RAS wt: 367/430 (85%), 5% sensitivity cut-off; cetuximab is
not indicated for the treatment of patients with mCRC whose tumors
have RAS mutations or for whom RAS tumor status is unknown4
KRAS exon 2 wt1 RAS wt* (subgroup)2,3

CRYSTAL: Cetuximab improves RR and R0 liver resection rate
in patients with both LLD and non-LLD (RAS wt)
LLD: liver-limited disease
0
10
20
30
40
50
60
70
80
90
100
Re
sp
on
se
(%
)
37
84
39
61
LLD Non-LLD
Odds ratio: 8.99
p<0.0001 Odds ratio: 2.44
p=0.0003
0
5
10
15
20
R0
re
se
cti
on
(%
)
7
16
Cet + CT
(n=43)
CT alone
(n=46)
Cet + CT
(n=135)
CT alone
(n=143)
Odds ratio: 2.68
p=0.179
Odds ratio: 5.94
p=0.04
4 1
Kohne CH, et al. Ann Oncol (2014) 25 (suppl 4): iv184 (541P)
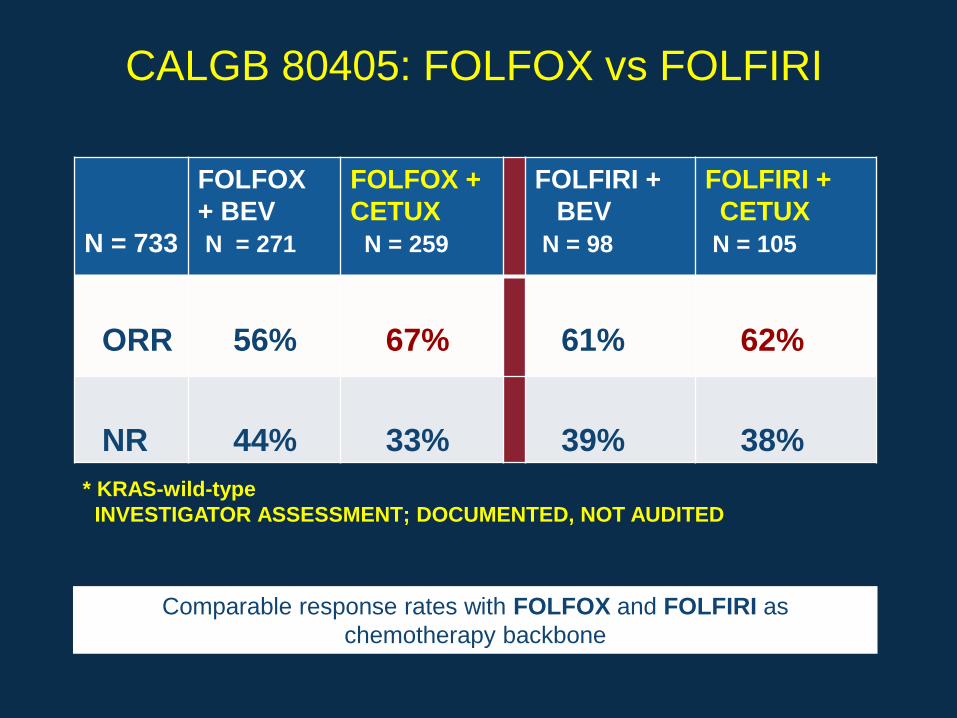
CALGB 80405: FOLFOX vs FOLFIRI
N = 733
FOLFOX
+ BEV
N = 271
FOLFOX +
CETUX
N = 259
FOLFIRI +
BEV
N = 98
FOLFIRI +
CETUX
N = 105
ORR
56%
67%
61%
62%
NR
44%
33%
39%
38%
* KRAS-wild-type
INVESTIGATOR ASSESSMENT; DOCUMENTED, NOT AUDITED
Comparable response rates with FOLFOX and FOLFIRI as
chemotherapy backbone

Effect of Targeted Therapy on Incremental
Response Rates
Cetuximab (RAS WT) Incremental
response rate
CRYSTAL (FOLFIRI) 27%
OPUS (FOLFOX) 29%
FIRE-3 (FOLFIRI)* 16%
CALGB (FOLFOX or FOLFIRI)* 15%
Panitumumab (RAS WT)
PRIME (FOLFOX) ?
*compared to chemotherapy + bevacizumab
Bevacizumab Incremental
response rate
AVF2107g (IFL) +10%
NO16966 (FOLFOX/XELOX) 0%
MAX2010 +8%
AVEX (Cape) +9%

Comparators Incremental
response rate
Falcone FOLFOXIRI 60%
FOLFIRI 34% 26%
Souglakos FOLFOXIRI 43%
FOLFIRI 34% 9%
TRIBE FOLFOXIRI + Bev 65%
FOLFIRI + Bev 53% 12%
OLIVIA FOLFOXIRI +Bev 81%
FOLFOX + Bev 65% 16%
Efficacy of Triplet Therapy

FOLFIRI
Cetuximab
FOLFOXIRI FOLFOXIRI
+ Bev
Study FIRE-3 Falcone TRIBE
Diarrhea 12 20 18
Neutropenia 24 50 49
Febrile Neutropenia 2 5 8
60-day mortality 0 2 4
Grade 3-4 Toxicity
Conversion therapy with FOLFOXIRI is feasible and effective, but is
associated with greater toxicity than FOLFIRI + cetuximab

Optimal Treatment of BRAF mutant mCRC
FOLFOXIRI + bevacizumab
Pooled analysis of 25 patients
Salvatore L, et al. ASCO 2012, #3585
PFS = 11.8 mo
OS = 23.8 mo
FIRE-3: FOLFIRI + cetuximab vs
FOLFIRI + bevacizumab in 48 patients
Stintzing S et al. ASCO-GI 2014
Optimal depth of response is an
important treatment goal in non-
resectable metastasis

Maximal depth of response is an important
treatment goal in initially unresectable metastasis
Lethal
tumor
load
Baseline
tumor
load
Time under treatment
OS
Early tumor shrinkage
Depth of response (smallest tumor size)
• DpR is the maximal tumor
shrinkage in 1st-line
• DpR correlates with overall
survival

FIRE-3: Head-to-head trial of cetuximab + FOLFIRI
vs bevacizumab + FOLFIRI in 1st line mCRC
Open-label, randomized, multicenter, Phase III investigator sponsored trial (IST)
Patients with untreated
KRAS exon 2 wt mCRC
N=592
R
Cetuximab + FOLFIRI
(n=297)
Bevacizumab + FOLFIRI
(n=295)
● Primary endpoint: ORR
● Secondary endpoints: PFS, OS, time to failure of strategy, depth of response, secondary resection rate, safety
● Amended October 2008 to include only patients with KRAS exon 2 wt mCRC
113 patients with KRAS exon 2 mt mCRC were enrolled before the amendment
● Retrospective RAS subgroup analysis (RAS-evaluable population, including both RAS wt and new RAS mt: n=407)
Heinemann V, et al. Lancet Oncol. 2014 Sep;15(10):1065-75

p = Fisher´s exact test (two-sided)
CT evaluable
population
FOLFIRI +
Cetuximab
FOLFIRI +
Bevacizumab
ORR % 95%-CI % 95%-CI Odds
ratio p
KRAS exon 2 wt
n= 493 66.5 60.1 – 72.5 55.6 49.3 – 61.8
1.58
(1.10-2.28) 0.016
Final RAS wt
n= 330 72.0 64.3 – 78.8 56.1 48.3 – 63.6
2.01
(1.27-3.19) 0.003
Independent evaluation
of response

FIRE-3: Evaluation of depth of
response (DpR) in RAS wt tumors
Stintzing S, et al. Ann Oncol 25 (Suppl 5): v1–v41, 2014
Cetuximab + FOLFIRI Bevacizumab + FOLFIRI
Median DpR, % -48.9 -32.3
p value <0.0001
Depth of response correlated significantly with OS and PFS (two-sided Bravais Pearson test)
Cetuximab + FOLFIRI
Bevacizumab + FOLFIRI
+20%
-30%
+100%
-100%
Median time to tumor nadir:
FOLFIRI + Cet: 15.0 weeks
FOLFIRI + Bev: 15.7 weeks

Therapeutic Strategy at the CCCM for resectable metastases
Resectable metastases
1 organ + limited
additional metastases
Surgery MTD decision
Resectable metastases
1 organ Surgery MTD decision
Resectable metastases
in liver and lung
2-stage
Surgery MTD decision
Based on the DpR concept, we believe that also surgical reduction of tumor
load is a valuable strategy to prolong OS

RAS
Mutant WT
good PS
Multidisciplinary
tumorboard
NO YES
Triplet plus
bevacizumab
Alberto Sobrero Amsterdam 2014
Therapeutic Strategy for primarily unresectable metastases based on RAS status
Doublet plus
bevacizumab
Multidisciplinary
tumorboard
FOLFOX/FOLFIRI + Cet
FOLFOX + Pani