optimal snow and ice control of parking lots and sidewalks · optimal snow and ice control of ......
TRANSCRIPT
Optimal Snow and Ice Control of
Parking Lots and Sidewalks
A Summary Final Report
iTSS Lab
Department of Civil & Environmental Engineering
University of Waterloo, Waterloo, N2L3G1
Ontario, Canada
January, 2015
i
Optimal Snow and Ice Control of Parking Lots and
Sidewalks
A Summary Final Report
by
Kamal Hossain, Ph.D., Postdoctoral Fellow and Liping Fu, Ph.D., P.Eng., Professor
iTSS Lab, Department of Civil & Environmental Engineering
University of Waterloo, Waterloo, N2L3G1
Ontario, Canada
January, 2015
ii
FOREWORD
This report summarizes the results from a three year research project entitled “Snow and Ice Control
for Parking Lots and Sidewalks (SICOPS)”. The document highlights the important findings from the
project along with a number of recommendations that can help maintenance contractors and government
agencies develop a cost-effective winter maintenance program for snow and ice control of parking lots and
sidewalks. The report is intentionally brief and concise so that it can be easily followed by winter
maintenance personnel in the field. Detailed discussions on the test results and the underlying methodology
are reported in various technical papers listed at the end of this report.
Over the project period, the project team conducted an extensive review of relevant literature, a
comprehensive survey of facility users, maintenance contractors, and government agencies, and a large
scale field experiment on a wide range of strategies, methods and materials. The field tests were conducted
at a parking lot and several sidewalks located in the City of Waterloo, Ontario over three winter seasons.
Approximately 5000 tests were conducted over nearly 100 winter snow events, covering a large number of
treatment combinations in terms of material types, maintenance strategies, and treatment techniques under
a wide range of winter weather conditions. The field data were then analyzed systematically using various
statistics for generating quantitative information about the effects of various factors on the snow melting
performance of different materials, rates and treatment methods. The major outcome of this effort is a
decision support tool for the selection of the most appropriate maintenance strategies, materials and
application rates to address the specific maintenance needs of any parking lots and sidewalks under any
winter events.
iii
ACKNOWLEDGEMENTS
The authors wish to acknowledge the financial and logistic support of many organizations from both
the public and the private sectors. These include Landscape Ontario, Metrolinx, Toronto Region
Conservation Authority (TRCA), The Region of Waterloo, Natural Sciences and Engineering Research
Council of Canada (NSERC), The University of Waterloo, Ontario Ministry of Transportation (MTO),
Snow and Ice Management Association (SIMA), and a number of private contractors from across Ontario.
The authors also wish to acknowledge the contributions of all graduate and co-op students and staffs
from several maintenance contractors and the University of Waterloo who participated in this multi-year
research project. It would not have been possible to complete this large-scale field experiment without the
sacrifices that they made during the harsh winters of 2011-2014.
From Industry: From University of Waterloo:
Raqib Omer, Viaesys Inc.
Robert Roszell, Road Equipment Links
William Jordan, Urban Meadows PMG
Tim Van Seters, Toronto and Region
Conservation Authority
Sharon Rumpel, Parking Services,
University of Waterloo
Jerry Hutten, Maintenance Operations,
University of Waterloo
Matthew Muresan, MASc Student
Michael Steward, Co-op student
Kylee McIntosh, Co-op student
Xuewen He, Co-op student ,
Borjas Husbun, Co-op student
Allyson Francis, Co-op student
Daniel Koetsier, Co-op student
Roberto (Alex) Lake, Co-op student
Brenton Law, Co-op student
Chi-Yin (Ann) Lu, Co-op student
Avalon Olsen, Co-op student
Nikhil Ramburrun, Co-op student
Ruby Xie, Co-op student
Andrew Zandbergen, Co-op student
Marc Johnson, Co-op student
Kan Wang, Co-op student
Zane Lamb, Co-op student
Shahriar Kabir, Co-op student
Paolo San Gabriel, Co-op student
Matt Kitchen, Co-op student
Yuheng Fei, Co-op student
David Moscoe, Co-op student
Shen Dian Li, Co-op student
Tommy Donnelly, Co-op student
Abraham Train, Co-op student
Raniel Chan, Co-op student
iv
TABLE OF CONTENTS
Background .............................................................................................................................. 1
Maintenance Techniques For Snow And Ice Control .............................................................. 1
2.1. Deicing ............................................................................................................................... 1
2.2. Anti-icing ........................................................................................................................... 2
2.3. Abrasives ........................................................................................................................... 2
Snow And Ice Control Materials ............................................................................................. 3
review of Current Winter Maintenance Practices .................................................................... 6
4.1. Survey of Winter Maintenance Contractors ...................................................................... 6 Summary of Major Findings ...................................................................................................................... 7
4.2. Survey of Municipalities .................................................................................................... 7 Summary of Major Findings:..................................................................................................................... 9
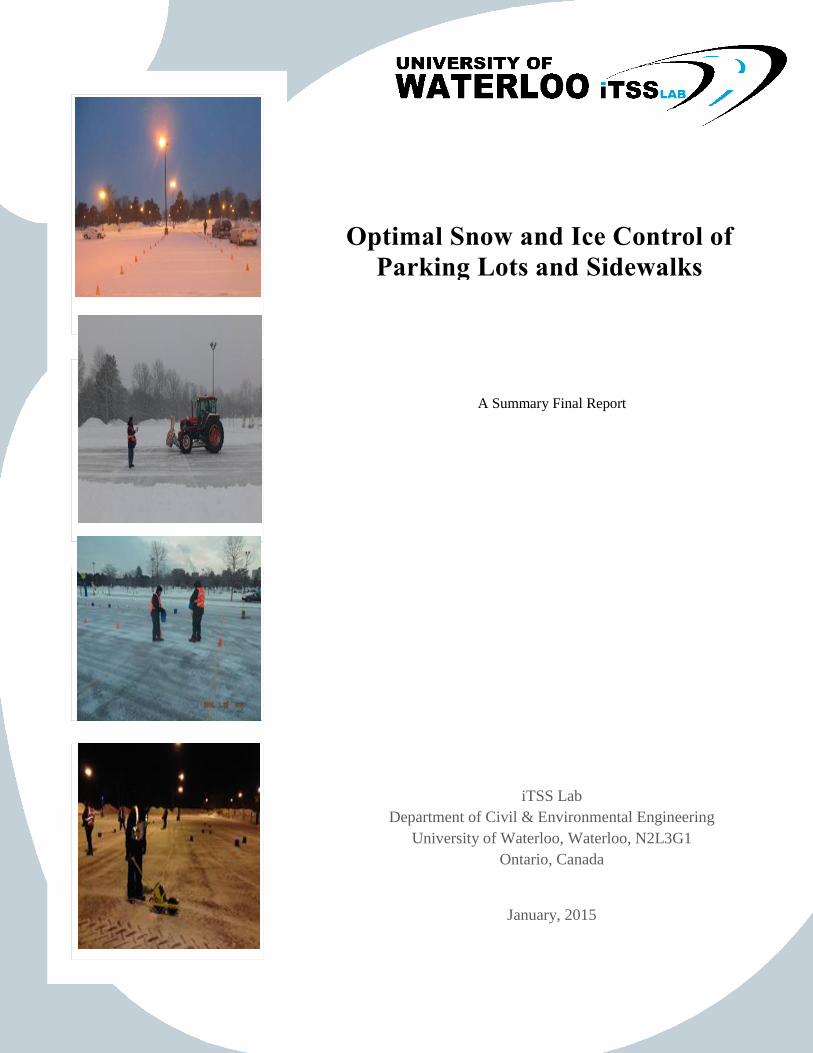
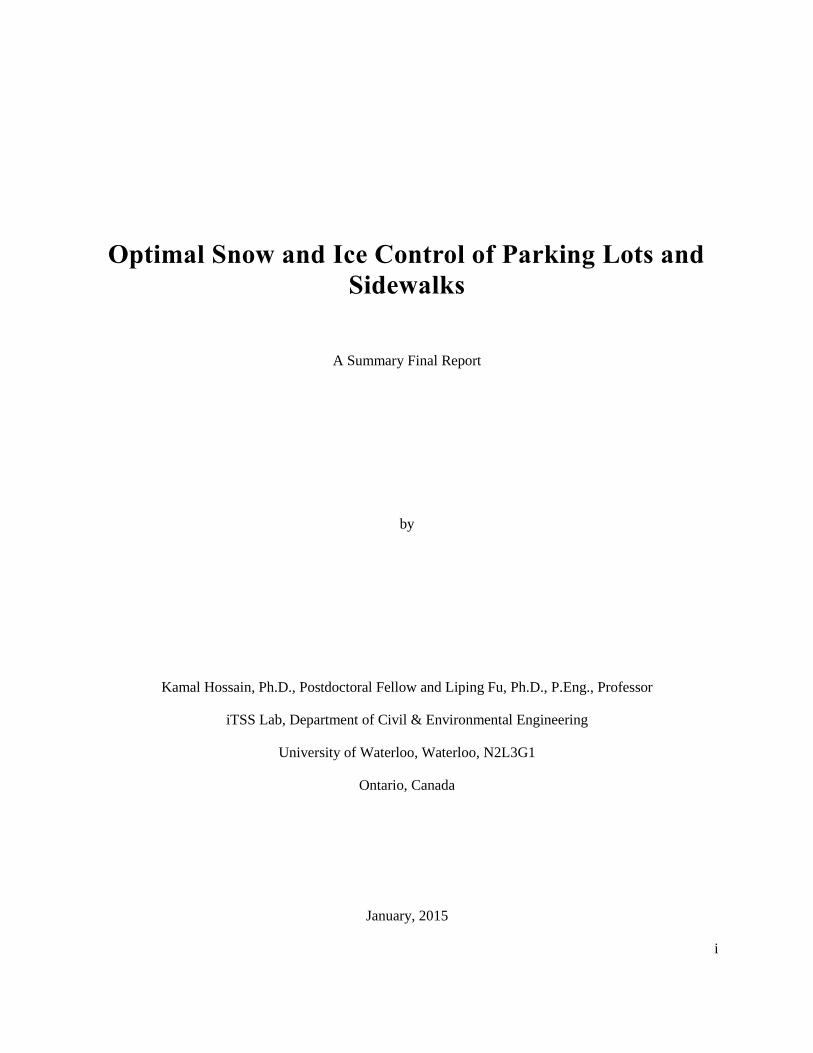
Field Tests For Determining Optimal treatment methods And Application Rates ............... 10
5.1. Test Site and Setup .......................................................................................................... 10
5.2. Test Protocols .................................................................................................................. 12
Summary Of The Field Test Results ..................................................................................... 18
6.1. Summary of Major Findings on Deicing Treatments ...................................................... 18
6.2. Summary of Major Findings on Anti-icing Treatments .................................................. 19
Quick Guide For Optimal Snow And Ice Controls ............................................................... 20
7.1. Set Appropriate Level of Service (LOS) Targets ............................................................ 20
7.2. Select the Right Treatments and Application Rates ........................................................ 20
7.3. Adjusting Salt Application Rates for Other Factors ........................................................ 22 1) Snow Type Adjustment Factor ...................................................................................................... 22 2) Traffic Adjustment Factor ............................................................................................................. 22 3) Pavement Type Adjustment Factor ............................................................................................... 22 4) Adjustment Factors for Pre-wetting .............................................................................................. 22 5) Adjustment Factors for Alternative Salts ...................................................................................... 22
7.4. Guideline Application Example ...................................................................................... 24 Site and Event Description ...................................................................................................................... 24
Technical Papers From This Research .................................................................................. 26
References ..................................................................................................................................... 28
Appendix A ................................................................................................................................... 30

1
BACKGROUND
Snow and ice on pavement surfaces can create slippery conditions, causing slip-n-falls and vehicular
accidents. To ensure public safety and mobility, various forms of maintenance operations such plowing and
salting are performed to keep pavement surfaces free of snow and ice. The costs of winter maintenance
operations are however substantial. For instance, over $1 billion is spent annually on winter maintenance
of various transportation facilities in Canada, which includes the use of an average of five million tonnes
of salts (Transportation Association of Canada, 2013). The release of large quantities of salts could cause
significant environmental impacts, such as damage to the soil, water, vegetation and wildlife (Levelton
Consultants, 2007). Salt is also a significant factor contributing to the corrosion of bridges, buildings and
vehicles, increasing maintenance costs by billions of dollars. Therefore, a sensible salting strategy is
necessary in order to reduce the harmful effects of salt while keeping the various transportation facilities
safe.
Developing a sensible salting strategy is a multi-step process; but one of the first steps is the
development of snow and ice control guidelines for the selection of the best strategies and methods,
materials, and application rates for specific facility and weather conditions. It is generally understood that
developing appropriate facility-specific guidelines requires a quantitative understanding of the snow
melting performance of the materials being used and the effect of different application methods and rates
within the usage environment of these facilities (e.g., roadways vs. parking lots vs. transit platforms).
Furthermore, different facilities have different service requirements (e.g., desirable bare pavement regain
time) and traffic characteristics (e.g., only vehicular traffic vs pedestrians-vehicle mix, speed differences,
etc.). The goal of this three year research project is to address the need of developing guidelines for the
snow and ice control of parking lots and sidewalks. This report presents the highlights and key findings
from the research that will help maintenance practitioners optimally manage and clear snow and
contamination from parking lots and sidewalks.
MAINTENANCE TECHNIQUES FOR SNOW AND ICE CONTROL
Snow and ice control methods can be generally classified into three distinct categories: mechanical,
chemical and thermal (Minsk, 1998). Mechanical methods could be in the form of plowing, scraping, and
blowing while thermal methods include those that control or prevent the formation of snow through the
application of heat, either from above or below the pavement surface. The most effective and also costly
method is however of chemical process, in which a freezing-point depressant is used to melt, or prevent the
formation of, snow and ice. This section provides a brief review of three chemical based snow and ice
control strategies, namely, deicing, anti-icing, and using of abrasives.
2.1. Deicing
Deicing is a method of snow and ice control in which chemical agents are applied to melt the snow
and ice already accumulated on a pavement surface or prevent the bonding of snow and ice to a pavement
surface (Blackburn, Bauer, Amsler, Boselly & McElory, 2004). Chemical agents work by lowering the
freezing point of water or by breaking the previously formed bond between snow and pavement.

2
The most common type of chemical agents for deicing is rock salt. Deicing treatment can also be
conducted with other alternative materials, some of which contain less or no chlorides and thus have lower
environmental effects. Salt can be pre-wetted using brine or other liquids for improved performance
(Fonnesbech, 2005; Fu, Omer, Hossain & Jiang, 2012; Shi et al., 2009). Pre-wetting has been shown to be
an effective method to provide a higher level of service (LOS) for the following two reasons. First, wet salt
can better adhere to the pavement surface, resulting in less scattering and less material usage. Secondly,
salt requires moisture to activate the deicing process (Fu et al., 2012; Ketcham, Minsk, Blackburn & Fleege,
1996; Roosevelt, 1997). Road salts have become the most popular material due to their high effectiveness,
easy operation, and low initial costs (Chappelow et al., 1992; Williams & Linebarger, 2000).
2.2. Anti-icing
Anti-icing is a strategy which applies snow and ice control materials before or immediately after a
snow event starts. The objective of anti-icing is to prevent bonding of snow and ice to a pavement surface
(Amsler, 2006; Blackburn et al., 2004; Wisconsin Transportation Bulletin, 2005). Blackburn, McGrane,
Chappelow, Harwood and Fleege (1994) were among the first to conduct comprehensive research on the
development of anti-icing technology in the context of North American weather and winter maintenance.
To meet this end, they first conducted an in-depth literature review on research and practice on anti-icing
in Europe and United States. They then conducted a two-year field study to evaluate the various anti-icing
methods used in order to determine the best method available for various conditions.
The study reported that, for an anti-icing treatment, if salts are applied at an appropriate time and not
during severe storm conditions or on an extremely cold pavement surface (i.e. colder than -5 ºC (23 ºF)),
an application rate of 100 lb/lane-mile (28 kg/line-km) (1.57 lbs/1000sqft (8 g/m2)) was adequate. The study
also found that anti-icing operations can contribute to cost savings for both highway agencies and motorists
by reducing the use of materials and by reducing the occurrence of accidents, respectively. Since then, due
to the advantages inherent in an anti-icing strategy, it has become one of the most popular winter road
maintenance strategies (Evans, 2008; Stidger, 2002; Wyant, 1998). Studies have also shown that, in addition
to its benefits against regular winter weather, anti-icing is particularly effective in dealing with heavy frosts
and freezing fogs (Evans, 2008; LRRB, 2005; Smith, 2006).
2.3. Abrasives
Abrasives such as sand and sand-salt mix are commonly used to provide improved traction on ice-
covered roadways, especially when it is too cold for other chemicals to work effectively (Blackburn et al.,
2004; Environmental Canada, 2004; Nixon, 2001; Stidger, 2002). Amsler (2006) detailed several kinds of
abrasives which can be used for snow and ice control, including natural sands, finely crushed rocks or
gravels, bottom ashes, slags, ore tailings and cinders. The application rate for abrasives varies among the
different winter maintenance agencies due to the diverse weather conditions. Blackburn et al. (2004)
observed that most agencies apply the abrasives within a range from 500 lb/lane-mile (141 kg/line-km) (8
lbs/1000sqft (39 g/m2)) to 1500 lb/lane-mile (423 kg/lane-km) (24 lbs/1000 sqft (117 g/m2)) while the
average application rate is 800 lb/lane-mile (225 kg/lane-km) for roadways (13 lbs/1000sqft (63 g/m2)).
3
SNOW AND ICE CONTROL MATERIALS
Snow and ice control materials include various chemical products as well as abrasives. This section
summarizes the common Deicing products used in the winter maintenance industry. Table 3-1 summarizes
the characteristics of these maintenance materials.
Deicing materials can generally be classified into two types, namely, Chloride-based and non-Chloride
based. The most commonly used Chloride-based materials include sodium chloride (NaCl), calcium
chloride (CaCl2), and magnesium chloride (MgCl2). These materials are generally produced from the
mining of surface or underground deposits, extracting and fractionating brine from wells, industrial by-
products, or through solarizing saltwater.
Non-chloride based products, also called organic products, are mostly manufactured. Some are wholly
synthesized (e.g., CMA and KA) while others are refined from agricultural sources (e.g., by-products from
grain processing, brewing, winemaking, and similar sources). These materials are not as popular as
chloride-based products, but are used as either stand-alone liquids, blended with inorganic liquids, or as
stockpile treatments. In general, due to their high costs they tend to be used for special situations (e.g., for
low-corrosion applications such as bridge decks). Most of these products are proprietary with little
information about their actual manufacturing and refining process. These products are usually used in
conjunction with chloride-based products, though stand-alone products have also been marketed. Many of
these products have been claimed to have the benefits of being less corrosive and more effective in snow
melting.
In addition to these products, other organic compounds are also used for snow and ice control. One
group of compounds in this category is alcohols (e.g., methanol or ethanol). These are usually distilled from
organic feedstock, though some can be synthesized from petroleum sources. Alcohols are volatile and
flammable, which present some storage and handling concerns. Glycols are another common group of
organic chemicals used for snow and ice control. The most common glycol-related compounds encountered
are ethylene and propylene glycol. These are found in commercial automobile antifreeze products. These
compounds are used as aircraft deicers and have seen limited roadway applications. In this study, some of
the emerging products were selected and tested to investigate their snow melting performance as compared
to regular rock salts. The details about these salts are provided in field test section.

4
Table 3-1: Properties of Some Common Deicers (Blackburn et al., 2004; Ketcham et al.,
1996)
Material Chemic
al Comp
Forms
Used
Eutectic
Temp &
Eutectic
Conc.
°C (°F)
Atmospheric
Corrosion to
Metals
Corrosion to
Concrete
Matrix
Corrosion to
Concrete
Reinforcing
Sodium
Chloride NaCl
Primarily
solid, but
increasing
use of
liquid
-21 (-58)
@ 23.3%
High
Will initiate and
accelerate
corrosion.
Low/moderate
Will exacerbate
scaling; low
risk of paste
attack.
High
Will initiate
corrosion of
rebar.
Calcium
Chloride CaCl2
Mostly
liquid brine,
some solid
flake
-51 (-60)
@ 29.8%
High
Will initiate and
accelerate
corrosion; higher
potential for
corrosion related
to hygroscopic
properties
Low/moderate
Will exacerbate
scaling; low
risk of paste
attack.
High
Will initiate
corrosion of
rebar.
Magnesium
Chloride MgCl2
Mostly
liquid brine,
some solid
flake
-33 (-28)
@ 21.6%
High
Will initiate and
accelerate
corrosion; higher
potential for
corrosion related
to hygroscopic
properties
Moderate/high
Will exacerbate
scaling; risk of
paste
deterioration
from
magnesium
reactions
High
Will initiate
corrosion of
rebar,
evidence
suggests
MgCl2 has
highest
potential for
corrosion of
chloride
products
Calcium
Magnesium
Acetate
CaMgAc
Mostly
liquid with
some solid
-27.5 (-17.5)
@ 32.5%
Low/moderate
Potential to
initiate and
accelerate
corrosion due to
elevated
conductivity.
Moderate/high
Will exacerbate
scaling; risk of
paste
deterioration
from
magnesium
reactions
Low
Probably
(Ketcham S.
A., 1996) little
or no effect.

5
Potassium
Acetate KAc Liquid only
-60 (-76)
@ 49%
Low/moderate
Potential to
initiate and
accelerate
corrosion due to
elevated
conductivity.
Moderate/high
Will exacerbate
scaling; risk of
paste
deterioration
from
magnesium
reactions.
Low
Probably little
or no effect.
Agricultura
l By-
Products NA Liquid only
Usually
blended with
chloride-based
products
Low
Potential to
initiate and
accelerate
corrosion due to
elevated
conductivity
claims of
mitigation of
corrosion require
further evaluation
Low
Probably little
or no effect.
Low
Probably little
or no effect.
Other
Organic
Materials
Glycols
Methano
l Liquid only
Varies with
product NA
Low
Probably little
or no effect.
Low
Probably little
or no effect.

6
REVIEW OF CURRENT WINTER MAINTENANCE PRACTICES
As part of this research project, two online surveys were conducted; one on winter maintenance
contractors and the other on municipalities. The main objective of the surveys was to investigate and
document the current state of practice in regards to the winter maintenance of parking lots and sidewalks,
with the eventual goal of using this information to develop guidelines that are easy to adopt and address
common issues faced by the practitioners.
4.1. Survey of Winter Maintenance Contractors
This survey was conducted on more than 600 winter maintenance contractors who are members of
Landscape Ontario. More than 100 complete responses were received.
Figure 1 shows the geographic locations of the respondents. In the survey, a number of important questions
related to winter maintenance were asked including the following:
Company’s business characteristics (e.g., commercial, residential client types)
Maintenance contract preferences
Level of service delivered to the clients
Maintenance methods
Materials used for snow controls
Application rates
Use of technology
Awareness on environment and sustainable practices
Figure 1: Geographical Location of Respondents

7
Summary of Major Findings
A majority of the contractors surveyed (60%) prefer to have ‘Salt Extra’ contracts
and this preference remains similar across contractors serving different types of
clients. Given the limited guidelines and references available for this industry
along with no incentive to save salt (as it is paid for by the client), it can be expected
that the industry is prone to over application of salt.
Regardless of their geographical location, a significant percent of contractors
(31%) indicated they were using a salt and sand mix. Despite its proven
ineffectiveness under a number of conditions (Levelton Consultants, 2007), salt
and sand mixes continue to be a popular choice and thus further research towards
evaluating its effectiveness for parking lots and sidewalks would be beneficial.
Despite their proven effectiveness (Blackburn et al., 2004), pre-wetting and direct
liquid application (DLA) are not used widely with only a small number of
contractors indicating their prior experience (25% and 15% respectively). While
high initial cost is one of the major hurdles in adopting new methods and
technologies, another reason for the low adoption rate is the lack of formal studies
and guidelines that explain the correct use and potential savings for parking lots
and sidewalks.
The reported application rates have a large variation, indicating that maintenance
contractors are unsure of the amount of material that is needed for given conditions.
Furthermore, over than 70% of the contractors surveyed currently do not have any
equipment that can be used to accurately measure the amount of salt being used at
different locations. Thus, if snow and ice control guidelines were to be prepared
for use by field practitioners, this deficiency would have to be considered.
From a sustainability perspective, majority of the contractors reported applying
excess salt to avoid slips and falls, which often lead to litigations and increases in
insurance premiums. Given the relatively low price of salt, minimal penalties for
over application, and a majority of contracts being ‘Salt Extra’, it can be expected
that this trend for over application of salt will continue. A large proportion of the
respondents (75%) believe that 10% or more salt could be saved if litigations and
insurance premiums were not a concern.
4.2. Survey of Municipalities
This survey investigated the current winter maintenance practices used by various municipalities that
are responsible for ensuring the safety of the streets, sidewalks and parking lots of their various
establishments and buildings. The online survey was sent to 222 cities and municipalities in Canada and
the United Sates in the final weeks of the winter seasons of 2012-2013 and 2013-2014. Municipalities were
selected based on winter severity. Of the municipalities that received the survey, over 25% of them
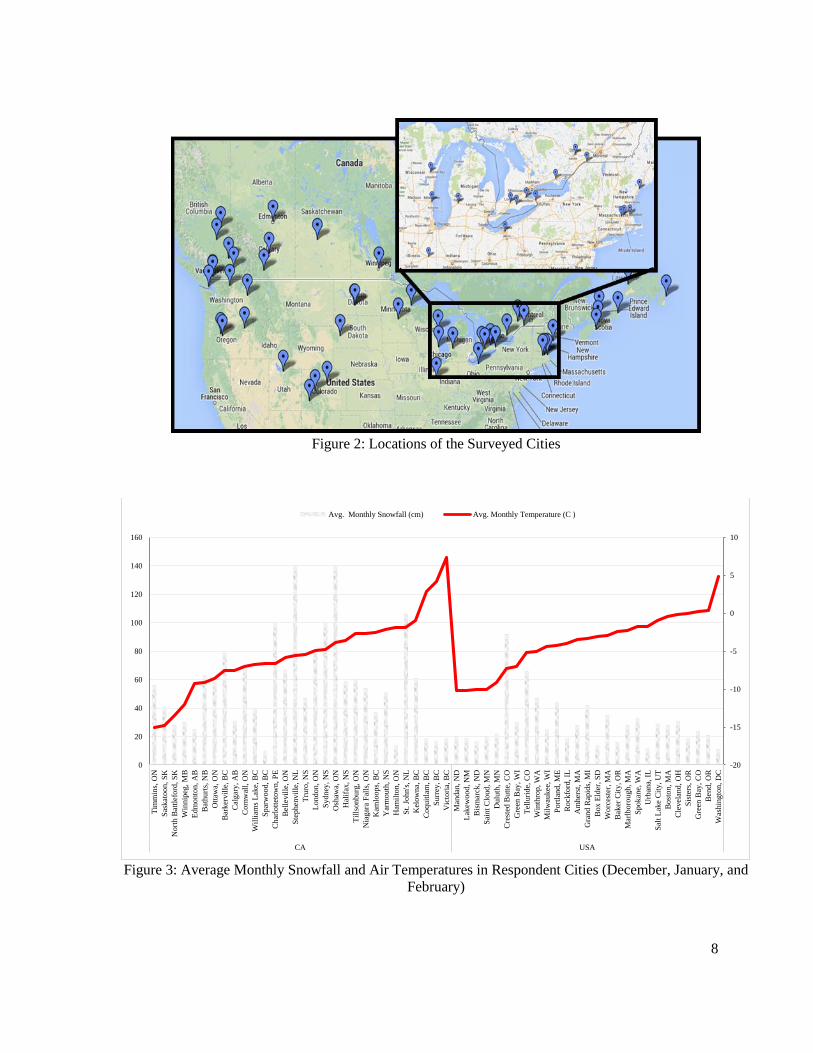
responded, roughly half of them from Canada, and the other half from the United States. Figure 2 shows
the locations of the respondents. There is a significant variation in the weather conditions for the
municipalities being surveyed in terms of the number of monthly snow days, the total monthly snowfall,
and the monthly average temperature, as shown in Figure 3. This suggests that winter maintenance services
between municipalities would also vary.
8
Figure 2: Locations of the Surveyed Cities
Figure 3: Average Monthly Snowfall and Air Temperatures in Respondent Cities (December, January, and
February)
-20
-15
-10
-5
0
5
10
0
20
40
60
80
100
120
140
160
Tim
min
s, O
N
Sas
kato
on,
SK
Nort
h B
attl
efo
rd, S
K
Win
nip
eg, M
B
Edm
onto
n,
AB
Bath
urt
s, N
B
Ott
awa,
ON
Bark
ervil
le, B
C
Calg
ary
, A
B
Corn
wal
l, O
N
Wil
liam
s L
ake,
BC
Spar
wood, B
C
Charl
ott
etow
n, P
E
Bell
evil
le, O
N
Ste
phen
vil
le, N
L
Tru
ro, N
S
London, O
N
Sydney
, N
S
Osh
awa,
ON
Hal
ifax
, N
S
Til
lsonburg
, O
N
Nia
gar
a F
alls
, O
N
Kam
loops,
BC
Yar
mouth
, N
S
Ham
ilto
n, O
N
St.
John's
, N
L
Kel
ow
na, B
C
Coquit
lam
, B
C
Surr
ey, B
C
Vic
tori
a, B
C
Mandan
, N
D
Lak
ewood, N
M
Bis
mar
ck, N
D
Sai
nt
Clo
ud, M
N
Dulu
th,
MN
Cre
sted
Butt
e, C
O
Gre
en B
ay, W
I
Tel
luri
de,
CO
Win
thro
p, W
A
Mil
waukee
, W
I
Port
land, M
E
Rockfo
rd, IL
Am
her
st,
MA
Gra
nd R
apid
s, M
I
Box E
lder
, S
D
Worc
este
r, M
A
Baker
Cit
y, O
R
Marl
boro
ugh, M
A
Spokan
e, W
A
Urb
ana,
IL
Sal
t L
ake
Cit
y, U
T
Bost
on,
MA
Cle
vela
nd, O
H
Sis
ters
, O
R
Gre
en B
ay, C
O
Bend, O
R
Was
hin
gto
n, D
C
CA USA
Avg. Monthly Snowfall (cm) Avg. Monthly Temperature (C )

9
Summary of Major Findings:
Approximately 65% of municipalities reported that Deicing - either plowing and
salting or salting only is the main method of snow and ice control, whereas only
5% reported that they had performed anti-icing. Although anti-icing has been
shown to be an effective strategy for minimising salt application rates and
improving efficiency in maintenance operations, it has not been adopted widely
for snow and ice control of parking lots and sidewalks.
To prevent snow-pavement bonding, most municipalities reported that they
performed plowing operations before total snow accumulation reaches 5cm (2 in).
Despite the pressure to adopt environmentally friendly winter maintenance
strategies, few municipalities had reported using materials other than ordinary road
salts. No municipalities mentioned the usage of organic salts for parking lots and
sidewalks. For the types of snow control chemicals being used, 65% of
municipalities used regular sodium chloride, while 35% reported using other
chloride based materials such as magnesium chloride. In addition, 16% of the
respondents reported using abrasives (e.g., sand) for improving pavement surface
friction.
64% of the municipalities indicated that regular dry sodium chloride was used for
snow control while 36% used pre-wetted salts. 60% of the respondents who used
pre-wetted salts reported using regular brine as a pre-wetting agent, while 30%
used a magnesium chloride solution.
Nearly half of the respondents indicated that they have no guidelines in
determining the best application rate for parking lots during a given snow event.
Some use the guidelines implemented for roadside maintenance, despite the fact
that significant differences exist between roads and parking lots.
10
FIELD TESTS FOR DETERMINING OPTIMAL TREATMENT
METHODS AND APPLICATION RATES
5.1. Test Site and Setup
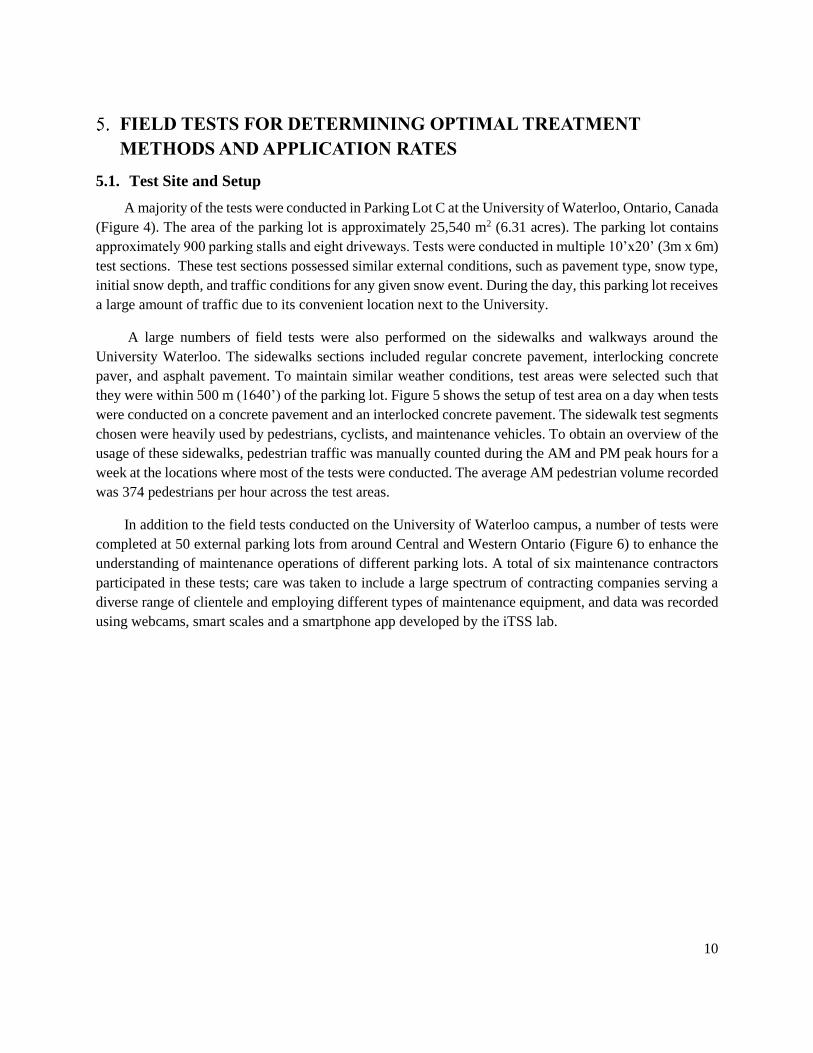
A majority of the tests were conducted in Parking Lot C at the University of Waterloo, Ontario, Canada
(Figure 4). The area of the parking lot is approximately 25,540 m2 (6.31 acres). The parking lot contains
approximately 900 parking stalls and eight driveways. Tests were conducted in multiple 10’x20’ (3m x 6m)
test sections. These test sections possessed similar external conditions, such as pavement type, snow type,
initial snow depth, and traffic conditions for any given snow event. During the day, this parking lot receives
a large amount of traffic due to its convenient location next to the University.
A large numbers of field tests were also performed on the sidewalks and walkways around the
University Waterloo. The sidewalks sections included regular concrete pavement, interlocking concrete
paver, and asphalt pavement. To maintain similar weather conditions, test areas were selected such that
they were within 500 m (1640’) of the parking lot. Figure 5 shows the setup of test area on a day when tests
were conducted on a concrete pavement and an interlocked concrete pavement. The sidewalk test segments
chosen were heavily used by pedestrians, cyclists, and maintenance vehicles. To obtain an overview of the
usage of these sidewalks, pedestrian traffic was manually counted during the AM and PM peak hours for a
week at the locations where most of the tests were conducted. The average AM pedestrian volume recorded
was 374 pedestrians per hour across the test areas.
In addition to the field tests conducted on the University of Waterloo campus, a number of tests were
completed at 50 external parking lots from around Central and Western Ontario (Figure 6) to enhance the
understanding of maintenance operations of different parking lots. A total of six maintenance contractors
participated in these tests; care was taken to include a large spectrum of contracting companies serving a
diverse range of clientele and employing different types of maintenance equipment, and data was recorded
using webcams, smart scales and a smartphone app developed by the iTSS lab.

11
Figure 4: Test Site – Parking Lot at the University of Waterloo
Figure 5: Test Site – Sidewalks Around the University of Waterloo

12
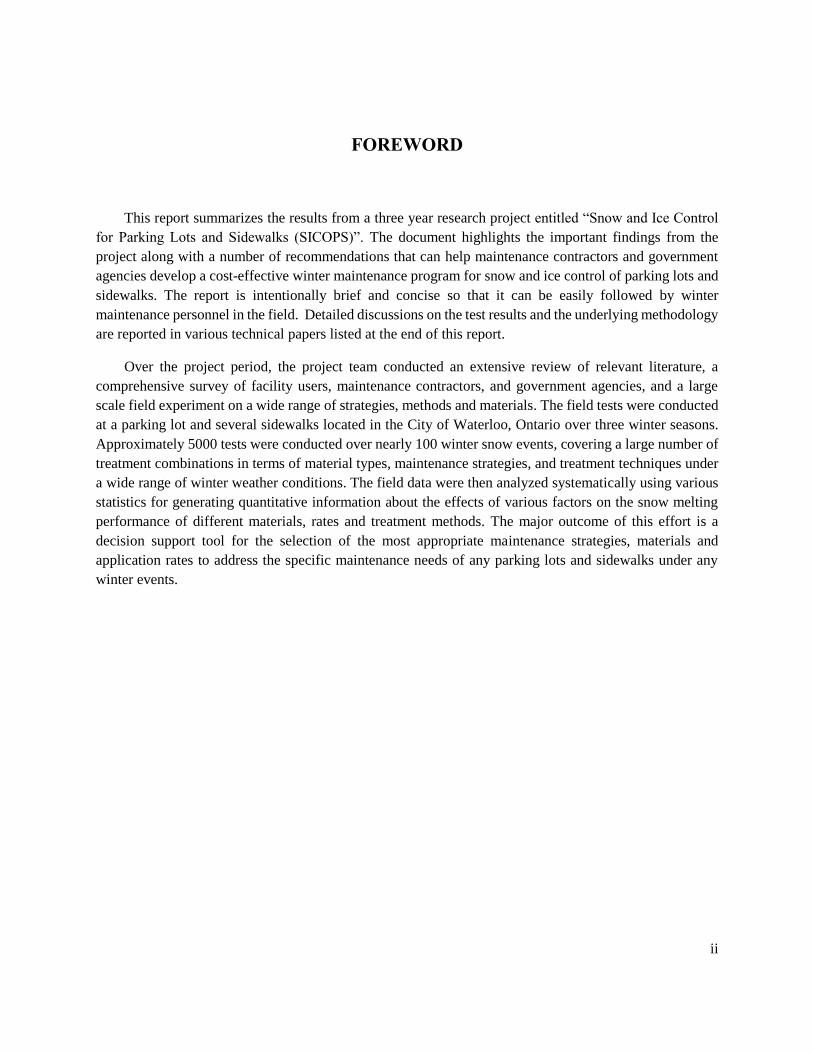
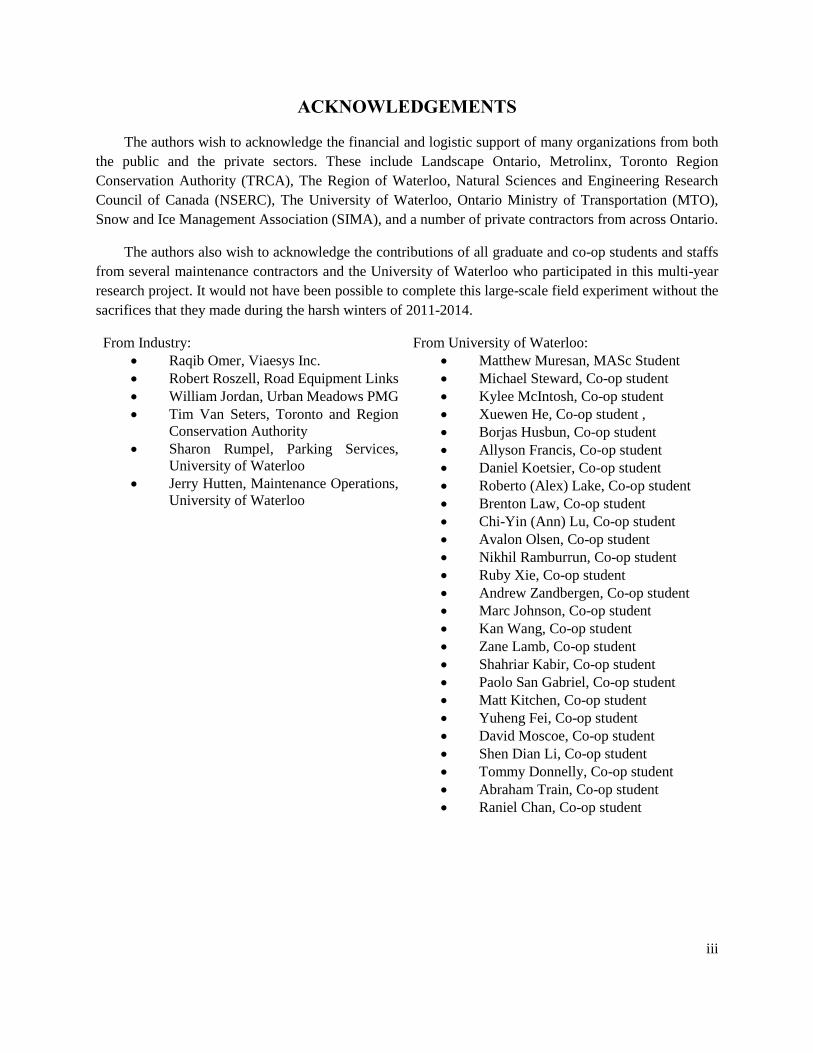
5.2. Test Protocols
To ensure data reliability, all tests were conducted according to a common protocol. For Deicing tests,
salts were applied manually on top of snow with application rates ranging from 5 to 70 lbs/1000sqft (24 to
342 g/m2) based on the total snowfall, prevailing pavement surface temperature, and forecasted air
temperature over the day, while anti-icing sections were salted before the event. A significant amount of
training was conducted during the initial stage of field tests to ensure the highest possible uniformity in
application. Moreover, each test section is approximately 10’x20’ (6m x 12m), a small area, to assist in
achieving a high degree of uniformity. It should be noted that, in practice, the uniformity of salt spreading
depends on the characteristics of the sprayer (e.g., manual rate setting vs. automatic rate control) and truck
operational constraints (e.g., speed fluctuation) which remains an issue for investigation.
At the start of a test, a master event form was filled out with major information of the event, including
start and end times of the snowfall, initial snow depth, snow type, density, and prevailing temperatures. To
measure density, a 1m x 1m (3’ x 3’) area was sectioned off. The snow was then collected from this section
and weighed to determine the snow density. An hourly data form was filled out at a fixed time interval
including weather data, performance data (i.e., percentage of bare pavement over snow covered area) and
contaminant type. The weather data was collected from Environment Canada’s nearest weather station and
included air temperature, sky-view condition, humidity, wind speed, dew-point, and wind chill. Surface
temperatures of the pavement and snow were measured on the pavement after removing patches of snow,
and on top of the snow surface, respectively, using an infrared surface temperature reader. The event-based
data collection form included the initial and final conditions of the tests, total snowfall over the event, as
Figure 6: External Test Sites across Southern Ontario

13
well as some processed data from the day, such as average temperatures for the event and pavement
condition. Note that the data collection process was continued until every test section achieved the desired
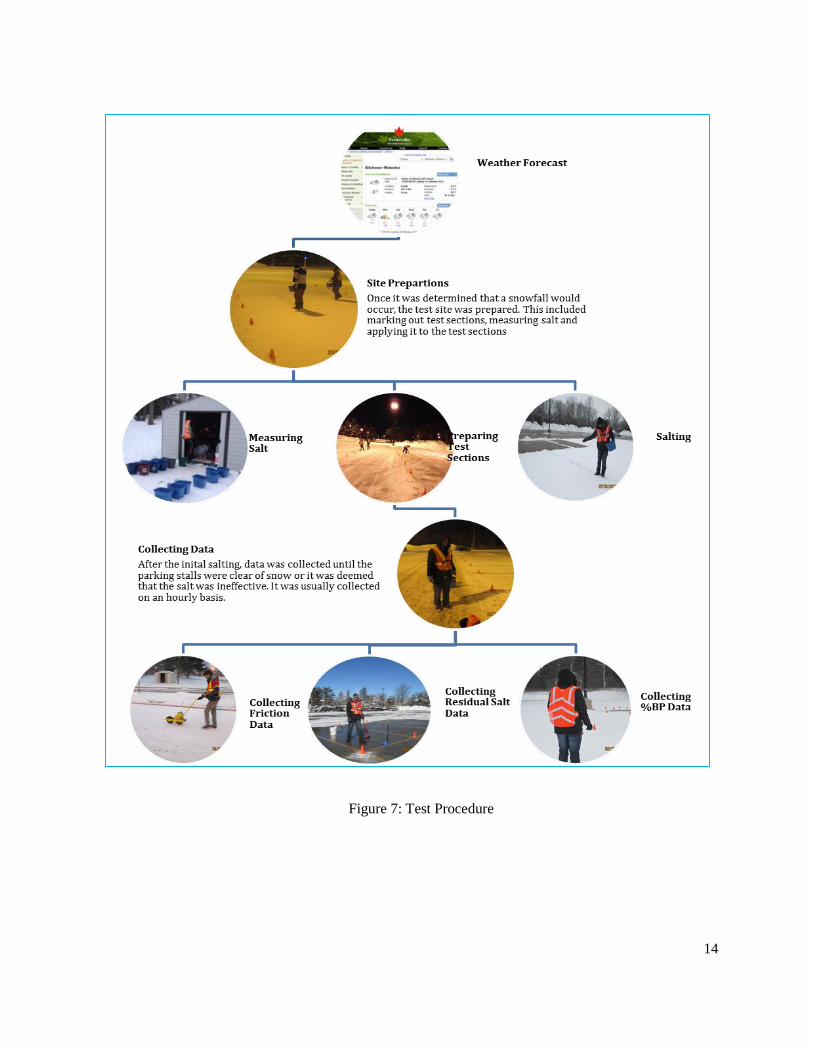
bare pavement. Figure 7 shows the major activities related to the field tests.
The tests were conducted over the winter seasons of 2011-2012, 2012-2013 and 2013-2014. In these
testing seasons, there were about 100 snow events in total with pavement surface temperatures ranging
from about -20 °C (-4 ºF) to 3 °C (37 ºF) and snow precipitation from about 0.2 cm to 22 cm (0.1 in to 9
in), as shown in Figure 8. Interestingly, these three winter seasons had different sets of weather conditions:
the first season was very mild and contained a limited number of events (14 events in total); the second
season contained average winter conditions for the region; and the last winter was extremely heavy,
especially when the number of colder days is considered (over 15 events with temperatures below -15 °C
(5 ºF)). Approximately 5000 tests were conducted using different salts and treatment methods, including
tests with plowed and unplowed snow, with and without traffic, and in the stall areas, driveways and
sidewalks. In order to closely simulate the way parking lot maintenance is performed in the real world, 60
to 70% of the test operations started between 3am and 7am. As indicated, a number of existing solid and
liquid salts were tested. The key information of these salts is presented in Table 5-1 for solid salts and Table
5-2 for liquid salts.
14
Figure 7: Test Procedure

15
Figure 7: Winter Events Covered over 2012- 2014 Winter Seasons
-25
-20
-15
-10
-5
0
5
10
15
20
25
20
12-0
1-1
3
20
12-0
1-1
8
20
12-0
1-1
9
20
12-0
1-2
0
20
12-0
1-2
1
20
12-0
1-2
7
20
12-0
1-2
8
20
12-0
1-2
9
20
12-0
1-3
0
20
12-0
1-3
1
20
12-0
2-1
1
20
12-0
2-1
2
20
12-0
2-1
3
20
12-0
2-1
4
20
12-0
2-2
4
20
12-0
2-2
5
20
12-0
2-2
9
20
12-0
3-0
1
20
12-0
3-0
9
20
12-1
2-1
1
20
12-1
2-2
7
20
12-1
2-2
8
20
12-1
2-2
9
20
12-1
2-3
0
20
12-1
2-3
1
20
13-0
1-0
6
20
13-0
1-0
7
20
13-0
1-0
9
20
13-0
1-1
6
20
13-0
1-1
7
20
13-0
1-1
8
20
13-0
1-1
9
20
13-0
1-2
0
20
13-0
1-2
1
20
13-0
1-2
2
20
13-0
1-2
3
20
13-0
1-2
4
20
13-0
1-2
5
20
13-0
1-2
6
20
13-0
1-2
8
20
13-0
1-3
1
20
13-0
2-0
1
20
13-0
2-0
2
20
13-0
2-0
3
20
13-0
2-0
4
20
13-0
2-0
5
20
13-0
2-0
6
20
13-0
2-0
7
20
13-0
2-0
9
20
13-0
2-1
2
20
13-0
2-1
4
20
13-0
2-1
5
20
13-0
2-1
6
20
13-0
2-1
8
20
13-0
2-1
9
20
13-0
2-2
0
20
13-0
2-2
2
20
13-0
2-2
3
20
13-0
2-2
4
20
13-0
2-2
7
20
13-0
3-0
6
20
13-0
3-0
7
20
13-0
3-1
4
20
13-0
3-1
6
20
13-0
3-1
8
20
13-0
3-1
9
20
13-0
3-2
0
20
13-0
3-2
1
20
13-0
3-2
2
20
13-0
4-0
2
20
14-0
1-0
3
20
14-0
1-0
5
20
14-0
1-0
6
20
14-0
1-0
7
20
14-0
1-0
8
20
14-0
1-1
0
20
14-0
1-1
7
20
14-0
1-1
8
20
14-0
1-1
9
20
14-0
1-2
0
20
14-0
1-2
3
20
14-0
1-2
7
20
14-0
1-2
8
20
14-0
1-2
9
20
14-0
1-3
0
20
14-0
1-3
1
20
14-0
2-0
2
20
14-0
2-0
3
20
14-0
2-0
6
20
14-0
2-0
7
20
14-0
2-0
8
20
14-0
2-0
9
20
14-0
2-1
0
20
14-0
2-1
6
20
14-0
2-1
9
20
14-0
2-2
4
20
14-0
2-2
6
20
14-0
3-0
2
20
14-0
3-0
5
20
14-0
3-1
2
20
14-0
3-1
3
Snow Depth (cm) Average Air Temp (°C) Average Pave Temp (°C)

16
Table 5-1: Solid Materials Tested
Trade
Name Composition*
Effective
Temp*
ºC (ºF)
Cost
($/ton)* Photo
Road Salt Sodium Chloride -10
(14) 80
Blue Salt
Sodium Chloride
Treated with Magnesium
Chloride (Proportion not
known)
-15
(5) 100
Slicer
78% NaCl
9.4% MgCl2
2-3% and rest P/U
-25
(-13) 358
Green
Salt
Sodium Formate
Treated with GEN3
runway Deicing fluid
(Proportion not known)
-30
(-22) 950
Jet Blue
Sodium Chloride
Treated with proprietary
polyol (Proportion not
known)
-30
(-22) 495

17
Table 5-2: Liquid Materials Tested
Trade Name Composition*
Effective
Temp*
ºC (ºF)
Cost
($/L)* Physical Look
Brine 23% NaCl
77% Water
-7
(19) 0.15
Fusion 2350
12% NaCl
50% Degraded
Beet Juice
38% P/U
-27
(-17) 0.30
Snowmelt
15-20% Gylcerine
10-20% Polyether
Polymer
3-8% Lactic Acid
2-4% Sorbitol
1-3% Formic Acid
1-3% Acetic Acid
1-2% 1,2-Butanediol
Balanced with Water
-20 to -40
(-4 to -40) 0.29
Caliber
M1000
27% MgCl2
6% Carbohydrate
67% Water and P/U
-29.4
(-21) 0.40
*Note: The information is based on product descriptions provided by the suppliers or found in the
literature. An independent chemical analysis is being conducted by MOE at the request of TRCA
and will be made available upon request. P/U stands for Propitiatory/Unknown.
18
SUMMARY OF THE FIELD TEST RESULTS
As mentioned in the previous section, a large number of tests were conducted in a real world
environment covering different maintenance methods and salts under a wide range of winter conditions.
Furthermore. Extensive exploratory analysis was then performed on the observational data with the goal of
identifying the main factors (e.g., temperature, snow amount, application rate etc.) that affect the snow
melting performance and snow melting speed (i.e., bare pavement recovery time – BPRT) of various
chemical agents. The effectiveness of each individual treatment method was also assessed in the context of
the friction level of the pavement surface after treatment was applied based on data collected in the field.
This section highlights the important findings from our field tests.
6.1. Summary of Major Findings on Deicing Treatments
Deicing treatments were conducted using regular rock salts, pre-wetted salts, and
several semi to full organic salts such as Green Salts, Blue Salts, Jet Blue and Slicer
described in the previous section. An analysis of the field data revealed that salt
type, application rate, pavement temperature, snow amount and traffic volume are
all statistically significant in influencing snow-melting speed/BPRT.
It was observed that when the pavement surface temperature drops below -10 °C
(14 ºF) the melting speed in sites treated with regular salts dropped substantially
and took significantly longer to regain bare pavement.
It was also observed that alternative products generally outperformed regular rock
salt. The bare pavement regain time on the sections applied with these alternatives
was approximately one hour shorter in average than those using rock salt.
The alternatives tested also performed significantly better when pavement
temperatures were below -5 °C (23 ºF). The BPRT reduction ranged from 1 to 5
hours, depending on application rates. One interesting characteristic of the
alternative salts is that their snow-melting rate (i.e., bare pavement time reduction)
differed by the application rate used.
Pre-wetted salts were also evaluated alongside ordinary dry rock salt. In the tests
conducted, same gross amounts of dry salt and pre-wetted salt were applied to the
test sections. Since the pre-wetted salt mixture contains brine, its use means a
reduction in the use of sodium chloride by approximately 20%. Despite this
reduction, the pre-wetted salt and ordinary dry rock salt had similar performances
and BPRTs in the tests conducted. Accordingly, the use of pre-wetted salt has the
potential to reduce salt usage directly while still maintaining a comparable LOS.
The effect of traffic was clearly observed in the field experiment with the test
sections located in the driveways being more effective than those in the parking
stalls. Quantitative evidence on the relative effect of traffic was subsequently
obtained under various simulated traffic loads. The study concluded that to reduce
salt usage while still achieving a desired level of service, different application rates
should be applied for stall areas and driveways.
From the tests conducted, it was also found that snow melting performance varied
by pavement type. The tests conducted on asphalt concrete and Portland cement
concrete revealed that snow melting speed is higher on asphalt concrete sections.
A substantial amount of comparable tests were conducted on the two pavement
types. From these sample tests, it was found mean snow melting speed on asphalt

19
concrete was 10% faster than Portland cement concrete. This difference was found
to be statistically significant at a 95% confidence level.
Between Portland cement concrete and interlocked concrete, the difference in
melting speed was not found to be statistically significant.
Snow melting performance models were developed and used to determine the
minimum application rates and adjustments factors. Recommended application
rates and adjustment factors are presented in the next section.
6.2. Summary of Major Findings on Anti-icing Treatments
Anti-icing treatment tests were conducted using conventional chloride salts and
some emerging organic products. These include regular salt, brine, Fusion,
Snowmelt and Caliber M1000. It was found that all materials were highly effective
in preventing the bonding of snow, i.e., improving friction levels. The average
friction gain on the anti-icing sites over the control sites (without anti-icing
treatments) varied from 10% to 70% depending on event conditions.
The test results did not indicate statistically significant differences between the
performance of organic products and chloride based salts. This finding has
confirmed that the organic products are at least as effective as the regular products
for anti-icing operations in addition to the advantage of being environmentally
friendly.
A relatively low application rate, for example, 5 lbs/1000sqft (24 g/m2) for solid
salts and 3 L/1000sqft (0.033 L/m2) for regular brine, was found to be sufficient
to achieve the main purpose of anti-icing operations.
When comparing the performance of regular dry salt and brine, it was found that
brine treated sites outperformed sites treated with regular salts when the total mass
of sodium chloride applied was the same.
The performance of anti-icing operations also depended on the characteristics of
the snow event. For long and intense events, anti-icing operations were found to
be ineffective in preventing the snow from bonding with the pavement. Anti-icing
operations, when used as pre-application, were found to perform much better than
after-application (Deicing) for light snow events.
It was also observed that the effectiveness of anti-icing became much lower when
the pavement temperature dropped below -10 oC (14 ºF). This trend was observed
for all the tested anti-icers.
20
QUICK GUIDE FOR OPTIMAL SNOW AND ICE CONTROLS
This section summarizes the major recommendations and guidelines that have been developed on the
basis of an extensive literature review, two large-scale surveys, and a large number of field tests. These
guidelines can help the maintenance industry responsible for snow and ice control of parking lots, sidewalks
and transit platforms to optimize maintenance operations and minimize salt usage.
7.1. Set Appropriate Level of Service (LOS) Targets
Any maintenance program for a transportation facility starts with establishing the desired level of
service (LOS) that should be delivered during winter events or the winter season. The desired LOS must
be realistic and cost-effective due to the random nature of winter events. As a result, it is preferable that
each LOS standard includes a probability quantifier. For example, MTO’s Maintenance Quality Standards
(MQS) designates that all Class I highways must reach bare pavement within 8 hours for 90% of the events
over a season, i.e., the LOS requirement for Class I highway is 8 hrs. Standards of this type also make
sense from the users’ point of view, as it would understandably be too cost prohibitive to maintain a facility
in a bare pavement condition at all times and under all types of events. Another consideration in setting
LOS targets is the need to strike a balance between costs and benefits. An ideal LOS policy for a parking
lot should take into account the types of snow events that are to be expected in the area where the site is
located as well as the service demand of the parking lot/establishment type (e.g., shopping plaza,
restaurants, emergency buildings etc.). As a result, it may make sense to have different LOS standards for
different types of parking lots/sidewalk sections.
7.2. Select the Right Treatments and Application Rates
In responding to any upcoming event, maintenance operators must choose the right maintenance
strategy such as anti-icing or deicing and the application rate for each treatment. If an anti-icing operation
is to be implemented, solid or liquid salt should be selected on the basis of a business strategy and the
expected event conditions. The recommended application rate should then be applied before the event
begins. Because the purpose of anti-icing is to prevent bonding between the pavement and surface
contaminant and to ease the plowing operations, it is not necessary to apply different application rates for
different weather conditions. It should however be noted that anti-icing may not be effective and thus should
not be recommended for some event conditions. Table 7-1 summarizes the key information required in
anti-icing treatments.
For deicing operations, a number of weather conditions should be determined at the time of treatment.
First, the average representative pavement surface temperature should be either measured using a portable
infrared (IR) thermometer or estimated on the basis of air temperature and site conditions. Secondly, the
type of snow and the total amount of the snow (depth) that is expected to accumulate during the event
should be determined. The snow accumulation should include snow already present on ground in addition
to the forecasted precipitation. Finally, the desired level of service should be determined in terms of bare
pavement regain time, based on the LOS requirements of the facility. Table 7-2 provides the recommended
base application rates derived on the basis of snow melting models developed using the field test data. It
is important to note that these rates are highly aggregated, representing the average amount of salt needed
for a given range of conditions as defined by these factors. They should therefore be adjusted according to
21
actual conditions and requirements (as discussed in the following section - Section 7.3). More accurate
application rates are provided in Appendix A. Note that when snow accumulation is more than 2 cm (0.8
in), snow need to be first plowed for best results in deicing treatment.
Table 7-1: Anti-icing Treatment Matrix for Best Results
With Liquid Salts1 With Regular Solid Salt
Lowest Practical
Temperature -7 °C (-19 °F) -9 °C (-16 °F)
Event Conditions Less effective for wet snow and heavy
event
Less effective for dry snow and heavy
event
Recommended
Application Rate 3 L/1000sqft (0.032 L/m2) 5 lbs/1000sqft (24 g/m2)
Additional
Treatments
To make most of the anti-icing operation, snow should be plowed timely. After
the site is plowed, a low amount of salt could be applied subsequently to melt
the remaining snow.
Other Notes Liquid salts are typically more effective than solid salt for anti-icing
1Liquid salts tested were Brine, Caliber M1000, Snowmelt, and Fusion.
Table 7-2: Recommended Base Rates lbs/1000 sqft (g/m2) for Deicing Treatment for upto 2 cm
(0.8 in) snow
Average Pavement
Temp of the Event,
˚C (ºF)
Bare Pavement Regain Time (hours)
1 ~ 2 3 ~ 4 5 ~ 6
-1 to -3 (30 to 27) 15 (73) 6 (29) 4 (20)
-4 to -6 (25 to 21) 45 (220) 15 (73) 10 (49)
-7 to -9 (19 to 16) 85 (415) 35 (171) 20 (98)

22
7.3. Adjusting Salt Application Rates for Other Factors
The application rates provided in Table 7-2 are appropriate only for the base conditions and therefore
must be adjusted when the actual conditions deviate from these base conditions. This section summarizes
the adjustment factors developed on the basis of the field testing results.
1) Snow Type Adjustment Factor
The base application rates listed in Table 7-2 were determined for new snow with an average density
in the range of 100 kg/m3 (6 lb/ft3). The base rates must therefore be adjusted according to snow density,
which is captured by the snow-melting model (Hossian, Fu & Lu, 2014). For convenience of application,
Table 7-3 gives the adjustment factor for some typical types of snow.
2) Traffic Adjustment Factor
Vehicular traffic is known to have a positive effect on the snow melting performance of salts. Our
field tests under a wide range of controlled settings have provided quantitative evidence on the relative
benefit of traffic. This means that lower amounts of salt are needed for parking lots with higher traffic
volumes or areas of higher traffic in a given parking lot (e.g., driveways versus parking stalls). Table 7-4
shows the adjustment factors that were developed on the basis of the field test results (Hossain, Fu & Li,
2015). In combination with the base application rates presented in the Table 7-2, these traffic adjustment
factor values can be used to determine the appropriate application rate for a specific facility of known traffic
level. For example, under the same LOS requirement, a high traffic parking lot such as shopping plaza
requires only 30% of the application rate of a facility with no vehicular traffic (e.g., sidewalk).
3) Pavement Type Adjustment Factor
Pavement type also affects the snow melting performance of salt, due to thermodynamic properties.
Our field tests indicated that Portland cement concrete (PCC) and interlocked concrete requires
approximately 20% more salt to achieve the same LOS as compared to an asphalt concrete pavement
(Hossain, Fu, Li & Kabir, 2015). An adjustment factor is therefore recommended for a PCC or interlocked
concreted pavement facility, as shown in Table 7-5.
4) Adjustment Factors for Pre-wetting
Pre-wetted salt has been shown to be more effective than regular dry salt in the road maintenance
sector. This performance advantage of pre-wetting was also confirmed in our field study (Hossain, Fu, Li
& Lamb, 2015). Based on our field test results, the application rates could be reduced by 20% if pre-wetted
salt is applied, as shown in Table 7-6. It should be noted that the relative advantage of pre-wetting decreases
as the precipitation intensity or the amount of snow to be melt increases.
5) Adjustment Factors for Alternative Salts
In this research, several alternative products were also tested for their relative performance as
compared to regular rock salt. It was found that most of these alternatives had better snow melting
performance than regular salt although their relative advantage varied widely (Hossain, Fu & Lake, 2014).
Table 7-7 summarizes the recommended adjustment values for four different alternatives under three ranges
of pavement temperatures.

23
Table 7-3: Adjustment for Snow Type
Snow Type Adjustment Factor
Loose snow
(Density = ~75 kg/m3) (5 lb/ft3) 0.75
Regular fresh snow
(Density = ~100 kg/m3) (6 lb/ft3) 1.00
Packed snow
(Density = ~150 kg/m3) (9 lb/ft3) 1.50
Freezing rain and ice
(Density = ~800 kg/m3) (50 lb/ft3) 8.00
Table 7-4: Adjustment for Different Traffic Loads
Traffic Volume Adjustment Factor
No vehicular traffic (e.g., stalls, sidewalks
and platforms) 1.00
Low to Medium Traffic (10-50 veh/hr)
(e.g., staff parking lots, restaurants) 0.45
High Traffic (50-70 veh/hr)
(e.g., shopping plaza) 0.30
Table 7-5: Adjustment for Different Pavement Types
Pavement Type Adjustment Factor
Asphalt Concrete 1.00
Portland Cement Concrete (PCC) 1.20
Interlocked Concrete (IC) 1.20

24
Table 7-6: Adjustment Factor for Pre-wetting
Salt Form Adjustment Factor
Regular dry salt 1.00
Pre-wetted salt (with a recommended pre-
wetting ratio of 20~30 % brine by weight) 0.80
Table 7-7: Adjustment Factors for Alternative Salts
Average Pavement Temperature
°C (ºF) Slicer Blue Green Jet Blue
-1 to -3 (30 to 27) 0.74 N/A 0.53 0.64
-4 to -6 (25 to 21) 0.79 N/A 0.52 0.68
-7 to -9 (19 to 16) 0.83 0.84 0.65 0.72
7.4. Guideline Application Example
This section provides a hypothetical example to illustrate how the recommended guidelines described
in the previous section can be applied by the users to select the most appropriate snow and ice control
methods and to determine the appropriate application rates under the specific site and event conditions.
Site and Event Description
A contractor is hired to provide winter maintenance service for an 8000 sqft (743 m2) parking lot at a
shopping plaza. The parking lot has an asphalt pavement and its required level of service is essentially bare
pavement with a maximum bare pavement regain time of 2 hours for majority of the events. A snow storm
is forecasted with the following event characteristics:
Total snowfall = 4 cm (1.6 in)
Average air temperature = -4 ºC ~ -6 ºC (25 ºF ~ 21 ºF)
Expected start and end time: 3am~11am
The following is a sequence of decisions that could be made following the proposed guidelines:
Step 1: Decide on whether or not to perform anti-icing or pre-application and if so what should be the
application form, rate and time.
Because of the high LOS requirement of the parking lot, anti-icing is recommended for facilitating the
subsequent plowing and deicing operations. Based on the anticipated air temperature, regular rock salt with
25
the recommended application rate of 5 lbs/1000sqft (24 g/m2) should be applied. The total amount of salt
needed to cover the whole parking lot is 40 lbs (18 kg) (8000 sqft x 5 lbs/1000sqft) (743 m2 x 24 g/m2). The
salt can be applied at any time before the event starts (3am).
Step 2: Decide on plowing and deicing operations
The event is expected to start around 3am and continue until 11am, which means that there will be
noticeable accumulation by the time when the shopping plaza opens (9am). Assume that, to meet the
service requirements, the contractor would decide to start plowing operation at 7am and then treat the site
with salt, which should be done by 8am. The question is: how much salt should be applied, or what should
the appropriate application rate? To determine the optimal application rate, the following information is
collected:
Pavement temperature: ~-6 (~21 ºF) measured by a portable IR thermometer
Snow/ice remaining on the pavement surface after plowing: 0.5 cm (0.2 in)
Anticipated future snow fall: 1.5 cm (0.6 in)
Bare pavement regain time: 2 hour
The contractor will not return to the site, which means all accumulated snow must be melted off by
salt
From Table 7-2, we can obtain the base application rate of 15 lbs/1000sqft (73 g/m2). The base rate
needs to be adjusted to account for the busy traffic with f traffic = 0.30. The final application rate for the
driveways is therefore 4.5 lbs/1000sqft (22 g/m2). The total amount of salt needed for the whole parking
can be decided on the basis of the arear of the total driveways.
26
TECHNICAL PAPERS FROM THIS RESEARCH
Fu, L., Omer, R., Hossain, S. M. K. & Jiang, C. (2012). Experimental Study of Snow-Melting Performance
of Salt for Snow and Ice Control of Parking Lots. Paper no 13-1507, Proceedings of the 92nd Annual
General Meeting of the Transportation Research Board, Washington D.C., January 2013.
Hossain, S. M. K., Fu, L. & Hosseini, F. (2014). Evaluation of Organic Liquid Salts for Transportation
Facilities. Toronto Region and Conservation Authority, Toronto, Ontario.
Hossain, S. M. K., Fu, L. & Lake, R. (2014). A Comparison of Alternative Chemicals for Deicing
Operations. Paper no-14-4797, Proceedings of the 93rd Annual General Meeting of the Transportation
Research Board, Washington D.C., January 2014.
Hossain, S. M. K., Fu, L. & Law, B. (2014). Parking Lots and Sidewalks under Winter Snow Events:
Classification, Friction Characteristics, and Slipping Risk. Paper no-14-4909, Proceedings of the 93rd
Annual General Meeting of the Transportation Research Board, Washington D.C., January 2014.
Hossain, S. M. K., Fu, L. & Law, B. (2014). Winter Contaminants of Parking Lots and Sidewalks: Friction
Characteristics and Slipping Risk. Cold Region Engineering, Journal of American Society of Civil
Engineers (In press).
Hossain, S. M. K., Fu, L. & Li, S. D. (2015). Modeling the Effect of Traffic on the Snow Melting
Performance of Salts. Paper accepted for presentation at the 94th Annual Meeting of the Transportation
Research Board, Washington D.C., January 2015.
Hossain, S. M. K., Fu, L. & Lu, C. Y. (2014). Deicing Performance of Road Salts: Modeling and
Applications. Transportation Research Research Record (In Press).
Hossain, S. M. K., Fu, L. & Oleson J. A. (2014). An Experimental Study on the Effectiveness of Anti-icing
Operations for Snow and Ice Control of Parking Lots and Sidewalks. Paper no-14-4398, Proceedings
of the 93rd Annual General Meeting of the Transportation Research Board, Washington D.C., January
2014.
Hossain, S. M. K., Fu, L. & Oleson J. A. (2014). Effectiveness of Anti-icing Operations for Snow and Ice
Control of Parking Lots and Sidewalks. Canadian Journal of Civil Engineering, 2014, 41(6): 523-530,
10.1139/cjce-2013-0587.
Hossain, S. M. K., Fu, L. & Xie, R. (2015). A Survey of Current Winter Maintenance Practices for Parking
Lots and Sidewalks in Municipalities of Canada and the United States. Paper prepared for presentation
at the 95th Annual Meeting of the Transportation Research Board and for publication at Transportation
Research Record, Washington D.C., January 2016.
Hossain, S. M. K., Fu, L., Li, D. T. & Kabir, S. (2015). Snow Melting Performance of Salt: Effect of
Pavement Types. Paper accepted for presentation at the 94th Annual Meeting of the Transportation
Research Board, Washington D.C., January 2015.
Hossain, S. M. K., Fu, L., Li, D. T. & Lamb, Z. (2015). To Pre-wet, or Not to Pre-wet: a Field Investigation.
Paper accepted for presentation at the 94th Annual Meeting of the Transportation Research Board,
Washington D.C., January 2015.
Hosseini, F., Hossain, S. M. K., Fu, L., San Gabriel, P. & Seters, T. V. (2015). Field Evaluation of Organic
Materials for Winter Snow and Ice Control. Paper accepted for presentation at the 94th Annual Meeting
of the Transportation Research Board, Washington D.C., January 2015.

27
Omer, R. & Fu, L. (2014). A Survey of Current Winter Maintenance Practices for Parking Lots and
Sidewalks. Paper presented at the 93rd Annual Meeting of the Transportation Research Board,
Washington D.C., January 2014.
Omer, R., Fu, L., Hossain, S. M. K., Muresam, M. & Hosseini, F. (2014). Evaluation and Optimization of
Winter Snow and Ice Control Operations for Railway Platforms. GO Transit, Metrolinx, Toronto,
Ontario.
Omer, R., Mirtorabi, R., Liaqat, Z. & Fu, L. (2014). Monitoring and Analysis of Winter Maintenance
Operations for Parking Lots. Paper presented at the 93rd Annual Meeting of the Transportation
Research Board, Washington D.C., January 2014.
Work-in-Progress Papers
Hossain, S. M. K. & Fu, L. (2014). Modeling Active Mode Choice for Making Short Trip in Winter Months.
iTSS lab, University of Waterloo, Ontario, January 2015.
Hossain, S. M. K., Fu, L. & Johnson, M. (2014). A Simplistic Way to Predict Winter Pavement
Temperature. iTSS lab, University of Waterloo, Ontario, January 2015.
Hossain, S. M. K., Fu, L. & Johnson, M. (2014). How Salt Particle Size Matters in Snow Melting. iTSS lab,
University of Waterloo, Ontario, January 2015.
Hossain, S. M. K., Fu, L. & Law, B. (2014). User Expectation on Winter Maintenance of Parking Lots and
Sidewalks. iTSS lab, University of Waterloo, Ontario, January 2015.
Hossain, S. M. K., Fu, L. & Ramburn, N. (2014). Modeling Residual Salt Available on Pavement
for Optimizing Winter Maintenance. iTSS lab, University of Waterloo, Ontario, January 2015.
Hossain, S. M. K., Fu, L. & Zandbergen, A. (2014). An Investigation to Measuring Accuracy of SOBO20
for Salinity by Field Tests. iTSS lab, University of Waterloo, Ontario, January 2015.
Hossain, S. M. K., Fu, L. & Zandbergen, A. (2014). Classification of Snow-A Winter Maintenance
Perspective. Washington D.C., January 2015
28
REFERENCES AND BIBLIOGRAPY
Amsler, D.E. (2006). Snow and Ice Control. Cornell Local Roads Program.
Blackburn, R. R., Bauer, K. M., Amsler, D. E., Boselly, S. E. and McElory, A. D. (2004). Snow and Ice
Control: Guidelines for Materials and Methods. National Cooperative Highway Research Program
(NCHRP) Report 526, Transportation Research Board, Washington, D.C.
Blackburn, R. R., McGrane, E. J., Chappelow, C. C., Harwood, D. W. & Fleege, E. J. (1994). Development
of Anti-icing Technology. Strategic Highway Research Program, National Research Council,
Washington, D.C.
Chappelow, C.C., McElory, A.D., Blackburn, R.R., Darwin, D., de Noyelles, F.G., & Locke, C.E. (1992).
Handbook of Test Methods for Evaluating Chemical Deicers. Strategic Highway Research Program,
SHRP-H-33.
Environmental Canada (2004). Best management practices for salt use on private roads, parking lots and
sidewalks.
Evans, M. (2008). Winter Maintenance Manual. Utah LTAP Center.
Fonnesbech J.K. (2005). Ice Control Technology with 20 Percent Brine on Highways. Transportation
Research Record 1741, Paper No.S00-0036.
Fu, L., Omer, R., Hossain, S. M. K. & Jiang, C. (2012). Experimental Study of Snow-Melting Performance
of Salt for Snow and Ice Control of Parking Lots. Presented at the 92nd Annual Meeting of the
Transportation Research Board, Washington D.C., January 2013.
Hossain, S. M. K., Fu, L. & Lake, R. (2014). A Comparison of Alternative Chemicals for Deicing
Operations. Paper no-14-4797, Proceedings of the 93rd Annual General Meeting of the Transportation
Research Board, Washington D.C., January 2014.
Hossain, S. M. K., Fu, L. & Li, S. D. (2015). Modeling the Effect of Traffic on the Snow Melting
Performance of Salts. Paper accepted for presentation at the 94th Annual Meeting of the Transportation
Research Board, Washington D.C., January 2015.
Hossain, S. M. K., Fu, L. & Lu, C. Y. (2014). Deicing Performance of Road Salts: Modeling and
Applications. Proceedings of the 93rd Annual General Meeting of the Transportation Research Board,
Washington D.C., January 2014.
Hossain, S. M. K., Fu, L., Li, D. T. & Kabir, S. (2015). Snow Melting Performance of Salt: Effect of
Pavement Types. Paper accepted for presentation at the 94th Annual Meeting of the Transportation
Research Board, Washington D.C., January 2015.
Hossain, S. M. K., Fu, L., Li, D. T. & Lamb, Z. (2015). To Pre-wet, or Not to Pre-wet: a Field Investigation.
Paper accepted for presentation at the 94th Annual Meeting of the Transportation Research Board,
Washington D.C., January 2015.
Ketcham, S., Minsk, L. D., Blackburn, R. R. & Fleege E. J. (1996). Manual of Practice for an Effective
Anti-icing Program: A Guide for Highway Winter Maintenance Personnel. Federal Highway
Administration, Report No.FHWA-RD-95-202.
Levelton Consultants (2007). Guidelines for the Selection of Snow and Ice Control Materials to Mitigate
Environmental Impacts. National Cooperative Highway Research Program (NCHRP) Report 577,
Transportation Research Board, Washington, D.C.
LRRB (2005). Minnesota snow and ice control: Field Handbook for Snowplow Operators. Mn/DOT office,
St. Paul, Minnesota, U.S. Manual Number 2005-01.

29
Minsk L.D. (1998). Snow and Ice Control Manual for Transportation Facilities. New York: McGraw-Hill
Companies.
Nixon, W.A. (2001). The use of abrasives in winter maintenance final report of project tr434. Iowa
Department of Transportation and the Iowa Highway Research Board.
Roosevelt, D.S. (1997). Final Report: A Survey of Anti-icing Practice in Virginia. Virginia Transportation
Research Council, VTRC 98-R19.
Shi X., Fay L., Gallaway C., Volkening K., Peterson M. M., Pan T., … Nguyen T. (2009). Evaluation of
Alternative Anti-Icing and Deicing Compounds Using Sodium Chloride and Magnesium Chloride as
Baseline Deicers. Colorado Department of Transportation DTD Applied Research and Innovation
Branch, Report No.: CDOT-2009-1.
Smith, D.E. (2006). Local Roads Maintenance Workers’ Manual. Center for Transportation Research and
Education, Iowa State University.
Stidger, R.W. (2002). Good Winter Maintenance Boosts Road Safety, Better Roads. Technology Transfer
Center, Manual of Practice for Anti-icing of Local Roads.
Transportation Association of Canada (2013). Syntheses of Best Practices Road Salt Management: 10.0 –
Salt use on Private Roads, Parking lots and Walkways.
Williams, D. & Linebarger, C. (2000). Memorandum: Winter Maintenance in Thompson Falls. Montana
Department of Transportation.
Wisconsin Transportation Bulletin (2005). Pre-wetting and Anti-icing-Techniques for Winter Road
Maintenance. Wisconsin Transportation Information Center.
Wyant, D. (1998). Final Report Exploring Ways to Prevent Bonding of Ice to Pavement. Virginia
Transportation Research Council.

30
APPENDIX A
This appendix provides the optimal application rates for specific site and event conditions.
Compared to Table 7-2, these rates are of a much higher granularity and thus should be used when accurate
information on site and weather conditions is available.
Table A-1: Application Rates for Stall Areas lbs/1000 sqft (g/m2)
Stall Application Rate for Desired LOS in BPRT (hr)
Snow depth
cm (in)
Avg Tp
˚C (ºF) 1 2 3 4 5 6
0.1 to 0.5 (0.04 to
0.2)
-1 to -3 (30 to
27)
6
(29)
3
(15)
2
(10)
1
(5)
1
(5)
1
(5)
0.1 to 0.5 (0.04 to
0.2)
-4 to -6 (25 to
21)
17
(83)
9
(44)
6
(29)
4
(20)
3
(15)
3
(15)
0.1 to 0.5 (0.04 to
0.2)
-7 to -9 (19 to
16)
35
(171)
18
(88)
12
(59)
9
(44)
7
(34)
6
(29)
0.5 to 1.5 (0.2 to
0.6)
-1 to -3 (30 to
27)
19
(93)
9
(44)
6
(29)
5
(24)
4
(20)
3
(15)
0.5 to 1.5 (0.2 to
0.6)
-4 to -6 (25 to
21)
58
(283)
29
(142)
19
(93)
14
(68)
12
(59)
10
(49)
0.5 to 1.5 (0.2 to
0.6)
-7 to -9 (19 to
16)
117
(571)
59
(288)
39
(190)
29
(142)
23
(112)
20
(98)
1.5 to 2.5 (0.6 to 1) -1 to -3 (30 to
27)
38
(186)
19
(93)
13
(64)
9
(44)
8
(39)
6
(29)
1.5 to 2.5 (0.6 to 1) -4 to -6 (25 to
21)
115
(562)
58
(283)
38
(186)
29
(142)
23
(112)
19
(93)
1.5 to 2.5 (0.6 to 1) -7 to -9 (19 to
16)
235
(1147)
117
(571)
78
(381)
59
(288)
47
(230)
39
(190)
Table A-2: Application Rate for Driveways (Low Traffic-Parking Lot)
lbs/1000 sqft (g/m2)
Driveway (Low) Application Rate for Desired LOS in BPRT (hr)
Snow depth
cm (in)
Avg Tp
˚C (ºF) 1 2 3 4 5 6
0.1 to 0.5 (0.04 to
0.2)
-1 to -3 (30
to 27)
3
(15)
1
(5)
1
(5)
1
(5)
1
(5)
0
(0)

31
0.1 to 0.5 (0.04 to
0.2)
-4 to -6 (25
to 21)
8
(39)
4
(20)
3
(15)
2
(10)
2
(10)
1
(5)
0.1 to 0.5 (0.04 to
0.2)
-7 to -9 (19
to 16)
16
(78)
8
(39)
5
(24)
4
(20)
3
(15)
3
(15)
0.5 to 1.5 (0.2 to
0.6)
-1 to -3 (30
to 27)
8
(39)
4
(20)
3
(15)
2
(10)
2
(10)
1
(5)
0.5 to 1.5 (0.2 to
0.6)
-4 to -6 (25
to 21)
26
(127)
13
(64)
9
(44)
6
(29)
5
(24)
4
(20)
0.5 to 1.5 (0.2 to
0.6)
-7 to -9 (19
to 16)
52
(254)
26
(127)
17
(83)
13
(64)
10
(49)
9
(44)
1.5 to 2.5 (0.6 to 1) -1 to -3 (30
to 27)
17
(83)
8
(39)
6
(29)
4
(20)
3
(15)
3
(15)
1.5 to 2.5 (0.6 to 1) -4 to -6 (25
to 21)
51
(249)
26
(127)
17
(83)
13
(64)
10
(49)
9
(44)
1.5 to 2.5 (0.6 to 1) -7 to -9 (19
to 16)
104
(508)
52
(254)
35
(171)
26
(127)
21
(103)
17
(83)
Table A-3: Application Rate for Driveways (Medium Traffic-Parking Lot)
lbs/1000 sqft (g/m2)
Driveway (Medium) Application Rate for Desired LOS in BPRT (hr)
Snow depth
cm (in)
Avg Tp
˚C (ºF) 1 2 3 4 5 6
0.1 to 0.5 (0.04 to
0.2)
-1 to -3 (30
to 27)
2
(10)
1
(5)
1
(5)
1
(5)
0
(0)
0
(0)
0.1 to 0.5 (0.04 to
0.2)
-4 to -6 (25
to 21)
7
(34)
3
(15)
2
(10)
2
(10)
1
(5)
1
(5)
0.1 to 0.5 (0.04 to
0.2)
-7 to -9 (19
to 16)
13
(64)
7
(34)
4
(20)
3
(15)
3
(15)
2
(10)
0.5 to 1.5 (0.2 to
0.6)
-1 to -3 (30
to 27)
7
(34)
4
(20)
2
(10)
2
(10)
1
(5)
1
(5)
0.5 to 1.5 (0.2 to
0.6)
-4 to -6 (25
to 21)
22
(107)
11
(54)
7
(34)
5
(24)
4
(20)
4
(20)
0.5 to 1.5 (0.2 to
0.6)
-7 to -9 (19
to 16)
45
(220)
22
(107)
15
(73)
11
(54)
9
(44)
7
(34)

32
1.5 to 2.5 (0.6 to
1)
-1 to -3 (30
to 27)
14
(68)
7
(34)
5
(24)
4
(20)
3
(15)
2
(10)
1.5 to 2.5 (0.6 to
1)
-4 to -6 (25
to 21)
44
(215)
22
(107)
15
(73)
11
(54)
9
(44)
7
(34)
1.5 to 2.5 (0.6 to
1)
-7 to -9 (19
to 16)
89
(235)
45
(220)
30
(147)
22
(107)
18
(88)
15
(73)
Table A-4: Application Rate for Driveways (High Traffic-Parking Lot)
lbs/1000 sqft (g/m2)
Driveway (High) Application Rate for Desired LOS in BPRT (hr)
Snow depth
cm (in)
Avg Tp
˚C (ºF) 1 2 3 4 5 6
0.1 to 0.5 (0.04
to 0.2)
-1 to -3 (30
to 27)
2
(10)
1
(5)
1
(5)
0
(0)
0
(0)
0
(0)
0.1 to 0.5 (0.04
to 0.2)
-4 to -6 (25
to 21)
6
(29)
3
(15)
2
(10)
1
(5)
1
(5) 1 (5)
0.1 to 0.5 (0.04
to 0.2)
-7 to -9 (19
to 16)
12
(59)
6
(29)
4
(20)
3
(15)
2
(10)
2
(10)
0.5 to 1.5 (0.2 to
0.6)
-1 to -3 (30
to 27)
6
(29)
3
(15)
2
(10)
2
(10)
1
(5)
1
(5)
0.5 to 1.5 (0.2 to
0.6)
-4 to -6 (25
to 21)
19
(93)
10
(49)
6
(29)
5
(24)
4
(20)
3
(15)
0.5 to 1.5 (0.2 to
0.6)
-7 to -9 (19
to 16)
39
(190)
19
(93)
13
(64)
10
(49)
8
(39)
6
(29)
1.5 to 2.5 (0.6 to
1)
-1 to -3 (30
to 27)
12
(59)
6
(29)
4
(20)
3
(15)
2
(10)
2
(10)
1.5 to 2.5 (0.6 to
1)
-4 to -6 (25
to 21)
38
(186)
19
(93)
13
(64)
10
(49)
8
(39)
6
(29)
1.5 to 2.5 (0.6 to
1)
-7 to -9 (19
to 16)
78
(381)
39
(191)
26
(127)
19
(93)
16
(78)
13
(64)