optimal model-based design, dose ranging, and population
TRANSCRIPT

1
Optimal model-based design, dose ranging, and
population PK measures
DAE 2017
Sergei Leonov (ICON Innovation Center)
October 14, 2017

2
• Dose ranging studies • Motivation: earlier study, model-based population
optimal designs • Population PK measures/metrics • Parametric (model-based) vs empirical (nonparametric)
approaches • Splitting sampling grids
Outline

3
Dose-ranging study • A clinical trial where different doses of a drug are tested to establish
which dose works best and/or is least harmful • Usually a phase I or early phase II clinical trial • Typically includes a placebo group of subjects, and a few groups
that receive different doses of the test drug • Main goal: estimate the response vs. dose given (analyze the
efficacy and safety of the drug) • Pharmacokinetic/pharmacodynamic (PK/PD) analysis is critical
Introduction

4
• Pharmacokinetics (PK): how a body affects a drug o Modelling how drug amount /concentration changes over time
(compartmental vs noncompartmental analyses) • Pharmacodynamics (PD): how the drug affects the body
o Concentration – response models o Effect of drug concentration on clinically relevant endpoint
(blood pressure, number of exacerbations ) • Early phases: dense sampling (plasma drug concentration),
small number of subjects • Later phases: population PK/PD analysis, often sparse
sampling with large number of subjects
Introduction (cont.)

5
Motivation
Gagnon, Leonov (2005) • Rich sampling Questions • How many samples to
take? • At which times?
Better sampling scheme → better precision of parameter estimates

6
Models, information matrix
7
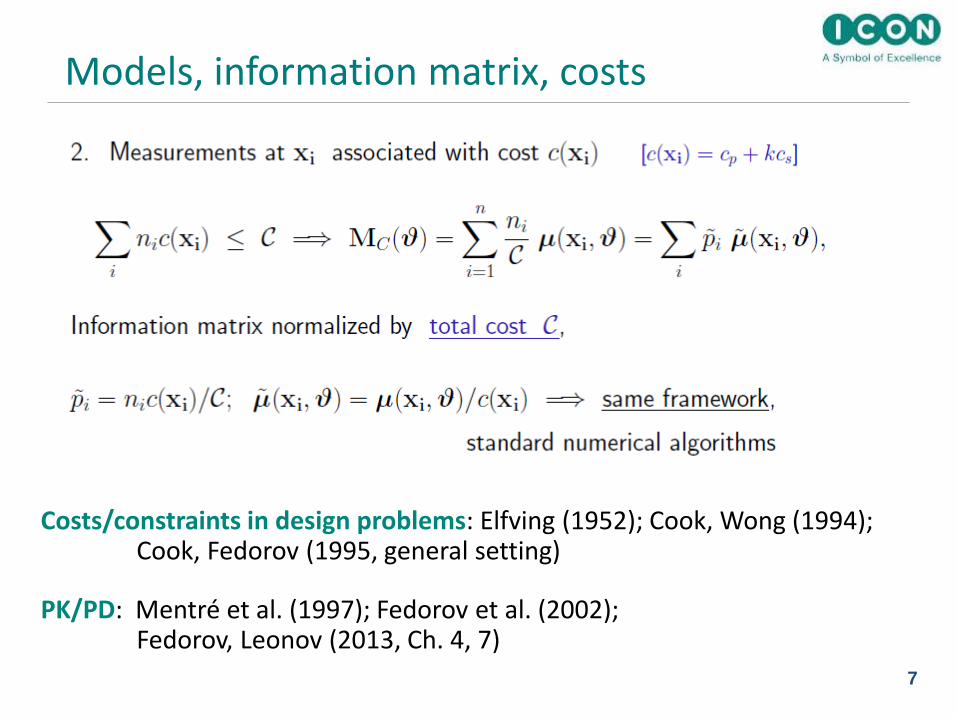
Models, information matrix, costs
Costs/constraints in design problems: Elfving (1952); Cook, Wong (1994); Cook, Fedorov (1995, general setting) PK/PD: Mentré et al. (1997); Fedorov et al. (2002); Fedorov, Leonov (2013, Ch. 4, 7)

8
Motivation (cont.)
No costs: the more samples, the better • # of samples can be reduced
(small loss of precision) Costs introduced • Sequences with smaller number
of samples may become optimal • Optimal design: combination of
sequences (distinct sampling schemes for different cohorts)
• OD, up to 5-point sequences: 3-point and 4-point sequences selected

9
Background: population model

10
• Often interested in PK measures, not parameters: – Area under the curve (time-concentration), AUC
– Maximal concentration, Cmax
– Time to maximal concentration, Tmax
• Optimal design for PK measures: Atkinson et al. (1993)
• Regulatory agencies require non-compartmental analysis
• We compare two approaches (MSE as a metric): – Model-based (compartmental) as a benchmark
– Nonparametric (non-compartmental, empirical)
Practical considerations

11
Example: one-compartment model

12
Motivation (cont.)
Hypothetical example, several options for a PK study • Option 1: 20 patients, sequences of 6 samples for each • Option 2: 24 patients, sequences of 5 samples for each, • ………… • 120 samples per option: which option to choose? Key factors • Sources of variability (population/observational) • Costs • µ(x,θ) – individual information matrix of a k-dimensional predictor x
(sequence of sampling times): how to compute it?
PODE workshops (Population Optimum Design of Experiments, 2006-2017) Software developed/compared: Nyberg et al. (2015, Brit. J. Clin. Pharm.)

13
Numerics
• Optimization: in general, a difficult step • Design region
o t [0,T], continuous variable - ? o X = {x1, x2, …, xs} – set of preselected times = { x = [sequences of k times from X] } – finite set µ(x,θ) can be precomputed Optimization step is easy (e.g., 1st order/Fedorov-Wynn)
• Designs with n < m support points may be non-singular
o By design, µ(x,θ) will have rank >= 1 o Var(εji ) may depend on θ → µ(x,θ) is the sum of two terms →
its rank >= 1
Technical details , OD for population PK/PD models (NLME): Fedorov, Leonov (2013, Chapter 7)

14
Motivation (cont.)
p1
p2
p3

15
D-optimal designs, cost-based

16
Model-based/compartmental, Type I

17
Model-based/compartmental, Type II

18
Model-based/compartmental, Type III

19
Empirical/non-compartmental, Type I

20
Empirical/non-compartmental, Type II

21
Approaches: model-based vs. nonparametric
MSE as a metric

22
Numerical integration
23
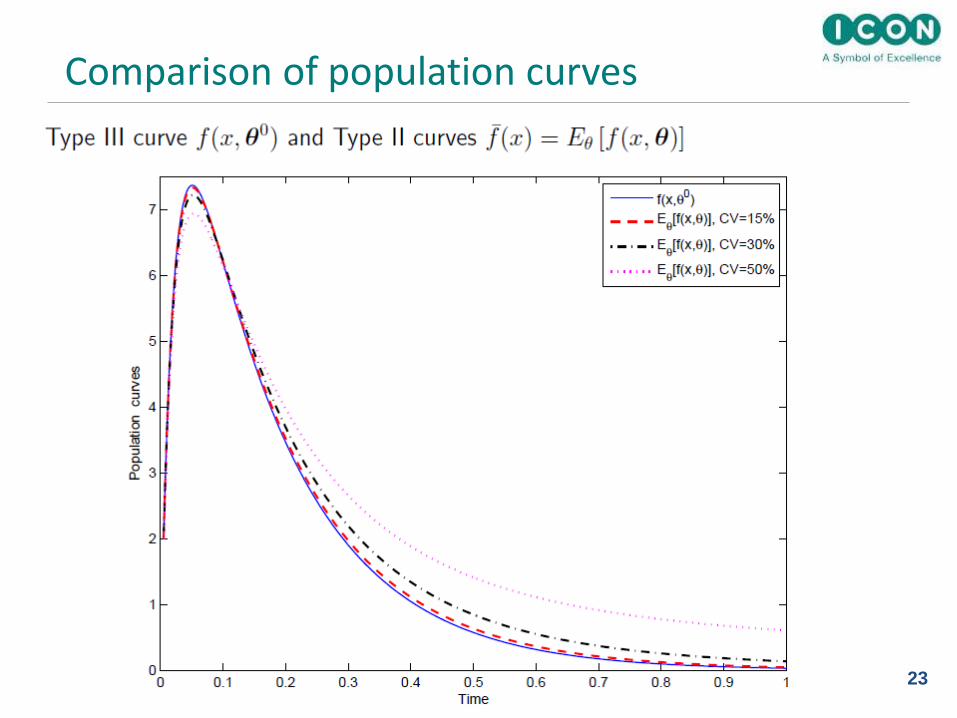
Comparison of population curves

24
PK studies • Dense sampling at the left end (after administering the drug), • Sparse sampling after Tmax
Alternative schemes • Take a uniform grid on the Y-axis with respect to values of response
and project points on the response curve to the X-axis • Take a uniform grid on the Y-axis with respect to values of AUC • López-Fidalgo, Wong (2002): “inverse linear” designs
Sampling schemes

25
Sampling schemes (cont.)

26
Splitting grids

27
Type II measure: AUC Start with averaging responses at each xi
Single grid Split grid

28
Type II measures: Cmax
Single grid Split grid

29
AUC2: closed-form solution for MSE

30
Cost-based designs

31
MSE as function of N (left) or n (right)
32
Concluding remarks
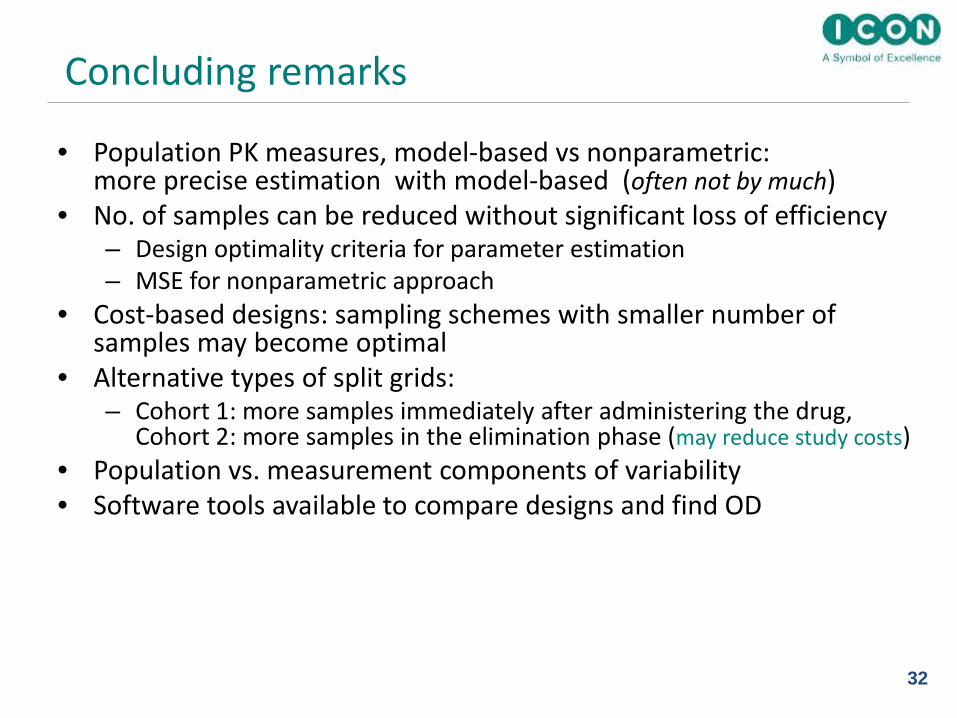
• Population PK measures, model-based vs nonparametric: more precise estimation with model-based (often not by much)
• No. of samples can be reduced without significant loss of efficiency – Design optimality criteria for parameter estimation – MSE for nonparametric approach
• Cost-based designs: sampling schemes with smaller number of samples may become optimal
• Alternative types of split grids: – Cohort 1: more samples immediately after administering the drug,
Cohort 2: more samples in the elimination phase (may reduce study costs) • Population vs. measurement components of variability • Software tools available to compare designs and find OD

33
• Atkinson. A.C., Chaloner, K., Herzberg, A.M., Juritz, J. (1993). Optimal experimental designs for properties of a compartmental model, Biometrics, 49, 325-337.
• Cook, R.D., Fedorov, V.V. (1995). Constrained optimization of experimental design, Statistics, 26, 129-178.
• Cook, R.D., Wong, W.K. (1994). On the equivalence of constrained and compound optimal designs. J. Am. Stat. Assoc., 89(426), 687–692.
• Elfving, G. (1952). Optimum allocation in linear regression theory. Ann. Math. Stat., 23, 255-262. • Fedorov, V., Gagnon, R., Leonov, S. (2002). Design of experiments with unknown parameters in
variance. Appl. Stoch. Mod. Bus. Ind., 18 (3), 207-218. • Fedorov, V.V., Hackl, P. (1997). Model-Oriented Design of Experiments. Springer, New York. • Fedorov, V.V, Leonov, S.L. (2013). Optimal Design for Nonlinear Response Models. Chapman &
Hall/CRC Biostatistics Series, Boca Raton, FL. • Gagnon, R., Leonov, S. (2005). Optimal population designs for PK models with serial sampling. J.
Biopharm. Stat., 15 (1), 143-163. • López-Fidalgo, J., Wong, W.K. (2002). Design issues for Michaelis-Menten model. J. Theor. Biol., 215,
1-11. • Mentré, F., Mallet, A., Baccar, D. (1997). Optimal design in random-effects regression models,
Biometrika, 84 (2), 429-442. • Nyberg, J., Bazzoli, C., Ogungbenro, K., Aliev, A., Leonov, S., Duffull, S., Hooker, A., Mentré, F. (2015).
Methods and software tools for design evaluation in population pharmacokinetics-pharmacodynamics. Brit. J.Clin. Pharm., 79 (1), 6-17.
References
