optimal load flow for connection of transmission network in lao...
TRANSCRIPT
A. Oonsivilai, D. Khamkeo, and R. Oonsivilai / GMSARN International Journal 13 (2019) 183 - 193
183
Abstract— This paper presents the concept of increasing the optimization of the power network in the Lao People's
Democratic Republic. Considering the power, voltage and angle magnitude control by the connection between of 115kV
central-I area transmission network and 115kV transmission network in southern Laos, the operation will be based on
the best search method Particle Swarm Optimization PSO and the Newton-Raphson strategy. Because the Newton-Raphson strategy to improve PSO algorithm can be used to calculate to find optimal power flow. In addition, it will
provide opportunities to improve calculation methods as well as to improve understanding of power systems networks
in Laos. Therefore, in this paper, it includes optimal power production in the system. To simulate the performance of the
system, it will be implemented by planning the production with 115kV central-I area transmission network in Lao PDR
and 16 bus networks in southern Laos are the test case. The test results were then analyzed to determine the optimal
minimum loss of the system.
Keywords— Load flow investigation, The Optimal power flow, Particle Swarm Optimization, Voltage and Angle magnitude
control.
1. INTRODUCTION
An ideal power system is composed of three main
networks. These are generating network, transmission
network and distribution network. The power system is
complete with various kinds of loads along with the
above networks. Power flow examination focuses on the
prevalent operation of the power system underneath
normal as well as sporadic conditions. For extension of
the control system, plausibility examination, expansion
of power system, power flow examination can be a must,
etc., for distinctive loading conditions are to be
examination proficiently. Modern power systems have
become so large and complex that these investigations
should be done with some sort of computer programs.
This program and subsequent assessment of power flow
is commonly known as load flow analysis. Load flow
study hence points to arrive at a relentless state
arrangement of total power networks.
Load flow investigation of a real-time power system
comprising a huge number of buses is complex since
numerous information relate to power, voltage, the
condition of the circuit breaker, the position of the tap of
the transformer, the condition of the reactive power
source, and sink being fundamental. Consequently, it is
vital to continue efficiently to begin with defining the
Anant Oonsivilai is with the School of Electrical Engineering,
Suranaree University of Technology, Nakhonratchasima, Thailand. Douangtavanh Khamkeo is with the School of Electrical
Engineering, Suranaree University of Technology, Nakhonratchasima,
Thailand. Ratchadaporn Oonsivilai is with the School of Food Technology,
Suranaree University of Technology, Nakhonratchasima, Thailand. *Corresponding author: Anant Oonsivilai, Phone: +66-91-415-3941;
E-mail: [email protected], [email protected].
network model of the system. A power system comprises
of a few buses, which are interconnected by implies of
transmission lines. With the assistance of power flow
investigation, the voltage magnitude and angles for all
buses in steady state condition can be gotten. For
efficient power flow through the transmission line, it is
required to keep voltage level of the buses within
specified limit. Once the bus voltages and angles are
calculated, the real and reactive power flow through the
lines can be computed with the assistance of MATLAB.
[25] The steady state real and reactive power provided by
a bus in a power network is communicated in terms of
nonlinear algebraic conditions. Hence it would require
iterative strategies for tackling these conditions. In this
paper, the Newton Raphson strategy for power flow
investigation is utilized since it is favored to Gauss Sidle
strategy considering a few computational aspects. [26]
Within the past two decades, the issue of ideal control
stream (OPF) has gotten much consideration. It is of
current intrigued by numerous utilities and it has been
marked as one of the foremost operational needs. The
OPF issue arrangement points to optimize a chosen
objective work such as fuel taken a toll by means of ideal
alteration of the power system control factors, whereas at
the same time fulfilling different balance and disparity
limitations. The correspondence limitations are the
power flow conditions, whereas the imbalance
limitations are the limits on control factors and the
working limits of power system subordinate factors. The
issue control factors incorporate the generator genuine
powers, the generator transport voltages, the transformer
tap settings, and the receptive control of switchable VAR
sources, whereas the issue subordinate factors
incorporate the stack bus voltages, the generator reactive
powers, and the line flows. By and large, the OPF issue
may be a large-scale profoundly compelled nonlinear
nonconvex optimize. A wide assortment of optimization
Anant Oonsivilai*, Douangtavanh Khamkeo, and Ratchadaporn Oonsivilai
Optimal Load Flow for Connection of Transmission Network
in Lao People's Democratic Republic Using Particle Swarm
Optimization

A. Oonsivilai, D. Khamkeo, and R. Oonsivilai / GMSARN International Journal 13 (2019) 183 - 193
184
methods has been connected in fathoming the OPF issues
[1-19] such as nonlinear programming [1-6], quadratic
programming [7,8], linear programming [9-11], Newton-
based methods [12,13], successive unconstrained
minimization procedure [14], and insides point strategies
[15,16]. For the most part, nonlinear programming based
methods have numerous disadvantages such as unreliable
merging properties and algorithmic complexity.
Quadratic programming based methods have a few
impediments related with the piecewise quadratic cost
estimation. Newton-based methods have a disadvantage
of the merging characteristics that are touchy to the
beginning conditions and they may indeed fall flat to
focalize due to the unseemly beginning conditions.
Consecutive unconstrained minimization strategies are
known to show numerical challenges when the
punishment components got to be amazingly expansive.
In spite of the fact that directs programming strategies
are quick and dependable, they have a few impediments
related with the piecewise direct taken toll estimation.
Insides point strategies have been detailed as
computationally productive. In any case, on the off
chance that the step estimate isn't chosen appropriately,
the sub-linear issue may have a arrangement that's
infeasible within the unique nonlinear space [15]. In the
expansion, insides point strategies, in common, endure
from terrible starting, end, and optimality criteria and, in
most cases, are incapable to illuminate nonlinear and
quadratic objective capacities [16]. For more discussions
on these strategies, we coordinate per user allude to the
comprehensive overview displayed in [17]. For the most
part, most of these approaches apply affectability
investigation and gradient-based optimization
calculations by linearizing the objective work and the
framework limitations around a working point.
Tragically, the issue of the OPF could be a profoundly
nonlinear and multimodal optimization issue, i.e. there
exist more than one neighborhood optimum. Thus,
neighborhood optimization strategies, which are well
explained, are not appropriate for such an issue.
Additionally, there's no nearby measure to choose
whether a local arrangement is additionally the
worldwide arrangement. Hence, routine optimization
strategies that make utilize of subsidiaries and slopes are,
in common, not able to find or distinguish the worldwide
ideal. On the other hand, numerous numerical suspicions
such as convex, expository, and differential objective
capacities ought to be given to streamlining the issue. In
any case, the OPF issue is an optimization issue with, in
common, nonconvex, nonsmooth, and nondifferentiable
objective capacities. These properties have ended up
more apparent and overwhelming in the event that the
impacts of the valve point stacking of warm generators
and the nonlinear behavior of electronic-based gadgets
such as Facts are taking into thought. Subsequently, it
gets to be basic to create optimization procedures that are
effective to overcome these disadvantages and handle
such challenges. Heuristic algorithms such as hereditary
calculations (GA) [18] and developmental programming
[19] have been as of late proposed for tackling the OPF
issue. This comes about detailed were promising and
empowering to assist inquire about in this course.
Tragically, later inquire about has distinguished a few
insufficiencies in GA execution [20]. This corruption
wastefulness is clear in applications with profoundly
epistatic objective functions, i.e. where the parameters
being optimized are exceedingly related. In the
expansion, the untimely joining of GA corrupts its
execution and diminishes its search capability. As of late,
a modern developmental computation method, called
molecule swarm optimization (PSO), has been proposed
and presented [21-24]. This procedure combines social
brain research standards in socio-cognition human
operators and developmental computations. PSO has
been propelled by the behavior of living beings such as
angle tutoring and winged creature running. For the most
part, PSO is characterized as basic in concept, simple to
execute, and computationally effective. Not at all like the
other heuristic methods, has PSO incorporated an
adaptable and well-balanced component to improve and
adjust to the worldwide and nearby investigation
capacities.
In this paper, a novel PSO based approach is proposed
to illuminate the OPF issue. The issue is defined as an
optimization issue with mellow limitations. In this think
about, the distinctive objective work has been considered
to play down the fuel taken a toll, to make strides the
voltage profile, and to upgrade control framework
voltage steadiness. The proposed approach has been
inspected and tried on the IEEE 30-bus standard
framework. The potential and viability of the proposed
approach are illustrated. Moreover, the results are
compared with those detailed within the writing.
Additionally, in the paper is displayed to the strategy for
optimal locating of UPQC-PAC is done by concurrent
minimizing of objective capacities such as network
power loss, the rate of hubs with voltage drop, and
capacity of UPQC. The proposed demonstrate has been a
complicated non-linear of the optimization issue. The
recreation is done on the 33-bus dispersion arrange. The
comes about procured from the reenactment would
outline that in case the wind instability impact is
analyzed within the article, the power loss and PNUVP
rate would be impressively diminished against the
arrange without the wind instability[36]. Moreover, the
paper is also presented an calculation based on a multi-
objective approach for organize reconfiguration.
Multiple destinations are considered for lessening within
the framework control misfortune, deviations of the hubs
voltage and transformers stacking imbalance. These three
destinations are coordinates into an objective work
through weighting variables and the arrangement with
least objective work esteem is chosen for each tie-switch
operation [37]. Therefore, in the framework arranging
arrange is defined with mixed-integer programming.
Two meta-heuristic strategies are considered for this
issue. There are three the taken a toll work was
considered for this issue. The arrangement of the
demonstrate gives the finest line augmentations,
additionally gives data with respect to the ideal era at
each era point. This strategy of arrangement is illustrated
on the development of a 5 bus-bar framework to 6 bus-
bars [38].
A. Oonsivilai, D. Khamkeo, and R. Oonsivilai / GMSARN International Journal 13 (2019) 183 - 193
185
2. MATERIALS AND METHODS
2.1 The necessity of power flow investigation
Load flow studies are embraced to decide
1. The bus voltage magnitude and system voltage
profile.
2. The line flows.
3. The impact of a change in circuit arrangements and
the incorporation of modern circuit components on
system loading.
4. The impact of the transitory loss of transmission
capacity and generations on provided load and going
with impacts.
5. The impact of in-phase and quadrature boost
voltages on system loading data gotten from load flow
can be assist utilized for economic system operation and
system transmission loss minimization.
2.2 Power flow analysis
A bus may be a hub at which one or numerous lines, one
or numerous loads and generators are associated. In a
power framework each node or bus is related with 4
amounts, such as the size of voltage, stage angle of
voltage, active or genuine power and reactive power in
load flow issue two out of these 4 quantities are indicated
and remaining 2 are required to be decided through the
arrangement of the condition. Depending on the amounts
that have been demonstrated, the buses are classified into
3 categories. Buses are classified agreeing to which two
out of the four factors are specified.
2.2.1 Load bus:
No generator is associated with the bus. On this bus,
the real and receptive power is indicated. It is craved to
discover out the voltage magnitude and phase angle
through load flow arrangements. It is required to indicate
as it were Pd and Qd at such bus as at a load bus voltage
can be permitted to differ inside the reasonable values.
2.2.2 Generator bus or voltage controlled bus:
Here the voltage magnitude comparing to the
generator voltage and real power Pg compares to its
rating are indicated. It is required to find out the
receptive power generation Qg and stage angle of the bus
voltage.
2.2.3 Slack (swing) bus:
For the Slack Bus, it is accepted that the voltage
magnitude |V| and voltage phase angle ɵ are known,
though real and receptive powers Pg and Qg are gotten
through the load flow arrangement. [26, 32]
2.2.4 Newton - Raphson Technique:
The Newton-Raphson strategy is broadly utilized for
understanding non-linear conditions. It changes the
initial non-linear issue into a grouping of direct issues
whose solutions approach the arrangements of the first
issue. The Newton-Raphson strategy could be an
effective strategy for understanding non-linear
arithmetical conditions. The elemental Newton-Raphson
expression permits for meeting to be surveyed by
comparing control bungles against a pre-specified
resistance instead of voltage comparisons.
* *
1
(1)n
k k kj j
j
S V Y V
(2)k k kV V
(3)j j jV V
(4)kj kj kjV V
then
* *
1
(5)n
k k kj j kj j k
j
S V Y V
from which
1
cos (6)n
k k kj j kj j k
j
P V Y V
1
cos (7)n
k k kj j kj j k
j
Q V Y V
This condition is in a reasonable shape for fractional
separation to infer the components of the Jacobian, J
given by the taking after matrix..
1 2
3 4
(8)J J
J J
Real and reactive power jumble can be communicated
by taking after matrix equation
1 2
3 4
(9)J JP
VJ JQ
V
The Newton Raphson strategy is the foremost robust
power flow algorithm utilized to hone. Be that as it may,
the downside of this strategy lies within the reality that
the terms of the Jacobian matrix must be recalculated and
at that point, the complete set of linear conditions must
also be solved in each iteration [27,31].
3. PARTICLE SWARM OPTIMIZATION
3.1. Overview
Like developmental calculations, PSO procedure
conducts a look employing a populace of particles,
comparing to people. Each particle speaks to a candidate
arrangement to the issue at hand. In a PSO framework,
particles alter their positions by flying around in a multi-
dimensional look space until a moderately perpetual
position has been experienced, or until computational
limitations are surpassed. Within the social science
setting, a PSO framework combines a social-only
demonstrate and a cognition-only show [21]. The social-
only component recommends that people overlook their
claim involvement and alter their behavior according to
the fruitful convictions of people within the
A. Oonsivilai, D. Khamkeo, and R. Oonsivilai / GMSARN International Journal 13 (2019) 183 - 193
186
neighborhood. On the other hand, the cognition-only
component treats people as separated creatures. A
molecule changes its position utilizing these models.
3.2. PSO algorithm
Particle swarm optimization (PSO) is propelled by social
and agreeable behavior shown by different species to fill
their needs within the look space. The calculation is
guided by individual involvement (Pbest), in general
encounter (Gbest) and the display development of the
particles to decide their next positions within the look
space. Encourage, the encounters are quickened by two
variables c1 and c2, and two irregular numbers produced
between [0, 1] though the display development is
increased by a dormancy calculate w changing between
[wmin, wmax].
The starting populace (swarm) of estimate N and
measurement D is indicated as X = [X1, X2,..., XN]T
,
where ‘T’ signifies the transpose administrator. Each
person (molecule) Xi (i = 1, 2,..., N) is given as Xi=[Xi,1,
Xi,2, ..., Xi,D]. Moreover, the starting speed of the
populace is signified as V = [V1,V2,...,VN]T . In this way,
the speed of each molecule Xi (i = 1, 2, ..., N) is given as
Vi=[Vi,1, Vi,2, ..., Vi,D]. The file i shifts from 1 to N while
the record j changes from 1 to D. The detailed
algorithms of various methods are described below for
completeness.
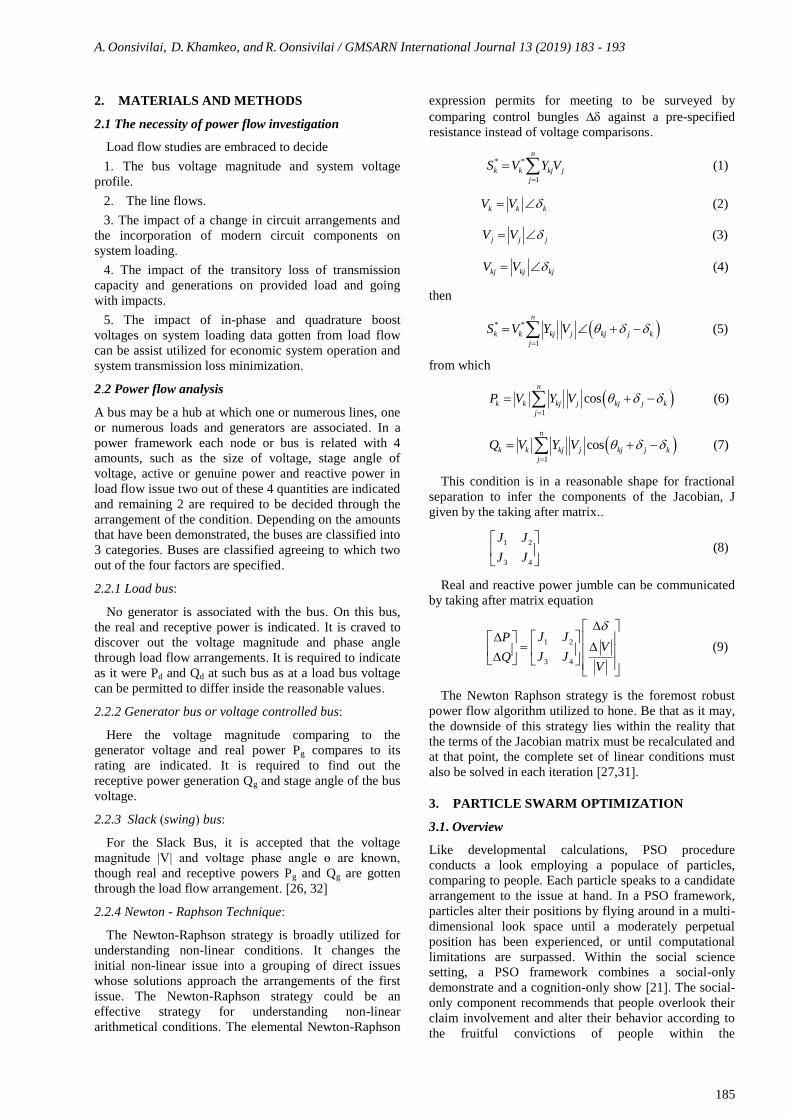
1
, , 1 2 , ,
2 2 , ,
(10)
k k k k
i j i j i j i j
k k
i j i j
V w V c r Pbest X
c r Gbest X
1 1
, , , (11)k k k
i j i j i jX X V
In equation (1), represents personal best jth
component of ith
individual, whereas represents
jth
component of the best individual of population upto
iteration k. Figure 1 appears the look component of PSO
in a multidimensional look space.
Fig. 1. PSO search mechanism in multi dimentional search
space.
The different steps of PSO are as follows [34]:
1. Set parameter wmin, wmax, c1 and c2 of PSO
2. Initialize population of particles having
positions X and velocities V
3. Set iteration k = 1
4. Calculate fitness of particles , ik k
i iF f X
and find the index of the best particle b
5. Select , ik k
i iPbest X and
k k
bGbest X
6. max max min / (12)w w kx w w Maxite
7. Upgrade speed and position of particles
1
, , 1 , ,
2 , ,
(13); j and i
k k k k
i j i j i j i j
k k
i j i j
V w V c rand Pbest X
c rand Gbest X
1 1
, , , ; j and i (14)k k k
i j i j i jX X V
8. Assess fitness 1 1 , ik k
i iF f X and find
the file of the finest particle b1
9. Upgrade Pbest of populace 1, if Fk k
i ii F
then 1 1k k
i iPbest X else 1 1k k
i iPbest Gbest
10. Upgrade Gbest of populace, 1
1if Fk k
b bF then
1 1
1
k k
bGbest Pbest and set 1b b else
1k kGbest Gbest
11. If k < Maxite then k = k + 1 and go to step 6
else go to step 12
12. Print ideal arrangement as
The most commonly used parameters of PSO
algorithm are considered as follows:
• Inertial weight: 0.9 to 0.4
• Acceleration factors (c1 and c2): 2 to 2.05
• Population size: 10 to 100
• Maximum iteration (Maxite): 500 to 10000
• Initial velocity: 10 % of position
3.3. PSO implementation
The proposed PSO based approach was implemented
using the MATLAB program and the developed software
program was executed on a 1.90GHz Celeron(R) Dual-
Core CPU, 2.00GB Initially, a few runs have been done
with distinctive values of the PSO key parameters such
as the introductory idleness weight and the greatest
admissible speed. In our usage, the beginning idleness
weight and the number of interims in each space
measurement N are chosen as 1.0 and 10 separately.
Other parameters are chosen as the number of particles
n=50, decrement steady and the look will
be ended on the off chance that (a) the number of
emphases since the final alter of the most excellent
arrangement is more prominent than 50; or (b) the
number of emphases comes to 500.
To demonstrate the effectiveness of the proposed
approach, different cases with various objectives are
considered in this study.
3.3.1 The PSO Explanation with OPF Method
The classical strategy such as conventional strategy,
Newton-Raphson strategy will be analyzed. These
strategies can be utilized online but the powerless point
,
kji
Pbest
k
jGbest
kGbest
0w
1 2c 2,c

A. Oonsivilai, D. Khamkeo, and R. Oonsivilai / GMSARN International Journal 13 (2019) 183 - 193
187
is minimum local and is not a worldwide least. In all of
the said strategies, the point of diminishing misfortunes
is classic strategy focusing on the value of angle load and
voltage.
1) Specification of the objective function of Real
power system losses
1 1 1
min (15)gNN N
L i gi li
i i i
P P P P
2) Real power of ith
bus
1
cos sin (16)N
i i k ik i k ik i k
k
P V V G B
3) Reactive power of ith
bus
1
sin cos (17)N
i i k ik i k ik i k
k
Q V V G B
4) The Lagrange function
1 1
1
, , ,
(18)
,
g
g
N N
g gi i i gi li
i i
N
i i gi li
i N
L P V F P P P V P P
Q Q V Q Q
5) Limitations for the operation of the unit:
min max (19)i i iP P P
The min
iP and max
iP are active power of minimum and
maximum generation, respectively.
6) Limitations for the operation of the unit:
min max (20)i i iQ Q Q
The min
iQ and max
iQ are reactive power of minimum and
maximum generation, respectively.
7) Limitations on network stability:
min max (21)i i iV V V
Themin
iV and max
iV are voltage magnitude of
minimum and maximum at bus, respectively.
8) Limitations on network stability
max
D , i,j,...,N , i j (22)i j ij
where ij is the first voltage angle (load angle) at the bus
of (i, j) and max
ij is the maximum voltage angle. The (i-j)
are indicators of the line i-j and ND is the number of bus
that has limitation for network stability.
4. RESULTS AND DISCUSSION
This paper will consider the Central-I area
transmission network of in Lao PDR [35] connect
with new transmission network in southern Laos as
case study.
Fig. 2. Single line diagram of central I area transmission network
So that, a case study in Lao PDR has presented the
connection between two power networks in Laos to
simulate the performance of the system, it will be
implemented by planning the production with 115kV
central-I area transmission network in Lao PDR by using
16 bus networks in southern Laos is the test case. The
test results using two methods to find solution of title
with PSO algorithm and the Newton-Raphson strategy to
improve PSO algorithm based approach was
implemented using the MATLAB program and the
developed software program for analyzed to determine
the power production and the optimal minimum loss of
the system.
In two proposed for optimal load flow were used the
PSO algorithm and the Newton-Raphson strategy to
improve PSO algorithm -based approach has been tested
on 2 power networks in Laos to connect at bus 3th of
115kV central-I area transmission network in Laos with
bus 32th
of the 16 bus system in southern Laos in Figure
2 and Figure 3. The system bus data and line data are
given in Table1and Table2, respectively. The framework
has eleven generators at buses 1, 2, 7, 19, 26, 27, 28, 32,
33, 34 and 41.

A. Oonsivilai, D. Khamkeo, and R. Oonsivilai / GMSARN International Journal 13 (2019) 183 - 193
188
Fig. 3. Power Network - 16 bus system in southern Laos.
Table 1. Bus data of 2 connect power networks in Laos
Bus
number
Load Active
power (MW)
Reactive
Power(MVAR)
1 3.300 1.500
2 0.390 0.000
3 0.000 0.000
4 0.000 0.000
5 7.180 6.000
6 6.500 5.000
7 1.600 0.200
8 0.100 0.000
9 0.100 0.000
10 4.000 0.890
11 0.000 0.000
12 15.000 11.300
13 81.600 24.800
14 4.100 0.800
15 15.700 8.300
16 46.600 18.900
17 47.800 20.000
18 68.500 16.700
19 0.000 0.000
20 29.200 11.900
21 5.000 1.000
22 7.700 3.600
23 56.400 12.000
24 33.700 22.400
25 46.600 14.700
26 0.000 0.000
27 18.000 2.000
28 5.300 0.500
29 5.000 1.400
30 15.450 5.120
31 5.930 1.610
32 16.710 -0.700
33 28.470 0.000
34 0.000 0.000
35 0.200 0.000
36 9.670 -2.620
37 24.000 8.600
38 8.530 -2.370
39 0.120 0.000
40 0.200 0.000
41 28.470 0.000
Table 2. Line data of 2 power network s in Laos
Bus to Bus Resistance Reactance
(p.u) (p.u)
1 4 0.0044 0.01475
2 3 0.14864 0.50549
2 14 0.07729 0.25911
4 10 0.0174 0.05838
10 11 0.03625 0.12162
11 12 0.01725 0.03781
11 13 0.01088 0.03649
13 15 0.06626 0.06729
4 5 0.10167 0.20013
5 6 0.23565 0.46581
6 7 0.10802 0.36437
4 8 0.00907 0.0304
8 9 0.04894 0.16644
1 13 0.06606 0.21005
1 13 0.06606 0.21005
13 16 0.02608 0.07316
13 18 0.07892 0.2251
18 20 0.03899 0.11587
18 20 0.05886 0.12683
20 21 0.04057 0.11944
22 14 0.01231 0.03269
22 23 0.11082 0.32656
23 20 0.05574 0.16564
17 18 0.01112 0.03199
17 18 0.01112 0.03199
17 19 0.0962 0.2731
17 19 0.0962 0.2731
18 19 0.08321 0.23387
18 19 0.08321 0.23387
18 24 0.03832 0.16852
24 25 0.07978 0.23488
16 17 0.12182 0.14921
16 17 0.12182 0.14921
17 24 0.0507 0.14913
15 16 0.03793 0.04075
3 32 29.47916 6.430783
26 29 10.14083 2.212189
27 29 1.049458 0.228935
27 29 1.049458 0.228935
28 29 3.773333 0.82314
29 30 6.485416 1.414772
29 30 6.485416 1.414772
30 31 8.097337 1.766407
30 31 8.097337 1.766407
30 32 3.065833 0.668801
30 32 3.065833 0.668801
32 33 0.365541 0.079741
A. Oonsivilai, D. Khamkeo, and R. Oonsivilai / GMSARN International Journal 13 (2019) 183 - 193
189
32 33 0.365541 0.079741
32 36 8.961666 1.954958
33 34 1.933833 4.218594
33 35 4.999666 1.09066
34 35 3.065833 0.668801
35 36 5.094 11.11239
35 36 5.094 11.11239
36 37 1.084833 0.236652
36 37 1.084833 0.236652
36 38 7.027833 15.33098
36 38 7.027833 15.33098
38 39 7.334416 1.599978
38 39 7.334416 1.599978
38 40 13.26562 2.893852
38 40 13.26562 2.893852
37 41 8.607916 1.877788
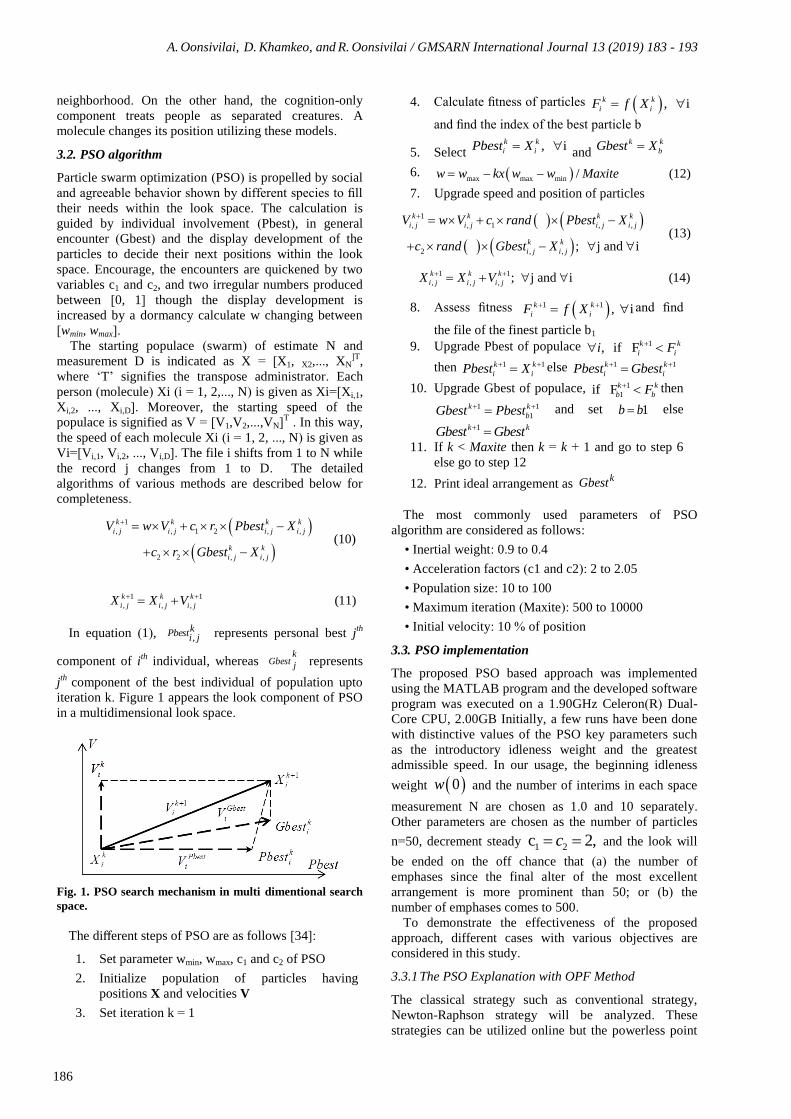
The power network has eleven generators at buses 1,
2, 7, 19, 26, 27, 28, 32, 33, 34 and 41. The limitations are
given in Tabl3and Table4, respectively.
Table 3. Limit data of active and reactive power
Bus No Pmax Pmin Qmax Qmin
1 137 12.8 0.0 0.0
2 25.5 -12.0 0.0 0.0
7 1.0 0.0 0.0 0.0
19 355.1 -31.7 0.0 0.0
26 200 50 0.5 0.1
27 80 20 2.0 1.0
28 50 15 0.5 0.1
32 35 10 7.7 -0.2
33 30 10 3.0 0.5
34 40 12 3.0 0.5
41 80 20 8.6 1.3
Table 4. Limit data of Voltage and Angle
Bus No Vmax Vmin max min
1 0.95 1.1 30 -30
2 0.95 1.1 30 -30
3 0.95 1.1 30 -30
4 0.95 1.1 30 -30
5 0.95 1.1 30 -30
6 0.95 1.1 30 -30
7 0.95 1.1 30 -30
8 0.95 1.1 30 -30
9 0.95 1.1 30 -30
10 0.95 1.1 30 -30
11 0.95 1.1 30 -30
12 0.95 1.1 30 -30
13 0.95 1.1 30 -30
14 0.95 1.1 30 -30
15 0.95 1.1 30 -30
16 0.95 1.1 30 -30
17 0.95 1.1 30 -30
18 0.95 1.1 30 -30
19 0.95 1.1 30 -30
20 0.95 1.1 30 -30
21 0.95 1.1 30 -30
22 0.95 1.1 30 -30
23 0.95 1.1 30 -30
24 0.95 1.1 30 -30
25 0.95 1.1 30 -30
26 0.95 1.1 30 -30
27 0.95 1.1 30 -30
28 0.95 1.1 30 -30
29 0.95 1.1 30 -30
30 0.95 1.1 30 -30
31 0.95 1.1 30 -30
32 0.95 1.1 30 -30
33 0.95 1.1 30 -30
34 0.95 1.1 30 -30
35 0.95 1.1 30 -30
36 0.95 1.1 30 -30
37 0.95 1.1 30 -30
38 0.95 1.1 30 -30
39 0.95 1.1 30 -30
40 0.95 1.1 30 -30
41 0.95 1.1 30 -30
In this paper is a collection of data for two power
networks at central and southern Laos then bring to the
connection to find the optimal value of the power
production and minimum power loss of system power
network in Laos. In addition, also consider has been to
considering of the two power networks 115kV central-I
area transmission network and 115kV transmission
network in southern Laos by the connection between at
bus 32 of XESET1 hydropower station of 16 bus system
in southern Laos and at bus 3 of the PH SAVANH
substation of 115kV central-I area transmission network
with length 250km for optimal of power generation.
Because the XESET1 hydropower station is the bus near
of the bus at the PH SAVANH substation. The system
has the power load demand of 647.120MW of the
arrangement of power generation of hydro power plants.
.In the first method able to obtain the power generation
of systems 650.219 MW and the second method able to
obtained the power generation of systems 656.036 MW
the arrangement of power generation of hydro power
plants. It is too characterized optimal minimum losses for
the considered system. Through two method the best of
arrangement for fathoming this issue appear in Table 5
and Table 6, respectively are gotten results fulfills the
craved producing unit’s imperatives. The convergence
property of the algorithm is outlined in Figure 4 and
Figure 5, respectively.
Table 5. The Result Voltage Magnitude and Angle Degree
of the PSO optimal load flow of 16 bus system in southern
Laos connect with 115kV central-I area transmission
network in Lao PDR
Bus
No
Voltage Mag. Angle Degree
PSO
algorithm
Newton
Raphson
in PSO
PSO
algorithm
Newton
Raphson
in PSO
1 0.985 1.000 0.000 0.000
2 1.025 1.000 0.003 0.002

A. Oonsivilai, D. Khamkeo, and R. Oonsivilai / GMSARN International Journal 13 (2019) 183 - 193
190
3 0.951 0.634 0.005 0.291
4 1.028 1.011 0.006 0.000
5 1.002 1.044 0.002 0.001
6 1.001 1.039 0.002 0.002
7 0.950 1.000 0.009 0.002
8 0.950 1.018 0.001 0.000
9 1.024 1.036 0.007 0.000
10 1.065 1.014 0.002 0.001
11 1.027 1.006 0.005 0.001
12 1.026 1.001 0.004 0.001
13 1.051 1.002 0.007 0.001
14 1.049 1.052 0.004 0.000
15 1.066 0.994 0.003 0.001
16 0.975 0.995 0.001 0.001
17 0.970 1.008 0.004 0.001
18 0.965 1.010 0.002 0.001
19 1.009 1.000 0.005 0.004
20 0.958 1.026 0.007 0.001
21 1.090 1.034 0.002 0.002
22 0.971 1.053 0.003 0.001
23 0.950 1.032 0.007 0.002
24 1.058 0.988 0.008 0.002
25 1.026 0.933 0.008 0.004
26 1.031 1.000 0.005 17.483
27 0.994 1.000 0.005 18.056
28 1.099 1.000 0.009 17.983
29 1.089 0.997 0.008 18.068
30 1.100 0.148 0.002 18.216
31 1.047 0.547 0.004 18.111
32 0.991 1.000 0.002 18.385
33 0.999 1.000 0.003 18.414
34 0.969 1.000 0.003 18.429
35 0.998 0.870 0.005 18.379
36 0.954 0.395 0.003 18.374
37 1.009 0.072 0.005 18.367
38 1.094 0.230 0.000 18.284
39 1.025 0.128 0.001 18.266
40 1.021 0.758 0.006 18.311
41 0.997 1.000 0.008 18.368
Table 6. The Result active and reactive power of the PSO
optimal load flow of 16 bus system in southern Laos
connect with 115kV central-I area transmission network in
Lao PDR
Bus
No
Pg(MW) Qg(MW)
PSO
algorithm
Newton
Raphson
in PSO
PSO
algorithm
Newton
Raphson
in PSO
1 137.000 56.014 12.800
2 25.500 25.500 -12.000 104.187
3 0.000 0.000 0.000 0.000
4 0.000 0.000 0.000 0.000
5 0.000 0.000 0.000 0.000
6 0.000 0.000 0.000 0.000
7 1.000 1.000 0.000 -11.938
8 0.000 0.000 0.000 0.000
9 0.000 0.000 0.000 0.000
10 0.000 0.000 0.000 0.000
11 0.000 0.000 0.000 0.000
12 0.000 0.000 0.000 0.000
13 0.000 0.000 0.000 0.000
14 0.000 0.000 0.000 0.000
15 0.000 0.000 0.000 0.000
16 0.000 0.000 0.000 0.000
17 0.000 0.000 0.000 0.000
18 0.000 0.000 0.000 0.000
19 355.100 355.100 -31.700 -210.367
20 0.000 0.000 0.000 0.000
21 0.000 0.000 0.000 0.000
22 0.000 0.000 0.000 0.000
23 0.000 0.000 0.000 0.000
24 0.000 0.000 0.000 0.000
25 0.000 0.000 0.000 0.000
26 50.000 50.016 0.438 -25.930
27 20.000 40.002 1.000 -315.679
28 15.000 20.379 0.414 -4.910
29 0.000 0.000 0.000 0.000
30 0.000 0.000 0.000 0.000
31 0.000 0.000 0.000 0.000
32 10.000 29.886 1.291 -415.514
33 10.000 16.285 2.245 -188.829
34 12.436 26.559 2.006 -54.876
35 0.000 0.000 0.000 0.000
36 0.000 0.000 0.000 0.000
37 0.000 0.000 0.000 0.000
38 0.000 0.000 0.000 0.000
39 0.000 0.000 0.000 0.000
40 0.000 0.000 0.000 0.000
41 20.000 29.480 7.331 -16.303
Fig. 4. Total loss of 16 bus system in southern Laos connect
with 115kV central-I area transmission network in Lao
PDR the Newton Raphson method issue for improving the
particle swarm optimization algorithm.
0 20 40 60 80 100 120 140 1603.09
3.1
3.11
3.12
3.13
3.14
3.15
3.16
Iteration
Tota
l lo
ss (
MW
)
PSO convergence characteristic

A. Oonsivilai, D. Khamkeo, and R. Oonsivilai / GMSARN International Journal 13 (2019) 183 - 193
191
Fig. 5. Total loss of 16 bus system in southern Laos connect
with 115kV central-I area transmission network in Lao
PDR for the particle swarm optimization algorithm
The formula for the optimal power flow related to the
two connected systems is power loss equal to power
production minus power load demand. In addition, that is
using the PSO algorithm for solving the problem of
minimum power loss and the Newton-Raphson strategy
to be applied the PSO algorithm for solving the problem
of minimum power loss on two power networks in Laos.
Finally, the obtained result can be verified by the
comparison between voltage magnitude, angle degree,
active power, reactive power, and minimum power loss
of two methods. Through the proposed algorithm the best
of arrangement for fathoming this issue appear the gotten
results fulfill the craved producing unit’s imperatives.
After the test, we have obtained voltage magnitude,
angle degree, active power, reactive power, and the
minimum total loss in Table. 5, Table. 6, Table. 7,
respectively. Finally, we selected the 16 bus system in
southern connect with 115kV central-I area transmission
network was a case study suitable for the optimization
power network system in Lao P.D.R.
Table 7. The result of the PSO for total minimum power
loss
Name of system
Total Power Loss(MW/h)
PSO
algorithm
Newton
Raphson in
PSO
16 bus system in
southern Laos connect
with 115kV central-I
area transmission
network in Lao PDR
8.9158 3.0990
5. CONCLUSION
In this paper Power Flow examination are carried out for
2 power network connection between 16 bus system in
southern Laos and 115kV central-I area transmission
network in Lao PDR utilizing particle swarm
optimization algorithm and the Newton-Raphson strategy
to improve particle swarm optimization algorithm. The
point is to decide voltage magnitude and comparing
angles for all the buses of the network. Line flows are
moreover calculated. It is hence simple to calculate the
system losses from these flows. It is seen that the number
of iterations for convergence is less for 2 power network
utilizing the computer program indeed beneath load
deviation in load buses and alters in R/X proportions for
different lines.
However, the Newton-Raphson strategy is broadly
utilized for understanding non-linear conditions. In
addition, this paper is also the particle swarm
optimization to OPF issue has been displayed. In more
expansion, this paper was used by the Newton Raphson
method issue for improving the particle swarm
optimization algorithm has been displayed. The proposed
of this method to fast calculation and capabilities of the
Newton Raphson to search for the optimal settings and
more the proposed approach utilizes the worldwide and
neighborhood investigation capabilities of PSO to search
for the optimal settings of the control factors. Therefore,
the objective has been considered to minimize the loss of
the system, to improve the voltage profile, angle and to
upgrade voltage steadiness. Finally, the proposed
approach has been tested two perform connection to
define minimize the loss of the system and It is possible
to compare the difference in the outcome of the answer
clearly.
ACKNOWLEDGMENT
This work is supported by Research and Development
Institute, Suranaree University of Technology, Thailand.
NOMENCLATURE
Nomenclature in power system network
Power rated at bus k (MVA)
Voltage at bus k (kV)
Admittance between bus k and bus j
Voltage at bus j (kV)
Voltage between bus k and bus j (kV)
Active power at bus k (MW)
Reactive power at bus k (MVar)
Phase angel at bus k
Phase angel at bus j
Phase angel between bus k and bus j
the components of the Jacobian
Average of active power (MW)
Average of reactive power (MVar)
Average angel
Averagr of magnitude voltage
magnitude voltage
0 100 200 300 400 500 600 700 800 9000
20
40
60
80
100
120
140
Iteration
Tota
l lo
ss (
MW
)PSO convergence characteristic
*kS
*kV
kjY
jV
kjV
kP
kQ
k
j
kj
1 2 3 4, , , J J J J
P
Q
V
V

A. Oonsivilai, D. Khamkeo, and R. Oonsivilai / GMSARN International Journal 13 (2019) 183 - 193
192
REFERENCES
[1] Dommel H., Tinny W., “Optimal power flow
solution”, IEEE Trans Pwr Appar Syst 1968;PAS-
87(10):1866-76.
[2] Alsac O., Stott B., “Optimal load flow with steady
state security”, IEEE Trans Pwr Appar Syst
1974;PAS-93:745-51.
[3] Shoults R., Sun D., “Optimal power flow based on
P-Q decomposition”, IEEE Trans Pwr Appar Syst
1982;PAS-101(2):397-405.
[4] Happ HH., “Optimal power dispatch: a
comprehensive survey”, IEEE Trans Pwr Appar Syst
1977;PAS-96:841-54.
[5] Mamandur KRC., “Optimal control of reactive
power flow for improvements in voltage profiles and
for real power loss minimization”, IEEE Trans Pwr
Appar Syst 1981;PAS-100(7):3185-93.
[6] Habiabollahzadeh H., Luo GX, Semlyen A.,
“Hydrothermal optimal power flow based on a
combined linear and nonlinear programming
methodology”, IEEE Trans Pwr Syst 1989;PWRS-
4(2):530-7
[7] Burchett RC., Happ HH., Vierath DR.,
“Quadratically convergent optimal power flow”,
IEEE Trans Pwr Appar Syst 1984;PAS-103:3267-
76.
[8] Aoki K., Nishikori A., Yokoyama RT., “Constrained
load flow using recursive quadratic programming”,
IEEE Trans Pwr Syst 1987;2(1):8-16.
[9] Abou El-Ela AA., Abido MA., “Optimal operation
strategy for reactive power control, Modelling,
simulation and control”, part A, vol. 41(3). AMSE
Press, 1992 p. 19-40.
[10] Stadlin W., Fletcher D., “Voltage versus reactive
current model for dispatch and control”, IEEE Trans
Pwr Appar Syst 1982;PAS- 101(10):3751-8.
[11] Mota-Palomino R., Quintana VH., “Sparse reactive
power scheduling by a penalty-function linear
programming technique”, IEEE Trans Pwr Syst
1986;1(3):31-39.
[12] Sun DI., Ashley B., Brewer B., Hughes A., Tinney
WF., “Optimal power flow by Newton approach”,
IEEE Trans Pwr Appar Syst 1984;PAS-
103(10):2864-75.
[13] Santos A., da Costa GR., “Optimal power flow
solution by Newton's method applied to an
augmented lagrangian function”, IEE Proc Gener
Transm Distrib 1995;142(1):33-36.
[14] Rahli M., Pirotte P., “Optimal load flow using
sequential unconstrained minimization technique
(SUMT) method under power transmission losses
minimization”. Electric Pwr Syst Res 1999;52:61-
64.
[15] Yan X., Quintana VH., “Improving an interior point
based OPF by dynamic adjustments of step sizes and
tolerances”. IEEE Trans Pwr Syst 1999;14(2):709-
17.
[16] Momoh JA., Zhu JZ., “Improved interior point
method for OPF problems”. IEEE Trans Pwr Syst
1999;14(3):1114-20.
[17] Momoh J., El-Hawary M., Adapa R., “A review of
selected optimal power flow literature to 1993, Parts
I and II”. IEEE Trans Pwr Syst 1999;14(1):96-111.
[18] Lai LL., Ma JT., “Improved genetic algorithms for
optimal power flow under both normal and
contingent operation states”. Int J Elec Pwr Energy
Syst 1997;19(5):287-92.
[19] Yuryevich J., Wong KP., “Evolutionary
programming based optimal power flow algorithm”.
IEEE Trans Pwr Syst 1999;14(4):1245-50.
[20] Fogel DB., “Evolutionary computation toward a new
philosophy of machine intelligence”. New York:
IEEE Press, 1995.
[21] Kennedy J., “The particle swarm: social adaptation
of knowledge”. Proc 1997 IEEE Int Conf Evol
Comput ICEC'97, Indianapolis, IN, USA 1997:303-
8.
[22] Angeline P., “Evolutionary optimization versus
particle swarm optimization: philosophy and
performance differences”. Proc 7th Annu Conf Evol
Prog 1998:601-10.
[23] Shi Y., Eberhart R., “Parameter selection in particle
swarm optimization”. Proc 7th Annu Conf Evol
Prog 1998:591-600.
[24] Ozcan E., Mohan C., “Analysis of a simple particle
swarm optimization system”. Intel Engng Syst Artif
Neural Networks 1998;8:253-8.
[25] M.A.Pai., “Computer Techniques in Power System
Analysis”, second edition, ISBN: 0-07-059363-9,
Tata McGraw Hill [2005].
[26] A.E.Guile and W.D. Paterson, „Electrical power
systems, Vol. 2‟. (Pergamon Press, 2nd edition,
1977).
[27] Dharamjit and D.K.Tanti., “Load Flow study on
IEEE 30 Bussystem”, International Journal of
Scientific and Research Publications, Volume 2,
Issue 11, November 2012, ISSN 2250-3153
[28] Muralikrishna Allem., J.O.Chandle., “Prediction
of Weakest Area and Line in IEEE 57 Bus System”,
IJIRSET, Vol. 3, Issue 6, June 2014, ISSN: 2319-
8753
[29] Glenn W. Stagg and Ahmed H. El-Abiad.,
“Computer Methods in Power System Analysis”,
McGraw-Hill [1968].
[30] S. Jamali., M.R.Javdan., H. Shateri and M.
Ghorbani., “Load Flow Method for Distribution
Network Design by Considering Committed
Loads”, Universities Power Engineering
Conference, vol.41, no.3, pp. 856 – 860,
sept.2006
[31] N. Usha., “Simulation results of eight bus system
using push-pull inverter base STATCOM”,
Journal of Theoretical and Applied Information
Technology, 2005 - 2009 JATIT.
[32] C. R. Feurte – Esquivel and E. Acha., “A
Newton-type algorithm for the control of power
flow in electrical power networks”, IEEE
Transactions on Power Systems, Vol.12,
Nov.1997.
[33] Rohit Kapahi., “Load flow analysis of 132 KV
substation using ETAP software”, International
Journal of Scientific & Engineering Research

A. Oonsivilai, D. Khamkeo, and R. Oonsivilai / GMSARN International Journal 13 (2019) 183 - 193
193
Volume 4, Issue 2, February- 2013,ISSN 2229-
5518
[34] M. N. Alam., B. Das., V. Pant., “A comparative
study of metaheuristic optimization approaches for
directional overcurrent relays coordination”, Electric
Power Systems Research 128 (2015) 39–52
[35] B. O. Philavanh., S. Premrudeepreechacharn.,
“Power and Voltage Control of Central-I
Transmission Network in Lao PDR Using Excel’s
Solver”, IEEE, and J. Triyangkulsri, 2004
Intemational Conference on Power Syslem
Technology - POWERCON 2004 Singapore, 21-24
November 2004
[36] A. R. Moradi., Y. Alinejad-Beromi., M. Parsa., M.
Mohammadi., “Optimal Locating and Sizing of
Unified Power Quality Conditioner- phase Angle
Control for Reactive Power Compensation in Radial
Distribution Network with Wind Generation”,
International Journal of Engineering,
TRANSACTIONS B: Applications Vol. 31, No. 2,
(February 2018) 299-306.
[37] J.S. Savier and D. Das., ”A multi-objective method
for network reconfiguration“, Received: August 16,
2008 – Accepted in Revised Form: July 2, 2009,
International Journal of Engineering Transactions A:
Basics, Vol. 22, No. 4, November 2009, 333-350.
[38] A. Sadegheih, ”A novel method for designing and
optimization of networks”, Received: July 31, 2006
- Accepted in Revised Form: January 18, 2007,
International Journal of Engineering Transactions A:
Basics, Vol. 20, No. 1, February 2007, 17-26.