optimal integration of steam turbines in …optimal integration of steam turbines in industrial...
TRANSCRIPT
OPTIMAL INTEGRATION
OF STEAM TURBINES IN
INDUSTRIAL PROCESS PLANTS
J D Kumana, MS ChE
Kumana & Associates, Houston, Tx
[email protected] (281) 437-5906
AIChE-STS, network meeting
Houston, 2 Feb 2018
Kumana & Associates © 2018 2
Outline
• Definitions: CHP and Efficiency
• Thermodynamics Review
• Energy integration theory
• CHP models

Kumana & Associates © 2018 3
• CHP = Combined Heat and Power (= energy utility system for the plant site)
• Steam Turbines are Heat Engines that operate on the Rankine cycle. They convert DP into Shaftwork; a generator then converts Shaftwork into Elec power
• Thermodynamic Efficiency is defined as
• For Generation, 1 useful output = Power only. Machine eff= ~20%, System Eff = ~35%
• For Cogeneration, 2 useful outputs = Power + Process Heat, Machine eff = ~20%, but System Eff ~75-80%
Useful Energy Output
Energy Input
DEFINITIONS: CHP & EFFICIENCY
Kumana & Associates © 2018 4
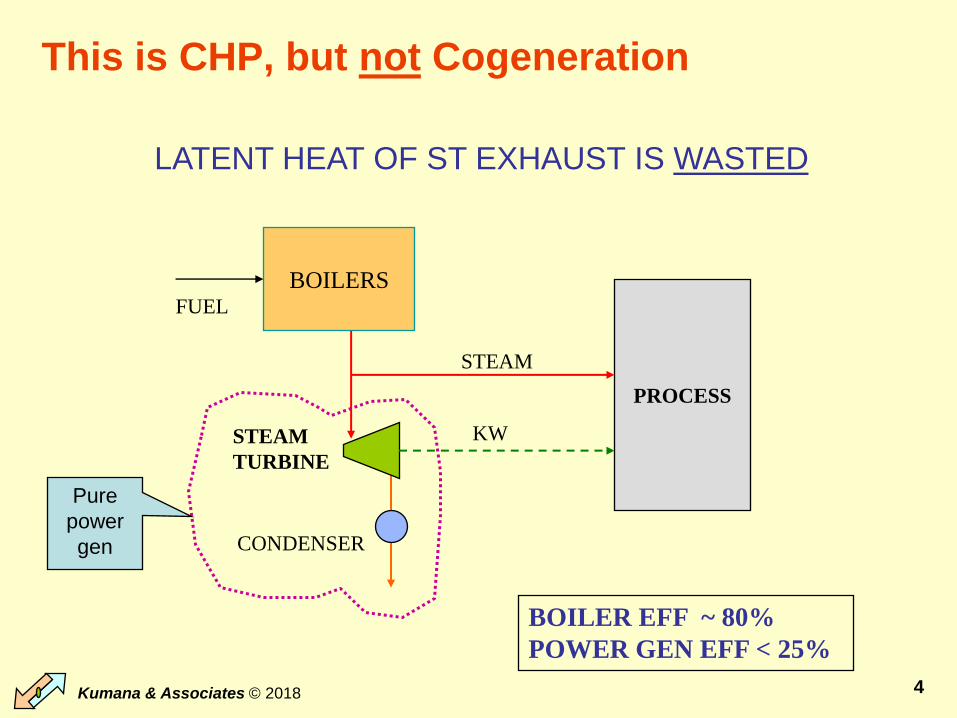
This is CHP, but not Cogeneration
BOILERS
CONDENSER
PROCESS
FUEL
KWSTEAM
TURBINE
BOILER EFF ~ 80%
POWER GEN EFF < 25%
LATENT HEAT OF ST EXHAUST IS WASTED
STEAM
Pure
power
gen

Kumana & Associates © 2018 5
This is both CHP and “Co-Generation”
BOILERS
PROCESS
FUEL
KWSTEAM
TURBINE
LP STEAM
OVERALL EFF ~ 75%
LAT HT OF EXHAUST STM IS USED IN THE PROCESS
Kumana & Associates © 2018 6
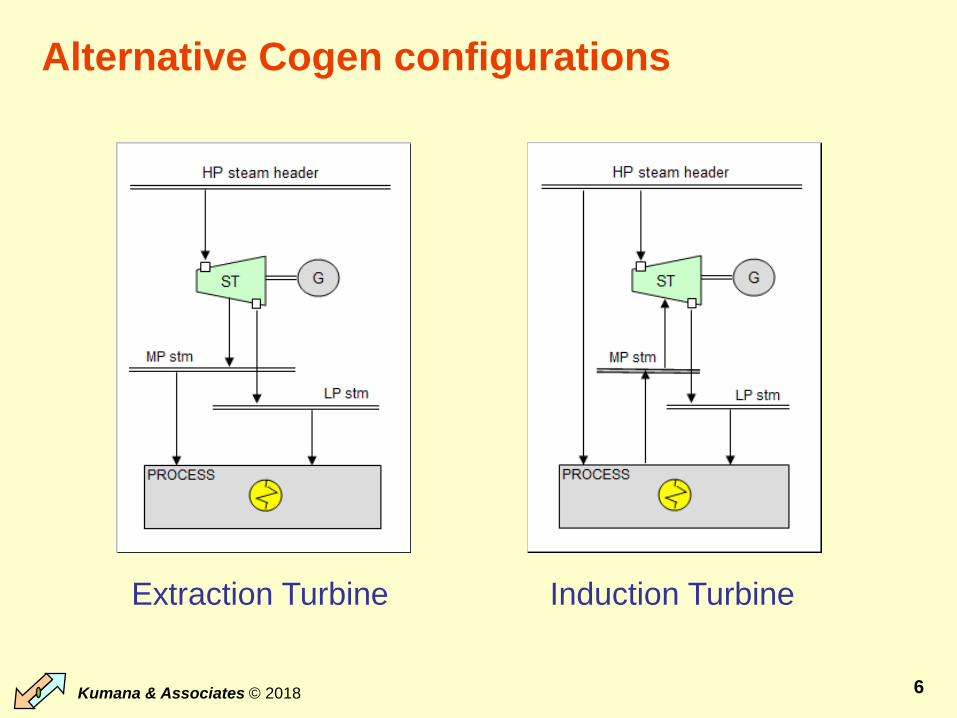
Alternative Cogen configurations
Extraction Turbine Induction Turbine
Kumana & Associates © 2018 7
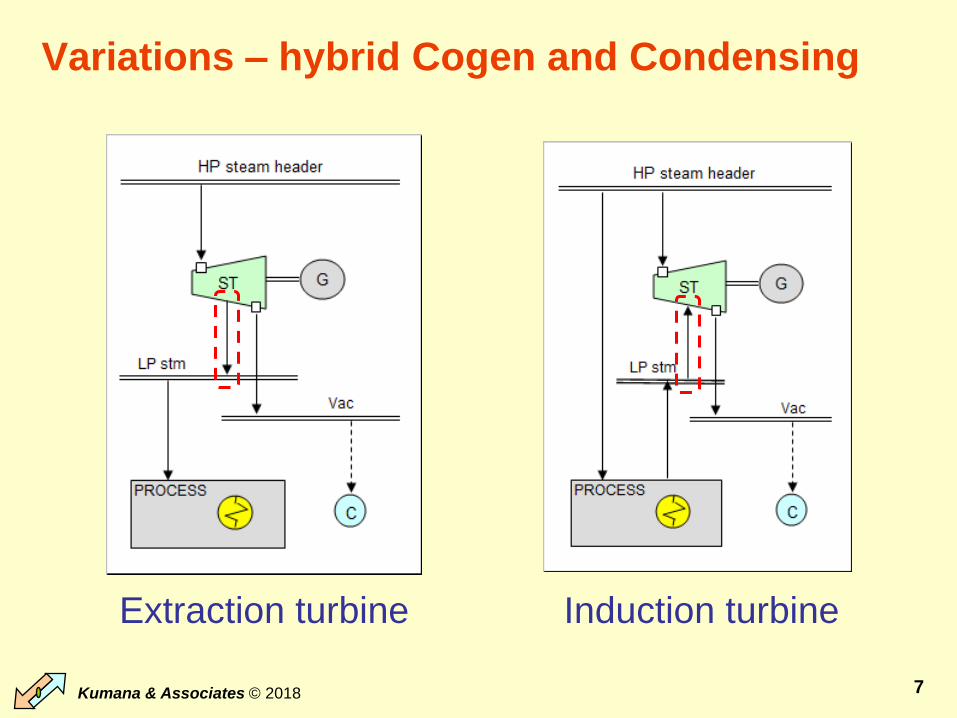
Variations – hybrid Cogen and Condensing
Extraction turbine Induction turbine
Kumana & Associates © 2018 8
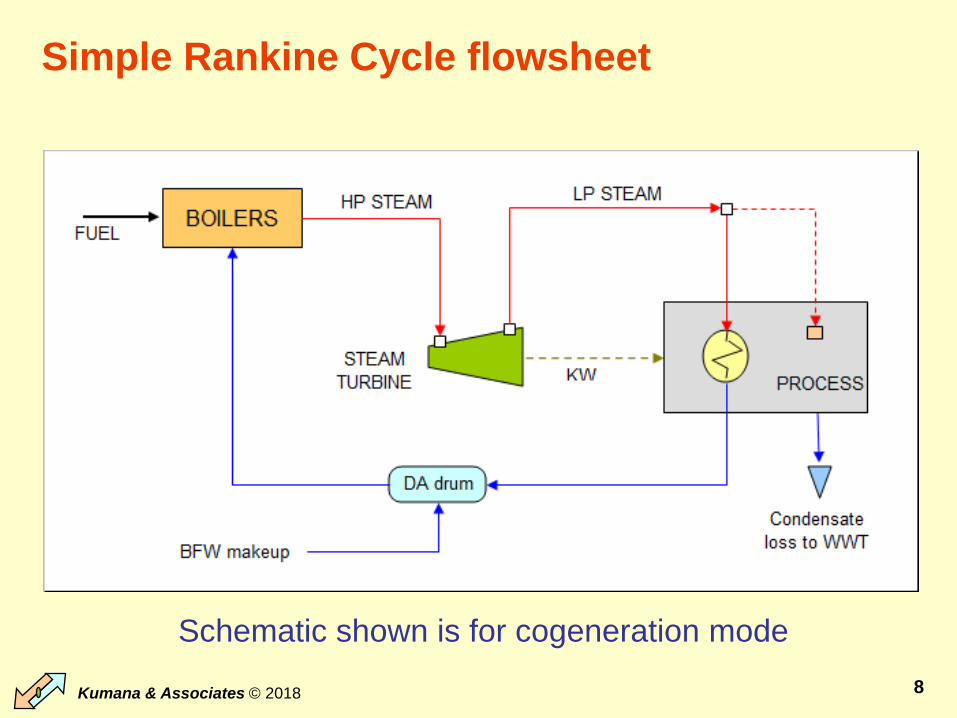
Simple Rankine Cycle flowsheet
Schematic shown is for cogeneration mode

Kumana & Associates © 2018 9
Difficult to match Heat:Power ratio of process
4 Basic Configs – which do you think is most efficient?
Most
efficient
Kumana & Associates © 2018 10
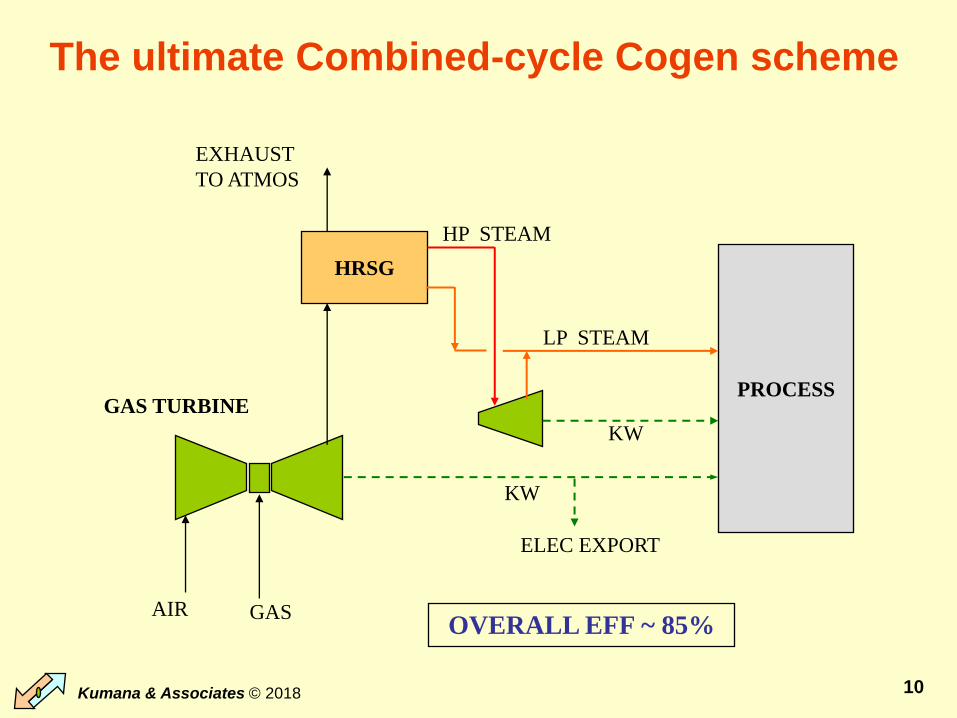
The ultimate Combined-cycle Cogen scheme
PROCESS
AIR GAS
EXHAUST
TO ATMOS
GAS TURBINE
HRSG
KW
HP STEAM
KW
LP STEAM
OVERALL EFF ~ 85%
ELEC EXPORT
Kumana & Associates © 2018 11
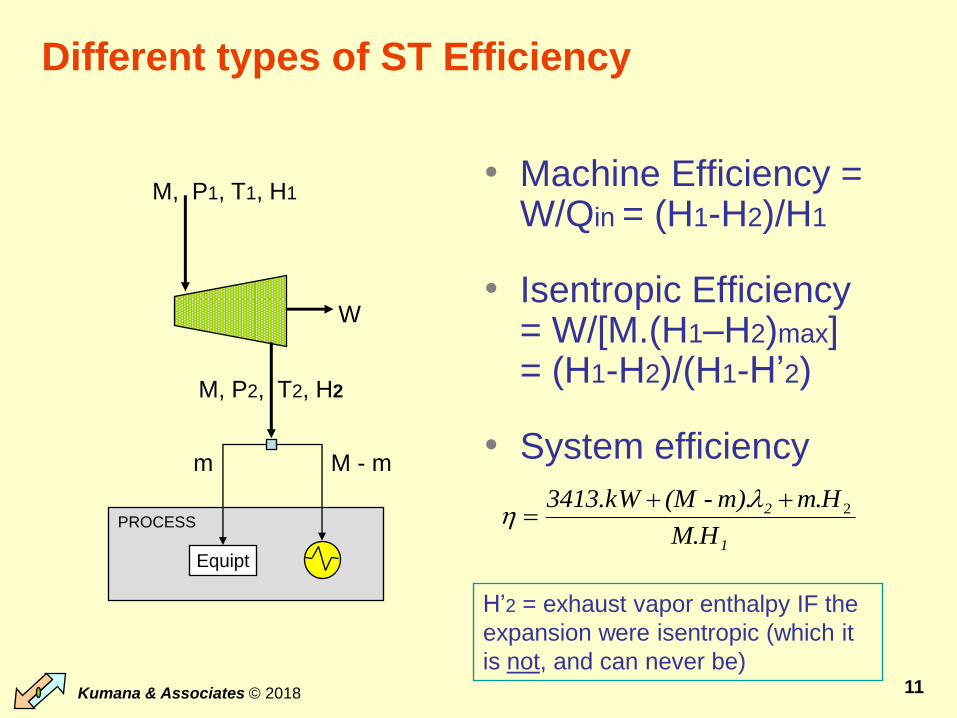
Different types of ST Efficiency
• Machine Efficiency = W/Qin = (H1-H2)/H1
• Isentropic Efficiency = W/[M.(H1–H2)max] = (H1-H2)/(H1-H’2)
• System efficiency
M, P2, T2, H2
W
PROCESS
Equipt
M, P1, T1, H1
M - mm
1
2
M.H
Hmm).-(M 3413.kW 2.
H’2 = exhaust vapor enthalpy IF the
expansion were isentropic (which it
is not, and can never be)
Kumana & Associates © 2018 12
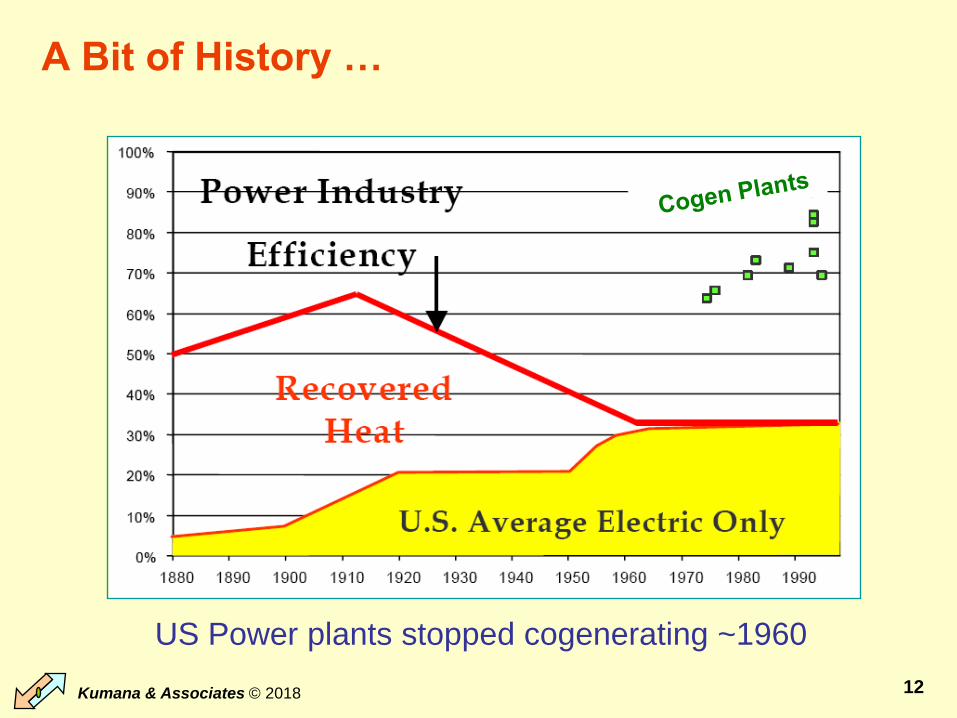
A Bit of History …
US Power plants stopped cogenerating ~1960
Kumana & Associates © 2018 13
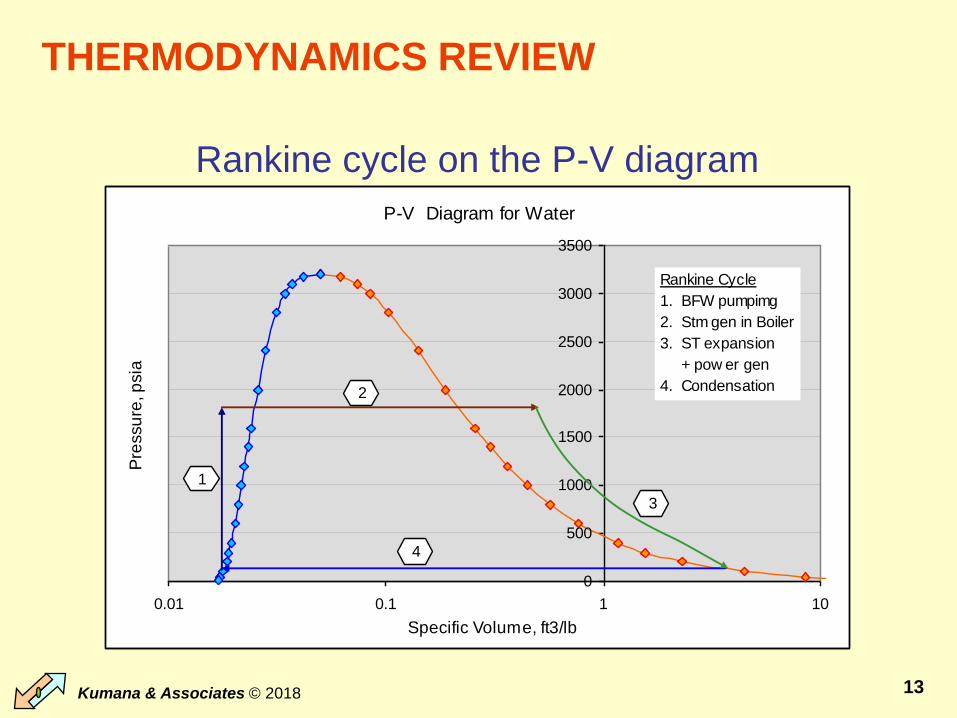
THERMODYNAMICS REVIEW
Rankine cycle on the P-V diagram
P-V Diagram for Water
0
500
1000
1500
2000
2500
3000
3500
0.01 0.1 1 10
Specific Volume, ft3/lb
Pre
ssu
re, p
sia
1
3
4
2
Rankine Cycle
1. BFW pumpimg
2. Stm gen in Boiler
3. ST expansion
+ pow er gen
4. Condensation

Kumana & Associates © 2018 14
Power generation step (#3) on Mollier Chart
• Adiabatic expansion (from 600 psig, 700oF to 50 psig)
• Isentropic efficiency
Mollier Chart (H-S) for Steam
900
950
1000
1050
1100
1150
1200
1250
1300
1350
1400
1450
1500
1550
1600
1.2 1.3 1.4 1.5 1.6 1.7 1.8 1.9 2.0 2.1
Entropy, Btu/lb-F
En
tha
lpy, B
tu/lb
Saturation
Pr, psig
Quality, % stm
Temp, F
1200 600
300150
50
1.0
800
700
600
215
300
400
500
92% Quality
97 %
Saturation
line
--12 psig
1
2

Kumana & Associates © 2018 15
Effect of P2/P1 on Machine Efficiency (W/Qin)
Near-optimal
Inlet Conditions
for industrial
cogen systems
Theoretical Machine Efficiency tops out at ~13% for BPST and 24% for
CST before moisture content in turbine reaches dangerous levels.
Power-to-Heat Ratio vs Steam Pressure Ratio
0.00
0.05
0.10
0.15
0.20
0.25
0.0 0.1 0.2 0.3 0.4 0.5 0.6 0.7 0.8
P2/P1
Pow
er:
Heat
ratio
BPST
limit
Condensing
Turbine limit
Kumana & Associates © 2018 16
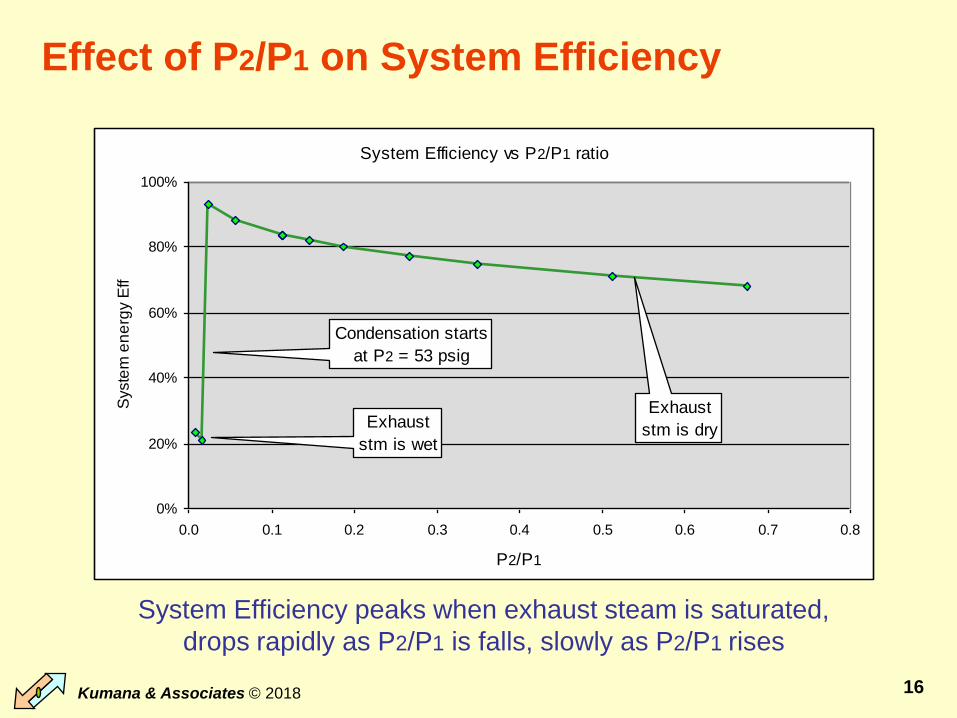
Effect of P2/P1 on System Efficiency
System Efficiency peaks when exhaust steam is saturated,
drops rapidly as P2/P1 is falls, slowly as P2/P1 rises
System Efficiency vs P2/P1 ratio
0%
20%
40%
60%
80%
100%
0.0 0.1 0.2 0.3 0.4 0.5 0.6 0.7 0.8
P2/P1
Syste
m e
ne
rgy E
ff
Exhaust
stm is dryExhaust
stm is wet
Condensation starts
at P2 = 53 psig
Kumana & Associates © 2018 17
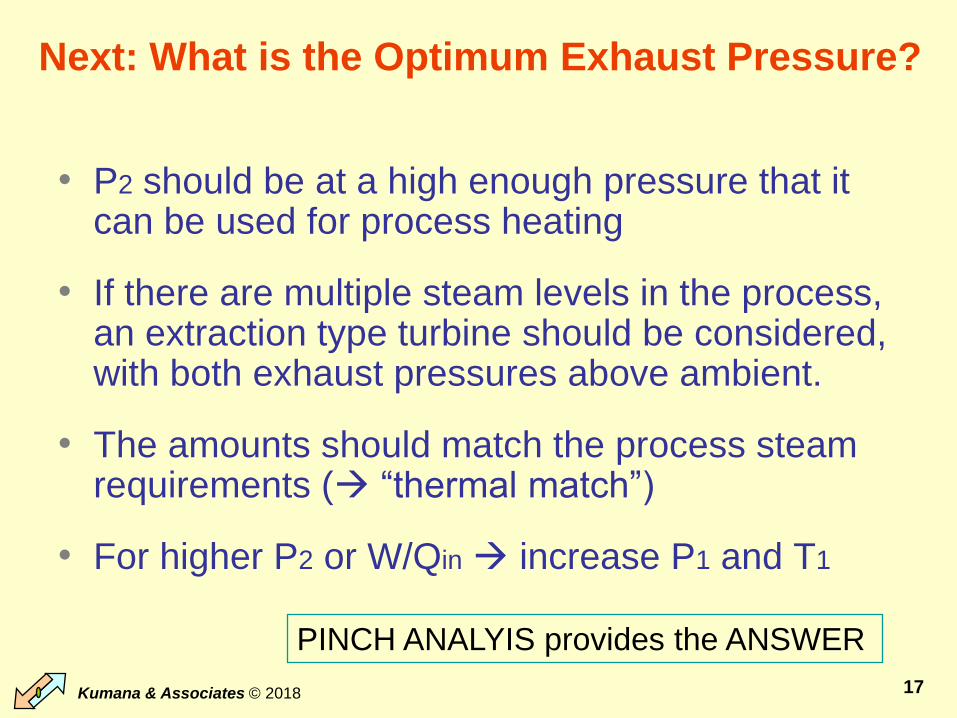
Next: What is the Optimum Exhaust Pressure?
• P2 should be at a high enough pressure that it can be used for process heating
• If there are multiple steam levels in the process, an extraction type turbine should be considered, with both exhaust pressures above ambient.
• The amounts should match the process steam requirements ( “thermal match”)
• For higher P2 or W/Qin increase P1 and T1
PINCH ANALYIS provides the ANSWER
Kumana & Associates © 2018 18
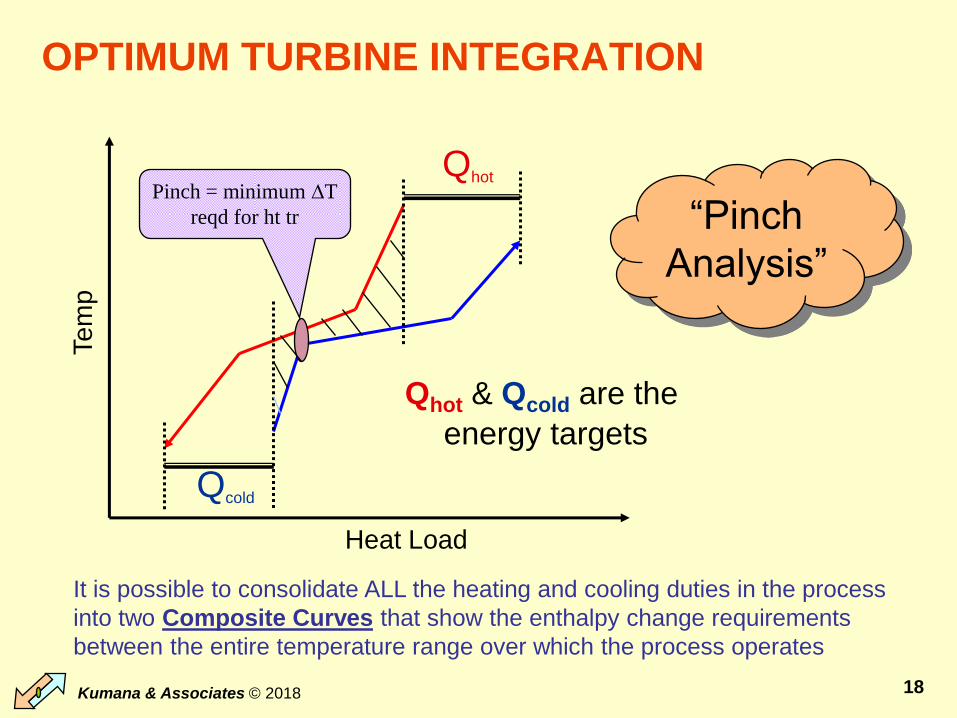
OPTIMUM TURBINE INTEGRATION
Qcold
Qhot
Te
mp
Heat Load
Qhot & Qcold are the
energy targets
Pinch = minimum DT
reqd for ht tr “Pinch
Analysis”
It is possible to consolidate ALL the heating and cooling duties in the process
into two Composite Curves that show the enthalpy change requirements
between the entire temperature range over which the process operates
Kumana & Associates © 2018 19
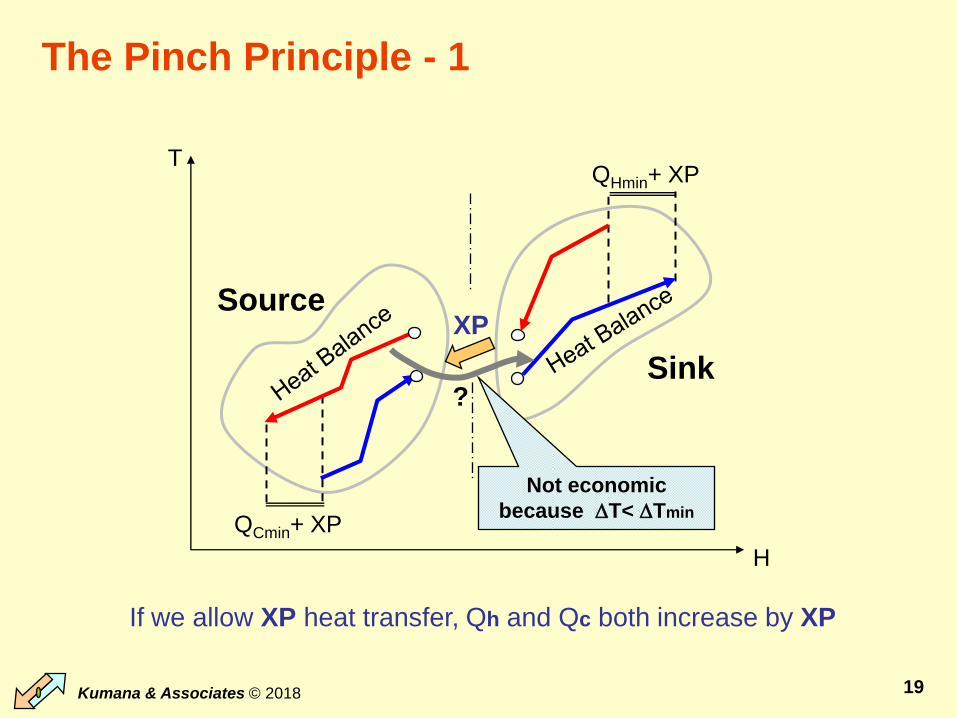
The Pinch Principle - 1
If we allow XP heat transfer, Qh and Qc both increase by XP
QCmin+ XP
Source
QHmin+ XP
Sink
H
T
XP
Not economic
because DT< DTmin
?

Kumana & Associates © 2018 20
The Pinch Principle - 2
To achieve the Energy
Targets, DO NOT
• use Steam below Pinch
• use CW above Pinch
• transfer heat from
process streams above
Pinch to process
streams below Pinch
T
Cooling
Water
Steam
Process Heat
TransferPinch
Temp

Kumana & Associates © 2018 21
Steam Turbine Integration options
100% conversion of Q W
T
Heat
EngineW
Q - W
QA - (Q - W)
A + W
Heat
EngineW
Q
B - QQ - W
No improvement in system
T
Heat
EngineW
Q - W
B + (Q - W)
QA
A + Q

Kumana & Associates © 2018 22
Summary of Energy Balances
= Machine
efficiency
Kumana & Associates © 2018 23
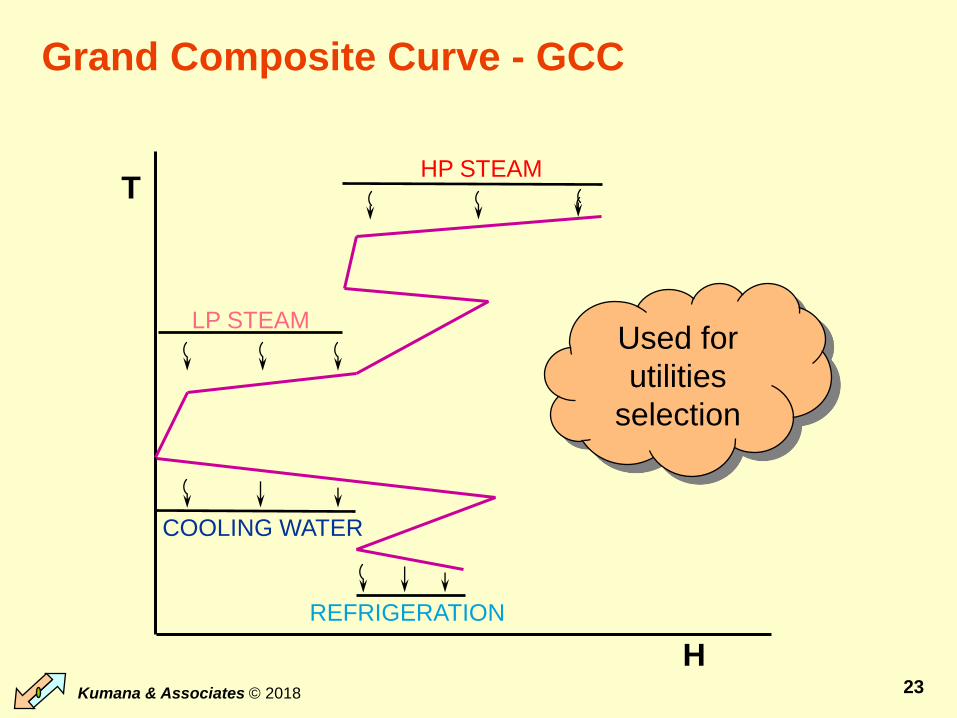
Grand Composite Curve - GCC
T
H
REFRIGERATION
COOLING WATER
LP STEAM
HP STEAM
Used for
utilities
selection
Kumana & Associates © 2018 24
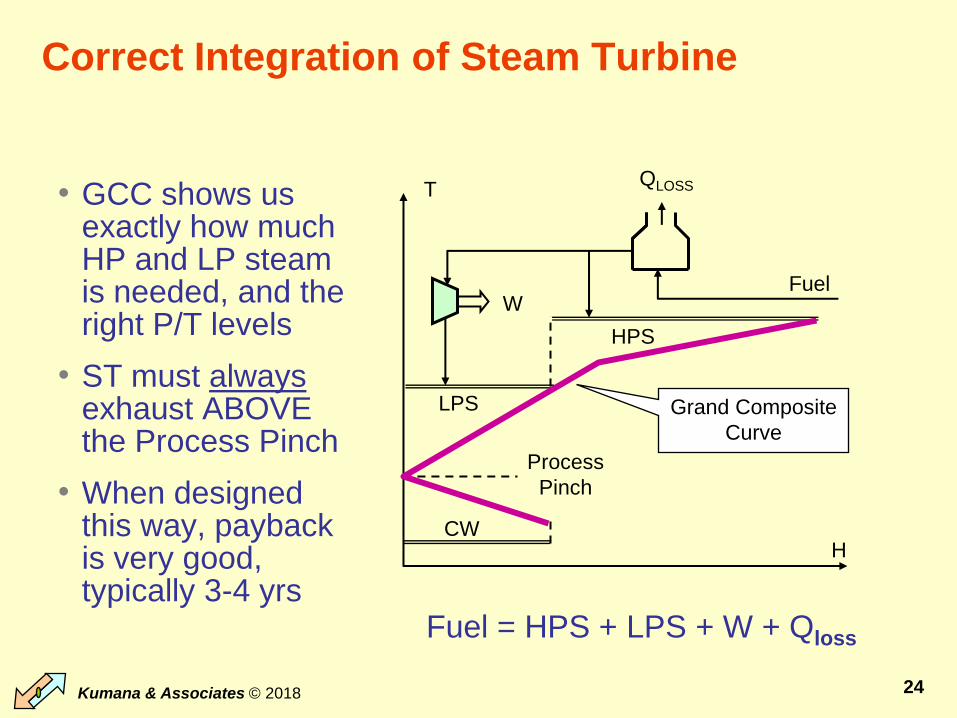
Correct Integration of Steam Turbine
• GCC shows us exactly how much HP and LP steam is needed, and the right P/T levels
• ST must alwaysexhaust ABOVE the Process Pinch
• When designed this way, payback is very good, typically 3-4 yrs
T
H
QLOSS
FuelW
HPS
LPS
Process
Pinch
Grand Composite
Curve
CW
Fuel = HPS + LPS + W + Qloss

Kumana & Associates © 2018 25
Total Site Source-Sink curves
Net process
cooling demand
= available heat
Net process
heating
demand
T
wHP
Req. Q
Enthalpy, MMBtu/h
CW
BFW
LP stm
Sink
Sink
Source

Kumana & Associates © 2018 26
Optimize Configuration
LP
MP
HPHP
MP
LP Sink
Fuel+
+
LP
MP
HPHP
MP
LP
Source
Fuel
+
LLP LLP
IP
+
+
Power generation
increased
Reduction in fuel
consumption
EXISTING
OPTIMIZED
Kumana & Associates © 2018 27
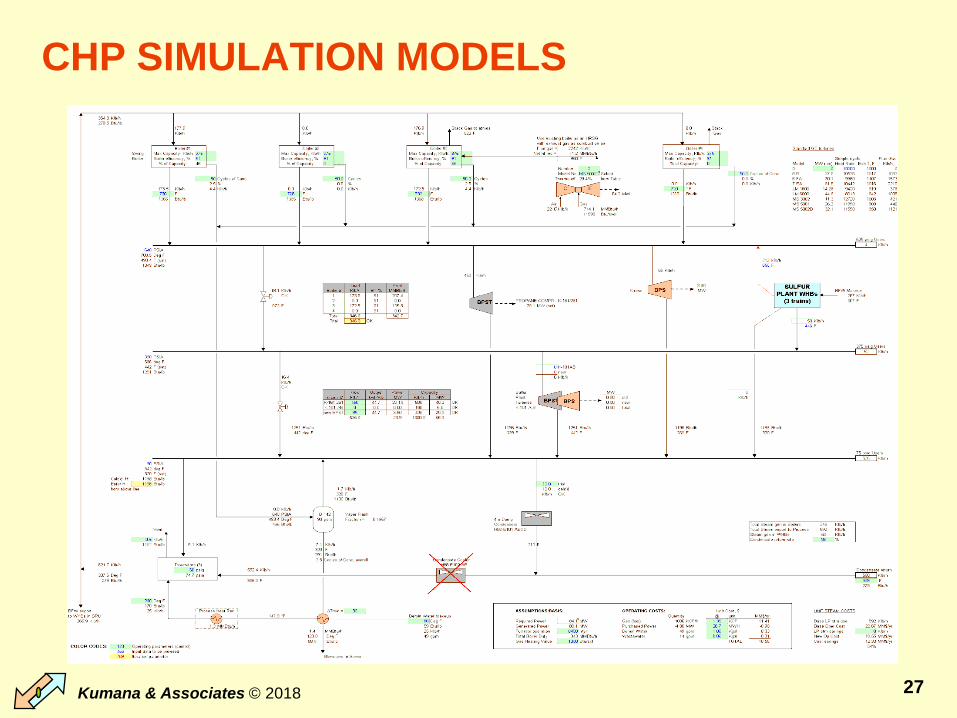
CHP SIMULATION MODELS
Kumana & Associates © 2018 28
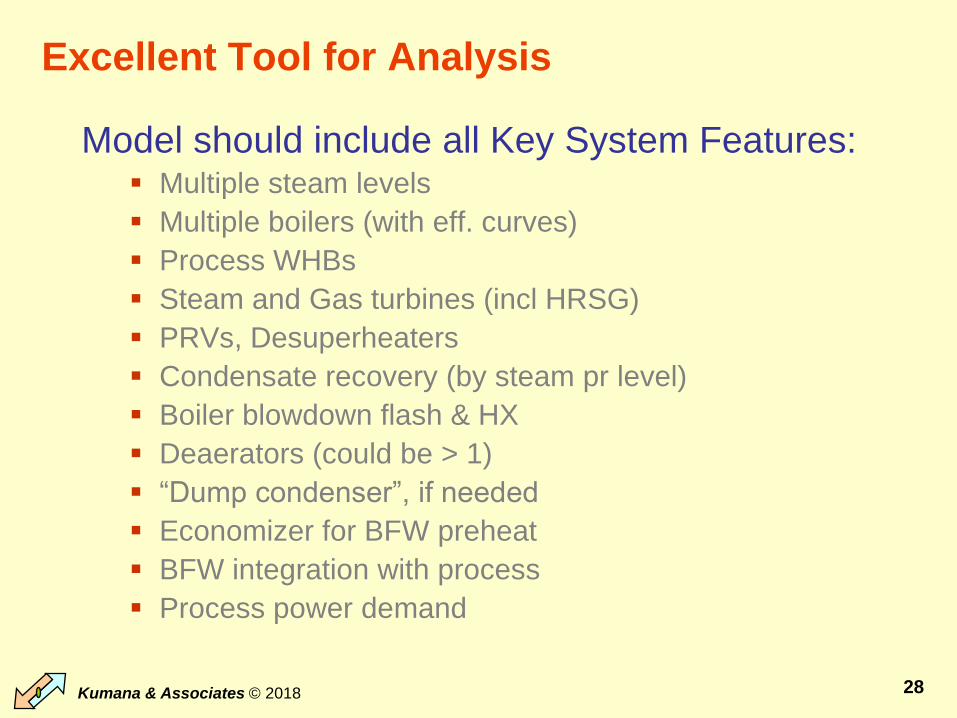
Excellent Tool for Analysis
Model should include all Key System Features: Multiple steam levels
Multiple boilers (with eff. curves)
Process WHBs
Steam and Gas turbines (incl HRSG)
PRVs, Desuperheaters
Condensate recovery (by steam pr level)
Boiler blowdown flash & HX
Deaerators (could be > 1)
“Dump condenser”, if needed
Economizer for BFW preheat
BFW integration with process
Process power demand

Kumana & Associates © 2018 29
CHP Optimization Guidelines
• Set BPST exhaust pressures based onprocess steam headers (from GCC)
• Set steam flows through BPSTs based on process heating duties at each Pr level
• Condensing Turbines invariably a BAD idea
• Minimize flows through PRVs
• Use highest feasible DeAerator pressure(s)
• Maximize condensate recovery
• Preheat cold BFW makeup water by using it as a cooling medium in the process

Kumana & Associates © 2018 30
On-line Utilities Optimization
Hydrogen Fuel Steam Water ElectricityUtility Systems
External Utilities Contracts
Emissions Regulations
ProcessIndustrialSite
Real-Time Optimizer finds the best way to operate all utilities subject to contractual, environmental and operational constraints
OptimumUtilitiesOperationsReport
Measurements
OptimumSet Points
Key Performance IndicatorsMonitoringand AccountingReports
From VisualMesa® brochure, Courtesy of Soteica LLC, Houston, Tx

Kumana & Associates © 2018 31
Expected Benefits and Costs
• Typical savings = 3-5% of baseline (operator-
optimized) energy costs
• Typical installed cost = $500-900K
• Typical Payback << 1 yr
• Proven in dozens of Oil refineries, Chemical
plants, Pulp/Paper mills (can be deemed a
Best Practice)
Kumana & Associates © 2018 32
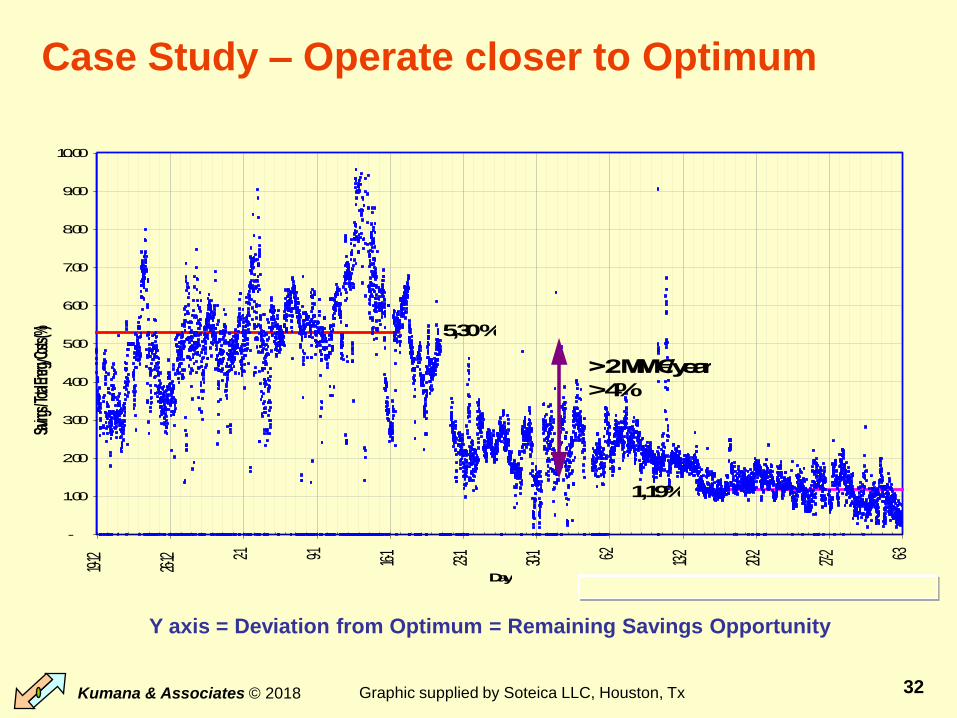
Case Study – Operate closer to OptimumOptimización Visual Mesa
Ahorros Anuales Predichos - Siguiendo las Sugerencias de Optimización
TODOS LOS DATOS RECOLECTADOS, HASTA EL PRESENTE
5,30 %
1,19%
-
1.00
2.00
3.00
4.00
5.00
6.00
7.00
8.00
9.00
10.00
19-12
26-12 2-1 9-1 16-1
23-1
30-1 6-2 13-2
20-2
27-2 6-3
Day
Saving
s / Tot
al Ener
gy Co
sts (%
)
Ahorros AnualesPromedio del Período Anterior a la OptimizaciónPromedio Después de Tomar Acciones de Optimización
> 2 MM €/year
> 4%
Y axis = Deviation from Optimum = Remaining Savings Opportunity
Graphic supplied by Soteica LLC, Houston, Tx

Kumana & Associates © 2018 33
IN CONCLUSION
• Use GCC to choose Stm Levels and Loads
• Use BPSTs in cogen mode when possible
• Condensing steam turbines are Invariably Bad*
• Use TSSS to identify optimum CHP structure
• Use CHP models to optimize parameters
• Always optimize process demand before trying to design/optimize the CHP system
• Ability to export excess power to the Grid at a fair price is critical to optimizing energy efficiency at National scale, and minimizing global GHG emissions
with a few rare exceptions

Kumana & Associates © 2018 34
Optimum Process Integration
It’s like a jig-
saw puzzle,
but well worth
the effort