optimal experiment design for dose-response screening of enzyme inhibitors petr kuzmic, ph.d....
TRANSCRIPT

Optimal Experiment Design for Dose-Response Screening of Enzyme Inhibitors
Petr Kuzmic, Ph.D.BioKin, Ltd.
WATERTOWN, MASSACHUSETTS, U.S.A.
• Most assays in a typical screening program are not informative
• Abandon "batch design" of dose-response experiments• Use "sequential design" based on D-Optimal Design Theory
• Save 50% of screening time, labor, and material resources
PROBLEM
SOLUTION

Optimal Design for Screening 2
Two basic types of experiments
BATCH VS. SEQUENTIAL DESIGN OF ANY RESEARCH PROJECT
1. decide beforehand on the design of a complete series of experiments
2. perform all experiments in the series without analyzing interim results
3. analyze entire batch of accumulated data
4. issue final report
BATCH DESIGN OF EXPERIMENTS
1. decide on the design of only one (or a small number of) experiment(s)
2. perform one experiment
3. analyze interim results; did we accumulate enough experiments?
4. if not, go back to step 1, otherwise ...
5. issue final report
SEQUENTIAL DESIGN OF EXPERIMENTS
design =choice of screening concentrations

Optimal Design for Screening 3
Analogy with clinical trials
ADAPTIVE CLINICAL TRIALS (ACT): ADJUST THE EXPERIMENT DESIGN AS TIME GOES ON
Borfitz, D.: "Adaptive Designs in the Real World" BioIT World, June 2008
• assortment of statistical approaches including “early stopping” and “dose-finding”
• interim data analysis
• reducing development timelines and costs by utilizing actionable information sooner
• experts: Donald Berry, chairman of the Department of Biostatistics University of Texas MD Anderson Cancer Center
• software vendors: Cytel, Tessela
• industry pioneers: Wyeth 1997 “Learn and Confirm” model of drug development
"slow but sure restyling of the research enterprise"

Optimal Design for Screening 4
What is wrong with this dose-response curve?
THE "RESPONSE" IS INDEPENDENT OF "DOSE": NOTHING LEARNED FROM MOST DATA POINTS
log10 [Inhibitor]
residualenzymeactivity
"control" data point: [Inhibitor] = 0
this point alonewould suffice toconclude:
"no activity"
to make sure,let's use two pointsnot just one

Optimal Design for Screening 5
What is wrong with this dose-response curve?
THE SAME STORY: MOST DATA POINTS ARE USELESS
log10 [Inhibitor]
residualenzymeactivity
"control" data point: [Inhibitor] = 0
these pointswould suffice
these pointsare useless

Optimal Design for Screening 6
Why worry about doing useless experiments?
IN CASE THE REASONS ARE NOT OBVIOUS:
Academia: • time
• money
• fame
Industry: • time
• money
• security
Beat "the competition" to market.
Spend less on chemicals, hire a post-doc.
Invent a drug, avoid closure of Corporate R&D.
Publish your paper on time for grant renewal.
Spend less on chemicals, hire a post-doc.
Invent a drug, get the Nobel Prize.

Optimal Design for Screening 7
On a more serious note...
THERE ARE VERY GOOD REASONS TO GET SCREENING PROJECTS DONE AS QUICKLY AS POSSIBLE
Leishmania major
Photo: E. DráberováAcademy of Sciences of the Czech Republic

Optimal Design for Screening 8
Theoretical foundations: The inhibition constant
DO NOT USE IC50. THE INHIBITION CONSTANT IS MORE INFORMATIVE
Kuzmič et al. (2003) Anal. Biochem. 319, 272–279
"Morrison equation"
Four-parameter logistic equation
"Hill slope"
no clearphysical
meaning !
slope 1
slope 2
E + I EI Ki = [E]eq[I]eq /[E.I]eq Ki ... equilibrium constant

Optimal Design for Screening 9
Theoretical foundations: The "single-point" method
AN APPROXIMATE VALUE OF THE INHIBITION CONSTANT FROM A SINGLE DATA POINT
Kuzmič et al. (2000) Anal. Biochem. 281, 62–67
[Inhibitor], µM
0.00 0.02 0.04 0.06 0.08 0.10
enzy
me
activ
ity, %
0
20
40
60
80
100V0
V
"control" Relative rate
Vr = V/V0
[I]
Ki = 12 nM
Ki = 9 nM
Ki = 11 nM
Ki = 8 nM
1/1
)1]([][
r
ri V
VEIK
Single-point formula:

Optimal Design for Screening 10
Theoretical foundations: Optimal Design Theory
NOT ALL POSSIBLE EXPERIMENTS ARE EQUALLY INFORMATIVE
BOOKS:
• Fedorov (1972) "Theory of Optimal Experiments"
• Atkinson & Donev (1992) "Optimum Experimental Designs"
EDITED BOOKS:
• Endrényi (Ed.) (1981) "Kinetic Data Analysis: Design and Analysis of Enzyme and Pharmacokinetic Experiments"
• Atkinson et al. (Eds.) (2000) "Optimum Design 2000"
JOURNAL ARTICLES:
• Thousands of articles in many journals.
• Several articles deal with experiments in enzymology / pharmacology.

Optimal Design for Screening 11
Optimal design of ligand-binding experiments
SIMPLE LIGAND BINDING AND HYPERBOLIC SATURATION CURVES
Endrényi & Chang (1981) J. Theor. Biol. 90, 241-263
• Protein (P) binding with ligand (L) P + L PLKd
dissociationconstant
• Vary total ligand concentration [L] Observe bound ligand concentration [LB]
• Fit data to nonlinear model:
]][[4][][][][2
1][ 2 LPPKLPKLL ddB
SUMMARY:
][][]][[4][][][][
][][]][[4][][][][])[(][
12
11
12
11
2
PKPKLPPKLLPK
PKPKLPPKLLPKPKL
dddd
dddd
d
TWO OPTIMAL LIGAND CONCENTRATIONS (we need at least two data points):
max1 ][][ LL maximum feasible [Ligand]

Optimal Design for Screening 12
Optimal design of enzyme inhibition experiments
THIS TREATMENT APPLIES BOTH TO "TIGHT BINDING" AND "CLASSICAL" INHIBITORS
Kuzmič (2008) manuscript in preparation
• Enzyme (E) binding with inhibitor (I) E + I EIKi
dissociationconstant
• Vary total inhibitor concentration [I] Observe residual enzyme activity, proportional to [E]free
SUMMARY:
TWO OPTIMAL INHIBITOR CONCENTRATIONS (we need at least two data points):
control experiment (zero inhibitor)0][ 1 I
][][ 2 EKI i
• Fit data to nonlinear model:
][4][][][][][2
1 20 EKKIEKIEE
VV iii "Morrison Equation"

Optimal Design for Screening 13
A problem with optimal design for nonlinear models
A CLASSIC CHICKEN & EGG PROBLEM
Endrényi & Chang (1981) J. Theor. Biol. 90, 241-263
][][]][[4][][][][
][][]][[4][][][][])[(][
12
11
12
11
2
PKPKLPPKLLPK
PKPKLPPKLLPKPKL
dddd
dddd
d
max1 ][][ LL
PROTEIN/LIGAND BINDING
Kuzmič (2008) manuscript in preparation ENZYME INHIBITION
][][ 2 EKI i
0][ 1 I
We must guess the answer before we begin designing the experiment.
a model parameter ("final answer")we are trying to determineby the experiment ... being planned!

Optimal Design for Screening 14
A solution for designed enzyme inhibition studies
PUT TOGETHER OPTIMAL DESIGN AND THE SINGLE-POINT METHOD
choose nextconcentration
][][ 2 EKI i
collect singledata point
at [I]
choose firstconcentration
[I]
estimate Ki
1/1
)1]([][
r
ri V
VEIK
singlepointmethod
optimaldesigntheory
repeat

Optimal Design for Screening 15
Sequential optimal design: Overall outline
PUTTING IT ALL TOGETHER: "SINGLE-POINT METHOD" + OPTIMAL DESIGN THEORY
perform "preliminary" assays(n=3, sequentially optimized)
detectable activity?
NO
report"no activity"
YES
moderate activity ?
YES
• add control point ([I] = 0) • assemble accumulated dose-response• perform nonlinear fit
report best-fit valueof Ki
perform "follow-up"assays (n = 2, batch)
NOKi
Ki « [E]
FOR EACH COMPOUND:
EXTREMELY TIGHT BINDING!

Optimal Design for Screening 16
Sequential optimal design: Preliminary phase
ASSAY EVERY COMPOUND AT THREE DIFFERENT CONCENTRATIONS
choose a startingconcentration [I]
measure enzyme activityat [I]: Vr=V[I]/V0
estimate Ki:
1/1
)1]([][
r
ri V
VEIK
choose next concentration][][ OPTIMAL EKI i
completed three cycles?YES
NOdetectable activity?

Optimal Design for Screening 17
Sequential optimal design: Follow-up phase
WE DO THIS ONLY FOR EXTREMELY TIGHT BINDING COMPOUNDS (Ki << [E]tot)
measure enzyme activityat [I]: Vr=V[I]/V0
choose [I] = [E] optimal [I] at Ki approaching zero:
[I]opt = [E] + Ki
measure enzyme activityat [I]: Vr=V[I]/V0
choose [I] = [E]/2 "rule of thumb"
EXTRAPOINT
#1
EXTRAPOINT
#2
• combine with three "preliminary" data points• add control point ([I] = 0) • assemble accumulated dose-response curve• perform nonlinear fit ("Morrison equation")

Optimal Design for Screening 18
Sequential optimal design: The gory details
• We need safeguards against concluding too much from marginal data:
- greater than 95% inhibition, or - less than 5% inhibition.
• We need safeguards against falling outside the feasible concentration range.
• We use other safeguards and rules of thumb.
• The overall algorithm is a hybrid creation:
- rigorous theory, and - practical rules, learned over many years of consulting work.
The actual "designer" algorithm is more complex:

Optimal Design for Screening 19
Anatomy of a screening campaign: Ki Distribution
A REAL-WORLD SCREENING PROGRAM AT AXYS PHARMA (LATER CELERA GENOMICS)
DATA COURTESY CRAIG HILL & JAMES JANC, CELERA GENOMICSPRESENTED IN PART (BY P.K.) AT 10TH ANNUAL SOCIETY FOR BIOMOLECULAR SCREENING, ORLANDO, 2004
-log10 (Ki)
0 3 6 9 12
# of
com
poun
ds
0
200
400
600
800 • 10,008 dose response curves
• Maximum concentration 0.5–50 µM
• Serial dilution ratio 1:4
• Eight data points per curve
• 3% Random error of initial rates
• Enzyme concentration 0.6–10 nM
completely inactive compounds (8%)
positivecontrolon everyplate

Optimal Design for Screening 20
Anatomy of a screening campaign: Examples
A REAL-WORLD SCREENING PROGRAM AT AXYS PHARMA (LATER CELERA GENOMICS)
pKi = 10Ki = 0.1 nM
no activity weakbinding
pKi = 4.5Ki = 30 µM
moderatebinding
pKi = 6Ki = 1 µM
tightbinding

Optimal Design for Screening 21
Monte-Carlo simulation: Virtual sequential screen
SIMULATE A POPULATION OF INHIBITORS THAT MATCHES THE AXYS/CELERA CAMPAIGN
1. Simulate 10,000 pKi values that match Celera's "two-Gaussian" distribution
2. Simulate enzyme activities assuming 3% random experimental error
3. Virtually "screen" the 10,000 compounds using the sequential optimal method
4. Compare resulting 10,000 pKi values with the "true" (assumed) values
5. Repeat the virtual "screen" using the classic serial dilution method
6. Compare accuracy and efficiency of sequential and serial-dilution methods
PLAN OF A HEURISTIC MONTE-CARLO SIMULATION STUDY:

Optimal Design for Screening 22
Monte-Carlo study: Example 1 - Preliminary phase
A TYPICAL MODERATELY POTENT (SIMULATED) ENZYME INHIBITOR
"true" Ki = 181 nM
[I] = 1.0 µM
[E] = 1 nM
Ki = 0.18 µM
MorrisonEquation +RandomError
"Experimental"rate #1
V/V0 = 0.127 SinglePointMethod
Estimated
Ki = 146 nM
OptimalDesignTheory
Nextconcentration
[I] = 183 nM
Ki = 0.18 µM "Experimental"rate #3
V/V0 = 0.511 MorrisonEquation +RandomError
SinglePointMethod
Estimated
Ki = 191 nM
OptimalDesignTheory
Nextconcentration
[I] = 147 nM
"Experimental"rate #2
V/V0 = 0.554
Ki = 0.18 µMEstimated
Ki = 182 nMMorrisonEquation +RandomError
SinglePointMethod

Optimal Design for Screening 23
Monte-Carlo study: Example 1 - Regression phase
A TYPICAL MODERATELY POTENT (SIMULATED) ENZYME INHIBITOR - CONTINUED
"true" Ki = 181 nM
[E] = 1 nM
V0 = 100
#
1
2
3
4
[I], µM
0.0
1.0
0.147
0.183
Rate
100
12.7
55.4
51.1
note
negative control
arbitrary initial [I]
optimally designed [I]
optimally designed [I]
ASSEMBLE AND FIT DOSE-RESPONSE CURVE
frompreliminaryphase
fromnonlinearregression
Ki = (178 ± 9) nM

Optimal Design for Screening 24
Monte-Carlo study: Example 2 - Regression phase
A TYPICAL TIGHT-BINDING (SIMULATED) ENZYME INHIBITOR
"true" Ki = 0.021 nM
[E] = 1 nM
V0 = 100
#
1
2
3
4
5
6
[I], µM
0.0
1.0
0.04
0.0016
0.001
0.0005
Rate
100
-3.3
1.6
3.1
13.1
49.5
note
negative control
arbitrary initial [I]
maximum jump 25
maximum jump 25
optimally designed
rule of thumb
ASSEMBLE AND FIT DOSE-RESPONSE CURVE
frompreliminaryphase
fromnonlinearregression
Ki = (0.033 ± 0.011) nM

Optimal Design for Screening 25
Monte-Carlo study: "True" vs. estimated pKi values
DISTRIBUTION OF "TRUE" pKi VALUES IS SIMILAR TO THE AXYS/CELERA CAMPAIGN
mM µM nM pM Ki
SEQUENTIALOPTIMALDESIGN
n = 3(or 5) + control

Optimal Design for Screening 26
Monte-Carlo study: Dilution series results
DISTRIBUTION OF "TRUE" pKi VALUES IS SIMILAR TO THE AXYS/CELERA CAMPAIGN
mM µM nM pM Ki
• [I]max = 50 µM
• Dilution 4
• Eight wells
SERIALDILUTIONDESIGN
n = 8 + control

Optimal Design for Screening 27
Efficiency of serial dilution vs. sequential design
HOW MANY WELLS / PLATES DO WE END UP USING?
total 96-well plates
compounds per plate
control wells per plate
wells with inhibitors
control wells ([I] = 0)
total wells
wells per compound
SCREEN 10,000 COMPOUNDS (DOSE-RESPONSE) TO DETERMINE Ki's
SERIALDILUTION
SEQUENTIALDESIGN
909
11
8
79992
7272
87264
8.73
343
88
8
30042
2744
32786
3.28
62.3 %
62.4 %
62.3 %
62.4 %
62.4 %
SAVINGS

Optimal Design for Screening 28
Toward optimized screening: Preliminary phase
PROPOSAL FOR FULLY AUTOMATED OPTIMIZED SCREENING
ROBOTliquid
handling
OPTIMALDESIGN
ALGORITHM
DATABASEstore/retrieve
results between plates
ANALYSISSOFTWAREfit dose-response
determine Ki
PLATEREADER
reprogram robotfor next plate
dispenseoptimalconcentrations
export data
1. Accumulate minimal (optimized) dose-response curves
COMPUTER SUBSYSTEM: INSTRUMENT-CONTROL & DATA-ANALYSIS

Optimal Design for Screening 29
Efficiency comparison: ~100 compounds to screen
HOW MANY WELLS / PLATES DO WE END UP USING WITH FEWER COMPOUNDS TO SCREEN?
total 96-well plates
compounds per plate
control wells per plate
wells with inhibitors
control wells ([I] = 0)
total wells
wells per compound
SCREEN 88 COMPOUNDS (DOSE-RESPONSE) TO DETERMINE Ki's
SERIALDILUTION
SEQUENTIALDESIGN
8
11
8
704
64
768
8.73
3
88
8
264
24
288
3.27
62.5 %
62.5 %
62.5 %
62.5 %
62.5 %
SAVINGS

Optimal Design for Screening 30
Example: Plate layout for 88 inhibitors
HOW MANY WELLS / PLATES DO WE END UP USING WITH FEWER COMPOUNDS TO SCREEN?
SERIAL DILUTION
..., 8 plates
Inhibitors #1 through #11 Inhibitors #12 through #22 Etc., through #88
CT = control
SEQUENTIAL DESIGN
1 2 3 4 5 6 7 8 9 10 11 12A CT i1 i2 i3 i4 i5 i6 i7 i8 i9 i10 i11B CT i12 i13 i14 i15 i16 i17 i18 i19 i20 i21 i22C CT i23 i24 i25 i26 i27 i28 i29 i30 i31 i32 i33D CT i34 i35 i36 i37 i38 i39 i40 i41 i42 i43 i44E CT i45 i46 i47 i48 i49 i50 i51 i52 i53 i54 i55F CT i56 i57 i58 i59 i60 i61 i62 i63 i64 i65 i66G CT i67 i68 i69 i70 i71 i72 i73 i74 i75 i76 i77H CT i78 i79 i80 i81 i82 i83 i84 i85 i86 i87 i88
1 2 3 4 5 6 7 8 9 10 11 12A CT i1 i2 i3 i4 i5 i6 i7 i8 i9 i10 i11B CT i12 i13 i14 i15 i16 i17 i18 i19 i20 i21 i22C CT i23 i24 i25 i26 i27 i28 i29 i30 i31 i32 i33D CT i34 i35 i36 i37 i38 i39 i40 i41 i42 i43 i44E CT i45 i46 i47 i48 i49 i50 i51 i52 i53 i54 i55F CT i56 i57 i58 i59 i60 i61 i62 i63 i64 i65 i66G CT i67 i68 i69 i70 i71 i72 i73 i74 i75 i76 i77H CT i78 i79 i80 i81 i82 i83 i84 i85 i86 i87 i88
1 2 3 4 5 6 7 8 9 10 11 12A CT i1 i2 i3 i4 i5 i6 i7 i8 i9 i10 i11B CT i12 i13 i14 i15 i16 i17 i18 i19 i20 i21 i22C CT i23 i24 i25 i26 i27 i28 i29 i30 i31 i32 i33D CT i34 i35 i36 i37 i38 i39 i40 i41 i42 i43 i44E CT i45 i46 i47 i48 i49 i50 i51 i52 i53 i54 i55F CT i56 i57 i58 i59 i60 i61 i62 i63 i64 i65 i66G CT i67 i68 i69 i70 i71 i72 i73 i74 i75 i76 i77H CT i78 i79 i80 i81 i82 i83 i84 i85 i86 i87 i88
All 88 inhibitorson every plate.
3 consecutive plateswith progressivelyoptimized concentrations.
1 2 3 4 5 6 7 8 9 10 11 12A CT i1 i2 i3 i4 i5 i6 i7 i8 i9 i10 i11B CT i1 i2 i3 i4 i5 i6 i7 i8 i9 i10 i11C CT i1 i2 i3 i4 i5 i6 i7 i8 i9 i10 i11D CT i1 i2 i3 i4 i5 i6 i7 i8 i9 i10 i11E CT i1 i2 i3 i4 i5 i6 i7 i8 i9 i10 i11F CT i1 i2 i3 i4 i5 i6 i7 i8 i9 i10 i11G CT i1 i2 i3 i4 i5 i6 i7 i8 i9 i10 i11H CT i1 i2 i3 i4 i5 i6 i7 i8 i9 i10 i11
1 2 3 4 5 6 7 8 9 10 11 12A CT i12 i13 i14 i15 i16 i17 i18 i19 i20 i21 i22B CT i12 i13 i14 i15 i16 i17 i18 i19 i20 i21 i22C CT i12 i13 i14 i15 i16 i17 i18 i19 i20 i21 i22D CT i12 i13 i14 i15 i16 i17 i18 i19 i20 i21 i22E CT i12 i13 i14 i15 i16 i17 i18 i19 i20 i21 i22F CT i12 i13 i14 i15 i16 i17 i18 i19 i20 i21 i22G CT i12 i13 i14 i15 i16 i17 i18 i19 i20 i21 i22H CT i12 i13 i14 i15 i16 i17 i18 i19 i20 i21 i22

Optimal Design for Screening 31
Toward optimized screening: Data-analysis phase
PROPOSAL FOR A FULLY AUTOMATED OPTIMIZED SCREENING
OPTIMALDESIGN
ALGORITHM
DATABASEstore/retrieve
results between plates
ANALYSISSOFTWAREfit dose-response
determine Ki
COMPUTER SUBSYSTEM: INSTRUMENT-CONTROL & DATA-ANALYSIS
2. Analyze accumulated data
ROBOTliquid
handling
PLATEREADER
Optimal Design for Screening 32
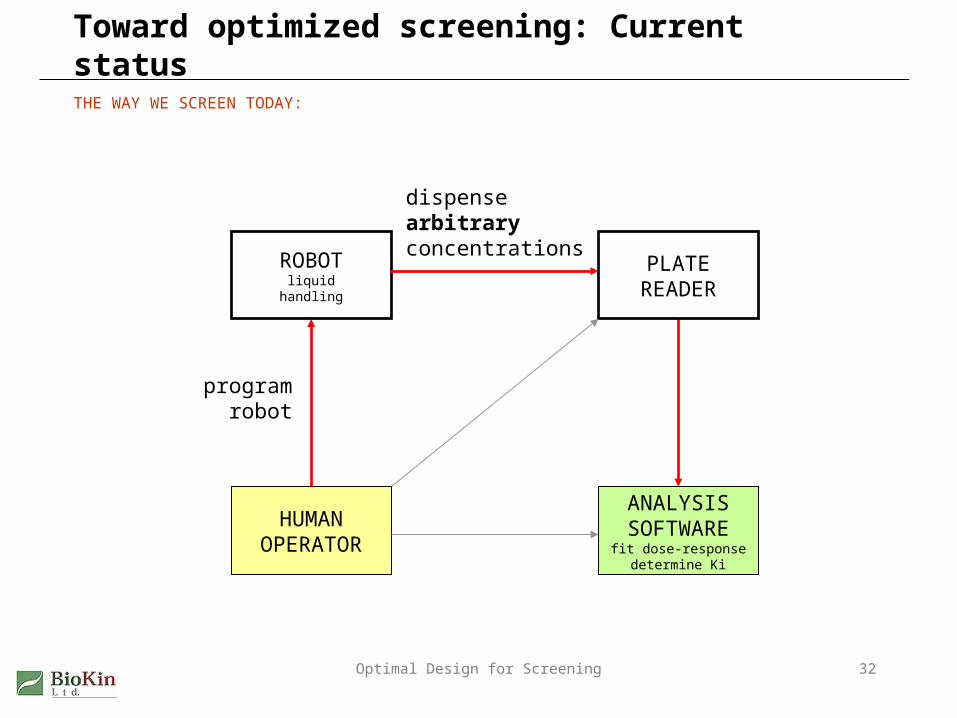
Toward optimized screening: Current status
THE WAY WE SCREEN TODAY:
HUMANOPERATOR
ANALYSISSOFTWAREfit dose-response
determine Ki
ROBOTliquid
handling
PLATEREADER
dispensearbitraryconcentrations
programrobot

Optimal Design for Screening 33
Optimal design in biochemistry: Earlier reports
SEARCH KEYWORDS: "OPTIMAL DESIGN", "OPTIMUM DESIGN", "OPTIM* EXPERIMENT DESIGN"
Franco et al. (1986) Biochem. J. 238, 855-862
uncertaintyof model
parameters
fewer experiments = better results("less is more")

Optimal Design for Screening 34
Optimal experiments for model discrimination
OPTIMAL DESIGN IS IMPORTANT FOR MECHANISTIC ANALYSIS
Franco et al. (1986) Biochem. J. 238, 855-862
try to decide onmolecular mechanism
(e.g., competitive vs.non-competitive inhibition)
optimal design

Optimal Design for Screening 35
Integration with the BatchKi software
THE BATCHKI SOFTWARE IS WELL SUITED FOR PROCESSING "SMALL", OPTIMAL DATA SETS
• Automatic initial estimates of model parameters Kuzmič et al. (2000) Anal. Biochem. 281, 62-67
• Automatic active-site titration (for ultra-tight binding compounds)
Kuzmič et al. (2000) Anal. Biochem. 286, 45-50
• Automatic detection of chemical impurities in samples Kuzmič et al. (2003) Anal. Biochem. 319, 272-279
• Automatic handling of outlier data points ("Robust Regression")
Kuzmič et al. (2004) Meth. Enzymol. 281, 62-67
• Handles enzyme inhibition and cell-based assays
• Fifteen years of experience
• Approximately 100,000 compounds analyzed by this consultant alone
ALGORITHMS
theoreticalfoundation

Optimal Design for Screening 36
Conclusions
SEQUENTIAL OPTIMAL DESIGN FOR INHIBITOR SCREENING HAS BEEN TESTED "IN SILICO"
• reduce material expenditures by more than 50%
• reduce screening time by more than 50%
• increase accuracy & precision of the final answer (Ki)
Advantages of sequential optimal design:
• works best for large number of compounds (n > 100)
• has not been tested in practice
• to avoid programming liquid handler manually, needs "closing the loop": robot reader computer
Disadvantages, limitations, and caveats:
Collaboration,anyone?

Optimal Design for Screening 37
Acknowledgments
Craig Hill & James Janc
Theravance Inc.South San Francisco, CA
formerly Celera Genomics – South San Franciscoformerly Axys Pharmaceuticals formerly Arris Pharmaceuticals

Optimal Design for Screening 38
Thank you for your attention
•
Questions ?• More info: www.biokin.com
• Contact:
BioKin Ltd | 15 Main Street Suite 232 | Watertown | Massachusetts 02472 | U.S.A.
+1 617 209 4242+1 617 209 1616 FAX