optimal bidding strategy in electricity markets under ... · optimal bidding strategy in...
TRANSCRIPT

Optimal Bidding Strategy in Electricity MarketsUnder Uncertain Energy and Reserve Prices
Power Systems Engineering Research Center
A National Science FoundationIndustry/University Cooperative Research Center
since 1996
PSERC

Power Systems Engineering Research Center
Optimal Bidding Strategy in Electricity Markets Under Uncertain Energy and Reserve Prices
Rajesh Rajaraman Christensen Associates
Fernando Alvarado University of Wisconsin - Madison
PSERC Publication 03-05
April 2003

Information about this project For information about this project contact: Fernando Alvarado Professor Electrical and Computer Engineering University of Wisconsin-Madison 1415 Engineering Dr. Madison, WI 53706 Tel: 608-262-8900 Fax: 608-262-1267 Em: [email protected]
Rajesh Rajaraman Vice President Laurits R. Christensen Associates 4610 University Avenue Madison, WI 53705 Tel: 608-231-2266 Fax: 608-231-1365 Em: [email protected] http://www.lrca.com
Power Systems Engineering Research Center This is a project report from the Power Systems Engineering Research Center (PSERC). PSERC is a multi-university Center conducting research on challenges facing a restructuring electric power industry and educating the next generation of power engineers. More information about PSERC can be found at the Center’s website: http://www.pserc.wisc.edu. For additional information, contact: Power Systems Engineering Research Center Cornell University 428 Phillips Hall Ithaca, New York 14853 Phone: 607-255-5601 Fax: 607-255-8871 Notice Concerning Copyright Material PSERC members are given permission to copy without fee all or part of this publication for internal use if appropriate attribution is given to this document as the source material. This report is available for downloading from the PSERC website.
2002 R. Rajaraman and F. Alvarado. All rights reserved.

Acknowledgements
Rajesh Rajaraman gratefully acknowledges support, in part, from Laurits R. Christensen Asso-ciates, an economic consulting firm specializing in solutions to business challenges in numerousdomestic and international industries including natural gas, electricity, telecommunications,transportation, and postal services.
Fernando Alvarado acknowledges support, in part, from the Consortium for Electric Reli-ability Technology Solutions (CERTS) under DOE Interagency Agreement DE-AI-99EE35075with the National Science Foundation and in part from the Power Systems Engineering Re-search Center (PSerc), an NSF Industry/University Cooperative Research Center. CERTSwas formed in 1999 to research, develop, and disseminate new methods, tools, and technologiesto protect and enhance the reliability of the U.S. electric power system in the transition to acompetitive electricity market structure. PSerc was formed in 1996 to draw on the capabil-ities of multiple universities to creatively address challenges associated with the evolution ofthe electric power industry into a new business environment.
The authors are also grateful to Mary Cain and David Watts of the University of Wisconsinand to Dennis Ray of PSerc, for their valuable comments and suggestions.
i

Executive Summary
This report describes the mathematics of finding optimal bidding strategies in multi-periodelectricity market auctions of energy and reserve markets, taking full account of generatorcosts and operating constraints, and exogenous price uncertainty. The operational constraintsof the generator include such items such as minimum up and down times, minimum powerproduction requirements, maximum ramp times. The report addresses five specific concerns:bidding into multiple markets, the impact of market design rules (particularly the requirementthat bids be non-decreasing with increasing amounts offered), the non-convexity of cost curves(often the results of start-up and shut-down costs), the effect of inter-temporal constraints,and the effect of price uncertainty. The analysis of this problem requires the use of nestedDynamic Programming (DP) techniques; in particular, we show how to use the innermost-nested DP to find a bidding function that satisfies market design rules. This type of analysisprovides new insights into anticipated market behavior in auctions.
The methods offered in the report are practical to implement and have minimal data needs.The methods are applicable to price-taking generators as well as to generators with the abilityto influence price.
The bidding strategy methods are illustrated with numerous examples. One of the mostrevealing observations of this report is that bidding situations with only minor difference inthe bidding rules can give rise to significantly different optimal bidding strategies and expectedprofits. This makes assessment of observed bidding behavior more challenging. For example,we show that requiring bids to have non-decreasing offer prices can produce very differentbidding strategies from a market design without this requirement.
Knowledge of optimal bidding strategies would help both generators and regulators. Gen-erators can improve profits using such strategies. A regulator can use these optimal biddingstrategies to develop tests that check if a generator behaved like a price-taker or exercisedmarket power.
The implications of this report on market design are important. Fundamentally, a marketthat appears on the surface to be simple can lead to the need for complex analysis on the partof the generators and the bidders in order to attain profitability as a result of the numerousconcerns pertaining to costs and operational restrictions that must be faced in real life. Itwill also make the job of a regulator or auditor harder because more factors must be takeninto consideration when assessing market power issues. Therefore, it is essential that the bothbidding strategies and auditing and monitoring procedures be sophisticated enough to captureall constraints and uncertainties. This report provides the basis for such analysis.
ii

Contents
1 Introduction 1
2 Assumptions and Annotated Glossary 52.1 Assumptions . . . . . . . . . . . . . . . . . . . . . . . . . . . . . . . . . . . . . 52.2 Glossary . . . . . . . . . . . . . . . . . . . . . . . . . . . . . . . . . . . . . . . . 5
3 Optimal State Transition and Biddable Dispatch Strategy 9
4 Illustrative Examples 134.1 Energy Limited Hydro . . . . . . . . . . . . . . . . . . . . . . . . . . . . . . . . 134.2 Energy Limited Hydro, Non-Declining Bids Required . . . . . . . . . . . . . . . 194.3 Energy Limited Hydro: MW Bids Must Be Non-Decreasing Function of Price,
Uncorrelated Prices . . . . . . . . . . . . . . . . . . . . . . . . . . . . . . . . . . 234.4 Thermal Generator with One Reserve Market: Sequential Market Clearing,
Forecast Uncertainty, Non-Decreasing Bid Function . . . . . . . . . . . . . . . . 274.5 Thermal Generator with One Reserve Market: Sequential Market Clearing,
Forecast Uncertainty, Non-Decreasing Bid Function . . . . . . . . . . . . . . . . 30
5 Observations and Applications 32
6 Generator is Not a Price-Taker 346.1 Thermal Generator with Market Power Under Some Price Regimes, Single En-
ergy Market, Forecast Uncertainty, Non-Decreasing Bid Function . . . . . . . . 346.2 Thermal Generator with Market Power Under All Price Regimes, Single Energy
Market, Forecast Uncertainty, Non-Decreasing Bid Function . . . . . . . . . . . 366.3 Observations . . . . . . . . . . . . . . . . . . . . . . . . . . . . . . . . . . . . . 38
7 Computational Issues 41
8 Conclusions 42
iii

1 Introduction
In deregulated electricity markets, generators must either submit profit-maximizing bidsto a pool or optimally self-schedule in response to prices. In some market designs bids aresimple bids (offers) to sell a certain amount of energy or some other service the unit is able toprovide at a given price or better. In other market designs, bids may include other attributesthat constitute the cost at which the unit is willing to provide a service, such as start-up orshut-down costs, energy constraints and more. In some other market designs, a generator ispermitted to “self-schedule.”
Regardless of market design, the generator’s bidding (or self-scheduling) problem is compli-cated by several factors, in particular, the presence of multiple markets, market design rules,non-convexity of cost curves, inter-temporal constraints, and price uncertainty. We discusseach of these factors below.
1. Multiple markets: A generator typically has a choice of multiple markets into whichit can sell its capacity. For example, a generator can allocate its output to the energymarket, or it can make its output available to one of the operating reserves markets. Inaddition to deciding which market to allocate their output, energy-limited hydroelectricgenerators must also decide whether to allocate their output now or in later periods.
2. Market design rules: The design of electricity market auctions significantly affectsthe bidding strategy of the generator. For example, in “uniform price” auctions, everywinning bidder gets the same market clearing price, while in “pay-as-bid” auctions, everywinning bidder gets paid its winning bid. In uniform price auctions, price-taking gener-ators tend to bid their incremental costs, while in pay-as-bid auctions, generators tendto bid close to their expectation of the market price. Moreover, markets where energyand reserve markets are simultaneously cleared require different strategies than marketswhere energy and reserve services are sequentially cleared. The effect of market designrules on generator behavior has been examined in detail by Harvey and Hogan (Harveyand Hogan 2001).
3. Non-convexity of cost curves: Non-convexity arises mainly from start-up and shut-down costs, increasing generator efficiencies at higher loading levels, “valve point” effectsand other such effects. Non-convex costs complicate generator bidding behavior becausegenerators are typically required to use non-decreasing bid curves (as a function of MWoffered) in electricity auctions.
4. Inter-temporal constraints: Inter-temporal constraints (such as start-up and shut-down times, total energy limits, ramp rate limits, etc.) also complicate bidding strate-gies.
5. Price uncertainty: At the time a decision to commit or dispatch is made, a generatortypically faces price uncertainty in future periods. Because of inter-temporal constraints,future price uncertainty affects the generator’s bids in the present period.
1

There is a distinction between optimal scheduling strategies and optimal bidding strategies.Under some conditions, the two are essentially equivalent. However, under other conditionsthey can be quite different, as this report demonstrates. The problem of finding an optimalscheduling strategy is essentially equivalent to the traditional unit commitment problem. Theproblem of finding the optimal bidding strategy is related to but not identical to the unitcommitment problem.
Unit commitment refers to the problem of deciding when to start and when to shut-downgenerators in anticipation of changing demand. In traditional utility systems, the problem ofunit commitment was formulated and solved as a multi-period optimization problem. In thetraditional problem formulation, the anticipated demand was an input variable. The problemwas solved for multiple generators, generally owned by the same entity (a utility). The start-up, shut-down and operating costs of the generators were assumed known. There has beenextensive literature on this topic over the last thirty years. See, for example, (Wood andWollenberg 1996). A brief review of the topic is given below.
Prior to the 1980’s, the unit-commitment problem was solved using Dynamic Program-ming (DP) (Bertsekas 1987). Bertsekas and others in the 1980’s (Bertsekas, Lauer, Jr., andPosbergh 1983, Merlin and Sandrin 1983) introduced the concept of Lagrangian relaxation toattack the problem. In Lagrangian relaxation, the system-wide energy and reserve require-ments constraints are “relaxed” by introducing prices. An economic interpretation is that,in Lagrangian relaxation, the unit commitment problem is solved using an iterative, 2-stepdual formulation. In one step of the dual solution, each generator independently maximizesits profits over a number of periods taking the prices for energy and reserves in each periodas given, while in the second step, these prices are varied to coax the generators to meet therequired system demand for each period. At the optimal solution, each generator maximizesits profits, while the price in each period is such that the total output offered by all generatorssatisfies the system demand and reserve requirements in the period. The profit maximizationproblem for the generators in the dual formulation can be generally solved using backwardDP techniques (Bertsekas 1987).
Other methods of unit commitment proposed in recent years include the method of de-commitment (Li, Johnson, and Svoboda 1997), (Tseng, Oren, Svoboda, and Johnson 1997).Hobbs (B. F. Hobbs et al. 2001) and the references contained therein give the state-of-the-arton unit commitment methods.
The problem of finding optimal bids for generators has interested several researchers. Seefor example (Gross and Finlay 1996). Pereira and his co-workers (Kelman and Pereira 1998),(Pereira, Barroso, and Kelman 2002) addressed methods dealing with bidding strategies inhydro-dominant regions using Monte-Carlo methods, DP and heuristics to arrive at Cournot-Nash solutions. Guan et. al (Guan, Ni, Luh, and Ho 2001) use a bid selection method basedon ordinal optimization to obtain “good enough” bidding strategies. Most of these papersgenerally try to solve the bidding strategy problem for all generators in the system, with eachgenerator having to take full account of other generators’ bidding strategies. Consequently,the problems that are solved are highly complex because the optimization is carried out overmany different variables and over a range of generator bidding behaviors. The intensivecomputational burden in such problems is alleviated through approximations or heuristics.Moreover, prior work on the unit commitment problem often neglects the added complexityof locational variation of prices.
In our opinion, while recent papers have contributed significantly to the literature and
2

have introduced ingenious computational methods, the bidding problem that they pose (andattempt to solve) is unnecessarily complex. In particular, trying to model the bidding behaviorof every generator in the system is heroic. As a practical matter, even if we assumed that everygenerator was a price-taker, the problem of finding a generator bidding strategy is difficultbecause a market participant does not have accurate enough data on competitors’ generators.Moreover, the effect of market design rules on generator behavior can be quite complex (Harveyand Hogan 2001). This is because, even under the price-taker assumption, a generator’sbidding behavior could depend on its forecast of market-clearing prices, and generator priceforecasts may vary (Rajaraman and Alvarado 2002a), (Rajaraman and Alvarado 2002b).
This report presents the mathematics for finding the multi-period optimal bidding strategyfor a generator in electricity markets under exogenous uncertain energy and reserve prices;the report represents an improvement over previous work by the authors (Rajaraman, Kirsch,Alvarado, and Clark 2001). In an electricity market, one can readily observe prices by location.The historical archive of these prices (that vary by location) captures the past bidding behaviorof all the generators in the system under different system conditions and load levels. Theformulation can also be used to find profit-maximizing bidding strategies for generators thatexercise market power (e.g., by withholding output). We do this by using “residual demand”curves (Samuelson and Nordhaus 1998); that is, we let the exogenous prices be a functionof the amount of generator output. Using price (or residual demand curves) as exogenousinputs over modeling the behavior of many generators in the system is numerically moretractable (fewer variables to model) and leads to greater insights into the structure of thestrategy-selection problem.
Our report also pays special attention to how market design rules, price uncertainty, andnon-convexity of costs affect “allowed” bidding strategies; this is a neglected feature in mostwork on bidding strategies. Example 4.1 shows that even if a generator has convex costs,the effect of price uncertainty is such that the optimal bidding strategy (if there were norestrictions on the bidding function) is to bid a declining curve of MW versus price. However,since electricity market auctions typically disallow declining price bids (usually the MWsoffered must be a non-decreasing function of price), the optimal bidding strategy must bechanged to satisfy this constraint. The optimal bidding strategy in this case involves solvingmulti-level, nested backward DP problems.
Knowledge of optimal bidding strategies (under both the price-taking as well as price-influencing conditions) has at least a couple of uses. The most obvious one is that generatorswould improve profits using such strategies.
A less obvious use of knowing the optimal bidding strategy is that a regulator can judgeif a generator behaved like a price-taker or exercised market power. Tests based on optimalbidding strategies help determine whether market power was exercised (Rajaraman and Al-varado 2002a, Rajaraman and Alvarado 2002b). The tests check whether the behavior ofeach generator in a market participant’s portfolio is indeed the behavior one would expect toobserve if the generator were a price-taker given the market design rules, multiple markets,non-convex operational constraints, non-convex cost structure, etc., in the presence of forecastuncertainty.
The basic idea behind the tests is as follows (Rajaraman and Alvarado 2002b). If agenerator withholds infra-marginal output in some periods, then in order to “explain” thewithheld infra-marginal output, the generator has to claim that (a) the expected future pricesat the time the decision to withhold was made were lower than what actually materialized,
3

and (b) at the price levels that were expected by the generator, the withheld output would be“out-of-the-money” (and not infra-marginal). If the generator were exercising market powerby consistently withholding infra-marginal output during (what everyone expected to be) highprice periods, then the generator’s claim that forecast prices were consistently and significantlylower than the actually realized prices would not be credible. On the other hand, if price spikesin some periods were due to unforeseen events, then the generator’s behavior of withholdingwhat only in hindsight turned out to be infra-marginal generation could be explained by thelack of perfect foresight of prices at the time the decision to withhold was made. For thecase of hydroelectric generators, the nature of inter-temporal constraints and the possibilityof storage complicate dispatch and state transition decisions, because lack of foresight of pricesin later periods could have an impact on dispatch now.
The report is organized as follows. Section 2 gives an annotated glossary of the symbolsused for the convenience of the reader. Section 3 presents the mathematics of the optimalbidding strategy problem and solves it using multiple-level nested backward Dynamic Pro-gramming (DP) approaches. Section 4 illustrates our methods with a number of differentexamples. Section 5 briefly discusses how the methods can be applied to real electricity auc-tions. Section 6 shows how one may use the ideas in Section 3 to derive the optimal biddingstrategy for a generator that is not a price-taker; i.e., the generator is capable of setting prices.We use the concept of residual demand curves to derive the bidding strategy. Section 7 brieflydiscusses computational issues. Section 8 concludes the report. The appendix gives a briefoverview of DP methods.
4

2 Assumptions and Annotated Glossary
2.1 Assumptions
1. A single generator is does not directly constrain the output of other generators. Forexample, a hydroelectric system with three hydro units cascaded in series would beconsidered a single generator.
2. The generator is a price-taker ; i.e., it takes prices as a given and has no influence onmarket prices. In Section 6, we relax this assumption by assuming that the generatorhas some influence on prices; the generator maximizes its profits given the exogenous,uncertain residual demand curve facing the generator.
2.2 Glossary
K There are K (sequential) uniform-price auctions, or more explicitly, auction rounds.Each auction round can correspond to a time period (e.g., 24 auctions could be for a 24-hour day-ahead period). However, an auction round can also correspond to a particularmarket within a time period. For example, one auction round can be used to acquireancillary services, while another auction round can be used to secure energy, both for thesame time period. In the terminology of the appendix, an auction, an auction round ora time period all are associated with the notion of “stage” in a sequential optimizationprocess. In what follows, we will use the terms auction, auction round, time period andstage somewhat interchangeably, with a preference for using auction round. The conceptof stage, however, is a bit more general, as the appendix illustrates, since there are othernotions that may be associated with stages.
pk For auction round k, the exogenous energy and reserve prices are represented by aprice vector pk. If the generator can provide only one type of service (e.g., energy),then pk is a scalar. The prices from any one period can be correlated to the pricesfor a subsequent period following some Markov random process. We assume that theprobability prob(pk+1|pk) is known for all k. Figure 1 illustrates our exogenous pricemodel.
xk The generator state for auction round k. For a thermal generator, generator statescould include at a minimum UP and DOWN, but there can also be many other states toindicate generator readiness or the amount of fuel remaining. For example, a generatorwith a minimum two-period up-time requirement can be represented by having two up-states, and only the second up-state has a permissible transition to the DOWN state.For a hydro generator, a generator state for auction round k could be the reservoir levelfor auction round k. The states can also indicate the fuel (or water) available for futureuse, the capability of a generator to deliver reserves, or any other parameter necessaryto completely characterize the generator during any time period. The state xk can be aset, a scalar, a vector, a set of vectors, or almost anything else.
5

Xk The set of allowed states of the generator during auction round k. In other words,xk ∈ Xk. For example, a generator may be required to be online for some particularauction round k. As another example, the generator may need to be taken down formaintenance at some time.
yk The generator dispatch quantity during auction round k. For an energy-only model,this is a scalar representing energy. In general, a generator may dispatch any quantityof energy and various kinds of reserves and other possible services during any period,subject to some validity rules. Although the dispatch vector components can in manycases be continuous variables, we often discretize the number of permissible dispatchchoices. The generator dispatch yk is constrained to lie in some subset that could be afunction of the state xk. The generator dispatch is our main decision variable. It affectsthe state transition. Or rather, it is the means by which one can achieve a desiredoptimal state transition x∗k+1.
Yk The set of permissible dispatch choices for yk. This set may in turn be a function ofthe state xk. In other words, yk ∈ Yk(xk). In some cases, we also restrict yk to bea “biddable” function, i.e., yk must be bid into an auction, and therefore must satisfycertain rules of the auction. For example, it is a typical requirement of electricity marketauctions that the amount of MW offered must be an increasing function of the bid price.Therefore, we assume that yk also has to satisfy certain constraints based on price (inaddition to the state xk), i.e., yk ∈ Yk(xk,pk).
Tk State transition rules specify allowed transitions from xk (which depend on the dispatchyk) to xk+1, i.e., xk+1 ∈ Tk(xk,yk).
ck The known transition cost associated with moving from generator state xk in auctionround k to xk+1 in auction round k + 1. It is generally a function ck(xk,xk+1).
Rk The auction round k revenues that accrue from dispatching yk in state xk when theprice is pk. This includes the revenues from reserves as well as from energy sales. Inmany practical cases, these revenues can be expected to be independent of the state andbe a function of only the price and the dispatch.
Ck The costs (or profits) from dispatching yk in state xk when the price is pk. In general it isa function Ck(xk,pk,yk). (As a practical matter, this cost function is often independentof the price pk.)
∗ The asterisk ∗ is associated with optimal solutions.
y∗k(xk,pk) The optimal dispatch strategy in auction round k as a function of state xk and price pk.
x∗k+1(xk,pk,yk) The optimal state transition strategy given state xk, price pk and dispatch yk in auctionround k. That is, the next state in auction round k + 1, xk+1 = x∗k+1(xk,pk,yk).
x∗k+1(xk,pk) The optimal state transition strategy1, given state xk and price pk corresponding tothe optimal dispatch in auction round k, yk = y∗k(xk,pk). That is, x∗k+1(xk,pk) ≡x∗k+1(xk,pk,y∗k(xk,pk)).
1This represents a technical abuse of notation; however, this definition is intuitive and we use it for ease ofexposition.
6

k k+1
PR
ICE
($/
MW
h)
AUCTIONS
HIGH
LOW
MEDIUM
0.20.7
0.1
0.50.2
0.3
0.8
0.10.1
HIGH
MEDIUM
LOW
Figure 1: Price states and transition probability from one auction round to the next. Eachauction round has three price states: LOW, MEDIUM and HIGH. The numbers next to thetransition arrows show the probability of transition prob(pk+1|pk). The thickness of thearrows is proportional to the transition probability. For example, the probability that theprice will be LOW in auction round k + 1 given that it is HIGH in auction round k is 0.1.The actual LOW, MEDIUM and HIGH values in auction round k will in general be differentfrom the corresponding ones in auction round k + 1.
J∗k(xk,pk,yk|xk+1) The optimal cumulative profits from auction round k onward assuming that the statereached in auction round k + 1 is xk+1. This is equal to Rk − Ck minus the cost ck
of transitioning to the next state xk+1 in auction round k + 1 from state xk in thecurrent auction round k, plus the expected cumulative profits from auction round k + 1onwards, assuming the optimal state transition and dispatch strategy is followed fromauction round k + 1 onwards.
J∗k(xk,pk,yk) The optimal cumulative profits2 from auction round k onward, assuming that the optimalstate transition strategy is followed from auction round k onward; i.e, J∗k(xk,pk,yk) ≡J∗k(xk,pk,yk,xk+1 = x∗k+1(xk,pk)).
In the examples in Section 4, the following terms are also used:
M(xk,pk,xk) When solving the DP problem associated with the biddability of a particular strategy,this matrix characterizes the profits from each bidding stage. The stages are associatedwith price level, not with the auction round or time period. For a discrete-valued set ofprice levels, this matrix is obtained as the probability of pk times J∗k(xk,pk,yk); i.e.,M(xk,pk,yk) = prob(pk)J∗k(xk,pk,yk). The role this matrix plays in the biddabilityDP is the same as the role that Rk−Ck plays in the primary optimization problem, theprofits from one stage. Section 4.2 contains more details.
2See previous footnote.
7

OFFLINESTATES
ONLINESTATES
k k+1
GE
NE
RA
TO
R S
TA
TE
S
AUCTIONS
AllowedStates
ck
Figure 2: Generator states and state transitions from auction round k to auction roundk + 1. For thermal generators, their states can be divided into online and offline states. (Forhydroelectric generators, their states can be parameterized by the amount of water remainingin the reservoir.) The state transition rules Tk are the arrows that show the permissibletransitions from one state in auction round k to another state in auction round k + 1.
V (xk,pk,xk) When solving the DP problem associated with the biddability of a particular strategy,this matrix characterizes the optimal cumulative profits for each state for each biddingstage. This matrix is constructed from M(xk,pk,yk) using a backward DP approach.In the examples we use, this function to determine the optimal yk is a non-decreasingfunction of pk. In effect, this matrix serves the same role in the biddability DP as thecumulative profits J∗k serves in the DP across time periods. A more precise definition ofthis quantity is given in equations 55 and 56.
c(z1, z2) When solving the DP problem associated with the biddability of a particular strategy,this is the state transition cost matrix that forbids transitions from higher dispatchvalues to lower dispatch values by penalizing such transitions; that is, c(z1, z2) = 0 ifz1 ≤ z2 and c(z1, z2) = ∞ if z1 > z2. This plays the same role in the biddability DP asthe role ck plays in the primary optimization problem. Section 4.2 has more details.
8

3 Optimal State Transition and BiddableDispatch Strategy
A generator has to solve the problem of finding the optimal state transition and “biddable”dispatch strategies that maximize expected total profits over the K auction rounds. Moreformally, given exogenous energy and reserve prices:
maxK∑
k=1
E [Rk(xk,pk,yk)− Ck(xk,pk,yk)− ck(xk,xk+1)] (1)
subject to
yk ∈ Yk(xk,pk)xk+1 ∈ T (xk,yk)xk ∈ Xk
k = 1, . . . ,K (2)
where the maximization is over biddable state transition and dispatch strategies xk+1(xk,pk)and yk(xk,pk). E is the expectation operator over uncertain prices pk, with known Markovprobabilities prob(pk+1|pk). We seek a solution to problem 1 of the form:
yk = y∗k(xk,pk)xk+1 = x∗k+1(xk,pk)
}k = 1, . . . ,K (3)
In other words, we want to find the optimal dispatch and optimal state transition strategiesfor auction round k as functions of state xk and price pk.
The optimal state transition and dispatch strategies can be found from the following back-ward DP problem. We first write the DP equations for the terminal period or auction roundK.
J∗K(xK ,pK ,yK ,xK+1) = RK(xK ,pK ,yK)− CK(xK ,pK ,yK)− cK(xK ,xK+1) (4)J∗K(xK ,pK ,yK) = max
xK+1∈XN+1∩TK(xK ,yK)J∗K(xK ,pK ,yK ,xK+1) (5)
x∗K+1(xK ,pK ,yK) = argmaxxK+1∈XN+1∩TK(xK ,yK)
J∗K(xK ,pK ,yK ,xK+1) (6)
If there is no solution to the maximization problem 5, let J∗K(xK ,pK ,yK) = −∞, and letx∗K+1(xK ,pK ,yK) be the null set.
Next we carry out the following optimization to get the optimal strategies for period K:
y∗K(xK ,pK) = argmaxyK(xK ,pK)∈YN (xK ,pK)
E [J∗K (xK ,pK ,yK(xK ,pK))] (7)
x∗K+1(xK ,pK) = x∗K+1(xK ,pK ,y∗K(xK ,pK)) (8)
where the expectation E in equation 7 is over pK , and the optimization in equation 7 is afunctional optimization. As we shall see in Section 4, this functional optimization can besolved using a separate backward DP optimization.
9

For the remaining auction rounds k = K − 1, . . . , 1, we can write the following recursiveDP equations; the optimization is carried out in reverse order from k = K − 1 to k = 1.
J∗k(xk,pk,yk,xk+1) = Rk(xk,pk,yk)− Ck(xk,pk,yk)− ck(xk,xk+1)+E
[J∗k+1
(xk+1,pk+1,y∗k+1(xk+1,pk+1)
) |pk
](9)
J∗k(xk,pk,yk) = maxxk+1∈Xk+1∩Tk(xk,yk)
J∗k(xk,pk,yk,xk+1) (10)
x∗k+1(xk,pk,yk) = argmaxxk+1∈Xk+1∩Tk(xk,yk)
J∗k(xk,pk,yk,xk+1) (11)
If there is no solution to the maximization problem 10, then we let J∗k(xk,pk,yk) = −∞,and we let x∗k+1(xk,pk,yk) be the null set.
We next carry out the following optimization to get the optimal strategies for period k:
y∗k(xk,pk) = argmaxyk(xk,pk)∈Yk(xk,pk)
E [J∗k (xk,pk,yk(xk,pk))] (12)
x∗k+1(xk,pk) = x∗k+1(xk,pk,y∗k(xk,pk)) (13)
where the expectation E in equation 12 is over pk. The optimization in equation 12 is also afunctional optimization.
OFFLINESTATES
ONLINESTATES
k k+1
GE
NE
RA
TO
R S
TA
TE
S
AUCTIONS
AllowedStates
ck
x*k+1(xk,pk=LOW)
x*k+1(xk,pk=HIGH)
Figure 3: Optimal state transition strategy in auction round k depends upon both the gener-ator state xk and the price pk. The figure illustrates that if the price pk is LOW, it is optimalto go to one of the OFFLINE states, as shown by the lower line in bold. If the price pk isHIGH, it is optimal to go to one of the ONLINE states, as shown by the upper line in bold.The optimal strategy is found for each state and price combination in auction round k.
If the optimal dispatch and state transition strategies are followed, the expected profit
10

PRICE pk
gk(xk,pk)
MIN MAXDISPATCH yk
xk=ONLINE
y* k(xk,pk)
gk(xk, pk)=0
PRICE pk
DISPATCH yk
xk=OFFLINE
y* k(xk,pk)=0
(A)
(B)
Figure 4: The optimal dispatch strategy is a function of both state and price in auction roundk. Figure 4(A) illustrates the optimal bidding strategy when the generator is ONLINE inauction round k, assuming that the optimal $/MW bid must be a non-decreasing function ofMW, and that when the generator is ONLINE, the generator must produce output betweenMIN and MAX. Therefore, the allowed dispatch strategies Yk are all non-decreasing functionsof price pk; the optimal dispatch strategy for the case when the generator is ONLINE is shownin bold. When the generator is OFFLINE, it cannot produce any output, no matter what theprice. Therefore, when the generator is OFFLINE, there is only one allowed dispatch strategyYk, which is to produce 0 MW; this is also the optimal dispatch strategy y∗k, as shown inFigure 4(B).
from following this strategy as a function of the period 1 state x1 and price p1 is:
Optimal expected total profits = E [J∗1(x1,p1,y∗1(x1,p1))] (14)
where the expectation E in equation 14 is over p1.Figure 3 illustrates the optimal state transition strategy as a function of state and price.
Figure 4 illustrates the optimal dispatch strategy as a function of state and price. Here are afew observations:
1. The maximization in equation 12 (and equation 7) is a constrained optimization over afunction space; therefore, depending on the nature of this optimization, one may needDP-like methods to solve it. In such a case, the optimization 1 is a two-level nestedbackward-DP problem. Such problems arise in practice because the bidding strategyis typically restricted in electricity market auctions to be an non-decreasing functionof the MW offered. Equations 7 and 12 differentiate the problem from conventionalself-commitment problems. This is illustrated in examples 4.2 and 4.3.
11

2. In the examples in the next section, we use discrete rather than a continuous mathematicsto describe the DP formulation, even though the mathematics presented here supportsboth continuous and discrete frameworks. In other words, we discretize pk and yk;our treatment is chosen to provide insights and to make it easier to develop computeralgorithms to solve the optimal bidding strategy problem.
3. If Yk(xk,pk) does not depend on pk (i.e., Yk(xk,pk) ≡ Yk(xk)), then the maximizationin equation 12 (and equation 7) can be simplified. For each pk, we simply pick a yk =y∗k(xk,pk) ∈ Yk(xk) that maximizes J∗k(xk,pk,yk), and we set y∗k(xk,pk) = y∗k(xk,pk).We illustrate this with Example 4.1. We cannot do this when Yk(xk,pk) depends on pk
because, even though the function J∗k(xk,pk,yk) is being maximized for each pk, it ispossible that the constraint y∗k(xk,pk) ∈ Yk(xk,pk) may be violated for some values ofpk. Example 4.2 illustrates this.
12

4 Illustrative Examples
This section shows how to use the methods from Section 3 to derive optimal dispatch andoptimal bidding strategies for power market auctions. We have several objectives in mind forthis analysis:
1. To demonstrate that the optimal bidding (and state transition) strategies can be derivedin a methodical way. The examples are such that, with some effort, they can be done byhand. The point of these examples is to demonstrate the method for deriving optimalbidding strategies in a simple, logical, systematic way.
2. To demonstrate that the optimal dispatch strategy may require a bidding strategy witha declining MW versus price curve. However, declining bid curves are often not allowedin electricity auctions and the optimal allowed bidding strategy may be second-best interms of maximizing profits.
3. To demonstrate that a generator’s optimal bidding strategy can depend in a very sub-tle way on how price forecasts are modeled (e.g., price correlation among periods canmatter).
4. To demonstrate that a generator’s optimal bidding strategy could vary depending onthe auction design even assuming that the auction is a single-price auction. This mayseem obvious, but we show via examples that there are subtleties associated with thebidding strategy.
The examples also demonstrate that nested multiple-level backward DP problems must besolved to find the optimal bidding strategy. The nested multiple-level DP problems are:
1. Across time periods, starting from the final period. This is the conventional backwardDP.
2. Within each time period (see equation 12) to find the optimal bidding strategy to satisfybidding rules in the auction. Examples 4.2 to 4.5 illustrate this point.
3. Across multiple markets, starting from the final market that clears. Examples 4.4 and4.5 illustrate this point.
Figure 5 illustrates the nested nature of these DP problems.Therefore, to solve the optimal bidding strategy problem, one may need to solve three (or
more) nested backward DP problems. This makes the problem different from other conven-tional DP problems. The appendix gives an overview of typical DP problems.
4.1 Energy Limited Hydro
We consider a two-period problem with a single energy market and a hydroelectric generatorthat has 100 MWh of energy in its reservoir. No energy (water) is added to the reservoir
13
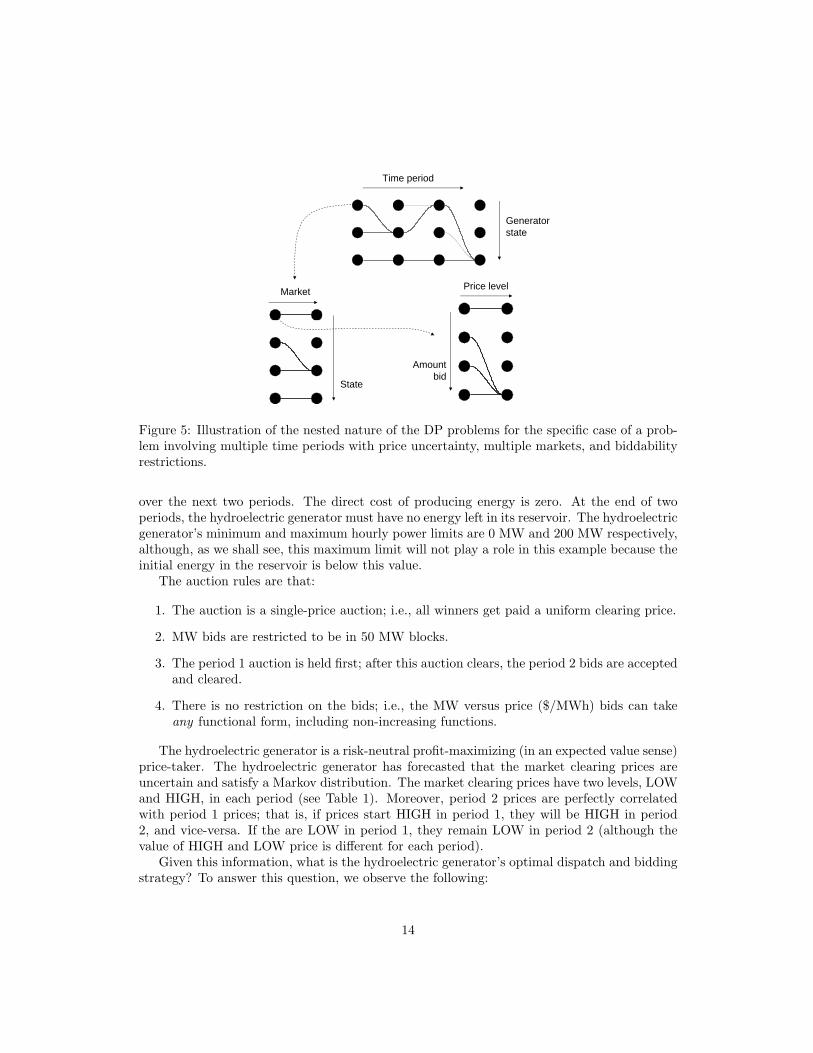
Time period
Generatorstate
Market
State
Amountbid
Price level
Figure 5: Illustration of the nested nature of the DP problems for the specific case of a prob-lem involving multiple time periods with price uncertainty, multiple markets, and biddabilityrestrictions.
over the next two periods. The direct cost of producing energy is zero. At the end of twoperiods, the hydroelectric generator must have no energy left in its reservoir. The hydroelectricgenerator’s minimum and maximum hourly power limits are 0 MW and 200 MW respectively,although, as we shall see, this maximum limit will not play a role in this example because theinitial energy in the reservoir is below this value.
The auction rules are that:
1. The auction is a single-price auction; i.e., all winners get paid a uniform clearing price.
2. MW bids are restricted to be in 50 MW blocks.
3. The period 1 auction is held first; after this auction clears, the period 2 bids are acceptedand cleared.
4. There is no restriction on the bids; i.e., the MW versus price ($/MWh) bids can takeany functional form, including non-increasing functions.
The hydroelectric generator is a risk-neutral profit-maximizing (in an expected value sense)price-taker. The hydroelectric generator has forecasted that the market clearing prices areuncertain and satisfy a Markov distribution. The market clearing prices have two levels, LOWand HIGH, in each period (see Table 1). Moreover, period 2 prices are perfectly correlatedwith period 1 prices; that is, if prices start HIGH in period 1, they will be HIGH in period2, and vice-versa. If the are LOW in period 1, they remain LOW in period 2 (although thevalue of HIGH and LOW price is different for each period).
Given this information, what is the hydroelectric generator’s optimal dispatch and biddingstrategy? To answer this question, we observe the following:
14

Table 1: HIGH and LOW values of pk in $/MWh for each period.Time Period
pk 1 2HIGH 30 40LOW 20 15
1. The number of auction rounds is K = 2.
2. The state xk in period k (corresponding to auction round k) is the amount of energyleft (in MWh) in the reservoir. Because of the requirement that the generator bid in50 MW blocks, the allowed states xk are Xk = {0, 50, 100} MWh. Let EMPTY = 0,HALF = 50 MWh, and FULL = 100 MWh. Moreover, xK+1 = EMPTY = 0 MWh.
3. The maximum dispatch must not exceed the maximum of 200 MW or the total energyin the reservoir (xk). By assumption, the dispatch yk must be a multiple of 50 MW.Thus, yk must lie in the set Yk = {0, 50, . . . , min(xk, 200)} MW. For example, if xk = 0,then Yk = {0}.
4. The state transition rule is given by xk+1 ∈ Tk(xk,yk) = xk − yk.
5. The revenues are Rk(xk,pk,yk) = pkyk. The dispatch cost Ck(xk,pk,yk) = 0, and soare the transition costs ck(xk,xk+1) = 0. Thus, profits equal revenues in this example.
In order to obtain the optimal dispatch and bidding strategy, we again solve optimizationproblem 1. In doing so, we fill Tables 2 to 5 which show the optimal dispatch strategy, the op-timal commitment strategy and the optimal cumulative profits (from period k to the terminalperiod) respectively, starting with the last column in each table and working backwards.
We start with the terminal period K = 2, and we solve equations 4, 5, 6. We note thatx3 = 0 because all the energy must be used up at the end of three periods. It can be verifiedthat
J∗2(x2,p2,y2,x3) = p2y2 (15)J∗2(x2,p2,y2) = p2y2 (16)x∗3(x2,p2,y2) = 0 (17)
Next we solve equations 7 and 8. x3 = EMPTY = 0 = x2 − y2 implies that x2 = y2.Thus, the optimal dispatch strategy in the terminal period is straightforward: to meet theboundary condition that there be no energy left at the end of the three periods, any remainingenergy must be spent regardless of price in the final period. Therefore:
y∗2(x2,p2) = x2 (18)x∗3(x2,p2) = 0 = EMPTY (19)
The optimal next state for time period 3 for each of the states during time period 2 isEMPTY. The values of the profits for period 2 depend on both the dispatch strategy and the
15

uncertain price state during period 2. For each of the two possible price levels during period2 we can calculate the profits as p2y2. For example, for a dispatch of 50 MW and a LOWprice in period 2, the profits are 50 · 15 = 750. All other entries of this column are obtainedthe same way. This fills the last columns (corresponding to period 2) of Tables 2, 3 and 4.
We next turn our attention to filling the first columns (corresponding to period 1) ofTables 2, 3 and 4. To do this, we must solve equations 7 to 11 for k = 1.
J∗1(x1,p1,y1,x2) = p1y1 + E [J∗2 (x2,p2,y∗2(x2,p2)) |p1] (20)J∗1(x1,p1,y1) = max
x2∈X2∩T1(x1,y1)J∗1(x1,p1,y1,x2) (21)
x∗2(x1,p1,y1) = argmaxx2∈X2∩T1(x1,y1)
J∗2(x1,p1,y1,x2) (22)
We derive equation 23 using equations 16, 18 and 20; the fact that price transitions fromperiod 1 to period 2 are perfectly correlated; and the prices from Table 1:
J∗1(x1,p1,y1,x2) = p1y1 + E [p2x2|p1] ={
30y1 + 40x2 if p1 = HIGH = $30/MWh20y1 + 15x2 if p1 = LOW = $20/MWh (23)
We now illustrate calculations for x1 = FULL. The entries corresponding to x1 = HALFand x1 = EMPTY can be similarly filled in the first column (corresponding to k = 1) ofTables 2, 3 and 4 (though, strictly speaking, they are not needed because the hydroelectricgenerator is in the FULL state in period 1). The three possible state transitions from x1 =FULL = 100 MWh are x2 = FULL = 100 MWh or x2 = HALF = 50 or x2 = EMPTY = 0MWh; these correspond to y1 = 0, y1 = 50 MW, and y1 = 100 MW respectively. Therefore,for each value of y1 there is only one possible state transition. This implies that:
J∗1(x1 = FULL,p1 = HIGH, 0) = 30 · 0 + 40 · 100 = 4000 (24)J∗1(x1 = FULL,p1 = LOW, 0) = 20 · 0 + 15 · 100 = 1500 (25)
J∗1(x1 = FULL,p1 = HIGH, 50) = 30 · 50 + 40 · 50 = 3500 (26)J∗1(x1 = FULL,p1 = LOW, 50) = 20 · 50 + 15 · 50 = 1750 (27)
J∗1(x1 = FULL,p1 = HIGH, 100) = 30 · 100 + 40 · 0 = 3000 (28)J∗1(x1 = FULL,p1 = LOW, 100) = 20 · 100 + 15 · 0 = 2000 (29)
x∗2(x1 = FULL,p1, 0) = FULL (30)x∗2(x1 = FULL,p1, 50) = HALF (31)
x∗2(x1 = FULL,p1, 100) = EMPTY (32)
We now fill the first column of Tables 2, 3 and 4. As a preamble to this calculation, we usethe expected optimal cumulative profits J∗1(x1,p1,y1) from period 1 to the terminal period foreach of the two possible price levels and three possible dispatch choices during period 1. Thesevalues are entered into Table 5. For reasons that will become clear later on, we arrange thistable as shown: rows represent dispatch levels, columns correspond to price levels (increasingfrom left to right).
The bidding function is not restricted to being a non-decreasing function of price. Withouta restriction on the shape of the bidding function, the optimal dispatch strategy Yk(xk,pk)does not depend on pk. Therefore, Yk(xk,pk) ≡ Yk(xk). For each price level pk, we pick a
16

y∗k(xk,pk) ∈ Yk(xk) that maximizes J∗k(xk,pk,yk), and y∗k(xk,pk) is the optimal dispatchstrategy.
To illustrate the solution process, we first inspect Table 5 and determine, for each pos-sible price level (column), the corresponding dispatch. Doing this in Table 5, we find thatJ∗1(FULL,p1,y1) is maximized for p1 = LOW in period 1 when y1 = 100 MW; the maximumvalue is shown in boldface in the first column. Similarly, J∗1(FULL,p1,y1) is maximized forp1 = HIGH in period 1 when y1 = 0 MW; the maximum value is shown in boldface in thesecond column.
These two values, corresponding to the optimal profits when the reservoir is initially FULL,are entered into the two corresponding entries in Table 4 in positions (FULL,LOW) and(FULL,HIGH). These values are also in boldface. The dispatch implied by these optimalprofits (y1 = 100 when p1 = LOW, for example) is entered into the corresponding entry inTable 2, and the consequent next period transition state (in this case HALF) is entered intoits corresponding place in Table 3.
The remaining portion of column 1 can be similarly obtained, although it is technicallynot necessary because of the given condition that the initial state is FULL.
Table 2: Optimal bidding or dispatch strategy y∗k(xk,pk) in MW implemented during periodk
Time Period(xk,pk) 1 2
(EMPTY,LOW) 0 0(EMPTY,HIGH) 0 0(HALF,LOW) 50 50(HALF,HIGH) 0 50(FULL,LOW) 100 100(FULL,HIGH) 0 100
Table 3: Optimal state transition strategy x∗k+1(xk,pk), implemented at the end of period k
Time Period(xk,pk) 1 2
(EMPTY,LOW) EMPTY EMPTY(EMPTY,HIGH) EMPTY EMPTY(HALF,LOW) EMPTY EMPTY(HALF,HIGH) HALF EMPTY(FULL,LOW) EMPTY EMPTY(FULL,HIGH) FULL EMPTY
From these tables, in period 1, the optimal dispatch strategy is:
y∗1(FULL, LOW) = 100 MW (33)y∗1(FULL,HIGH) = 0 MW (34)
17

Table 4: Values of J∗k(xk,pk,y∗k(xk,pk) in $Time Period
(xk,pk) 1 2(EMPTY,LOW) 0 0(EMPTY,HIGH) 0 0(HALF,LOW) 1000 750(HALF,HIGH) 2000 2000(FULL,LOW) 2000 1500(FULL,HIGH) 4000 4000
Table 5: Values of J∗1(x1,p1,y1) in $ for x1 = FULLp1
y1 in MW LOW ($20/MWh) HIGH ($30/MWh)0 1500 400050 1750 3500100 2000 3000
Using the above equations in addition to equations 30 and 32, the optimal state transitionstrategy in period 1 is therefore:
x∗2(FULL, LOW) = EMPTY (35)x∗2(FULL, HIGH) = FULL (36)
It is useful to ask about the expected optimal profits from following the optimal strategy.From equation 14 and Table 4 (column entries corresponding to period 1), the expected profitsfrom following the optimal state transition and dispatch strategies are $2000 when the period1 state is FULL and period 1 price is LOW; the expected profits are $4000 when the period 1state is FULL and period 1 price is HIGH. Taking expectations over price in period 1, expectedprofits are 0.5 · 2000 + 0.5 · 4000 = $3000 when the period 1 state is FULL.
Assuming, as we have, that bidding a declining cost curve is permissible, the optimalbidding strategy for this example is:
• In period 1, bid a decreasing function of price; offer 100 MW at LOW price and 0 MWat HIGH price in period 1.
• In period 2 offer all remaining output (depending on what output got selected in period1) at a price lower than LOW, i.e., at a price lower than $15/MWh.
For this simple example, the reason for the declining bid curve is intuitive: if the price isHIGH ($30/MWh) in period 1, it is going to be even higher ($40/MWh) in period 2, so weare better off waiting to sell the entire output in period 2; if the price is LOW ($20/MWh) inperiod 1, it is going to be even lower ($15/MWh) in period 2, so we are better off selling theentire output in period 1.
18

4.2 Energy Limited Hydro, Non-Declining Bids Required
Now we consider the same problem in the previous example, except that we are requiredto bid non-declining prices with increasing quantity. As above, we proceed to fill-in severaltables containing the optimal dispatch strategy and its implied bidding strategy (Table 6);the optimal state transition strategy(Table 7), and, of course, the optimal cumulative profits(Table 8).
As in the previous example, we can derive the following:
J∗2(x2,p2,y2,x3) = p2y2 (37)J∗2(x2,p2,y2) = p2y2 (38)x∗3(x2,p2,y2) = 0 (39)
y∗2(x2,p2) = x2 (40)x∗3(x2,p2) = 0 = EMPTY (41)
This helps fill the second columns of Tables 6, 7 and 8.As before, we also derive:
J∗1(x1 = FULL,p1 = HIGH, 0) = 30 · 0 + 40 · 100 = 4000 (42)J∗1(x1 = FULL,p1 = LOW, 0) = 20 · 0 + 15 · 100 = 1500 (43)
J∗1(x1 = FULL,p1 = HIGH, 50) = 30 · 50 + 40 · 50 = 3500 (44)J∗1(x1 = FULL,p1 = LOW, 50) = 20 · 50 + 15 · 50 = 1750 (45)
J∗1(x1 = FULL,p1 = HIGH, 100) = 30 · 100 + 40 · 0 = 3000 (46)J∗1(x1 = FULL,p1 = LOW, 100) = 20 · 100 + 15 · 0 = 2000 (47)
x∗2(x1 = FULL,p1, 0) = FULL (48)x∗2(x1 = FULL,p1, 50) = HALF (49)
x∗2(x1 = FULL,p1, 100) = EMPTY (50)
Table 6: Optimal dispatch strategy y∗k(xk,pk) in MW implemented during period k
Time Period(xk,pk) 1 2
(EMPTY,LOW) 0 0(EMPTY,HIGH) 0 0(HALF,LOW) 0 50(HALF,HIGH) 0 50(FULL,LOW) 0 100(FULL,HIGH) 0 100
If there were no restrictions on bidding, the optimal dispatch would be obtained exactly asin the previous example. This means that we would select the largest value from each column
19

Table 7: Optimal state transition strategy x∗k+1(xk,pk), implemented at the end of period k
Time Period(xk,pk) 1 2
(EMPTY,LOW) EMPTY EMPTY(EMPTY,HIGH) EMPTY EMPTY(HALF,LOW) HALF EMPTY(HALF,HIGH) HALF EMPTY(FULL,LOW) FULL EMPTY(FULL,HIGH) FULL EMPTY
Table 8: Values of J∗k(xk,pk,y∗k(xk,pk)) in $Time Period
(xk,pk) 1 2(EMPTY,LOW) 0 0(EMPTY,HIGH) 0 0(HALF,LOW) 750 750(HALF,HIGH) 2000 2000(FULL,LOW) 1500 1500(FULL,HIGH) 4000 4000
of Table 9. However, doing so would require that during period 1 we dispatch 100 MW whenthe price level is LOW and 0 MW when the price is HIGH. Under the bidding rules for thisexample, this cannot be done.
Because of the “biddability” constraint, filling column 1 of these tables requires a newapproach. We illustrate the method only for x1 = FULL. The entries corresponding tox1 = HALF and x1 = EMPTY can be filled similarly.
To solve equation 12, use the following nested backward DP method. Let p1 be discretizedinto the following prices arranged in ascending order; i.e., p1 = p1
1, p21, . . . , p
`1. In our example,
there are two possibilities: p1 is either HIGH or LOW, so ` = 2, and our notation implies thatp11 = LOW and p2
1 = HIGH. We next fill the values of J∗1(FULL,p1,y1) in Table 9. From thistable, we evaluate the probability weighted values M(x1,p1,y1) = prob(p1)J∗1(x1,p1,y1) forx1 = FULL; this is displayed in Table 10.
The main constraint in equation 12 is that y1 be a non-decreasing function of price p1 sothat it is “biddable”. Therefore, we seek a non-decreasing function of price p1 that solves thefollowing problem:
maxE [J∗1 (x1,p1,y1(x1,p1))] = max∑
i=1
M(x1, pi1,y1(x1, p
i1)) (51)
y1(x1, pj1) ≥ y1(x1, p
j−11 ) 1 < j ≤ ` = 2 (52)
20

If we introduce a function c(z1, z2) such that3:
c(z1, z2) ={
0 if z1 ≤ z2
−∞ if z1 > z2(53)
then we can write equations 51 and 52 as:
maxE [J∗1 (x1,p1,y1(x1,p1))] =
max
(∑
i=1
M(x1, pi1,y1(x1, p
i1)) +
`−1∑
i=1
c(y1(x1, pi1),y1(x1, p
i+11 ))
)(54)
The problem in equation 54 can be solved by DP methods. In DP terminology (as inthe Appendix), to solve this problem we associate “price level” with “stage” (columns) anddispatch levels with states (rows), with c being the “transition costs”.
To find a non-decreasing optimal dispatch strategy, we can solve equation 54 by using thefollowing backward DP approach:
V (x1, p`1,y1) = M(x1, p
`1,y1) (55)
V (x1, pi1,y1) = M(x1, p
i1,y1) + maxey (
c(y1, y) + V (x1, pi+11 , y)
)
∀ i = `− 1, . . . , 1 (56)y∗1(x1, p
11) = argmaxey V (x1, p
11, y) (57)
y∗1(x1, pi1) = argmaxey≥y∗1(x1,pi−1
1 )
V (x1, pi1, y) i = 2, . . . , ` (58)
Therefore, the entries of V are built from the maximum value of p1 = p`1 =HIGH, and then
we work backwards until we reach the smallest value of p1 = p11 =LOW. We have associated
the notion of “stage” with “price level”.Table 11 shows the entries of V for x1 = FULL. The last column of Table 11 is simply
the last column of Table 10 per equation 55. The first column of Table 11 is calculatedusing equation 56; each entry in this table is the corresponding entry in Table 10 plus themaximum value in the next column of Table 11, where the maximum is taken over all rowsbelow including the entry. Thus, the three entries of the first column of Table 11 are computedas follows:
750 + max(2000, 1750, 1500) = 2750875 + max(1750, 1500) = 2625
1000 + 1500 = 2500
The solution to the arg max problem in equations 57 and 58 is solved by starting fromthe minimum p1 value and working sequentially till we reach the maximum p1 value. The
3In effect, the term c enforces the non-decreasing nature of the bidding function by introducing a prohibitivepenalty for all bidding functions that do not satisfy the non-decreasing property. In other words, we forbidany transition from a high dispatch amount during a LOW price level to a lower dispatch amount in a HIGHprice level by associating a high penalty for such an action.
21

minimum p1 value corresponds to the first column of Table 11. The maximum value of thisfirst column is highlighted in boldface; the corresponding argmax gives the dispatch level asdetermined by equation 57). To carry out the steps of equation 58, starting from column 1,we successively find the maximum value of the next column in Table 11 whose dispatch levelis not above the current column’s argmax dispatch level; this computation is repeated doneuntil all the columns are determined. The maximum values found this way for each columnin Table 11 are highlighted in boldface. The dispatch levels corresponding to the boldfaceentries in Table 11 form the optimal bidding strategy that satisfies the biddability constraint.
Table 9: Values of J∗1(x1,p1,y1) in $ for x1 = FULLp1
y1 in MW LOW ($20/MWh) HIGH ($30/MWh)0 1500 400050 1750 3500100 2000 3000
Table 10: Values of M = prob(p1)J∗1(x1,p1,y1) in $ for x1 = FULL. The probability thatp1 = LOW is 0.5; the probability that p1 = HIGH is 0.5
p1
y1 in MW LOW ($20/MWh) HIGH ($30/MWh)0 750 200050 875 1750100 1000 1500
Table 11: Values of V in $ (from equations 55 to 58)p1
y1 in MW LOW ($20/MWh) HIGH ($30/MWh)0 2750 200050 2625 1750100 2500 1500
Therefore, in period 1, the optimal dispatch strategy is:
y∗1(FULL, LOW) = 0 MW (59)y∗1(FULL,HIGH) = 0 MW (60)
Using the above equations and equation 48, the optimal state transition strategy in period1 is:
x∗2(FULL, LOW) = FULL (61)x∗2(FULL,HIGH) = FULL (62)
22

The optimal bidding strategy corresponding to this optimal dispatch strategy is:
• In period 1, do not offer any output (or, equivalently, offer 100 MW at any price greaterthan HIGH which is $30/MWh).
• In period 2 offer all output at a price lower than LOW; i.e., at a price lower than$15/MWh.
The values corresponding to this optimal bidding strategy can be entered into the corre-sponding positions of Tables 6 and 7. These correspond to the lower two entries of the firstcolumn of each table. The remaining entries in these two tables can be obtained by the samemethodology, but this time applied to the case when the reservoir is HALF and EMPTYduring period 1. Details of this computation are not illustrated.
From equations 42 and 43 and the optimal dispatch strategy in period 1, we can now derivethe values for expected optimal cumulative profits J∗1(x1 = FULL,p1,y∗1(x1,p1))); these areshown as the last 2 entries of column 1 (corresponding to period 1) in Table 8. The remainderof column 1 can be obtained the same way.
We now calculate the expected cumulative profits from following the optimal state transi-tion and dispatch strategies. From Table 8, these values are $1500 when the period 1 state isFULL and period 1 price is LOW; and $4000 when the period 1 state is FULL and period 1price is HIGH.
As before, we can also do an expected profits calculation. Expected profits from followingthis strategy are 0.5 ·4000+0.5 ·1500 = $2750 since the probability of price being either HIGHor LOW in period 1 is 0.5.
The optimal bidding strategy for this case is to withhold output in period 1 regardlessof the period 1 price even though the generator would be better off dispatching 100 MW ifthe period 1 price is $20/MWh. This arises because of the auction rule requirement that thegenerator needs to bid a non-decreasing function.
This optimal strategy differs from the strategy in the previous example where the optimalexpected profits were $3000. The biddability requirement has resulted in not only a differentbidding strategy, but also in lower expected profits even when the optimal bidding strategy isfollowed.
The implications of this example for market design are that restrictions on biddability maysimplify market clearing but it comes at the expense of a less efficient market. Furthermore,the decisions that the bidder faces in order to optimize their profits are more complex.
4.3 Energy Limited Hydro: MW Bids Must Be Non-DecreasingFunction of Price, Uncorrelated Prices
We consider the same situation as the last example with the added condition that the pricesbetween the two periods are uncorrelated. As before, the forecasted market clearing prices havetwo price levels, LOW and HIGH, in each period (reproduced for convenience in Table 12).Period 2 price levels are independent of period 1 price levels; each price level in each periodhas equal probability of occurrence (0.5).
Given this information, what is the hydroelectric generator’s optimal bidding strategy?
23

Table 12: HIGH and LOW values of pk in $/MWh for each periodTime Period
pk 1 2HIGH 30 40LOW 20 15
To obtain the optimal dispatch and bidding strategy, we again solve the optimizationproblem in equation 1. In doing so, we fill Tables 13 to 18, starting with the last column ineach table and working our way backwards.
Following the backward DP steps from K = 2 as before, it can be verified that:
J∗2(x2,p2,y2,x3) = p2y2 (63)J∗2(x2,p2,y2) = p2y2 (64)x∗3(x2,p2,y2) = 0 (65)
Similarly:
y∗2(x2,p2) = x2 (66)x∗3(x2,p2) = 0 (67)
We now fill the last columns (corresponding to period 2) of Tables 13, 14 and 15. Thesevalues are identical to those in the previous two examples.
Next we solve equations 9, 10 and 11 for k = 1.
J∗1(x1,p1,y1,x2) = p1y1 + E [J∗2 (x2,p2,y∗2(x2,p2)) |p1] (68)J∗1(x1,p1,y1) = max
x2∈X2∩T1(x1,y1)J∗1(x1,p1,y1,x2) (69)
x∗2(x1,p1,y1) = argmaxx2∈X2∩T1(x1,y1)
J∗2(x1,p1,y1,x2) (70)
Using equations 64, 66 and 68, the fact that price transitions from period 1 to period 2 areindependent and occur with equal probability, and using the prices from Table 12, we derivethe following equation:
J∗1(x1,p1,y1,x2) = p1y1 + E [p2x2|p1] = p1y1 + (0.5)15x2 + (0.5)40x2 (71)
We now illustrate results for x1 = FULL; the other cases are done similarly. The threepossible state transitions from x1 = FULL = 100 MWh are either x2 = FULL = 100 MWhor x2 = HALF = 50 or x2 = EMPTY = 0 MWh; these dispatch values correspond to y1 = 0,y1 = 50 MW, and y1 = 100 MW respectively. Therefore, for each value of y1 there is only
24

one possible state transition. This implies that:
J∗1(x1,p1, 0) = 2750 (72)J∗1(x1,p1, 50) = 50p1 + 1375 (73)
J∗1(x1,p1, 100) = 100p1 (74)x∗2(x1,p1, 0) = FULL (75)
x∗2(x1,p1, 50) = HALF (76)x∗2(x1,p1, 100) = EMPTY (77)
To find the optimal non-decreasing bidding strategy (equation 12), we use the nestedbackward DP method of Section 4.2. The analog of Table 9 is Table 16 (corresponding tox1 = FULL) representing J∗1(FULL,p1,y1). From this table, we evaluate the probabilityweighted values M(x1,p1,y1) = prob(p1)J∗1(x1,p1,y1) for x1 = FULL; this is displayed inTable 17.
Table 18 shows the entries of V for x1 = FULL. The last column of Table 18 has thesame values as the last column of Table 17. Each entry in Table 18 is the corresponding entryin Table 17 plus the maximum value in the next column of Table 18, where the maximum istaken over all rows below and including the entry; this is needed to meet the non-decreasingbiddability requirement. The maximum values found by following equations 57, 58 are high-lighted in boldface in Table 18. The dispatch levels corresponding to the boldface entriesin Table 18 form the optimal bidding strategy that satisfies the biddability constraint.
Table 13: Optimal dispatch strategy y∗k(xk,pk) in MW implemented during period k
Time Period(xk,pk) 1 2
(EMPTY,LOW) 0 0(EMPTY,HIGH) 0 0(HALF,LOW) 0 50(HALF,HIGH) 50 50(FULL,LOW) 0 100(FULL,HIGH) 100 100
Therefore, when the generator state x1 = FULL and the price p1 = LOW, the optimaldispatch strategy is to dispatch y1 = 0 MW; when the price p1 = HIGH the optimal dispatchis y1 = 100 MW. Hence,
y∗1(FULL, LOW) = 0 MW (78)y∗1(FULL,HIGH) = 100 MW (79)
From equations 13, 75 and 77, we get the following optimal state transition strategies:
x∗2(FULL, LOW) = x∗2(FULL, LOW,y∗1(FULL, LOW)) = FULL (80)x∗2(FULL,HIGH) = x∗2(FULL, HIGH,y∗1(FULL,HIGH)) = EMPTY (81)
25

Table 14: Optimal state transition strategy x∗k+1(xk,pk), implemented at the end of period k
Time Period(xk,pk) 1 2
(EMPTY,LOW) EMPTY EMPTY(EMPTY,HIGH) EMPTY EMPTY(HALF,LOW) HALF EMPTY(HALF,HIGH) EMPTY EMPTY(FULL,LOW) FULL EMPTY(FULL,HIGH) EMPTY EMPTY
Table 15: Values of J∗k(xk,pk,y∗k(xk,pk)) in $Time Period
(xk,pk) 1 2(EMPTY,LOW) 0 0(EMPTY,HIGH) 0 0(HALF,LOW) 0 750(HALF,HIGH) 1500 2000(FULL,LOW) 2700 1500(FULL,HIGH) 3000 4000
Table 16: Values of J∗1(x1,p1,y1) in $ for x1 = FULLp1
y1 in MW LOW ($20/MWh) HIGH ($30/MWh)0 2750 275050 2375 2875100 2000 3000
Table 17: Values of M = prob(p1)J∗1(x1,p1,y1) in $ for x1 = FULL. The probability thatp1 = LOW is 0.5; the probability that p1 = HIGH is 0.5
p1
y1 in MW LOW ($20/MWh) HIGH ($30/MWh)0 1375 137550 1187.5 1437.5100 1000 1500
26

Table 18: Values of V in $ (from equations 55 to 58)p1
y1 in MW LOW HIGH0 2875 137550 2687.5 1437.5100 2500 1500
This fills the entries in Tables 13 and 14 for period 1 corresponding to the (FULL, LOW) and(FULL, HIGH) cases. Other entries can be similarly filled.
From equations 72 and 74 and the optimal dispatch strategy in period 1, we can nowderive the values for expected optimal cumulative profits J∗1(x1 = FULL,p1,y∗1(x1,p1)));these are shown as the last two entries of column 1 (corresponding to period 1) in Table 15.The remainder of column 1 can be obtained the same way (but it is, strictly speaking, notnecessary in this examples since only the FULL case is being considered in period k = 1).
The optimal bidding strategy is therefore:
• In period 1, offer 100 MW at any price greater than LOW and lower than HIGH; i.e.,offer 100 MW at a price greater than $20/MWh and lower than $30/MWh.
• In period 2 offer all remaining output (depending on what output got selected in period1) at a price lower than LOW; i.e., at a price lower than $15/MWh.
The lack of price correlation results in a different dispatch and bidding strategy from theprevious two cases. It also results in a different expected value of profits, which for thisexample, is 0.5 · 2700 + 0.5 · 3000 = $2850. This value is higher than the value obtained whenperfect correlation is assumed ($2750), but lower than the value when correlation is assumedand there are no restrictions on bidding strategy ($3000).
The market design implications of the examples so far are that rules make a difference inobtaining the optimal bidding strategy. A change in the bidding rules changes the optimal bids,as illustrated in the previous example. However, assumptions about price forecast uncertaintyalso make a difference, as illustrated in this example, even if the rules remain the same.
4.4 Thermal Generator with One Reserve Market: Sequential Mar-ket Clearing, Forecast Uncertainty, Non-Decreasing BidFunction
We now assume a single-period case and two markets, one for energy and one for reserves.Suppose that a price-taking generator has a capacity of 100 MW, with a minimum power of0 MW, constant incremental costs of $30/MWh and no other costs, and can offer reserves upto 40 MW. Suppose that there are no direct costs for making reserves available4. Supposethat the market design is such that the energy market clears first. Then, the reserve bids areaccepted and the reserve market clears. All markets have uniform clearing prices. In each
4We make the simplifying assumption that the reserves are not called; hence, the generator only gets thereserve availability price.
27

market, it is required that the generator bid quantity be a non-decreasing function of bidprice.
Suppose that the generator forecasts that the energy price will be either $35/MWh or$40/MWh, with equal probability. The reserve price is dependent on energy price as follows:if energy price is $40/MWh, then the reserve availability price is also $12/MW/h; if energyprice is $35/MWh, then the reserve availability price is $4/MW/h. For notational convenience,we refer to the low prices in each market to be the LOW price and the high price in eachmarket to be the HIGH price; for example the LOW price in the energy market is $35/MW,while the LOW price in the reserve market is $4/MW/h.
What is the generator’s optimal bidding strategy in the energy and reserve markets if theobjective is to maximize expected profits?
There are two auction rounds; i.e., K = 2. Let k = 1 refer to the energy market auctionand k = 2 refer to the reserve market auction. We define the state xk as follows: x1 refersto the capacity left in the energy market and x2 to be the generation capacity left in thereserve market. The term x3 refers to the generation capacity left after the energy and reservemarkets are cleared. The term y1 refers to the energy dispatch and y2 refers to the reserveavailability dispatch. Similarly p1 and p2 represent the energy price and reserve availabilityprice respectively.
We use the DP formulation of Section 3.
maxyk=yk(xk,pk)
E
[2∑
k=1
pkyk − 30y1
](82)
subject toxk+1 = xk − yk (83)
y1 ≤ min(100,x1) (84)y2 ≤ min(40,x2) (85)
x1 = 100 (86)yk is a non-decreasing function of price pk, k = 1, 2 (87)
We now solve this problem using the methods described in Section 3. In DP terminology(given in the appendix), we associate the notion of “market” with the notion of “stage.” Asis normal procedure in the solution of DP problems, we work backwards from the final stage(the reserve market) to the first stage (the energy market), we fill the columns in reverse orderfrom right to left in the Tables below.
Starting with the final stage (the reserve market):
J∗2(x2,p2,y2,x3) = p2y2 (88)J∗2(x2,p2,y2) = p2y2 (89)x∗3(x2,p2,y2) = x2 − y2 (90)
If x2 is the capacity left in this market, it is optimal to sell all this possible output (up tothe 40 MW limit) into the reserve market at any price. Therefore,
y∗2(x2,p2) = min(x2, 40) ∀ p2 ≥ 0 (91)x∗3(x2,p2) = x2 −min(x2, 40) (92)
28

We assume that p2 ≥ 0.Working backwards to the energy market (k = 1), there is x1 capacity left. The next
(backward) step of the DP is to solve the following:
J∗1(x1,p1,y1,x2) = (p1 − 30)y1 + E [J∗2 (x2,p2,y∗2(x2,p2)) |p1] (93)J∗1(x1,p1,y1) = max
x2∈X2∩T1(x1,y1)J∗1(x1,p1,y1,x2) (94)
x∗2(x1,p1,y1) = argmaxx2∈X2∩T1(x1,y1)
J∗2(x1,p1,y1,x2) (95)
p2 and p1 are perfectly correlated in this example, so when the energy price p1 is HIGH(LOW), the reserve price p2 is also HIGH (LOW).
We now want to find a function y∗1(x1,p1) that is a non-decreasing function of price p1 thatmaximizes E [J∗1(x1,p1,y1)] where the expectation E is over p1. We did a similar optimizationin Section 4.2 (e.g., see Tables 9, 10 and 11). We use the same optimization approach hereusing discrete values: y1 = 0, 20, 40, 60, 80, 100 MW. The results are in Tables 19, 20 and 21.
Table 19: Values of J∗1(x1,p1,y1) in $ for x1 = 100 MWp1
y1 in MW LOW ($35/MWh) HIGH ($40/MWh)0 160 48020 260 68040 360 88060 460 108080 480 1040100 500 1000
Table 20: Values of M = prob(p1)J∗1(x1,p1,y1) in $ for x1 = 100 MW. The probability thatp1 = LOW is 0.5; the probability that p1 = HIGH is 0.5
p1
y1 in MW LOW ($35/MWh) HIGH ($40/MWh)0 80 24020 130 34040 180 44060 230 54080 240 520100 250 500
Table 21 shows that E [J∗1(x1,p1,y1)] is maximized when y1 is 60 MW, regardless ofwhether the energy price is LOW or HIGH. Therefore,
y∗1(100,p1) = 60 (96)x∗2(100,p1) = 100− 60 = 40 (97)
29

Table 21: Values of V in $p1
y1 in MW LOW ($35/MWh) HIGH ($40/MWh)0 620 24020 670 34040 720 44060 770 54080 760 520100 750 500
Based on this solution, the optimal strategy is as follows:
1. (Energy market) Bid 60 MW into the energy market at a price lower than the LOWenergy price of $35/MWh (say, at the incremental cost of $30/MWh);
2. (Reserve market) Bid the remaining 40 MW into the reserve market at a price lowerthan the LOW reserve price of $4/MW/h.
4.5 Thermal Generator with One Reserve Market: Sequential Mar-ket Clearing, Forecast Uncertainty, Non-Decreasing BidFunction
We use the same assumptions as Example 4.4, except that the energy and reserve prices areuncorrelated, and the reserve price has equal probability of being HIGH or LOW. Tables 22, 23and 24 give the results of the optimization.
Table 22: Values of J∗1(x1,p1,y1) in $ for x1 = 100 MWp1
y1 in MW LOW ($35/MWh) HIGH ($40/MWh)0 320 32020 420 52040 520 72060 620 92080 560 960100 500 1000
Table 24 shows that E(J∗1(x1 = 100,p1,y1) is maximized by y1 = 60 MW when the energyprice is LOW; and by y1 = 100 MW when the energy price HIGH. Therefore,
y∗1(100,p1 = HIGH) = 100 (98)y∗1(100,p1 = LOW) = 60 (99)x∗2(100,p1 = HIGH) = 100− 100 = 0 (100)x∗2(100,p1 = LOW) = 100− 60 = 40 (101)
30

Table 23: Values of M = prob(p1)J∗1(x1,p1,y1) in $ for x1 = 100 MW. The probability thatp1 = LOW is 0.5; the probability that p1 = HIGH is 0.5
p1
y1 in MW LOW ($35/MWh) HIGH ($40/MWh)0 160 16020 210 26040 260 36060 310 46080 280 480100 250 500
Table 24: Values of V in $p1
y1 in MW LOW ($35/MWh) HIGH ($40/MWh)0 660 16020 710 26040 760 36060 810 46080 780 480100 750 500
Based on this solution, the optimal strategy is as follows:
1. (Energy Market) Bid two stairs. In the first stair, 60 MW is bid into the energy marketat a price lower than the LOW energy price of $35/MW (say, at the incremental cost of$30/MW). In the second stair, bid 40 MW into the market at a price that is higher thanthe first stair price, and lower than the HIGH energy price of $40/MW. For example,in the first stair, bid 60 MW at $30/MW, and bid an additional 40 MW at $38/MW inthe second stair.
2. (Reserve Market) Bid whatever is not accepted in the energy market (up to 40 MW) ata price that is lower than the LOW reserve availability price of $4/MW/h to ensure itsacceptance.
31

5 Observations and Applications
Based on our analyses and examples, we conclude that it is critically important to carefullyrepresent costs, cost predictions, operational restrictions and other such considerations whenanalyzing bidding behavior. Our analyses also helps explain recent market failures.
1. Our DP optimization can be applied to practical problems of interest. For example,in the California PX (and California ISO) day-ahead market, first the energy marketwould clear for each of the 24 hours for the next day and then the regulation reservemarket would clear for each of the 24 hours, followed by spinning reserves, supplementalreserves, and finally backup reserves. This auction structure can be set up as a DPproblem. There are a total of 24 · 5 = 120 auctions. The DP problem can be solved bystarting from the final time period (T = 24). Within this time period, we start fromthe final clearing market (backup reserves), and work backwards to the energy market(see Sections 4.4 and 4.5). This gives us the optimal bidding strategy as a function ofstate for the final time period for each of the 5 markets. We now work backwards fromthe final time period one time period at a time. Within each time period, we worksequentially backwards from the backup reserve market to the energy market. Carryingout this procedure we get the optimal bidding strategy as a function of state and pricefor each time period for each of the 5 markets.
2. The optimal bidding strategy is a function of generator state and anticipated price.This is essential to avoid physical operational inconsistencies. For example, supposethat a generator has two states, ON and OFF, and that the generator is constrainedto be ON for at least two periods. Let there be two time periods. Suppose that theoptimal bidding strategy is that, (for both time periods) when in the ON state, theoptimal bid is $35/MWh for its output; of course, in the OFF state the generator makesno bid. If the auction rules are such that the generator is forced to make a bid that isindependent of generator state, then it is possible that the bids could lead to inconsistentphysical operation conditions. For example, suppose the generator offers positive MWin both time periods and the generator has to be ON for at least two periods. If thisbid is accepted in period 1 and rejected in period 2, then we have a physical operationalinconsistency.
3. When the auction structure mandates that the generator offer bids that are independentof generator state, then the optimal bidding strategy can be found as follows. First, thegenerator state dependent optimal bidding strategy (i.e., the optimal dispatch y∗k(xk,pk)as well as optimal state transition x∗k+1(xk,pk), is found using the methods in thisreport). Based on the price distribution probability and the state transition strategy,we can find the probability prob(xk, k) of being in state xk in auction round k. Then,we can find the optimal bidding strategy y∗k(pk) that is independent of state by solvingthe following least-squares problem:
argmaxcy∗k(pk)
E[(
y∗k(xk,pk)prob(xk, k)− y∗k(pk))2
]for 1 ≤ k ≤ K (102)
32

The solution to this problem may be found by using DP methods. This does not guaran-tee that the bidding strategy is physically consistent, but it does ensure that the optimalbidding strategy is as close as possible to the optimal5.
4. The mathematics presented here assumes a one-part bid, where MWs are bid as a func-tion of price. In markets such as the Pennsylvania-Maryland-Jersey and New Yorksystems, three-part bids are allowed for day-ahead markets. Three-part bids includestart-up/shut-down costs, no-load costs, as well as MW versus price bids (in additionto all the physical operational constraints). While the mathematics in this report areapplicable to three-part bids, if a price-taker costs of operation match the three-partbid structure, a profit-maximizing price-taker simply bids true costs and operationalconstraints; the DP formulation in our report is not necessary in such cases. Never-theless, when there are additional costs and constraints that are not directly biddable,the methods described in this report can be applied to find optimal bidding strategies.One particular case where it becomes difficult for a price-taker to fit into the structureof a multi-part bid is the case of hydroelectric generators that have storage capability.Another case is the situation of generators that have operational constraints that extendbeyond the time-frame covered by the auction.
5In practice, physically inconsistent bids are resolved by buying/selling from an electricity pool in real timeto make up for deficits/surpluses.
33

6 Generator is Not a Price-Taker
In this section, we relax the assumption that the generator is a price-taker. When con-sidering the potential impact of a bid on the price, one alternative is to try to take intoconsideration the bids of all generators in the market. This can be a complex and dauntingtask. We model instead the effect of the generator’s output on price using the notion of resid-ual demand curve (Samuelson and Nordhaus 1998), which is the market demand minus theoutput of the other generators.
It is easier to measure the residual demand curve facing a market participant than tosimulate the bidding behavior of all the other generators in the market. This is because theuse of a residual demand curve decouples the problem. The impact of all other generators(and even the effect of loads) can be aggregated into a single curve. Then, and in a separatestep, this residual demand curve is used in the bid analysis.
When a generator bids against a residual demand curve, the mathematics in Section 3remain unchanged; the only difference is that price is now a function of the output of thegenerator (rather than being independent of the output), and this must be accounted for.
The following example illustrates the basic approach. It also shows one way to modeluncertain residual demand curves.
6.1 Thermal Generator with Market Power Under Some PriceRegimes, Single Energy Market, Forecast Uncertainty,Non-Decreasing Bid Function
We assume a single-period case. A thermal generator has constant incremental costs of$25/MWh, maximum capacity of 100 MW and minimum output of zero MW. The gener-ator has no start-up/shut-down costs or operational constraints. A uniform price auction isassumed.
The generator expects that the price “regime” in the period will be either LOW or HIGHwith equal probability. If the LOW price regime happens, the generator has no market power(i.e., it expects a horizontal residual demand curve) and it expects the price will be $30/MWh.
On the other hand, if the price regime is HIGH, the generator estimates that it has thepotential to exercise market power. It estimates that the market price as a function of itsoutput can be expressed as in Table 25.
Table 25: Price as a function of generator output corresponding to the HIGH price regime(for the LOW price regime the price is simply $30.)
Output y1 (in MW) 0 25 50 75 100Price p1 (in $/MWh) 50 45 43 41 35
What should be the optimal generator bidding strategy if the generator can only bid non-decreasing costs in the auction? Since there is only one state, we suppress the dependence of
34
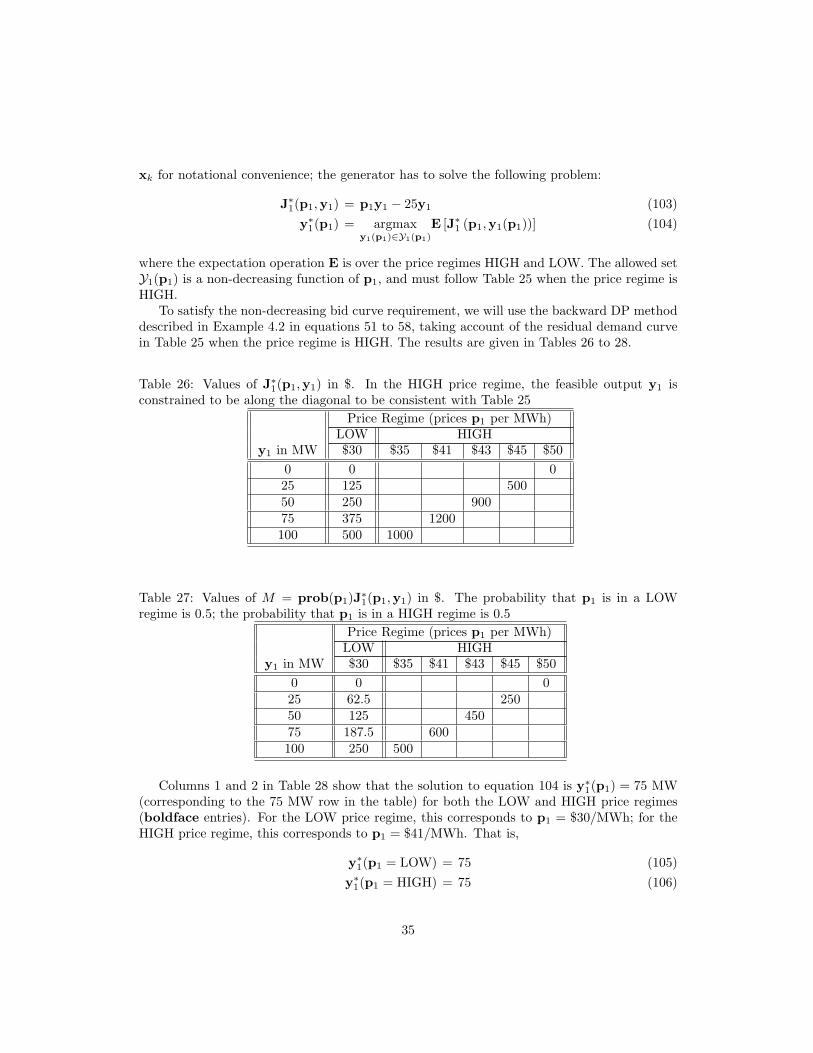
xk for notational convenience; the generator has to solve the following problem:
J∗1(p1,y1) = p1y1 − 25y1 (103)y∗1(p1) = argmax
y1(p1)∈Y1(p1)
E [J∗1 (p1,y1(p1))] (104)
where the expectation operation E is over the price regimes HIGH and LOW. The allowed setY1(p1) is a non-decreasing function of p1, and must follow Table 25 when the price regime isHIGH.
To satisfy the non-decreasing bid curve requirement, we will use the backward DP methoddescribed in Example 4.2 in equations 51 to 58, taking account of the residual demand curvein Table 25 when the price regime is HIGH. The results are given in Tables 26 to 28.
Table 26: Values of J∗1(p1,y1) in $. In the HIGH price regime, the feasible output y1 isconstrained to be along the diagonal to be consistent with Table 25
Price Regime (prices p1 per MWh)LOW HIGH
y1 in MW $30 $35 $41 $43 $45 $500 0 025 125 50050 250 90075 375 1200100 500 1000
Table 27: Values of M = prob(p1)J∗1(p1,y1) in $. The probability that p1 is in a LOWregime is 0.5; the probability that p1 is in a HIGH regime is 0.5
Price Regime (prices p1 per MWh)LOW HIGH
y1 in MW $30 $35 $41 $43 $45 $500 0 025 62.5 25050 125 45075 187.5 600100 250 500
Columns 1 and 2 in Table 28 show that the solution to equation 104 is y∗1(p1) = 75 MW(corresponding to the 75 MW row in the table) for both the LOW and HIGH price regimes(boldface entries). For the LOW price regime, this corresponds to p1 = $30/MWh; for theHIGH price regime, this corresponds to p1 = $41/MWh. That is,
y∗1(p1 = LOW) = 75 (105)y∗1(p1 = HIGH) = 75 (106)
35

Table 28: Values of V in $ (see equations 55 to 58)Price Regime (prices p1 per MWh)
LOW HIGHy1 in MW $30 $35 $41 $43 $45 $50
0 600 025 662.5 25050 725 45075 787.5 600100 750 500
Since the generator is a price-taker in the LOW price regime, but a potential price setterin the HIGH price regime, the optimal bidding strategy is as to bid two stairs. In the firststair, (75−∆) MW is bid into the energy market at a price lower than the LOW energy priceof $35/MWh (perhaps at the incremental cost of $25/MWh), where ∆ is sufficiently smallMW quantity. In the second stair, ∆ MW is bid into the market at a price of $41/MWh. Forsufficiently small ∆, this is the optimal strategy with expected profits approaching $787.50(= E(J∗1(p1,y∗1(p1)) = 0.5 · J∗1(LOW, 75) + 0.5 · J∗1(HIGH, 75) = 0.5 · 375 + 0.5 · 1200 fromthe entries corresponding to the 75 MW row in Table 26). However, the effect of the biddingstrategy is that when the price regime is LOW, the generator only produces 75 MW; withperfect hindsight of the LOW price regime, the generator could have produced 100 MW andincreased its profits.
6.2 Thermal Generator with Market Power Under All Price Regimes,Single Energy Market, Forecast Uncertainty, Non-DecreasingBid Function
Now we consider the same problem as in Section 6.1, with the exception that the price regimesare different. As before, the generator expects that the price “regime” in the period will beeither LOW or HIGH with equal probability. But the generator forecasts that it has thepotential to exercise market power in both regimes.
If the LOW price regime happens, it estimates that the market price (as a function of itsoutput) is expressed in Table 29. On the other hand, if the price regime is HIGH, the generatorestimates that the market price (as a function of its output) is expressed in Table 30.
Table 29: Price as a function of generator output corresponding to the LOW price regimeOutput y1 (in MW) 0 25 50 75 100Price p1 (in $/MWh) 48 42 39 33 26
What should be the optimal generator bidding strategy if it can only bid non-decreasingcosts in the auction, which is assumed to be uniform-price?
36

Table 30: Price as a function of generator output corresponding to the HIGH price regimeOutput y1 (in MW) 0 25 50 75 100Price p1 (in $/MWh) 100 77 43 41 35
As before, we get
J∗1(p1,y1) = p1y1 − 25y1 (107)y∗1(p1) = argmax
y1(p1)∈Y1(p1)
E [J∗1 (p1,y1(p1))] (108)
where the expectation operation E is over the price regimes HIGH and LOW. Again, theallowed set Y1(p1) is a non-decreasing function of p1 and must follow Tables 29 and 30 whenthe price regime is LOW and HIGH respectively.
To satisfy the non-decreasing bid curve requirement, we will use the backward DP methoddescribed in Example 4.2 in equations 51 to 58, taking account of the residual demand curvesin Tables 29 and 30. Tables 28 are Tables 31 to 33 give the results.
Table 31: Values of J∗1(p1,y1) in $. Note that the HIGH and LOW price regimes are inter-spersed; we use italics to display entries corresponding to the LOW price regime
Price Regime (prices p1 per MWh)LOW and HIGH
y1 in MW $26 $33 $35 $39 $41 $42 $43 $48 $77 $1000 0 025 425 130050 700 90075 600 1200100 100 1000
Table 32: Values of M = prob(p1)J∗1(p1,y1) in $. The probability that p1 is in a LOWregime is 0.5; the probability that p1 is in a HIGH regime is 0.5. The HIGH and LOW priceregimes are interspersed; we use italics to display entries corresponding to the LOW priceregime.
Price Regime (prices p1 per MWh)LOW and HIGH
y1 in MW $26 $33 $35 $39 $41 $42 $43 $48 $77 $1000 0 025 212.5 65050 350 45075 300 600100 50 500
37

Table 33: Values of V in $ (see equations 55 to 58). The HIGH and LOW price regimesare interspersed; since in both regimes the feasible output y1 is constrained to be along thediagonal, we only need to pick one argmax value per regime in equations 57 and 58
Price Regime (prices p1 per MWh)LOW and HIGH
y1 in MW $26 $33 $35 $39 $41 $42 $43 $48 $77 $1000 650 025 862.5 65050 950 45075 900 600100 550 500
Columns 1 and 2 of Table 33 show that the solution to equation 108 is y∗1(p1 = LOW) = 50MW for the LOW price regime, and y∗1(p1 = HIGH) = 75 MW for the HIGH price regime.For the LOW price regime, this corresponds to p1 = $39/MWh; for the HIGH price regime,this corresponds to p1 = $41/MWh. That is,
y∗1(p1 = LOW) = 50 (109)y∗1(p1 = HIGH) = 75 (110)
Since the generator is a price-setter in both the HIGH and LOW price regimes, the optimalbidding strategy is to bid two stairs. In the first stair, 50 MW is bid into the energy marketat the LOW energy price of $39/MW. In the second stair, 25 MW is bid into the marketat a price of $41/MW. This is the optimal strategy with expected profits equal to $950(= E(J∗1(p1,y∗1(p1)) = 0.5 ·J∗1(LOW, 50) + 0.5 ·J∗1(HIGH, 75) = 0.5 · 700 + 0.5 · 1200 from theentries corresponding to the 50 MW and 75 MW rows in Table 31).
Not having perfect foresight of the price regime is costly for the generator. If the generatorknows with perfect foresight that the price regime will be HIGH, the generator will maximizeprofits by only bidding and producing 25 MW.
6.3 Observations
From an analysis of the cases when the market participant is not a price-taker, we make thefollowing observations:
1. The objective function for profit-maximization must include the profits due to all themarket participant’s physical positions as well as pure financial positions. This is becausethe market participant can manipulate the spot market to increase profits from financialpositions6.
2. In general, it makes more sense to model the residual demand curve as one that faces amarket participant’s NG generators rather than an individual generator. In such a case,
6The converse is not true: if the market participant does not have any control of physical assets in the spotmarket, then the market participant is a price-taker and cannot affect prices.
38

the residual demand curve is a function of the aggregate output produced (or withheld)by the market participant’s NG generators. The general way to solve this problem is by“relaxing” the aggregate output constraint using Lagrangian relaxation techniques (i.e.,introducing a penalty factor) and then decomposing the problem into NG subproblems;each of the NG subproblems can be solved using methods similar to Example 6.1. Thepenalty factor can then be varied to ensure that the aggregate constraint is met; if not,then the primal-dual Lagrangian steps can be repeated. However, it may be possible todo better.
(a) All other things being equal, a market participant would recognize that withholdingY MW from slightly “in-the-money” generator whose incremental costs are close tothe market price is less expensive (in exercising market power) than withholding thesame Y MW from generators with cheaper incremental costs. This implies that asmaller set of generators in the market participant’s fleet can be modeled as havingan influence on price; for example, it would typically not be profit-maximizing towithhold output from a baseload power plant such as a nuclear plant.
(b) As a reasonable approximation, it may be possible to construct a residual demandcurve for each individual generator; this curve would typically be more elastic thecheaper the generator’s incremental costs. We recommend this approach for mostproblems.
(c) In certain cases, the structure of the generation cost curves and operational con-straints may admit analytical solutions to the optimization problems. For thesecases, the optimal strategy could be represented as analytical formulas.
3. Transmission congestion could complicate the analysis, especially if the market par-ticipant has generators on both sides of a transmission constraint and therefore couldinfluence both the occurrence of the constraint as well as the price of the constraint. Insuch a case, modeling prices (or residual demand curves) as exogenous is still the “best”way to solve the problem. Prices are natural candidates for relaxation:
(a) They allow separability of multi-generator optimization problems into decoupledsingle generator optimization problems.
(b) They (unlike competitors’ behavior) are directly observable.
4. To account properly for transmission congestion, we must model locational prices thatare consistent with the structure of the transmission congestion and the transmissionnetwork. Even in a large network, this can be done by modeling the behavior of relativelyfew price variables (Rajaraman and Alvarado 1998). For example, consider two nodes(West and East) with a single link connecting them. Assume that a market participanthas a generator at each node. Generally, the pattern of transmission congestion isWest to East; the prices at the West node are typically lower than that at the Eastnode. Then, under the right circumstances, it is possible for the market participantto profitably cause transmission congestion in the link by overproducing (at a loss) atWest and recovering this loss by other financial positions, e.g., holding a transmissioncongestion contract between West and East (Joskow and Tirole 2000). One could thenmodel two price regimes: an UNCONGESTED regime, and a CONGESTED regime,
39

each having a certain probability of occurrence. In the UNCONGESTED regime, theprices at West and East are perfectly correlated (and differ only due to losses). In thisregime, if the market participant does not have market power, then one would chooseprices as exogenous inputs; if the market participant potentially has market power, thenone would choose (as a reasonable approximation) residual demand curves (each for Westand East) as exogenous inputs. In the CONGESTED regime, the congestion price ofthe link between West and East could be affected by the bidding behavior of the marketparticipant; one could then model residual demand curves at both West and East facingthe market participant at both nodes. The problem is now separable into independentproblems for West and East; it can then be solved by constructing the equivalent ofTables 26 to 28 for both West and East.
5. There will be practical constraints on the market participant’s bidding strategy. Forexample, the generator bids may not be allowed to change too frequently. As anotherexample, regulatory penalties and legal hurdles may be sufficient disincentive to exercisemarket power.
6. In Example 6.1, we modeled different price regimes. For multiple periods, price regimescould be modeled as a Markov chain; e.g., if the price regime is HIGH in one period, thenthere is a certain probability that it will continue to be HIGH (or LOW, CONGESTED,etc.) in the next period.
7. The problem of maximizing profits when the market participant has the potential toexercise market power is a highly complex problem, and there may be a temptation torepresent this complexity by modeling all the “bells and whistles” in the optimization.Our opinion is that it is much more important to properly model all the parameters of thebidder properly, but to otherwise simplify the optimization. For example, we recommendthe decoupling of the problem by the use of a residual demand curve. Because thereis considerable uncertainty about data, it is better to encapsulate this uncertainty intothe more easily observed price uncertainty that to attempt a concurrent detailed modelof all generators at once. In order to accomplish this, the market participant can beginby assuming that he/she is a price-taker, and later introduce residual demand curves;the expected profits can be plotted as a function of the demand elasticities by solvingproblems similar to Examples 6.1 and 6.2. It is then a matter of using empirical studiesto find out the actual elasticity of the residual demand curve that is facing the marketparticipant7.
7These residual demand curves depend not only on the cost but also the possible bidding behavior of othersuppliers, demand response, contingencies and outages, and other effects.
40

7 Computational Issues
In the DP formulation in this report, we optimized expected profits. The rationale behindthis is that electricity markets clear repeatedly every day/hour. If these time periods arehomogeneous (i.e., the profit distribution is the same across such periods), then in such casesmaximizing expected profits makes sense because the law of large numbers will ensure that oversufficiently long time periods, profits will be maximized; indeed, adding a risk premium termto the profit term only leaves “money on the table” over long periods. However, electricityprices show tremendous variation. While there may be many “typical spring days” in a year,a peak summer period may occur only once or twice. In such cases, it may be necessaryto add a risk premium term to penalize for possible losses during these conditions. Onepossibility would be to penalize financial losses in a period by using a penalty multiplier;this formulation preserves the problem structure and has the added flexibility of penalizingdifferent types of losses differently8. Another possibility is to modify the exogenous pricesand/or their probabilities of occurrence to make the price forecast more “pessimistic”.
Another consideration is the size of the problem, particularly, the number of auction roundsand/or time periods. For generators such as hydroelectric generators that have significant stor-age capacity, the operational cycle time-frame could exceed a year. In such a case, solving thebidding problem for each hour over the whole year could become computationally intractable.Such problems can be handled using nested optimizations; e.g., the yearly problem is decom-posed into a problem with twelve time periods and solved, with each time period representingone month, then the monthly problem for the first time period is decomposed into (say) weeklytime periods and solved, and so on. Thus, the sequential optimizations allocate water first bymonth, and then by week, etc.
We have not discussed how to deduce the exogenous prices or residual demand curves thatare needed as inputs in the optimization problem. While estimating these exogenous pricesis not a trivial problem, good near-term price forecasts (day-ahead or weekly) can generallybe obtained with modest effort.9 A full discussion is beyond the scope of this report; onepossibility is to use historical data and construct near-term price forecasts based on systemloads, transmission outages, and other known generator outages.
8For example, losses due to no-load costs in a period may be treated differently from start-up/shut-downcosts incurred in that period.
9It is far more difficult to obtain longer term forecasts; moreover, the quality of the long-term forecasts willtend to be poorer.
41

8 Conclusions
This report has presented the mathematics for finding the multi-period optimal biddingstrategy for a generator in electricity markets under exogenous uncertain energy and reserveprices. Our treatment covers thermal, hydroelectric as well as energy-limited generators. Wehave demonstrated how operational constraints can interact with market design rules, priceuncertainty, and non-convexity of costs to affect “allowed” bidding strategies; we feel that thisis a neglected feature in work on bidding strategies. We have shown that even if a generatorhas convex costs, the effect of price uncertainty may be such that the optimal bidding strategy— if there were no restrictions on the bidding function — is to bid a declining bid curve ofMW versus price. However, since electricity market auctions typically disallow such biddingbehavior (usually the MWs offered must be a non-decreasing function of the bid price), wemust change the bidding strategy to satisfy this constraint. We have shown that this optimalbidding strategy problem can be examined by solving multiple-level nested backward DPproblems. Moreover, the data needs to find optimal generator bidding strategies are modestand attainable; in particular, the generator does not need to have detailed information aboutcompetitors’ generators. Only price forecasts and detailed information about one’s own costsand operational characteristics are sufficient. The price forecasts may incorporate correlationand uncertainty.
We have also shown how the formulation can be used to find profit-maximizing biddingstrategies for generators that have the potential to exercise market power; for this problem,we use a residual demand curve instead of price as an exogenous input.
Knowledge of optimal bidding strategies under both the price-taking as well as price-influencing conditions is useful to generators because they can improve profits using thesestrategies. On the other hand, it is also useful to a regulator who is testing for the exercise ofmarket power by a generator; knowing the optimal bidding strategy, a regulator can comparethe actual generator bids with its optimal price-taking bidding strategy to judge whethera generator behaved anti-competitively. Thus, our approach has important implications formarket monitoring and market power determination decisions.
The examples in this report show that, in some sense, there is a tradeoff between marketsimplicity (evidenced, for example, by allowing only one-part non-declining bids) which canlead to less efficient outcomes, and complexity (for example, allowing multi-part and possiblydeclining cost bids with possible inter-period restrictions) which can lead to more efficient out-comes. However, a potentially more efficient design that offers greater complexity is likely tonegate some of the gains in design due to inefficiencies associated with complexity. The reporthas suggested that it is important to permit market participants to become self-schedulersin cases where their cost structure and operational constraints do not readily fit the marketdesign.
42

References
B. F. Hobbs et al. (ed.), 2001, Next Generation of Electric Power Unit CommitmentModels . International Series in Operations Research and Management Science (KluwerAcademic Publishers,Boston).
Bertsekas, D.P., G. S. Lauer, N. R. Sandell Jr., and T. A. Posbergh, 1983, Optimal short-termscheduling of large scale power systems, IEEE Transactions on Automatic Control 28, 1–11.
Bertsekas, Dimitri P., 1987, Dynamic Programming (Prentice Hall).
Gross, G., and D. J. Finlay, 1996, Optimal bidding strategies in competitive electricity mar-kets, in Proceedings of the 12th Power Systems Computations Conference. pages 815—812.
Guan, Xiaohong, Erman Ni, Peter B. Luh, and Yu-Chi Ho, 2001, Optimization-based biddingstrategies for deregulated electric power markets, in Next Generation of Electric PowerUnit Commitment Models . International Series in Operations Research and ManagementScience (Kluwer Academic Publishers,Boston).
Harvey, Scott M., and William W. Hogan, 2001, Identifying the exercise of market powerin california, Discussion paper Harvard University Internet site ksghome.harvard.edu/~whogan.cbg.Ksg/.
Joskow, Paul L., and J. Tirole, 2000, Transmission rights and market power in electric powernetworks, RAND Journal of Economics 31, 450–487.
Kelman, R., and M. Pereira, 1998, Application of economic theory in power system analysis:Strategic pricing in hydrothermal systems, in SEPOPE Proceedings, Brazil. Tutorial Course.
Li, C.A., R.B. Johnson, and A.J. Svoboda, 1997, A new unit commitment method, IEEETransactions on Power Systems 12.
Merlin, A., and P. Sandrin, 1983, A new method for unit commitment at electricite de france,IEEE Transactions on Power Apparatus and Systems PAS-102 (5).
Pereira, Mario Veiga F., Luiz Augusto N. Barroso, and Rafael Kelman, 2002, Market powerissues in bid-based hydrothermal dispatch, Annals of Operations Research 117, 247–270Also available from internet site www.psr-inc.com/.
Rajaraman, Rajesh, and Fernando L. Alvarado, 1998, Managing transmission risk: The theoryof spatial hedging and arbitrage, Discussion Paper 98-27 PSERC Report.
, 2002a, (Dis)proving market power, Discussion paper Laurits R. Christensen Asso-ciates Internet site www.lrca.com and www.ksg.harvard.edu/hepg/.
, 2002b, Testing for market power in hydro-dominant regions, in Proceedings of VIIISEPOPE. Paper SP–002.
Rajaraman, R., L.D. Kirsch, F.L. Alvarado, and C. Clark, 2001, Optimal self-commitmentunder uncertain energy and reserve prices, in B. F. Hobbs et al., ed.: Next Generation ofElectric Power Unit Commitment Models . International Series in Operations Research andManagement Science (Kluwer Academic Publishers,Boston).
43

Samuelson, P. A., and William D. Nordhaus, 1998, Economics (McGraw-Hill) 13 edn. Chapter24.
Tseng, C L., S.S. Oren, A J. Svoboda, and R.B. Johnson, 1997, A unit decommitment methodin power system scheduling, Electrical Power and Energy Systems 19.
Wood, Allen J., and Bruce F. Wollenberg, 1996, Power Generation Operation & Control(Wiley) 2 edn.
44

Appendix: An Overview of Dynamic Programming
This appendix discusses in slightly more general terms the issues associated with the im-plementation of Dynamic Programming (DP) and its application to the problems describedin this report. It starts with a description of a deterministic DP case, followed by the consid-eration of uncertainty, and then with a description of nested DP problems.
We assume that the reader has at least a basic familiarity with the DP problem. An excel-lent treatment of the DP problem is given in the graduate-level textbook by Bertsekas (Bert-sekas 1987).
The examples in this appendix are larger than those in the body of the report and theyare intended to illustrate DP issues, not bidding concepts in the context of this report. Thus,in most of the examples randomly generated numbers are used. For the sake of expositorysimplicity, in this appendix we do not concern ourselves directly with issues of optimal dispatchy∗k. It is sufficient for us to determine the optimal state transition x∗k+1.
Deterministic DP
Problems in DP correspond to optimization problems over a sequence of stages. Each stageoften (but not always) corresponds to a time frame. In a DP, the optimization is done sequen-tially in stages.
For all deterministic DP problems, assume that there is a set of K stages. Examples ofstages include (a) time periods, (b) rounds in an auction, or (c) price level.
At each stage k (k ∈ {1 . . . K}) of the optimization, the system can be in any of N discretestates Xk; that is, xk ∈ X . We formulate the DP problem as a profit maximization problem.For simplicity, we assume that costs Ck(xk) = 0 for all states xk for all stages k. The revenuesRk(xk) associated with operating state xk is known and given by Rk(xk). These values canbe arranged as a matrix R of dimension N by K.
We also define the state transition matrix ck(xk,xk+1). For simplicity, we let the transitioncosts be independent of the stage; i.e., c(xk,xk+1) ≡ ck(xk,xk+1). The transition costs maybe represented by a transition cost matrix c with dimension N by N .
Depending on the specific problem at hand, the states can represent (a) amount of energyin a hydro reservoir, (b) for a thermal unit total emissions constraints, the energy associatedwith the remaining allowable emissions, (c) the level of readiness of a thermal unit, includingpossibly the amount of energy or reserves, (d) a price level from among a set of possibleprice levels, (e) an amount of power bid into an auction, or (f) some Cartesian product orcombination of one or more of the above or some other attributes sufficient to describe thecomplete state of affairs at any given stage. By definition, for a properly defined state, noinformation from any other stage shall be required to completely describe the status of theoptimization process during any stage.
Every state can evolve from one state during one stage to another state during the nextstage. The objective of DP is to determine the optimal state transition, or rather, the optimalstate transition strategy. Some state transitions may not permissible.
The principle of optimality upon which DP is based simply states that an optimal strategycontains optimal sub-strategies. More precisely, if a state in an intermediate stage is part
45

of the optimal strategy, then the remaining strategy (starting from this state) is an optimalstrategy for the corresponding sub-problem (from this stage onwards). In other words, oncewe are at a given state in a given stage, we only have to determine the optimal strategy fromthis state (and stage) onwards for the remaining stages; how we got to this state in this stageis not relevant. Therefore, optimal strategies from stage 1 to stage K are found by findingsequentially the optimal sub-strategies from stage k to stage K, starting from k = K − 1 andworking backwards to the stage k = 1. The optimal sub-strategies from stage k to stage K isfound by finding the optimal transition from stage k to stage k + 1 that takes account of theoptimal sub-strategy found (in the previous iterative step) from stage k + 1 to stage K.
For our deterministic DP example, consider a system with four states (N = 4) and sixstages K = 6. The profits associated with each state for each stage (the stage profit matrixR) is illustrated in Table 34 (in the deterministic version these profits are fixed and knownbeforehand):
Table 34: Stage profits R from operating in a given state at a given stage. Values are randomlygenerated numbers between 1 and 100.
StagesStates 1 2 3 4 5 6
1 96 90 83 93 94 62 24 77 45 74 92 363 61 46 62 18 42 824 49 2 80 41 90 1
Likewise, in our example the state transition profits matrix c (assumed the same for allstages) is given according to the Table 35. Forbidden transitions have transition costs equalto ∞.
Table 35: State Transition cost matrix c. Values are randomly generated numbers between−1 and −100 with a few random “forbidden” transitions thrown in (∞ values)
xk+1
xk 1 2 3 41 −7 −14 −23 ∞2 −11 −10 −47 −273 −10 −1 ∞ −114 −31 ∞ −21 −34
Let J∗k+1 be the vector of cumulative optimal profits for stage k +1 onward, and let Rk be
the profits associated with stage k for each of the states (Rk corresponds to the kth columnof the stage profit matrix R illustrated above). To determine the possible profits from eachpossible state transition from stage k to stage k + 1 we add the profits from stage k to thecumulative profits from stage k + 1 stage and to the profits from the state transition itself.Mathematically we can determine each entire new columns of J∗ by first constructing a matrixJ∗k that determines all possible cumulative state transition profits (starting with k = K − 1)
46

and working backwards):
J∗k = rowmax(Rke′ − c + e(J∗k+1)
′) (111)
where e is a vector of ones of length N and the subscript k when applied to a matrix denotesthe selection of the kth column. The matrix J∗ is of dimension N by K and initially its lastcolumn is equal to the last columns of R. For the example at hand, the matrix J∗k for periodk = K− 1 is illustrated in Table 36. The operator rowmax operator finds the maximum valueby row.
Thus, only the optimal values for each state xk need be considered (the maximum valuesin each row). Thus, we only need to select the optimal values as obtained in equation 111 (themaximum values within each row of Table 36). These values are highlighted in the table.
Table 36: All transition profits for the transition from stage 5 (k = K−1) to stage 6 obtainedfrom application of equation 111. Optimal values for each row are highlighted
x6
x5 1 2 3 41 107 144 199 −∞2 109 138 221 1203 58 79 −∞ 544 127 −∞ 193 125
If we apply this procedure to the values from Tables 34 and 35 proceeding backwards forall values of k we obtain the cumulative profits matrix J∗ illustrated in Table 37. It is alsouseful to illustrate a matrix of optimal state transitions, and this is done in Table 38.
Table 37: Cumulative profits matrix J∗ obtained from repeated application of equation 111and selection of optimal profits
StageState 1 2 3 4 5 6
1 653 515 418 328 199 62 577 543 384 305 221 363 605 496 400 240 79 824 595 475 439 271 193 1
Table 38: Optimal state transitions corresponding to the optimal profitsStage k
xk+1 1 2 3 4 51 2 1 1 2 32 2 4 1 2 33 2 4 1 2 24 1 4 1 1 3
47

The optimal transition values are shown in the table. The set of these values representsthe newly determined vector J∗k, which can then be used to perform the transition from theprevious stage using a similar procedure.
Figure 6 illustrates the solution of our randomly generated DP example. An interest-ing observations from this graphic representation of the optimal strategy is that there is a“convergence” in the optimal sequence; that is, after a few stages, and regardless of initialstate, the optimal strategy converges to a single optimal thread. Thus, there are numerousstates and state transitions that are not reachable. This can save considerably on computa-tional effort. This type of observation gives rise, however, to many heuristic improvements instraightforward DP solvers.
653 515 418 328 199 6
577 543 384 305 221 36
605 496 400 240 79 82
595 475 439 271 193 1
Figure 6: Optimal strategy and optimal profits obtained by backward DP for the randomlygenerated problem described in the text. Observe the typical “convergence” of the optimalthread. This example considers no multiple levels, no uncertainty.
In the body of this report to solve a DP problem involving time we associate the notionof “stage” with “time period.” To solve a DP problem involving a sequence of decisions overauction rounds, we associate the notion of “stage” with the notion of “auction round.” Thus,optimization over time periods or over auction rounds can be mapped into a DP problem. Wealso use DP to solve the biddability requirement problem. This is discussed next.
DP with Restrictions on Permissible Transitions
As we have seen, it is possible to use DP to characterize the bidding of sequential amountsof any quantity into a market. Assume that we have N blocks of, say, energy that we canoffer, and that we can offer each block at any price that optimizes our profits, but with therestriction that the offer price for the second block cannot be lower than the offer price for thefirst block. The problem of making optimal offers that are compatible with a non-decreasingstrategy, we can solve a DP problem involving a sequence of decisions with increasing values ofthe variable of interest (for example, the amount of energy the is being offered into an auctionas part of the offer blocks). We let the amount being offered to the auction be the “stage.”The “state” variable for each stage corresponds to the price state of the system, which ofcourse can vary according to time period.
48

This use of DP to ensure biddability deserves additional explanation. Consider a tableof profits (or expected profits, in the case of a probabilistic situations) for the amount bidversus the price levels (stages). A specific situation involving three possible price levels and 5possible dispatch amounts is illustrated in Table 39. The rows in this Table (states) correspondto values of a bid quantity (the values in this table and in the corresponding figures are sortedfrom smaller to larger). The columns (stages) correspond to the price level scenarios. Thefirst column corresponds to the lowest price level. Thus, the biddability rule requiring non-decreasing bids simply means that bids must be chosen so there is never an upward move fromthe state (amount bid) on one stage to the state (amount bid) in the next stage (or the nextlarger quantity bid into the market). The optimal bid for any level is the bid that maximizesthe profits.
Table 39: Assumed random expected profits for a given bid as a function of price level.Stages
States 1 2 31 20 70 502 69 38 903 31 87 834 55 86 655 16 60 82
Any DP problem must incorporate restrictions in the ability to transfer from one state toanother as we transition from one stage to another of the DP process. Forbidden transitions,as we described earlier, are represented expediently by resulting in ∞ costs. In particular,using DP to determine optimal bids under biddability rule restrictions can be represented bycreating a DP problem with stages associated with price levels and states associated withamounts bid, with the additional restriction that there shall be no ”upward transition” froma greater quantity bid during a lower price level to a smaller valued bid at a higher price level.Thus, in order to require non-decreasing prices in bids can be elegantly represented by thestate transition cost matrix in Table 40.10
Table 40: Matrix of state transition costs. This matrix has been designed to forbid downwardstate transitions.
xk+1
xk 10 20 30 4010 0 0 0 020 ∞ 0 0 030 ∞ ∞ 0 040 ∞ ∞ ∞ 0
Once the stage expected profit matrix has been determined and the transition cost matrixhas been established as indicated, the optimization process is pretty much the same as before,
10If we wish to remove this restriction and allow all state transitions, we have the option of simply settingall entries of this matrix equal to zero.
49

except that now there are many transitions that are not permitted. We illustrate the natureof this type of optimization with a randomly generated example. The same problem is solvedtwice, once without restriction on transitions, and the second time with restricted transitions.Figure 7 illustrates the example with all transitions allowed and Figure 8 illustrates the casefor the exact same problem but with decreasing transitions not allowed. As expected, theoptimal prices are either the same or higher for the problem with non-decreasing transitionsas a result of the additional constraint.
197 160 50
246 128 90
208 177 83
232 176 65
193 150 82
Figure 7: Optimal solution of a random multi-state multi-stage problem when with all tran-sitions allowed.
Probabilistic DP
In the presence of uncertainty, an optimal strategy typically requires that expected valuesbe optimized. The transition from one state in one stage to another state in the followingstage may not be fully deterministic. Or rather, there is only partial control over the statetransitions. We assume that there is a state xk for each stage that characterizes the statusof the generator, and that there is also a price level “state” pk that characterizes the priceregime. The complete state at any time period is the composite, or cross-product, of thesetwo components to the composite state characterization (xk,pk). We then transfer fromone composite state (xk,pk) to a new composite state (xk+1,pk+1), where xk+1 is knowndeterministically but pk+1 is only known only statistically.
To illustrate the DP process with uncertainty, we consider a case with 3 states and tworandom price levels (HIGH and LOW), for a total of 3 · 2 = 6 composite states, over 5 stages(K = 5). The profit matrix R associated with operation within each composite state isillustrated in Table 41.
50

190 160 50
239 128 90
201 170 83
223 168 65
158 142 82
Figure 8: Optimal solution of the same random multi-state multi-stage problem when withtransitions restricted to being non-decreasing. That is, no upward transitions to lower valuesof the state variable are permitted.
The expected state transition cost matrix c (also randomly generated) for this example isillustrated in Table 42.
Finally, it is important to know the statistics of the random process. Since these applyonly to the price level sub-states, the dimension of the probability of price transitions is, inour example, two by two. For the example at hand, the expected transition probability matrixis illustrated in Table 43.
To solve this problem, the DP methods of the previous section can be applied directlyif expected values are used. Table 44 illustrates the optimal profits. The solution to thisproblem is illustrated in Figure 9. In this particular case, there is no “convergence” of theoptimal transitions to a single state at an intermediate stage. Even with a constant transitioncost matrix, it is possible that the optimal sequence thread will re-split after some steps as aresult of the randomness of outcome.
Nested DP
As part of the DP optimization process, it is necessary to determine the profits associatedwith each possible transition out of that state into any other state, or the profits associatedwith operating in a given state given the value of some exogenous random variable. Assume,however, that these profits are not readily available. Assume instead that to determine theseprofits or expected profits requires, in turn, an optimization. Depending on the nature of thisoptimization, one may need DP methods to solve it. In such a case, the original (top level)
51

Table 41: Matrix R of assumed random expected profits for a given bid as a function of pricelevel.
StageComposite State 1 2 3 4 5
(1,HIGH) 63 10 17 46 61(1,LOW) 82 25 50 62 87(2,HIGH) 62 36 41 8 18(2,LOW) 96 43 84 96 77(3,HIGH) 65 19 47 15 45(3,LOW) 71 38 84 32 63
Table 42: Transition costs associated with each state transition. In this example the statetransition costs are associated only with the state transition, not with the price level randomtransition.)
(xk+1, pk+1)(xk, pk) (1,HIGH) (1,LOW) (2,HIGH) (2,LOW) (3,HIGH) (3,LOW)
(1,HIGH) −13 −13 ∞ ∞ −18 −18(1,LOW) −13 −13 ∞ ∞ −18 −18(2,HIGH) −30 −30 ∞ ∞ −21 −21(2,LOW) −30 −30 ∞ ∞ −21 −21(3,HIGH) −26 −26 −48 −48 −16 −16(3,LOW) −26 −26 −48 −48 −16 −16
DP problem turns into a two-level nested DP problem. The inner DP problem may, in turn,require some form of optimization in order to determine some of the stage profits. If thisinnermost optimization itself required the solution of a DP problem, this leads to a three-levelnested DP.
In our work, there are at least three levels of nesting in some applications. For one of themore typical problems, the following would be the levels of interest:
• We wish to optimize over a sequence of time periods. In order to do so, we must be ableto estimate the profits associated with any state, even when price exogenous uncertaintymay occur.
• The profits that we anticipate for any state will necessarily depend on the outcome of
Table 43: Price level transition probability matrix illustrating the probability of transitionfrom one price regime in stage k to another in stage k+1. (For the case of perfectly correlatedprices, this matrix would be the identity matrix.)
k+1k LOW HIGH
LOW 0.76 0.24HIGH 0.21 0.79
52

Table 44: Optimal profits for when following an optimal state transition policy. (These valuesare not precise but are rounded.)
Stage(xk, pk) 1 2 3 4 5
(1,HIGH) 383 275 164 126 61(1,LOW) 438 341 213 157 87(2,HIGH) 385 304 205 105 18(2,LOW) 455 362 264 208 77(3,HIGH) 431 286 225 108 45(3,LOW) 469 352 318 145 63
some auction rounds in which we will be selling our various capabilities, for example, ourgeneration output and our reserve capability(ies). Since there are interactions betweenthese, the allocation of amounts to bid into each of these markets will itself involve aDP problem.
• When we offer our capabilities into an auction, if there are rules regarding biddability,it becomes necessary to perform another DP optimization to determine the optimal bidstructure. To do this, each price at which an amount is bid can be viewed as a stagein a DP problem. Optimizing the amounts to be offered at each price level for optimalprofitability involves, therefore, another DP problem with a restriction on transitionsbetween the stages.
Figure 5 in Section 4 of this report illustrates the nested nature of these DP problems.
53
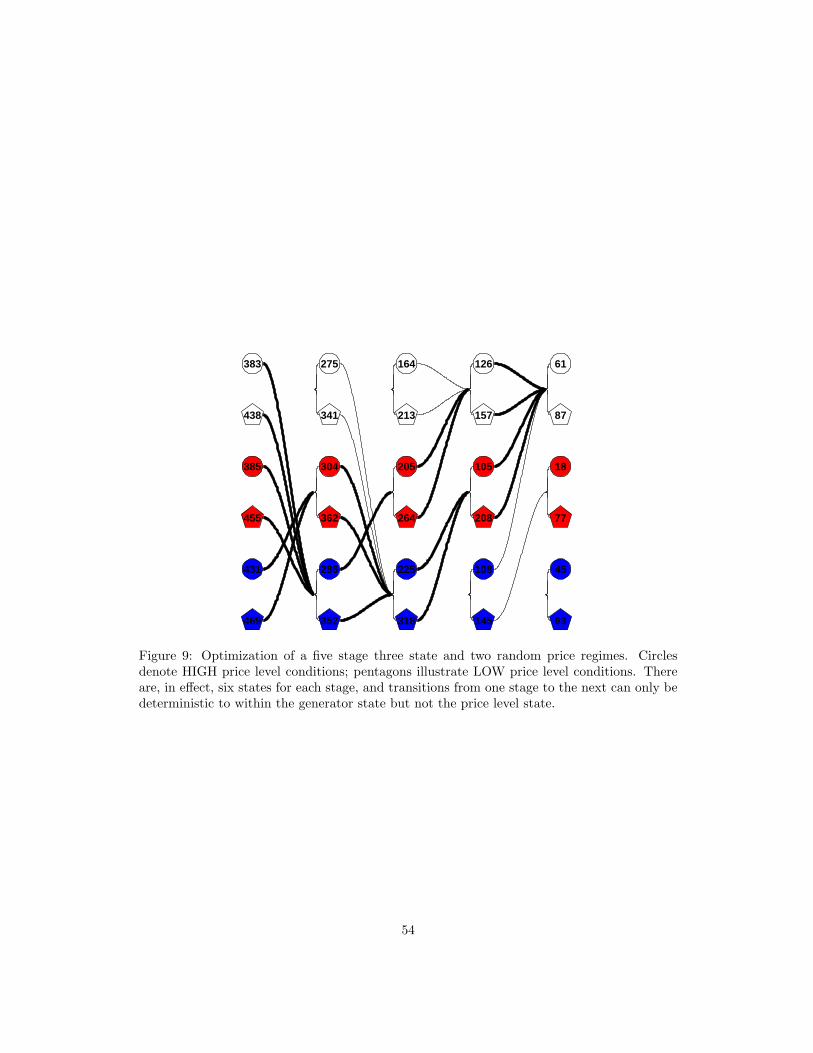
383
438
275
341
164
213
126
157
61
87
385
455
304
362
205
264
105
208
18
77
431
469
286
352
225
318
108
145
45
63
Figure 9: Optimization of a five stage three state and two random price regimes. Circlesdenote HIGH price level conditions; pentagons illustrate LOW price level conditions. Thereare, in effect, six states for each stage, and transitions from one stage to the next can only bedeterministic to within the generator state but not the price level state.
54