optically computing the hit-miss transform for an automated cervical smear screening system
TRANSCRIPT

ccip8tfftuoprco
ec
Optically computing the hit–miss transformfor an automated cervical smear screening system
John L. Metz and Kristina M. Johnson
The hit–miss transform serves as a region-of-interest locator for cells from cervical smear images thatshow abnormal changes, which are indicative of malignancy, in their nuclei. An optical implementationof the hit–miss transform algorithm uses an analog spatial light modulator for gray-scale modulation atthe filter plane of a 4f optical correlator. Gray-scale modulation at the filter plane improves correlatorperformance in comparison with a binary phase-only filter ~BPOF! by reduction of the edge enhancementof kernels used in morphological detection of cancerous cervical cells. The hit–miss transform with agray-scale amplitude and binary phase optical filter ~GABPOF! for the hit filter and a BPOF for the missfilter shows a 47% reduction in total error versus the use of only BPOF filters to locate abnormal cells.© 2000 Optical Society of America
OCIS codes: 200.4690, 100.5010, 070.4550, 070.1170, 070.4580.
2,3
1. IntroductionOptically computed pattern-recognition algorithmsfrom morphology such as the hit–miss transform~HMT! maintain parallelism in detecting objectlasses from images. The image processing of cervi-al smears, more colloquially known as Pap smears,nvolves inspecting more than 1 Gbyte of image dataer smear when imaged at 0.675 mmypixel with an-bit gray-scale resolution. An automated optoelec-ronic processor that uses a 4f optical correlator per-orms the initial rapid detection of cancerous cellsrom the smear in the first stage of a two-stage sys-em. This paper describes this first stage, whichses gray-scale modulation at the filter plane of theptoelectronic processor. Increased modulation im-roves the performance of computing the HMT algo-ithm for locating regions of interest ~ROI’s!, whichan subsequently be classified as normal, precancer-us, or cancerous.Although the increased use of consistent annual
xams has reduced the incidence rate of cervical can-er by 43.3% from 1973 to 1995,1 false-negative rates
The authors are with the Department of Electrical and Com-puter Engineering, Optoelectronic Computing Systems Center,University of Colorado, Campus Box 525, Boulder, Colorado80309-0525. J. Metz’s e-mail address is [email protected].
Received 17 June 1999; revised manuscript received 21 October1999.
0003-6935y00y050803-11$15.00y0© 2000 Optical Society of America
are still high ~15%–30% in some cases!. One rea-son for this high error rate arises from manuallyscreening a large fraction of smears that are perfectlynormal. Human reviewers visually review approxi-mately 55 3 106 cervical smears each year in theUnited States alone,4 of which more than 95% arewithin normal limits.5 Coupling the volume of dataexamined with the habitual nature of cervical smearscreening and the large percentage of normal smearsaccounts for the significant false-negative rates. Inaddition, a recent survey6 indicated that one fifth ofwomen ages 18–64 years have not had a test in thepast three years. As the medical community ad-dresses this segment of the underserved population,the amount of data from cervical smears will onlyincrease the demand on the existing medical infra-structure.
These factors provide the motivation for automatedscreening systems to reduce false-negative rates andaddress the large bandwidth of medical image data.Many efforts have addressed this complex problem,7,8
mostly through the application of electronic imageprocessing. These systems, although they exploitsome degree of parallelism, do not take advantage ofthe potential of optical image processing.
In this paper, we discuss the use of an opticallycomputed algorithm to filter large numbers of cervi-cal smear images and rapidly identify ROI’s for fur-ther classification of smears into the appropriatemedical diagnoses. The algorithm implemented bythe processor computes the morphological HMT by
10 February 2000 y Vol. 39, No. 5 y APPLIED OPTICS 803

todaphpathH
l
tenmmrts
abnpina
sstsos
casTtsivTpdd
8
use of a 4f optical correlator and complex spatialfiltering.9
Correlators that use a binary spatial light modu-lator ~SLM! at the filter plane have been used previ-ously to compute correlations optically.10,11 Severaloptical implementations of the HMT also exist.12,13
However, the cervical smear image-processing appli-cation requires the correlator to perform more thanthe strict pattern recognition of template matching todetect the range of objects that indicate a cancerousor a precancerous condition.
Of the several features indicating the change of a cellfrom normal to abnormal ~see Ref. 5! one of the mostbasic is an increase in the diameter of the nucleus. Indetecting objects whose diameters fall in the range ofinterest ~10–20 mm! thresholded correlations performhe morphological erosions for the hit and the missperations. In each erosion operation the area of theetected peak—not just the location—is important forccurate detection and fewer false detections. Binaryhase-only filters ~BPOF’s!, although they possessigh signal-to-noise ratios for detection and location,erform poorly in the area returned on thresholding asresult of the edge enhancement of kernels that define
he range of interest. The optical system reportedere extends the previous research on a binary opticalMT algorithm for locating these enlarged nuclei14,15
by inclusion of gray-scale amplitude modulation at thefilter plane of an automated processor that is based ona 4f optical correlator.
Removing the limitation of a BPOF at the filterplane allows a more ideal correlation operation to beperformed by the correlator as opposed to the edge-enhanced correlations resulting from binary filters.Although optimization of binary filters does allow forimproved results,15,16 filter-plane devices that modu-ate in amplitude as well as phase17,18 allow for a
more ideal computation of optical correlations.Such an optical correlator that uses a gray-scale am-plitude and binary phase optical filter ~GABPOF! athe filter plane of the correlator has been construct-d.19,20 The GABPOF representation extends the bi-ary phase filter by the addition of amplitudeodulation at each pixel in addition to binary phaseodulation. Our system computes the HMT algo-
ithm with two time-sequential thresholded correla-ions to locate possibly cancerous cells on cervicalmear slides.First, general criteria for detecting cancerous cells
re reviewed as background for the two features usedy the HMT optical processor: optical density anduclear diameter. Next, the automated system thaterforms the optical HMT is discussed before exam-ning results for each section of the algorithm. Fi-ally, results from the optical processor are analyzednd discussed.
2. Image Processing for Cancer-Cell Detection
A. Cervical Cancer Cytological Features
Finding and detecting abnormality in biological spec-imens involves multiple criteria, including multicell
04 APPLIED OPTICS y Vol. 39, No. 5 y 10 February 2000
features as well as individual cell features, on severalscales. On cervical smears multicell features suchas the clustering and the clumping of abnormal cellscan be important for diagnosis. Also, noncervicalcell features such as infection by the human papillo-mavirus have a high degree of correlation with in-creased risk of developing cervical cancer. Withindividual cervical cells several criteria are used todetermine abnormality21:
• Nuclear area.• Nuclear texture.• Average nuclear optical density.• Nuclear integrated optical density.• Cytoplasmic area.• Cytoplasmic texture.• Nuclear-to-cytoplasmic ratio.
Although all these features contribute to accuratelydiagnosing a smear, many are unnecessary for a pre-liminary screening judgement. The large amount ofdata per smear also makes the use of all the featuresmentioned above impractical for an all-electronic sys-tem. We propose a two-tier approach: ~i! The firsttage of the system rapidly filters the data to identifyuspicious ROI’s by use of a restricted set of featureshat are accessible to optical computation. ~ii! Theecond stage implements a more complex algorithmn the reduced data set that is screened by the firsttage.In the research reported here an optoelectronic pro-
essor uses two simple critera—the optical densitynd the diameter of the nucleus—to perform rapidcreening for the first stage of the two-tier system.he optical density of the nucleus being greater thanhe cytoplasm and the background of the slide allowsegmentation of the nucleus from other objects eithermplicitly as a result of the difference in gray scalealue or explicitly by use of a threshold operation.he diameter of the nucleus is then used to locate theosition of the ROI within the image. A range ofiameters from 10–20 mm encompasses nuclei thateviate from the norm of 6–9 mm.22 One means of
identifying these objects is the morphological HMT,which returns a set of objects whose diameters liewithin desired shape and size ranges. The opticalHMT algorithm used for cervical smear screening hasbeen described extensively elsewhere ~see Ref. 15!but is reviewed briefly here before we discuss theanalog modulation that extends the capabilities ofthe optically computed HMT.
B. Hit–Miss Transform for Locating Regions of Interest
The HMT performs object location and detection forthe system by identification of those objects that areROI’s. Optically implementing the algorithm pro-vides the parallelism desired for large-data-set pro-cessing.
1. Morphological AlgorithmThe formal morphological HMT consists of the inter-section of two separate erosions: the hit erosion per-

tr
jkoki
mtosmH
2MrRlJTut
t
formed on the input image and the miss erosionperformed on the complement of the input image.Each erosion has a different structuring element~SE!, referred to as a kernel. These two elements—he hit and the miss kernels—define the specificange of shapes to be detected.23 In cervical smears
the objects of interest, cervical cell nuclei, are usuallycircular in shape and of varying size. Therefore thekernels are circularly symmetric, with a circle as thehit kernel and an annulus as the miss kernel.
The first ~hit! operation detects a superset of ob-ects with a diameter greater than that of the hiternel. The second ~miss! operation detects a subsetf objects with diameters less than that of the missernel. The complete HMT is computed as the log-cal AND operation of these two erosions:
HMT(X) 5 (X * H) ù (Xc * M), (1)
where X denotes the binary input image, Xc is thecomplement of X, H and M represent the hit and the
iss SE’s, respectively, and the symbol C indicateshe erosion operation. In the detection of this rangef circular objects, the hit kernel defines the lowerhape–size limit, whereas the inner diameter of theiss SE defines the upper limit of objects within theMT-identified class.
. Optoelectronic Algorithmapping the erosion operation into a thresholded cor-
elation allows the HMT to be computed optically forOI detection by use of a standard 4f optical corre-
ator, as was shown explicitly by Narayanswamy andohnson ~Ref. 15, see Appendix A, pp. 6022–6023!.he correlation for the HMT is computed optically byse of the Fourier transform properties of lenses andhe convolution theorem.24 Thresholding the corre-
lation yields the final binary result, which is equiva-lent to the erosion of the input image by the kernel.Acquiring a digital image of the optical output allowsthe image to be thresholded and stored. The storedimages from both the hit and the miss results un-dergo the logical AND operation pixel by pixel to com-plete the HMT computation.
Therefore if X is the input image and Xc is itscomplement the optoelectronic implementation of theHMT appears as
HMT(X) 5 Th(X , H)Tm(Xc , M), (2)
where T indicates a threshold function with levels ofh and m for the hit and the miss correlations, respec-ively, and the star , denotes the correlation opera-
tion. The threshold level applied to the hit and themiss correlations can be varied to adapt the sensitiv-ity of the HMT algorithm to size–shape noise in theinput nuclei. This allows for a robust HMT detec-tion algorithm when applied to the natural shapevariations found in biological specimens.
3. Automated Optoelectronic Processor
The analog optical correlator is integrated into anautomated detection system that allows input di-
rectly from either a CCD camera mounted on themicroscope or digital data stored on the hard drive ofthe controlling PC. The detection system controlsmicroscope-stage movement, data input, filter-imagedisplay and synchronization, correlator-output acqui-sition, and HMT algorithm postprocessing. After adiscussion of the automated experimental system theuse of complex spatial filters for computing the HMTis examined.
Future systems may employ more compact designs,including the use of direct laser illumination of thecervical smear. Coherent illumination of the cervi-cal smear cells allows analog images to be input di-rectly into the optical correlator. Such anillumination scheme would eliminate the optical-to-electronic conversion of the input image data de-tected by the CCD camera and encoded by the SLM.Additional parallelism is also possible by use of or-thogonal polarizations to compute the hit and themiss results simultaneously.
A. Experimental System
The automated optoelectronic system constructed toacquire cervical smear images, compute the HMT,and postprocess the correlator output is shown in Fig.1. The system comprises three main subsystems:automated image acquisition, the system-control PC,and the analog optical correlator.20
The automated image acquisition consists of amodified Zeiss Model Axioskop microscope with x, y,and z motion-control electronics and a Dalsa ModelCA-128 CCD camera.25 The stage-control electron-ics convert digital command strings from a NationalInstruments Model DIO-96 card26 into analog cur-rents that drive the x–y–z-axis stepper motors tomove the microscope stage. The microscope also in-cludes a beam splitter to direct images to the ocularsand the input CCD camera.
Cervical smears are imaged with a 203 objectiveand acquired at 0.8 mmypixel by the CCD camera in128 3 128 pixel images for an image-field size of102.4 mm 3 102.4 mm. Parallel data lines connectthe camera to the correlator-input board, which is acustom driver board that addresses data to the inputSLM and synchronizes the filter-plane SLM from thePC EISA ~Extended Industry Standard Architecture!bus. The input camera currently operates at asmany as 734 framesys, which is the limiting speed ofthe optical processing. Overall system speed is cur-rently limited by the autofocusing of the microscope.
The system-control PC contains several boards inaddition to the correlator-input board to provide theinterfaces for both the microscope CCD camera andthe correlator CCD camera with the system software.The input SLM acquires data from the Dalsa camerathrough the correlator-input board, which convertsthe 8-bit CCD images into 4-bit images for SLM dis-play. The current system has only 4 bits of controlfor the analog SLM’s, but 8-bit control should beavailable in the near future. Also, the input SLMreceives inverse images from the board to dc-balance27 the SLM. The input board also controls
10 February 2000 y Vol. 39, No. 5 y APPLIED OPTICS 805

6
at8ogga
itr
1Tvtwp
ai
8
the modulation of the illuminating laser diode, whicheliminates the need to shutter the output CCD cam-era to exclude invalid input–filter correlations frombeing detected. The filter-plane SLM displays thefilter images and their inverses synchronously withthe images shown on the input-plane SLM. Finally,the output-plane correlations are acquired with aDipix digital frame-grabber card ~Model FPG-4428!with on-board digital signal-processing chips thatalso are synchronized by the control software. Thesoftware can also save the correlator outputs to thehard drive to aid in more extensive postprocessingand analysis.
The analog optical correlator consists of an illumi-nating laser diode and collimating optics, input- andfilter-plane SLM’s, half-wave plates, polarizers, andan output CCD camera. The SLM’s are 128 3 128pixels and are located on 40-mm centers that arecapable of analog rotation of the polarization state ofthe illuminating laser light. Although the liquidcrystal ~LC! is truly analog, in this system the controlvoltages for the SLM’s are digitized into 4 bits by thecontrol electronics. At the input plane the 4 bitscontrol 16 levels of amplitude modulation; at the filterplane the 4 bits are split into 3 bits of amplitudemodulation and 1 bit of phase modulation. Thissplitting extends the capabilities of the optical corre-lator beyond the previous prototype system, whichhad only 1 bit available for either amplitude or phasemodulation.14 Consequently, the calculation of theHMT may be improved through the more accurategray-scale modulation of filters at the Fourier planeSLM.
Fig. 1. System diagram of the automated optoelectronic cervical smacquisition from a modified Zeiss Model Axioskop microscope, systnalog optical correlator with a Dalsa CCD camera. The folded-dencluding the output-plane CCD camera.
06 APPLIED OPTICS y Vol. 39, No. 5 y 10 February 2000
B. Gray-Scale Modulation in the Optical Correlator
The key to precisely implementing the mathematicalcorrelation needed for the HMT algorithm resides inhow well the complex Fourier transform of the corre-lation kernel is represented by the filter-plane SLM.An ideal modulator performs analog modulation ofboth the amplitude and the phase to provide a com-plete complex representation of any desired filter.At present, the system uses a 128 3 128 pixel elec-trically addressed, analog LC SLM to perform quan-tized complex modulation.17 The SLM’s have asquare pixel pitch of 40 mm with a flat fill factor of0%.The input- and the filter-plane SLM’s are LC vari-
ble rotators and constant retarders of the polariza-ion state of incoming light from a laser diode ~l 502 nm!. The relative phase retardance G betweenrdinary and extraordinary waves in the device isiven by G 5 2pDndyl, where Dn is the LC birefrin-ence, d is the thickness of the birefringent material,nd l is the wavelength of light in vacuum.29 Spec-
ifying Dnd to be equal to ly4 at the wavelength of thelluminating laser yields a half-wave plate on reflec-ion from the SLM backplane, thereby providing aelative phase shift equal to p.
. Gray-Scale Amplitude Modulationhe LC SLM modulates the optical amplitude byariable rotation of a linearly polarized beam andhen analyzes the orthogonal component of the beamith a polarizer that is oriented at 90° to the incidentolarization. If the input polarizer is aligned with
processor. The system comprises three parts: automated imagentrol with translation-stage motor drivers, and a 128 3 128 pixel
optical correlator measures 32 cm long 3 26 cm wide 3 26 cm high,
earem cosign

w
2tspc
ww
absStwp
2Abas
wodnbapar
a
tttoawfi
tiut
one extreme of the LC molecular-director orientationand the output polarizer is crossed with respect to theinput polarizer the LC SLM operates as an amplitudemodulator ~see Fig. 2 and Ref. 24!. For an analog LC
ith a maximum tilt half-angle cmax of 22.5° thedirector linearly switches between 222.5° and 122.5°in response to an electric field applied across the LCcell gap.30
Because in reflection the SLM operates as a half-wave plate, the linear polarization of the incidentlight rotates by twice the rotation angle u ~where u 5c!, allowing rotation angles from 0° to 90° betweenhe incident and the reflected optical polarizationtates. When the device is placed between crossedolarizers the intensity transmission as a function ofis given by
I~c! 5 uEinu2 sin2~4c!, (3)
here c is the LC half-angle of rotation ~0°–22.5°ith respect to the input polarization state!.The input-plane SLM operates in a quantized
mplitude-modulation mode. The input driveroard reduces the 8-bit input image to its four mostignificant bits before it programs the data on theLM. The image from the input plane is Fourierransformed to illuminate the filter-plane SLM,hich then modulates both the amplitude and thehase of the light.
. Phase and Amplitude Gray-Scale Modulationligning the incoming linear polarization with theisector of the two extremes of c and analyzing withpolarizer at 90° to the input polarization state, as
hown in Fig. 3, allows the filter-plane SLM to act as
Fig. 2. Gray-scale amplitude modulation of a reflection-mode anaamplitude modulation. Note: All coordinate axes are right handthe source of the light, i.e., right-hand ~RH! light rotates its polaleft-hand ~LH! light rotates counterclockwise when viewed head o
a variable-amplitude and binary phase modulator.The amplitude of the output is given by
Eout~c! 5Ein
Î2sin~2c!, (4)
here the relative phase is either 0 or p, dependingn the sign of c. The absolute phase term also wasropped from Eq. ~4!. Thus the positive and theegative coefficients of the Fourier transform cane displayed on the filter-plane SLM with variable-mplitude modulation for both signs of c. As com-ared with the BPOF, the GABPOF allowsmplitude modulation of the higher-frequency Fou-ier components.
C. Spatial-Frequency Filters for the Optical Hit–MissTransform
BPOF’s with c 5 622.5° constrain the filter plane tofixed-amplitude modulation of 61y=2 with a phase
change of 0 or p. This constant amplitude modula-ion for all spatial frequencies that are incident uponhe filter plane places a disproportionate emphasis onhe high-frequency components when the coefficientsf the ideal Fourier transform decrease in amplitudet higher frequencies. A higher-resolution filterould modulate the amplitudes of the Fourier trans-
orm of the SE as well as provide phase changes tondicate positive and negative Fourier coefficients.
Figure 4 shows a comparison of cross sectionshrough three representations of a hit-filter image,.e., the Fourier transform of the top-hat functionsed as the hit-kernel SE. The ideal filter is propor-ional to a Bessel function of the first kind J1~2pr!yr,
where r is the radial spatial-frequency coordinate.As shown in Fig. 4, the BPOF filter deviates greatly
M. The diagram is of a reflection-mode SLM configured for 4-bity convention. Circular polarizations are defined when looking ation clockwise when looking into the approaching beam, whereasee Goodman,24 p. 416.
log SLed brizatn. S
10 February 2000 y Vol. 39, No. 5 y APPLIED OPTICS 807

scfBsooodcete
c
8
from the ideal amplitudes for the higher-frequencycomponents. With a 3-bit amplitude modulation theGABPOF filter much more accurately approximatesthe ideal filter. By Fourier transformation of thesefilters back to the image domain the difference be-tween the BPOF and the GABPOF filters becomeseven more apparent. Figure 5 shows contour plotsof the two filters and pictures of the shapes thatresult from Fourier-transforming the BPOF and theGABPOF hit filters back to the image domain.
High-frequency enhancement causes the BPOF toperform edge-enhanced correlations instead of com-puting the ideal correlation. The ideal correlationdepends on area characteristics such as size and
Fig. 3. Gray-scale amplitude and phase modulation of a reflectioconfiguration of the SLM. Note: All coordinate axes are right hat the source of the light.
Fig. 4. Cross-section comparison of 8-, 4-, and 1-bit hit-filter rep-resentations. All hit filters are constructed from a 13-pixel-diameter top-hat function ~the hit SE!. The solid curve shows theentral cross section of an ideal filter, which is the J1~2pr!yr func-
tion. The dotted curve shows the cross section of a 1-bit BPOFrepresentation of the ideal filter. The dashed curve shows thecross section of a GABPOF filter that demonstrates one possible4-bit representation of the ideal filter.
08 APPLIED OPTICS y Vol. 39, No. 5 y 10 February 2000
shape in addition to edge features that require a filterrepresentation capable of modulating the amplitudesof higher spatial frequencies. With gray-scale am-plitude modulation at the filter plane a GABPOF canbe constructed that allows a more accurate represen-tation of the Fourier transform of the SE to be used inthe optical computation.
4. Experimental Optical Computation Results
Each correlation-plane filter has a binary phase andfrom 0 to 3 bits of amplitude modulation that form aGABPOF. The filters are examined at each avail-able quantization scheme to determine the sensitiv-ity of both the hit and the miss operations to the filterquantization in an optical correlator environment.Analysis of the experimental results focuses on eachoperation separately before examination of the com-plete experimental HMT results.
A. Hit-Operation Results
Experimental results comparing the analog correla-tor output for the hit operation for three different-diameter disks with a BPOF and a GABPOF areshown in Fig. 6 with a simulated ideal correlation forreference. The ideal correlation @Fig. 6~a!# has aharp peak at the autocorrelation with the centerircle in the input image. The experimental resultsor the BPOF @Fig. 6~b!# do not show this peak. ThePOF correlation would thus miss this object, whichhould be detected. The GABPOF result detects thebject, while it also recreates the size and the shapef the autocorrelation peak @see Fig. 6~c!#. Thresh-lding this result yields the proper output: a smallisk for the autocorrelation and a larger disk for theorrelation on the large input circle. The BPOFdge enhancement yields a poorly defined peak forhe correlation on the large circle, leading to locationrrors on thresholding.
de analog SLM. Shown is the phase-and-amplitude modulationd by convention with circular polarizations defined when looking
n-moande

~pte
Bfcr
dapefsh~r
The reduction of the correlation edge sensitivitycan be seen clearly from Fig. 7, which shows crosssections of hit correlations for input objects rangingin diameter from 3 to 49 pixels. The BPOF correla-tion cross sections show substantial peaking aboutthe autocorrelation, as expected. However, crosssections at large input diameters reveal an undesir-able lowering of the peak height with maximum val-ues at the edges of the input objects. Because the hitoperation strives to detect all objects above a certainsize by the thresholding of these correlations, theBPOF results are prone to missing the centers ofthese objects when their correlation-peak intensitiesdrop. The GABPOF correlation cross sections thatdepend on size ~area sensitivity! as well as shapeedge sensitivity! monotonically increase both theeak height and width with increased input diame-er. Therefore hit-operation output is less prone torror for the GABPOF filter than for the BPOF filter.Figure 8 shows a graph of the deviation of the
POF ~1-bit! and the GABPOF ~4-bit! hit correlationsrom an ideal ~8-bit! simulated result. These resultsompare the thresholded area of the experimentalesults with the ideal thresholded area. The intro-
Fig. 5. Gray-scale and binary hit filters with equivalent kernels.and the SE’s that result from the filter quantization: ~a! Binary pderived from the BPOF. ~c! Four-bit quantization of the hit SE ~Greduction in edge enhancement from the BPOF.
uction of greater resolution in the filter improves theccuracy with which the hit operation can be com-uted. In fact, the 4-bit hit filter has 38% fewerrrors than does the 1-bit filter for the hit operationor a 14-mm-diameter input. Although this wouldeem to be the logical trend, the miss operationas the opposite trend with lower-resolution filtersedge-enhanced filters! outperforming the higher-esolution versions.
B. Miss-Operation Results
The accuracy of the miss operation depends on theidentification of objects with diameters less than anannulus with an inner diameter of 29 pixels ~19.6mm! and a thickness of 1 pixel ~0.675 mm!. Becausethe miss kernel is a 1-pixel-thick SE and thereforehas a high-spatial-frequency content, edge enhance-ment of the miss filter benefits the performance of themiss operation.
Figure 9 shows cross sections of three miss-filterrepresentations ~the inner diameter is 29 pixels!, i.e.,the Fourier transform of the annulus used as the missSE. The BPOF does not reduce the amplitude ofcomponents at the higher spatial frequencies that
filters are quantized from the Fourier transform of the hit kernel-only quantization of the hit SE ~BPOF!. ~b! Edge-enhanced SEOF!. ~d! The SE that results from the GABPOF and showing the
ThehaseABP
10 February 2000 y Vol. 39, No. 5 y APPLIED OPTICS 809

cA
thetms
bcfrfac
8
define the image edges. The GABPOF performanceresembles that of the ideal filter but reduces edgeinformation by the limitation of higher frequencies toamplitudes of 30% or less of the input.
Filters with large low spatial frequencies in com-parison with higher-frequency components performlow-pass filtering and can be thought of as adding ablurred version of the input image to the miss result.The GABPOF filter thus contributes to the noise atthe correlation plane and reduces the signal-to-noiseratio of the miss output. Because the miss operationstrives to detect a subset of input objects below thedesired size by the thresholding of these correlations,additional noise from the GABPOF filters is detri-mental in computing the edge-sensitive miss opera-tion.
Figure 10 shows a graph of the deviation of thethresholded BPOF ~1-bit! and GABPOF ~4-bit! missorrelations from an ideal ~8-bit! simulated result.lthough the difference in performance between fil-
Fig. 6. Comparison of the hit correlations of an input image witcircle with an image that includes circles with diameters of 7, 13, anresult. The correlations shown in ~b! and ~c! are experimental resthe central circle ~autocorrelation! that the BPOF does not detect.circle, which represents an important part of the superset detecti
10 APPLIED OPTICS y Vol. 39, No. 5 y 10 February 2000
er representations is less extensive than that for theit operation, there is still an advantage to using andge-enhanced filter for the miss operation. The in-ersection of these experimentally computed hit andiss operations will therefore determine the size–
hape sensitivity of the optically computed HMT.
C. Hit–Miss Transform Results
The complete HMT result detects a range of sizes andshapes on the basis of the criteria dictated by thecancer-screening application: roughly circularshapes from 10 to 20 mm. Figure 11 shows the com-ined results for the experimentally computed HMTompared with the simulated version. The use of aull 4-bit-resolution GABPOF hit filter with a 1-bit-esolution BPOF miss filter shows the least deviationrom the simulation results, as expected from thenalysis in Subsections 4.A and 4.B. The 4-bit–1-bitombination of representations for the hit and the
ee circles. Compared are the correlations of a 13-pixel-diameterpixels: ~a! desired ideal 8-bit result, ~b! BPOF result, ~c! GABPOFrom the optical correlator. The correlation shown in ~c! identifiesay-scale filtering also yields a greater energy return for the largethe hit operation.
h thrd 21ults f
Gron of

sctcfel
miss filters performs with 47% fewer errors than doesthe 1-bit–1-bit combination.
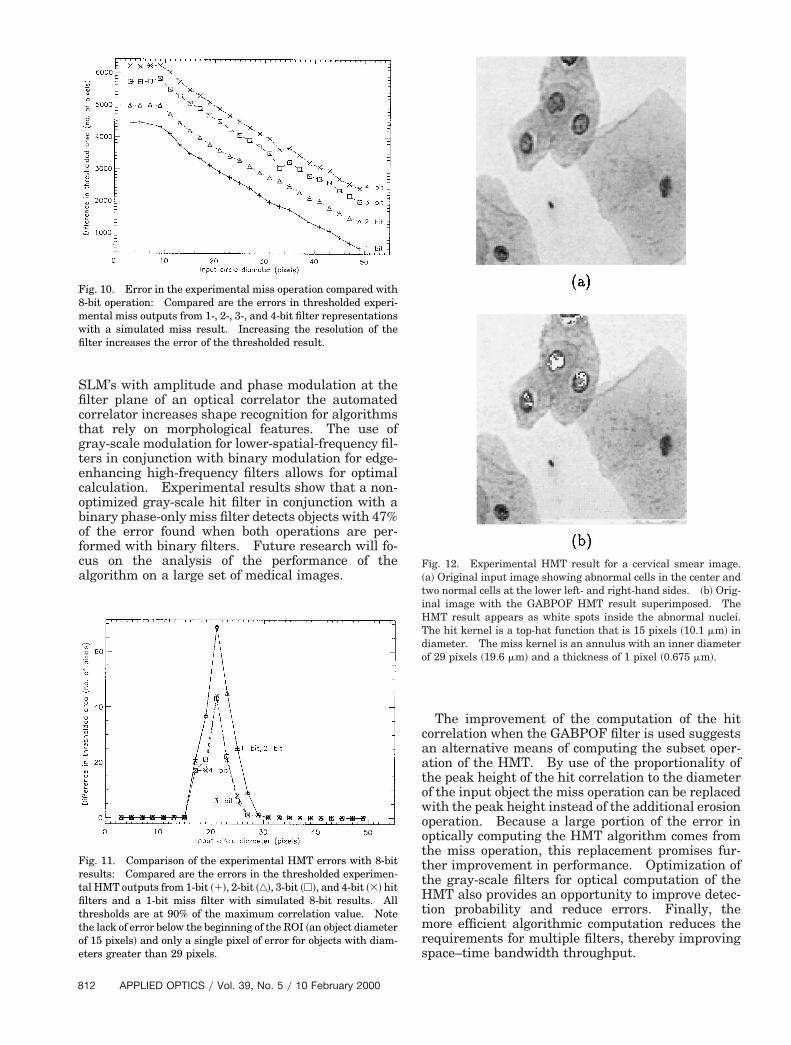
Figure 12 shows an original gray-scale cervical im-age and the original image with the experimentallycomputed HMT results superimposed in white. Thealgorithm successfully detects the three enlarged nu-clei clumped in the upper center of the image. Thetwo normal nuclei, located in the bottom of the imageat left and right, are not detected.
Although the HMT adequately detects the size
Fig. 7. Correlation cross sections of 15-pixel-diameter BPOF andGABPOF hit filters plotted versus the increasing diameters of theinput circles. Shown are the intensity cross sections of the exper-imental correlations for each of 24 input circles that increase indiameter from 3 to 49 pixels: ~a! Results for a BPOF. ~b! Crossections from a 4-bit GABPOF. Note the decrease in the BPOForrelation-peak heights for input circles with diameters greaterhan the kernel size of 15 pixels. These edge-dependent resultsause errors in the hit operation that is used as a superset detectoror the cervical smear screening application. The GABPOF filterliminates the decrease in correlation-peak heights for objectsarger than the kernel, yielding a more robust hit operation.
range of interest, the accuracy of the algorithm islimited by the noise inherent in the miss correlation.One possible solution to this problem is to use themore robust low-spatial-frequency hit correlation asboth the superset and the subset detection mecha-nism. Because the hit-correlation diameter afterthresholding is directly proportional to the size of theinput object, postprocessing to compute the extent ofthis correlation peak may provide a bound on the sizeof objects passed to the second stage of the overallsystem.
5. Conclusions
The goal of this study has been to increase both theaccuracy and the speed of cervical smear screeningthrough automated image processing. By use of
Fig. 8. Error in the experimental hit operation compared with8-bit operation: Compared are the errors in thresholded experi-mental hit outputs from 1-, 2-, 3-, and 4-bit filters with a simulatedhit result. The increase in filter resolution decreases the error ofthe thresholded result.
Fig. 9. Comparison of 8-, 4-, and 1-bit miss-filter representations:Shown are cross sections of miss filters that are constructed froma 29-pixel-diameter annulus ~the miss SE!. The solid curve showsthe central cross section of an ideal filter. The dotted curve showsthe cross section of a 1-bit BPOF representation of the ideal filter.The dashed curve shows the cross section of a GABPOF filterrepresenting one possible 4-bit representation of the ideal filter.
10 February 2000 y Vol. 39, No. 5 y APPLIED OPTICS 811
8
SLM’s with amplitude and phase modulation at thefilter plane of an optical correlator the automatedcorrelator increases shape recognition for algorithmsthat rely on morphological features. The use ofgray-scale modulation for lower-spatial-frequency fil-ters in conjunction with binary modulation for edge-enhancing high-frequency filters allows for optimalcalculation. Experimental results show that a non-optimized gray-scale hit filter in conjunction with abinary phase-only miss filter detects objects with 47%of the error found when both operations are per-formed with binary filters. Future research will fo-cus on the analysis of the performance of thealgorithm on a large set of medical images.
Fig. 10. Error in the experimental miss operation compared with8-bit operation: Compared are the errors in thresholded experi-mental miss outputs from 1-, 2-, 3-, and 4-bit filter representationswith a simulated miss result. Increasing the resolution of thefilter increases the error of the thresholded result.
Fig. 11. Comparison of the experimental HMT errors with 8-bitresults: Compared are the errors in the thresholded experimen-tal HMT outputs from 1-bit ~1!, 2-bit ~‚!, 3-bit ~h!, and 4-bit ~3! hitfilters and a 1-bit miss filter with simulated 8-bit results. Allthresholds are at 90% of the maximum correlation value. Notethe lack of error below the beginning of the ROI ~an object diameterof 15 pixels! and only a single pixel of error for objects with diam-eters greater than 29 pixels.
12 APPLIED OPTICS y Vol. 39, No. 5 y 10 February 2000
The improvement of the computation of the hitcorrelation when the GABPOF filter is used suggestsan alternative means of computing the subset oper-ation of the HMT. By use of the proportionality ofthe peak height of the hit correlation to the diameterof the input object the miss operation can be replacedwith the peak height instead of the additional erosionoperation. Because a large portion of the error inoptically computing the HMT algorithm comes fromthe miss operation, this replacement promises fur-ther improvement in performance. Optimization ofthe gray-scale filters for optical computation of theHMT also provides an opportunity to improve detec-tion probability and reduce errors. Finally, themore efficient algorithmic computation reduces therequirements for multiple filters, thereby improvingspace–time bandwidth throughput.
Fig. 12. Experimental HMT result for a cervical smear image.~a! Original input image showing abnormal cells in the center andtwo normal cells at the lower left- and right-hand sides. ~b! Orig-inal image with the GABPOF HMT result superimposed. TheHMT result appears as white spots inside the abnormal nuclei.The hit kernel is a top-hat function that is 15 pixels ~10.1 mm! indiameter. The miss kernel is an annulus with an inner diameterof 29 pixels ~19.6 mm! and a thickness of 1 pixel ~0.675 mm!.

ferroelectric-liquid-crystal electrically addressed spatial light
The authors wish to thank Ramkumar Narayan-swamy for his extensive help in understanding mor-phology and its application to the wide-rangingcervical smear screening problem and RosemaryStewart for explaining the important medical issues.Our gratitude is extended to David Zahniser, KathyMui, Kam Lin Wong, Louise Isenstein, and SteveMeuse at Cytyc Corporation for medical diagnosticsupport and the donation of cervical smear samples.Our thanks go to Kipp Bauchert, Steve Serati, TeresaEwing, Usha Narayanswamy, and the staff of Boul-der Nonlinear Systems, Inc., for countless technicaldiscussions and technical support for the Model 128Analog Correlator. This research was supported bythe National Science Foundation Engineering Re-search Centers program under grant EEC 9015128,the National Institutes of Health Small BusinessTechnology Transfer program under grants1R41CA68829-01 and -02, and the National ScienceFoundation under grant ECS-9413804.References1. P. A. Wingo, L. A. G. Ries, H. M. Rosenberg, D. S. Miller, B. K.
Edwards, “Cancer incidence and mortality, 1973–1995,” Can-cer 82, 1197–1207 ~1998!.
2. L. G. Koss, “The Papanicolaou test for cervical cancer detec-tion: a triumph and a tragedy,” JAMA 261, 737–743 ~1989!.
3. Y. V. Graaf, G. P. Vooijs, H. L. J. Gillard, and D. M. D. S. Go,“Screening errors in cervical smear screening,” Acta Cytol. 31,434–438 ~1987!.
4. S. Bolden, P. A. Wingo, and T. Tong, “Cancer statistics,” Can-cer 45, 8–30 ~1995!.
5. D. Grohs, “Challenges in cervical cancer screening: what cli-nicians, patients and the general public need to know,” ActaCytol. 40, 133–137 ~1996!.
6. B. L. Wells and J. W. Horm, “Targeting the underserved forbreast and cervical cancer screening: the utility of ecologicalanalysis using the National Health Interview Survey,” Am. J.Public Health 88, 1484–2489 ~1998!.
7. G. L. Wied, G. F. Bahr, M. Bibbo, J. H. Puls, J. Taylor, andP. H. Bartels, “The TICAS-RTCIP real time cell identificationprocessor,” Acta Cytol. 19, 286–288 ~1975!.
8. Editorial Office of Analytical and Quantitative Cytology andHistology and The International Academy of Cytology Com-mittee on Quantitative Morphology, “Data on automated cy-tology systems as submitted by their developers,” Anal. Quant.Cytol. Histol. 13, 300–306 ~1991!.
9. A. VanderLugt, “Signal detection by complex spatial filtering,”IEEE Trans. Inf. Theory IT-10, 139–145 ~1964!.
10. D. Psaltis, E. G. Paek, and S. S. Venkatesh, “Optical imagecorrelation with a binary spatial light modulator,” Opt. Eng.23, 698–704 ~1984!.
11. R. M. Turner, D. A. Jared, G. D. Sharp, and K. M. Johnson,“Optical correlator using very-large-scale integrated circuity
modulators,” Appl. Opt. 32, 3094–3101 ~1993!.12. D. Casasent, R. Schaefer, and R. Sturgill, “Optical hit–miss
morphological transform,” Appl. Opt. 31, 6255–6263 ~1992!.13. H. Jing, L. Liu, C. Wang, and C. Zhou, “Logic-operated math-
ematical morphology and its optical implementation,” Appl.Opt. 38, 5605–5612 ~1999!.
14. R. Narayanswamy, R. M. Turner, D. J. McKnight, J. P.Sharpe, and K. M. Johnson, “Optoelectronic hit–miss trans-form for screening cervical smear slides,” Opt. Lett. 20, 1362–1364 ~1995!.
15. R. Narayanswamy and K. M. Johnson, “Optoelectronic regionof interest detection: an application in automated cytology,”Appl. Opt. 37, 6011–6025 ~1998!.
16. M. W. Farn and J. W. Goodman, “Optimal binary phase-onlyfilters,” Appl. Opt. 27, 4431–4437 ~1988!.
17. S. A. Serati, G. D. Sharp, and R. A. Serati, “128 3 128 analogliquid crystal spatial light modulator,” in Optical Pattern Rec-ognition VI, D. P. Casasent and T. Chao, eds., Proc. SPIE 2490,378–387 ~1995!.
18. D. J. McKnight, K. M. Johnson, and M. A. Follett, “Analogdistorted helix ferroelectric liquid-crystal-on-silicon spatiallight modulator,” Opt. Lett. 20, 513–515 ~1995!.
19. K. A. Bauchert, S. A. Serati, G. D. Sharp, and D. J. McKnight,“Complex phaseyamplitude spatial light modulator advancesand use in a multispectral optical correlator,” in Optical Pat-tern Recognition VIII, D. P. Casasent and T. Chao, eds., Proc.SPIE 3073, 170–177 ~1997!.
20. Boulder Nonlinear Systems, Inc., 450 Courtney Way, #107,Lafayette, Co. 80026, USA.
21. D. J. Zahniser, K. L. Wong, J. F. Brenner, H. G. Ball, G. L.Garcia, and M. L. Hutchinson, “Contextual analysis and in-termediate cell markers enhance high-resolution cell imageanalysis for automated cervical smear diagnosis,” Cytometry12, 10–14 ~1991!.
22. O. A. N. Husain, J. H. Tucker, and B. A. P. Roberts, “Automa-tion in cervical cancer screening—part 1: fixed cell scanningsystems,” Biomed. Eng. 11, 161–166 ~1976!.
23. R. C. Gonzalez and R. E. Woods, Digital Image Processing~Addison-Wesley, New York, 1992!.
24. J. W. Goodman, Introduction to Fourier Optics, 2nd ed.~McGraw-Hill, New York, 1996!.
25. Dalsa, Inc., 605 McMurray Road, Waterloo, Ontario N2V 2E9,Canada.
26. National Instruments, 6504 Bridge Point Parkway, Austin,Tex. 78730-5039.
27. N. Collings, W. A. Crossland, P. J. Ayliffe, D. G. Vass, and I.Underwood, “Evolutionary development of advanced liquid-crystal spatial light modulators,” Appl. Opt. 28, 4740–4747~1989!.
28. Dipix Technologies, Inc., 1051 Baxter Road, Ottawa, OntarioK2C 3P1, Canada.
29. P. Yeh, Optical Waves in Layered Media ~Wiley, New York,1988!.
30. S. Chandrasekhar, Liquid Crystals, 2nd ed. ~Cambridge U.Press, Cambridge, 1992!.
10 February 2000 y Vol. 39, No. 5 y APPLIED OPTICS 813