optical whispering-gallery mode …coe papers/cp_76.pdf · wgm sensor, the electrical component,...
TRANSCRIPT

1 Copyright © 2013 by ASME
Proceedings of the ASME 2013 Summer Heat Transfer Conference HT2013
July 14-19, 2013, Minneapolis, MN
HT2013-17245
OPTICAL WHISPERING-GALLERY MODE PHENOMENON AS A COMPOSITE SENSOR WITH APPLICATIONS TO DIRECT ON-CHIP THERMAL SENSING
Matthew Frenkel Department of Mechanical and
Aerospace Engineering Rutgers University
Piscataway, New Jersey 08854
Marlon Avellan Department of Mechanical and
Aerospace Engineering Rutgers University
Piscataway, New Jersey 08854
Zhixiong Guo1 Department of Mechanical and
Aerospace Engineering Rutgers University
Piscataway, New Jersey 08854
1 Address all correspondence to this author.
ABSTRACT Optical Whispering-Gallery Mode (WGM) resonators
can be fabricated with very high quality factors allowing for their use as high resolution sensors in a myriad of fields ranging from quantum electro-dynamics (QED) to pressure sensing. In this paper, we focus on integrating WGM as a dynamic temperature measurement device. The WGM sensors are fabricated onto the heating element, instead of acting as an indirect temperature sensor, allowing for direct monitoring of an area of interest. An adaptation to the WGM theoretical model, to include the thermal expansion of the composite system, is discussed and analyzed. INTRODUCTION
Over the past decade we have seen the use of whispering gallery mode (WGM) sensors explored in a number of different fields. Owing to the high accuracy and extreme sensitivity of the WGM sensors, on-going research into applications in molecular [1,2], temperature [3], pressure [4], and gas sensing [5], are among some of the areas currently being explored. Utilizing WGM devices measurements in temperature have been made with an accuracy of 10-3 K [6], chemical residues have been detected at pico-molar levels [7], and individual RNA viruses have been sensed [8]. The ability of the WGM sensor to detect changes at such a high sensitivity is because, unlike many other common sensors that are based on intensity, the measurements taken by a WGM sensor are based upon shifts in frequency.
A WGM device consists of near-field light coupled into a dielectric resonator. This resonator consists of a curved geometry allowing for coupled light at certain frequencies to be trapped inside the resonator by total internal reflection. In addition, due to the boundary conditions between the resonator, normally ranging from a few microns to several 100 microns, and
the coupler, an evanescent field outside of the resonator also exists. The device is sensitive to any changes in either the evanescent field or the field within the resonator, allowing for the large range of sensor applications.
In the past, studies of WGM sensors for temperature measurements have been done by placing a WGM working unit inside of a temperature-controlled chamber. These experiments yield excellent results for understanding the sensitivity of a WGM temperature sensor, but they limit the sensor from measuring the temperature of specific components found inside the local environment. The focus of this paper is on the direct integration of WGM based temperature sensors onto heating components. By fabricating the WGM resonator directly onto an element of interest, we can directly monitor its temperature in real time through the shifts in the resonance frequencies of the WGM resonator. This paper discusses changes to the current WGM theory in order to incorporate the composite nature of the resonator, as well as, effects caused by introducing the resonator onto the component of interest.
EXPERIMENTAL SETUP The experimental setup is composed of four parts: the WGM sensor, the electrical component, the chamber, and the data acquisition system. The WGM sensor has two distinct parts. The first is the optical coupling device. In this setup, we used a taper optical fiber, approximately 0.5µm in diameter, fabricated via the heat and pull method [3]. For the WGM resonator, we used polydimethylsiloxane (PDMS). PDMS was prepared with a 10:1 mixing ratio and then degassed before applied to the electrical component. We used a 36-gauge (127 µm diameter) nichrome wire (McMaster) as the electrical component. Resonators were fabricated directly onto the nichrome wire by dipping a stripped and cleaned optical fiber into the PDMS allowing a bead to form
2 Copyright © 2013 by ASME
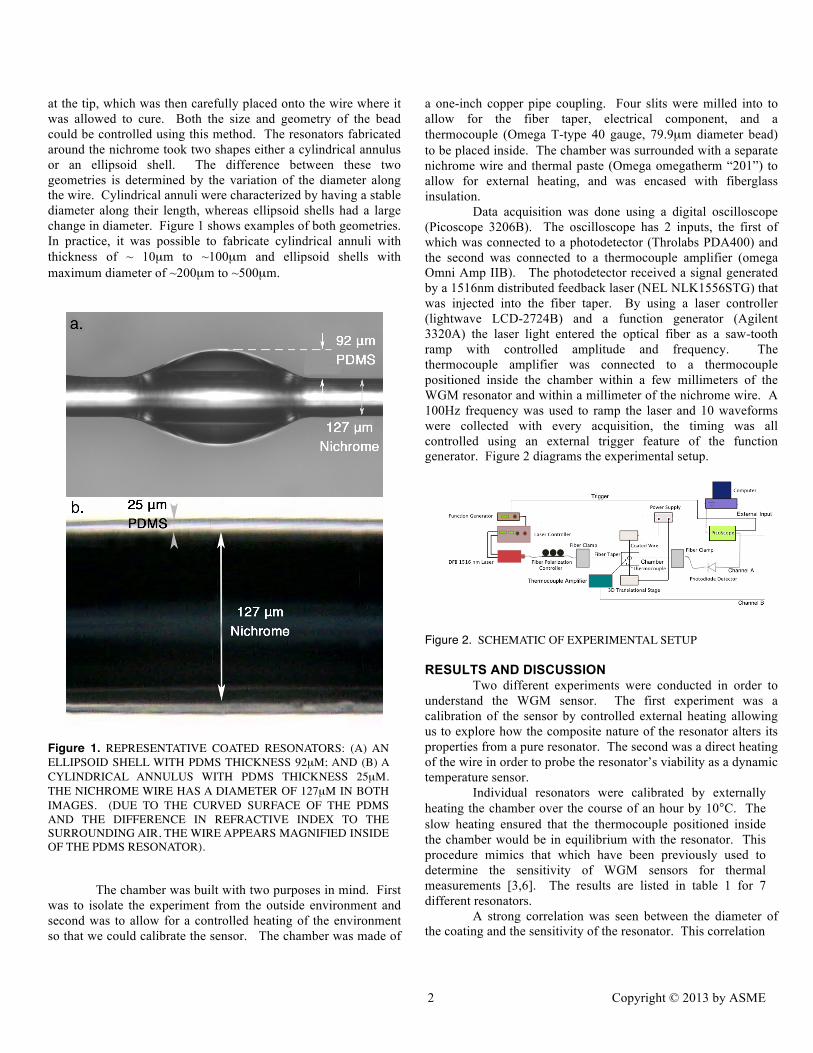
at the tip, which was then carefully placed onto the wire where it was allowed to cure. Both the size and geometry of the bead could be controlled using this method. The resonators fabricated around the nichrome took two shapes either a cylindrical annulus or an ellipsoid shell. The difference between these two geometries is determined by the variation of the diameter along the wire. Cylindrical annuli were characterized by having a stable diameter along their length, whereas ellipsoid shells had a large change in diameter. Figure 1 shows examples of both geometries. In practice, it was possible to fabricate cylindrical annuli with thickness of ~ 10µm to ~100µm and ellipsoid shells with maximum diameter of ~200µm to ~500µm.
Figure 1. REPRESENTATIVE COATED RESONATORS: (A) AN ELLIPSOID SHELL WITH PDMS THICKNESS 92µM; AND (B) A CYLINDRICAL ANNULUS WITH PDMS THICKNESS 25µM. THE NICHROME WIRE HAS A DIAMETER OF 127µM IN BOTH IMAGES. (DUE TO THE CURVED SURFACE OF THE PDMS AND THE DIFFERENCE IN REFRACTIVE INDEX TO THE SURROUNDING AIR, THE WIRE APPEARS MAGNIFIED INSIDE OF THE PDMS RESONATOR).
The chamber was built with two purposes in mind. First was to isolate the experiment from the outside environment and second was to allow for a controlled heating of the environment so that we could calibrate the sensor. The chamber was made of
a one-inch copper pipe coupling. Four slits were milled into to allow for the fiber taper, electrical component, and a thermocouple (Omega T-type 40 gauge, 79.9µm diameter bead) to be placed inside. The chamber was surrounded with a separate nichrome wire and thermal paste (Omega omegatherm “201”) to allow for external heating, and was encased with fiberglass insulation.
Data acquisition was done using a digital oscilloscope (Picoscope 3206B). The oscilloscope has 2 inputs, the first of which was connected to a photodetector (Throlabs PDA400) and the second was connected to a thermocouple amplifier (omega Omni Amp IIB). The photodetector received a signal generated by a 1516nm distributed feedback laser (NEL NLK1556STG) that was injected into the fiber taper. By using a laser controller (lightwave LCD-2724B) and a function generator (Agilent 3320A) the laser light entered the optical fiber as a saw-tooth ramp with controlled amplitude and frequency. The thermocouple amplifier was connected to a thermocouple positioned inside the chamber within a few millimeters of the WGM resonator and within a millimeter of the nichrome wire. A 100Hz frequency was used to ramp the laser and 10 waveforms were collected with every acquisition, the timing was all controlled using an external trigger feature of the function generator. Figure 2 diagrams the experimental setup.
Figure 2. SCHEMATIC OF EXPERIMENTAL SETUP RESULTS AND DISCUSSION
Two different experiments were conducted in order to understand the WGM sensor. The first experiment was a calibration of the sensor by controlled external heating allowing us to explore how the composite nature of the resonator alters its properties from a pure resonator. The second was a direct heating of the wire in order to probe the resonator’s viability as a dynamic temperature sensor.
Individual resonators were calibrated by externally heating the chamber over the course of an hour by 10°C. The slow heating ensured that the thermocouple positioned inside the chamber would be in equilibrium with the resonator. This procedure mimics that which have been previously used to determine the sensitivity of WGM sensors for thermal measurements [3,6]. The results are listed in table 1 for 7 different resonators.
A strong correlation was seen between the diameter of the coating and the sensitivity of the resonator. This correlation

3 Copyright © 2013 by ASME
Table 1. THE SENSITIVITY OF SIX DIFFERENT DIAMETER MICRO-RESONATORS, TWO CILINDRICAL ANNULI (THE SMALLEST
TWO) AND 4 ELLIPSIOD SHELL.
Resonator Diameter (µm) Sensitivity (nm/K) Correlation Coefficient 172 -0.0657 ± 0.0036 0.99981 194 0.0160 ± 0.0009 0.99837 295 0.0820 ± 0.0045 0.99930 345 0.0874 ± 0.0048 0.99994 360 0.0932 ± 0.0051 0.99990 392 0.0981 ± 0.0054 0.99930 512 0.1078 ± 0.0059 0.99979
does not appear when the resonator is made from a pure material, and can be explained by reevaluating the WGM theory of resonance shifts to incorporate a composite material. The current equation used to define the shifts in resonance found in a homogenous resonator due to temperature is:
(1)
where n, D, λ0, and T are the index of refraction of the resonator, resonator diameter, laser wavelength, and temperature respectively, α and β represent the thermal optical and thermal expansion coefficients. In order to explain the relationship between coating thickness and resonator sensitivity, we need to examine how the thermal optical and thermal expansion coefficients are altered because of the composite nature of our device. There are two factors that justify ignoring an effective thermal optical coefficient. Li et al. [9] demonstrated that an effective thermal optical coefficient could be determined through the energy fractions of the resonating light found in the different materials of the composite sensor. They also found that a coating of less than three microns results in over 97% of all energy being contained in the coating. Since the coatings we used have a minimum thickness of several tens of microns, we can assume all the energy is contained within the coating. Secondly, even if a thinner coating had been used there would be no energy fraction found in the nichrome wire because it is a conductor. In order to determine the effective thermal expansion, we adopt a similar equation put forth by Tummala and Friedberg [10] for a spherical composite system. Their relationship was:
(2)
here the subscripts 1 and 2 refer to the nichrome and PDMS respectively. E is the Young’s modulus, v represents the Poisson ratio, and V1 is the volume fraction of the nichrome. It can be
seen from the volume fraction present in equation 2 that the temperature based sensitivity of the wavelength shift will have an asymptotic behavior as the coating thickness increases. This matches with the experimental results seen in Table 1. Direct heating took place by running a current through the coated wire. Using a current of 0.03, 0.04, and 0.05 amps the heating of the wire was kept in the range of the calibrations. Through a steady state heat analysis, the temperature of the coated wire can be determined at both nichrome/PDMS and the PDMS/air interfaces. Figure 3 shows experimental results of the steady state temperature as measured by the WGM sensor plotted against the theoretical temperature at both interfaces based on the coating thickness.
FIGURE 3. Plots the steady state temperature of the nichrome-PDMS (dotted) and PDMS-air (solid) interface temperatures. The temperatures are determined for currents of 0.03A (blue, lowest), 0.04A (purple, middle), and 0.05A (orange, top). Experimental temperature measured by the WGM sensor are also shown. Figure 3 demonstrates that the WGM sensor measures a temperature in between that of the two interfaces. The reason for this is that the resonating light is contained within the coating where the temperature is varying between that of the two interfaces. Our experimental results have an average error of 1.7% when compared to the average temperature inside the PDMS layer. Figure 4 shows how the percent error of the average PDMS coating temperature, when compared to the uncoated wire, increases with increasing coating thickness. It

4 Copyright © 2013 by ASME
can be seen that keeping the coating thickness under 30 microns reduces this error to below 5%.
Figure 4. PERCENT ERROR OF THE COATED SYSTEM WHEN COMPARED TO THE UNCOATED SYSTEM.
A transient test was conducted where the system was heated by running a current (the same as previously discussed) through the coated wire and cooled by turning the current off and allowing the system to relax. Data was collected every two to three seconds during the heating and cooling and compared with theoretical models of the heating and cooling wire. This data is seen in Figure 5. It is clear from Fig. 5 and Fig. 3 that the WGM sensor can be used to accurately measure the temperature of the coated wire in both the transient and steady state case.
To compensate for the temperature difference between the two interfaces, as seen in Fig. 3, a material with a higher thermal conductivity could be used. Silica based resonators would reduce this difference to less the 1%. The only way to reduce the error caused by adding the coating, as seen in Fig. 4, would be to reduce the overall thickness of the coating. A thickness of less than 30 microns would reduce the error to below 5%, and theoretically a WGM resonance should be achievable with a thickness of less than 10 microns, where the errors would be below 2%. In order to achieve a high quality coating of this thickness other fabrication techniques must be utilized such as the method used by Li et al. [9] We are currently investigating the use of the sol-gel processes to grow dielectric thin films onto our heating elements. The sol-gel process can be used to create resonators from materials other then PDMS such as silica. This process also allows for thicknesses of less then 30 microns to be fabricated.
ACNOWLEDGMENTS
We acknowledge support to the work by the National Science Foundation under Grant No. CBET- 1067141. We would also like to thank John Petrowski and Joseph Vanderveer for their assistance in machining the chamber.
Figure 5. HEATING (A) AND COOLING (B) DATA ATTAINED FOR A 295 µM WIRE AT THREE DIFFERENT CURRENTS. THE SOLID LINES REPRESENT THEORETICAL PREDICTIONS.
REFERENCES [1] Vollmer, F, and Arnold, S., 2008, “Whispering-
gallery- mode biosensing: label-free detection down to single molecules.” Nature Methods 5, pp. 591 - 596.
[2] Quan, H., and Guo, Z., 2007 “Simulation of single transparent molecule interaction with optical microcavity”. Nanotechnology 18, (375702).
[3] Ma, Q., Rossmann, T., and Guo, Z., 2008, “Temperature sensitivity of silica micro-resonators,” J. Phys. D: Appl. Phys., 41, (245111).
[4] Ioppolo, T., Kozhevnikov, M., Stepaniuk, V., Otugen, M., and Sheverev, V., 2008 “Micro-optical force sensor concept based on whispering gallery mode resonators.” App. Opt. 47, pp. 3009-3014.
[5] Ma, Q., Huang, L., and Guo, Z., 2010,“Spectral shift response of optical whispering-gallery modes due to water vapor adsorption and desorption.” Meas. Sci. Technol. 21, (115206).
[6] Ma, Q., Rossmann, T., and Guo, Z., 2010, “Whispering-gallery mode silica microsensors for cryogenic to room temperature measurement”, Meas. Sci. Technol. 21, (025310).

5 Copyright © 2013 by ASME
[7] Huang, L., and Guo, Z., 2012, “Nanofiltration and sensing of picomolar chemical residues in aqueous solution using optical porous resonator in microelectrofluidic channel,” Nanotechnology 23, (065502).
[8] Dantham, V., Holler, S., Kolchenko, V., Wan, Z., and Arnold, S., 2012, “Taking whispering gallery-mode single virus detection and sizing to the limit.” Appl. Phys. Lett. 101, (043704).
[9] Li, B. B., Wang, Q. Y., Xiao, Y. F., Jiang, X. F, Li, Y. Xiao, L., and Cong, Q., 2010, “On chip, high-sensitivity thermal sensor based on high-Q polydimethylsiloxane-coated microresonator,” Appl. Phys. Lett. 96, (251109).
[10] Tummala, R. R., and Friedberg A. L., 1970, “Thermal Expansion of Composite Materials”. J. Appl. Phys. 41, pp. 5104-5107.