optical properties of titanium substituted manganese … · optical properties of titanium...
TRANSCRIPT
International Research Journal of Pure and Applied Physics
Vol.3, No.2, pp.28-40, September 2015
___Published by European Centre for Research Training and Development UK (www.eajournals.org
28 ISSN 2055-009X(Print), ISSN 2055-0103(Online)
OPTICAL PROPERTIES OF TITANIUM SUBSTITUTED MANGANESE -ZINC
FERRITE SYSTEM- MN0.8+X ZN0.2TIXFE2-2XO4 WITH X=0.10
Satheesh D J1, Vasudevan Nair N2 , Jayakumari Isac3*
1Centre for Condensed Matter, Department of Physics, CMS College, Kottayam, India 2Department of Physics, M. G College, Trivandrum, Kerala.
3*Department of Physics, CMS College, Kottayam, 686001, India.
ABSTRACT: Titanium substituted Manganese-Zinc ferrite (Mn0.8+x Zn0.2TixFe2-2xO4 with
x=0.10) was synthesized thermo chemically by solid state method at different treating
temperatures. Basically, the substitution cause a rearrangement of Fe+3 ions into the two
preexisting octahedral and tetrahedral sites. The X-ray analysis confirms the formation of
single phase cubic spinel structure. The lattice constant decreases slightly and porosity
increases with increase in sintering temperature. They can be disrupted into smaller particles
by shear forces generating mechanical stress gradients. A characteristic feature of all solid-
state reactions is that they involve the formation of product phase(s) at the interfaces of the
reactants. UV-VIS analysis of the sample was carried out. Tunable band gaps can be obtained
by varying annealing temperatures. The optical constants of refractive index, extinction
coefficient, normal-incidence reflectivity, and absorption coefficient showed systematic
variation with temperature. The dispersion of refractive index was analyzed by the Wemple-
DiDomenico single-oscillator model.
KEYWORDS: MnZnTiFeO, band gap energy, Dispersion, Wemple-DiDomenico model,
refractive index.
INTRODUCTION
Ferrite crystals are interesting materials due to their rich physical properties. Spinel ferrites,
with common formula of MFe2O4 (M: a divalent metal ion), have wide technological
applications, e.g., in multilayer chip inductor (MLCI), ferrofluids, high-speed digital tape or
recording disks, rod antenna, and humidity sensor. The effects of Ti4+ ions substitution on the
magnetic, electric and dielectric properties of ferrites were reported by many authors [1–6].
Many different optical properties of ceramic products are of concern in different applications
[7]. The optical properties of dielectric materials are generally of interest because of their good
transmission in the optical part of the spectrum as compared with other classes of materials. At
short wavelengths this good transmission is terminated at the ultraviolet absorption edge, which
corresponds to radiation energies and frequencies (E=hv=hc/λ) where absorption of energy
arises from electronic transitions between levels in the valence band to unfilled states in the
conduction band. Both the index of absorption and refractive index are necessary to describe
the optical properties of a ceramics. The absorption index is a function of wavelength and is
mostly related to the absorption coefficient β=4πk/λ. For a single-phase material, the fraction
of light transmitted is given by the absorption coefficient and sample thickness; dI/I0=-βdx and
T=I/I0=exp(-βx), LnI/I0=-βx where I0 is the initial density, I is the transmitted intensity, x is
the optical path length and T is the fraction transmitted. This overall transmission is given for
normal incidence by T1=Iin/Iout=(1-R)2exp (-βx) Where R is the reflectivity[8]. In solid state
physics a band gap, is an energy range in an ideal solid where no electron states can exist. In
International Research Journal of Pure and Applied Physics
Vol.3, No.2, pp.28-40, September 2015
___Published by European Centre for Research Training and Development UK (www.eajournals.org
29 ISSN 2055-009X(Print), ISSN 2055-0103(Online)
the present work the authors describes the optical behavior and band gap energy of Mn0.8+x
Zn0.2TixFe2-2xO4 with x=0.10 crystalline material. The energy band gap values of the sample
were analyzed for different temperatures and they are fundamentally important to the design
of practical devices. In the case of insulators the band gap energy is large (>4eV), but is lower
for semiconductors (<3eV). Measuring the band gap is an important factor determining the
electrical conductivity.
The band gap energy values obtained using Tauc plot showed a direct relation with
temperature. The optical constants of absorption coefficient, extinction coefficient, and
refractive index showed a systematic variation with temperature. The dispersion of refractive
index was analyzed by the Wemple-DiDomenico single-oscillator model and such optical
behaviour is rarely reported. The dispersion of the refractive index results from the fact that the
visible spectrum is adjacent to the natural frequency of electronic oscillators in the ultraviolet.
The index increases with decreasing wavelength in the visible range, and is referred to as
normal dispersion [8].Refractive index of material determines the speed of light in the material.
It is an important constant for optoelectronic devises as it would responsible for the nature of
interaction of the material with the optical energy incident on it. The absorption coefficient, α,
is a property of a material which defines the amount of light absorbed by it. The extinction
coefficient denoted by K was calculated according to the equation: K = αλ/4π[9].
EXPERIMENTAL
Titanium substituted Manganese-Zinc ferrite (Mn0.8+x Zn0.2TixFe2-2xO4 with x=0.10) was
synthesized by the conventional solid state reaction technique according to their molecular
formula using a high-energy ball milling process through mechanically assisted synthesis. The
initial ingredients MnO, ZnO, TiO2, Fe2O3 were weighed and mixed in correct Stoichiometric
ratio and grounded for ten hours using an agate mortar. The resulting mixture was air dried and
presintered in air for 10 hours. Temperature is controlled by a platinum-Rhodium thermocouple
within the furnace. The presintered ferrites were then again grounded for two to three hours.
The granulated powder was then pressed into pellets and toroids at a pressure of 1N/M2 with
the help of hydraulic press. The binder used was polyvinyl alcohol solution. After milling, the
material was calcined at four different temperatures, 30˚C, 500˚C, 800˚C & 950˚C in a special
furnace with oxygen flow arrangements. The temperature of the furnace was increased in steps.
After each step the ceramics was grinded well before heating. High temperature is needed for
metal oxide phase transformations [10]. The optical transmission characteristics were
measured using a double beam ultraviolet–visible (UV–Vis.) spectrophotometer.
UV-VIS. Analysis
Photoluminescence spectroscopy is measured at room temperature to detect the optical
properties. The optical absorption and reflectance spectrum of the sample were studied at room
temperature. The UV analysis can be thought as a good quality check for the optical behaviour
of the ferrites. The optical absorption data were analyzed using the classical relation for near
edge optical absorption of semiconductors [11-12]. The sample obtained after calcinations at
different temperatures was subjected to UV-VIS-Near IR analysis (Fig.1) using Varian, Cary
5000 Spectrophotometer over a spectral range of 175-3300nm with an accuracy of ±0.1nm
(UV-Vis.).The optical band gap of the system has been estimated from these absorption
spectra. This type of sample has high mechanical hardness, high thermal conductivity, large
International Research Journal of Pure and Applied Physics
Vol.3, No.2, pp.28-40, September 2015
___Published by European Centre for Research Training and Development UK (www.eajournals.org
30 ISSN 2055-009X(Print), ISSN 2055-0103(Online)
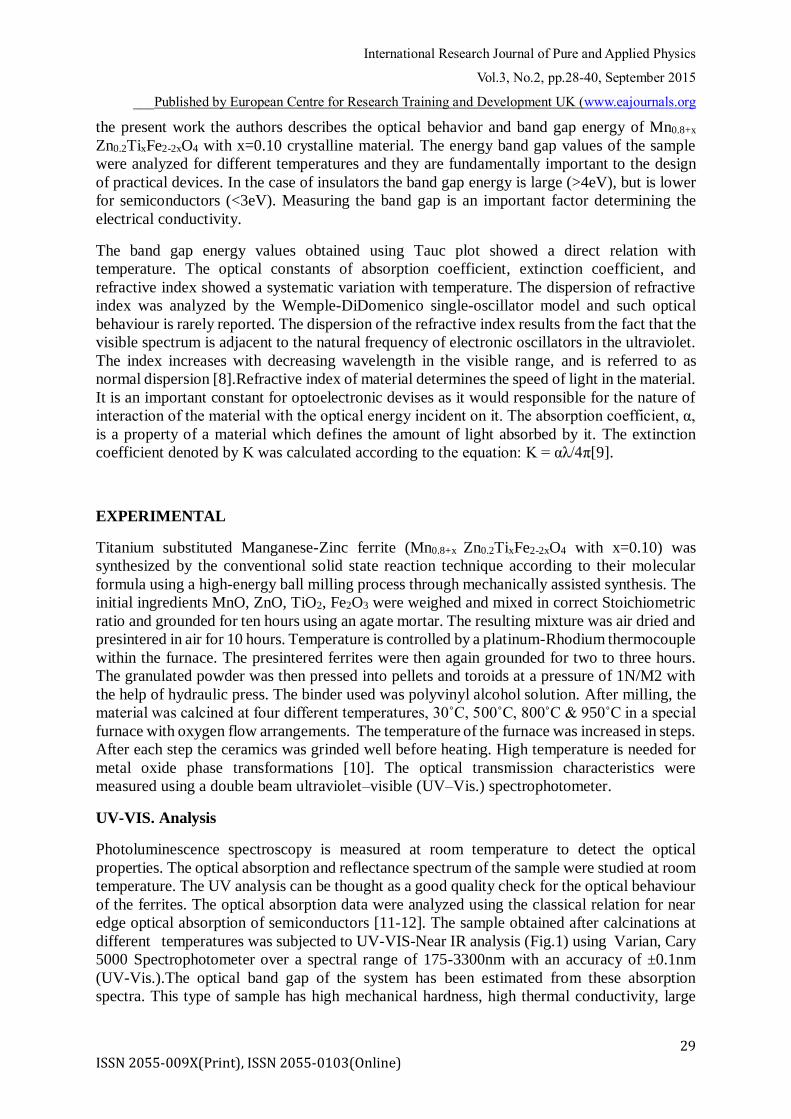
dielectric constant, and high resistance to harsh environment. Figure.1 shows the UV-VIS
behaviour of the sample at 9500C.UV-Visible spectrum give information about the excitonic
and inter transition[13]. The transmittance of a sample is defined as the fraction of photons that
pass through the sample over the incident number of photons, i.e., T = I/I0. In a typical UV/Vis
spectroscopy measurement, we are measuring those photons that are not absorbed or scattered
by the sample. It is common to report the absorbance (A) of the sample, which is related to the
transmittance by A = -log10(T)[14]. Figure 1 illustrates the variation of optical band gap with
the increase of Ti concentration. In the near IR, where the sample does not absorb strongly, the
transmittance is close to 100%. In the UV portion of the spectrum, where the sample absorbs
strongly, the transmittance drops to around 10% or less.
Figure.1 UV-VIS spectrum of Mn0.8+x Zn0.2TixFe2-2xO4 with x=0.10 (reflectance and
absorbance)
International Research Journal of Pure and Applied Physics
Vol.3, No.2, pp.28-40, September 2015
___Published by European Centre for Research Training and Development UK (www.eajournals.org
31 ISSN 2055-009X(Print), ISSN 2055-0103(Online)
The Kubelka-Munk method is used to translate the diffuse reflectance spectra into the
absorption spectra. Kubelka-Munk’s equation is described as follows: α =(1-R)2/2R--- (1), α
where is the absorption coefficient and R the reflectivity at a particular wavelength[13].
To calculate the band gap of the synthesized material using Tauc’s relation the absorption
spectra is used as (αhν)1/n = A (hν-Eg ), where A is a constant and Eg is the band gap of the
materials and exponent n depends on the type of transition. For direct allowed transition n=1/2,
indirect allowed transition n=2, direct forbidden transition n=3/2 and forbidden indirect
transition n=3 [14]. To determine the possible transitions, (αhν)2 versus hν is plotted and
corresponding band gap were obtained from extrapolating the straight portion of the graph on
hν axis[15].
According to the Tauc relation, the absorption coefficient α for a material is given by α =
A(hṿ - Eg)n--(2), Where Eg the band gap, constant A is different for different transitions, (hv)
is energy of photon in eV and n denotes the nature of the sample transition[16]. The band gap
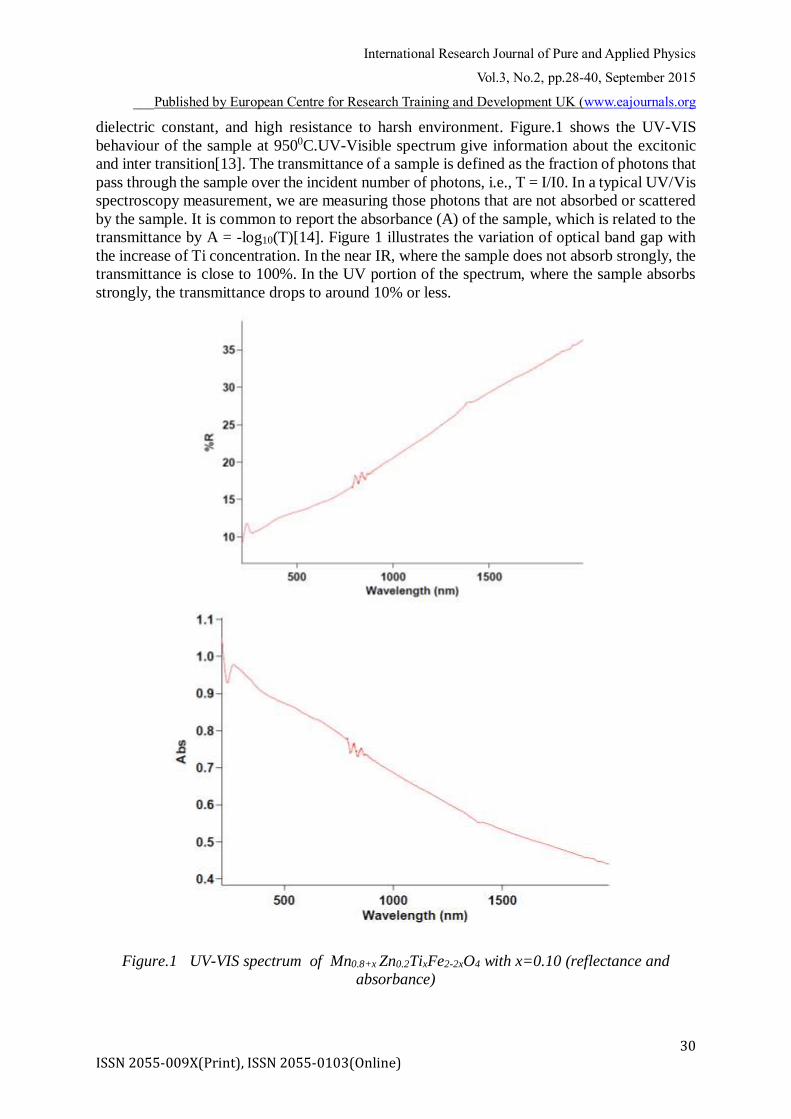
energy can be determined using the Tauc relation. The region A of the TAUC plot defines the
optical band gap of a sample as in fig.2.The tauc plot of the above sample is traced in Fig 3. It
is noted that the optical gap energy of nano – sized crystal depends on its crystallite size, it
increases with decreasing crystallite size in the nano size range [17,18].
Fig.2- Photon energy versus log of absorption coeft.
The absorption coefficient at the photon energy below the optical gap (tail absorption) depends
exponentially on the photon energy: α(ħv) ~ exp (ħ v/Eu)--(4)where Eu is called Urbach
energy.The Urbach energy is less than the band gap energy.The region B in the fig.2 represents
the Urbach energy. The absorption edge called the Urbach energy, depends on, induced
disorder, static disorder, temperature, thermal vibrations in the lattice, strong ionic bonds and
on average photon energies [18]. The edge arises due to a radiative recombination between
trapped electrons and trapped holes in tail and gap states as shown in Fig.2, and is dependent
International Research Journal of Pure and Applied Physics
Vol.3, No.2, pp.28-40, September 2015
___Published by European Centre for Research Training and Development UK (www.eajournals.org
32 ISSN 2055-009X(Print), ISSN 2055-0103(Online)
on the degree of thermal disorder and structural [19]. It is noted in manycases that optical
absorption by defects also appears at (region C of fig.2) energy lower than optical gap. This
region is related to the structural properties of materials[20].
Dispersion and Refractive Index
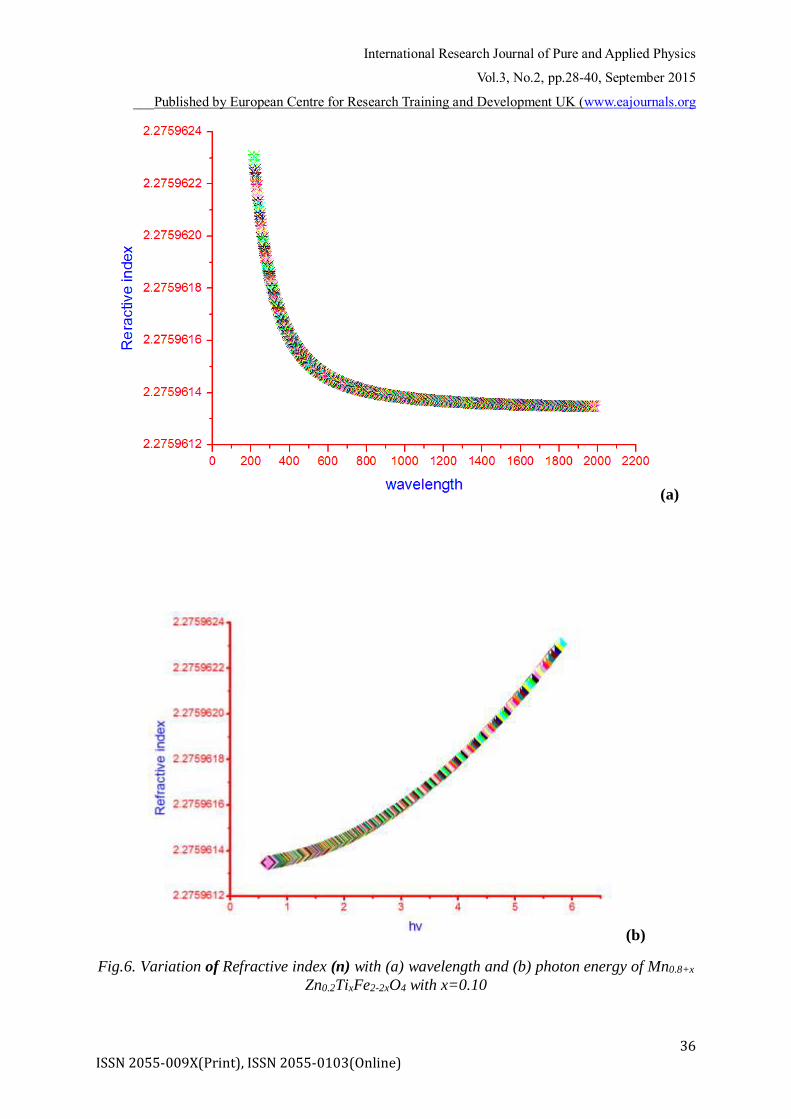
It is found that with the increase in wavelength refractive index decreases linearly. The
variation of the dispersion curve with annealing temperatures is shown in Fig.7. Refractive
index increases with increase in annealing temperature and attains a constant value after a
certain wavelength value. In figure (6), a graph with wavelength along X axis and refractive
index along Y axis is plotted. Here refractive index values showed a linear decrease with
increase in wavelength.
Using the Wemple-DiDomenico(W-D) model the dispersion of refractive index below the inter
band absorption edge is studied[22]. In this W-D model, the refractive index n can be written
as n2 -1= Ed E0/ (Ed2-E2 ) -- (5),where E is the photon energy, Eo is the oscillator energy, and
Ed is the dispersion energy. Wemple and DiDomenico reported that the dispersion energy may
depend upon the charge distribution within each unit cell, and that it would be closely related
to chemical bonding [22]. The oscillator energy Eo and dispersion energy Ed are obtained from
the slope (EoEd)-1 and intercept Eo/Ed on the vertical axis of the straight line portion of (n2-1)-1
versus E 2plot. By evaluating equation(5) we get the equation as n2(0)=1+Ed/Eo— (6) [23].Thus
the static refractive index n(0) at zero photon energy is noted.
RESULTS AND DISCUSSION
The UV-VIS analysis revealed that band gap energy of the prepared sample increases as the
annealing temperature is increased. The optical analysis of the sample prepared by solid state
reaction technique and treated at different temperatures is successfully done using UV-VIS
Spectrophotometer. Here the direct allowed transitions are considered. In table-1 the calculated
values of the band gap energies of the sample at different values of temperatures is tabulated.
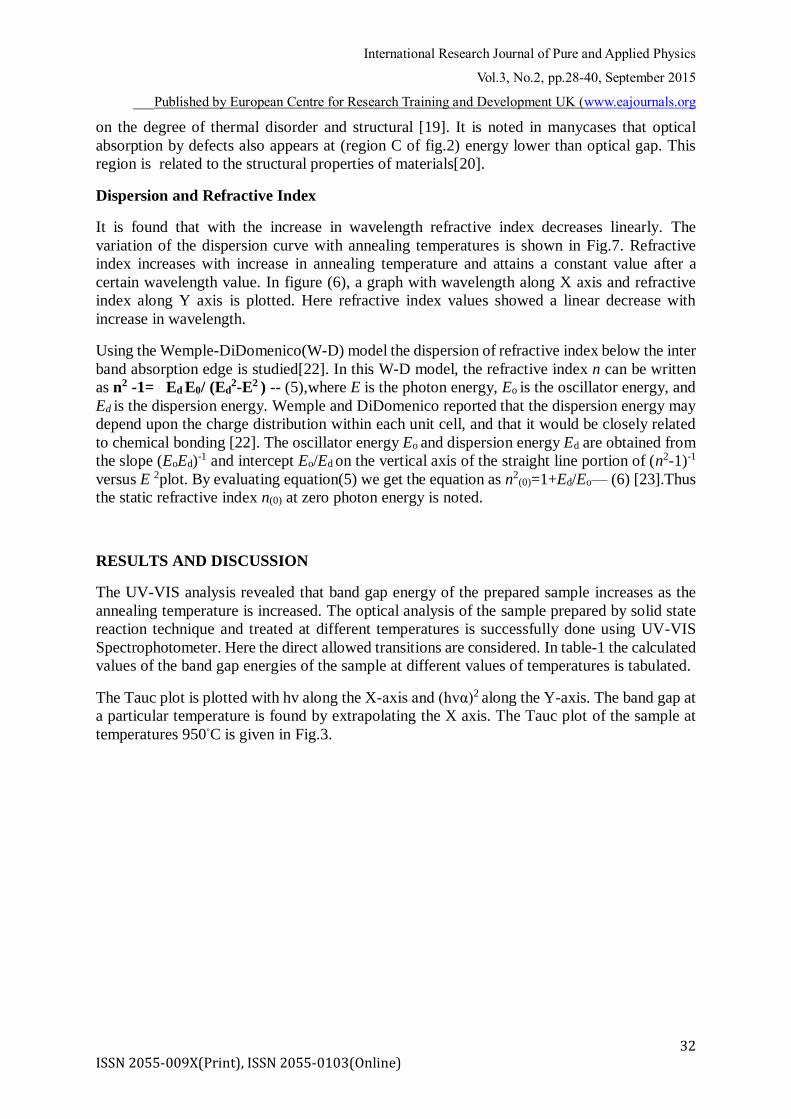
The Tauc plot is plotted with hv along the X-axis and (hvα)2 along the Y-axis. The band gap at
a particular temperature is found by extrapolating the X axis. The Tauc plot of the sample at
temperatures 950◦C is given in Fig.3.
International Research Journal of Pure and Applied Physics
Vol.3, No.2, pp.28-40, September 2015
___Published by European Centre for Research Training and Development UK (www.eajournals.org
33 ISSN 2055-009X(Print), ISSN 2055-0103(Online)
Fig.3.The Tauc plot of Mn0.8+x Zn0.2TixFe2-2xO4 with x=0.10
Table-1. Band gap energy values of Mn0.8+x Zn0.2TixFe2-2xO4 with x=0.10 at different
temperatures
Temperature Band gap energy in eV
30◦C 4.14
500◦C 4.21
800◦C 4.30
950◦C 4.35
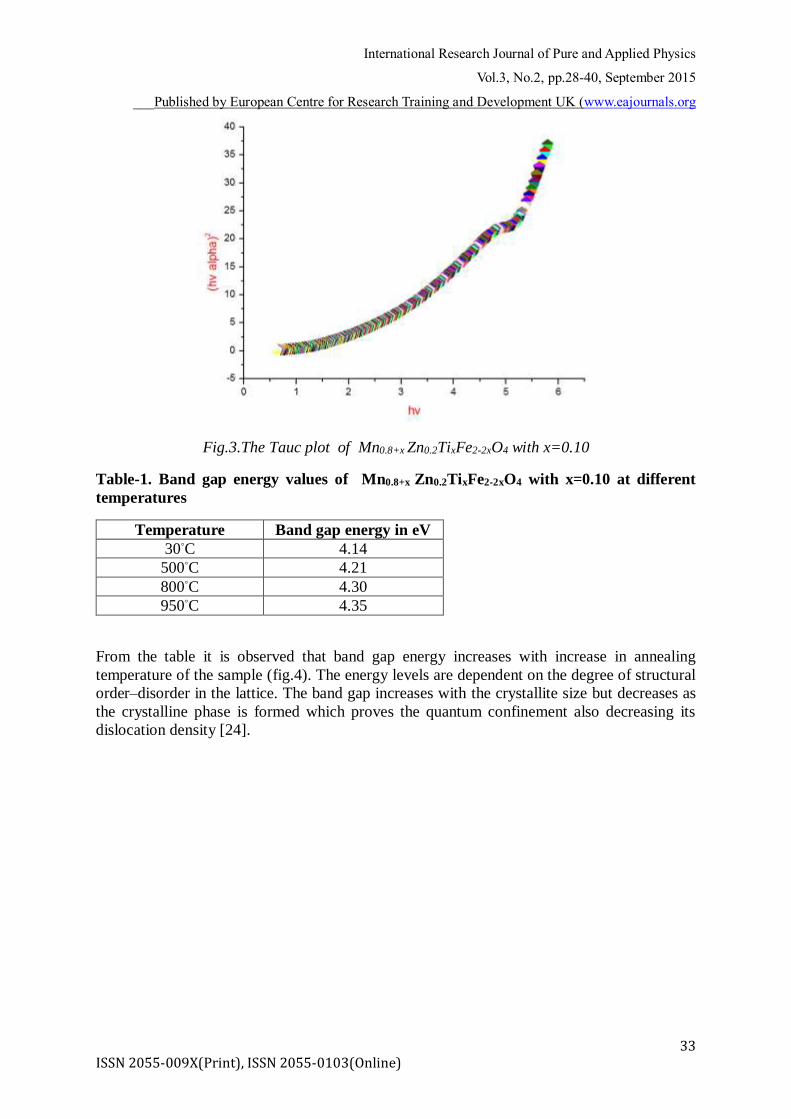
From the table it is observed that band gap energy increases with increase in annealing
temperature of the sample (fig.4). The energy levels are dependent on the degree of structural
order–disorder in the lattice. The band gap increases with the crystallite size but decreases as
the crystalline phase is formed which proves the quantum confinement also decreasing its
dislocation density [24].
International Research Journal of Pure and Applied Physics
Vol.3, No.2, pp.28-40, September 2015
___Published by European Centre for Research Training and Development UK (www.eajournals.org
34 ISSN 2055-009X(Print), ISSN 2055-0103(Online)
Fig.4.Variation of Band gap energy of the sample at varied annealing temperatures of
Mn0.8+x Zn0.2TixFe2-2xO4 with x=0.10
Due to an increase in temperature the crystallite size also increases which shows an increase in
band gap energy[24].From theTauc plot data it is confirmed that the band gap energy of the
sample increases slightly when the temperature is increased. The energy levels are dependent
on the degree of structural order–disorder in the lattice. The band gap energy Eg consequently
increases.
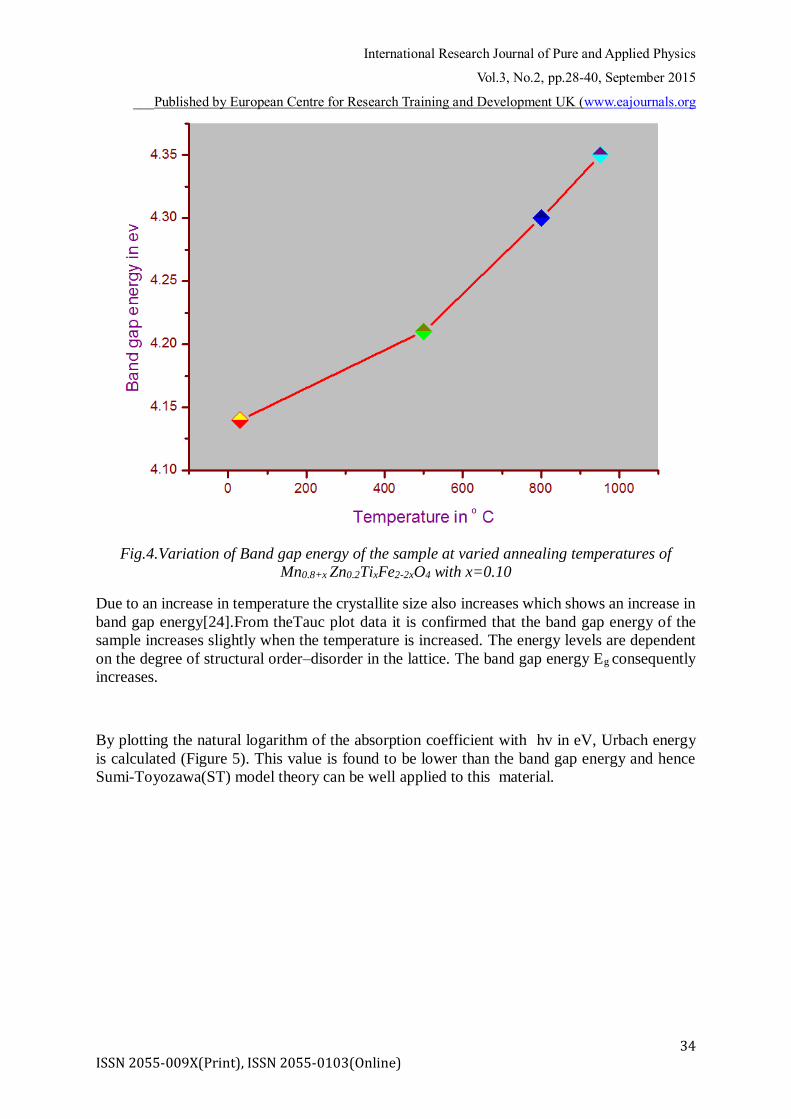
By plotting the natural logarithm of the absorption coefficient with hv in eV, Urbach energy
is calculated (Figure 5). This value is found to be lower than the band gap energy and hence
Sumi-Toyozawa(ST) model theory can be well applied to this material.
International Research Journal of Pure and Applied Physics
Vol.3, No.2, pp.28-40, September 2015
___Published by European Centre for Research Training and Development UK (www.eajournals.org
35 ISSN 2055-009X(Print), ISSN 2055-0103(Online)
Fig.5. Absorption variation with photon energy of Mn0.8+x Zn0.2TixFe2-2xO4 with x=0.10
The refractive index of the sample at different values of temperature was also studied. From
the analysis it is observed clearly that refractive index of the sample decreases as the
wavelength increases and attains a definite value at all temperatures. This linear variation of
the refractive index with the wavelength is due to dispersion of light energy at the different
interstitial layers. The refractive index also shows a linear relation with the photon energy
(fig.6).The increase in refractive index is due to crystallization of the phase. The refractive
index is known to be proportional to their electronic polarization per unit volume which is
inversely proportional to distance between atomic planes. The above result can also be
explained by an increase in crystallite size.
International Research Journal of Pure and Applied Physics
Vol.3, No.2, pp.28-40, September 2015
___Published by European Centre for Research Training and Development UK (www.eajournals.org
36 ISSN 2055-009X(Print), ISSN 2055-0103(Online)
(a)
(b)
Fig.6. Variation of Refractive index (n) with (a) wavelength and (b) photon energy of Mn0.8+x
Zn0.2TixFe2-2xO4 with x=0.10
International Research Journal of Pure and Applied Physics
Vol.3, No.2, pp.28-40, September 2015
___Published by European Centre for Research Training and Development UK (www.eajournals.org
37 ISSN 2055-009X(Print), ISSN 2055-0103(Online)
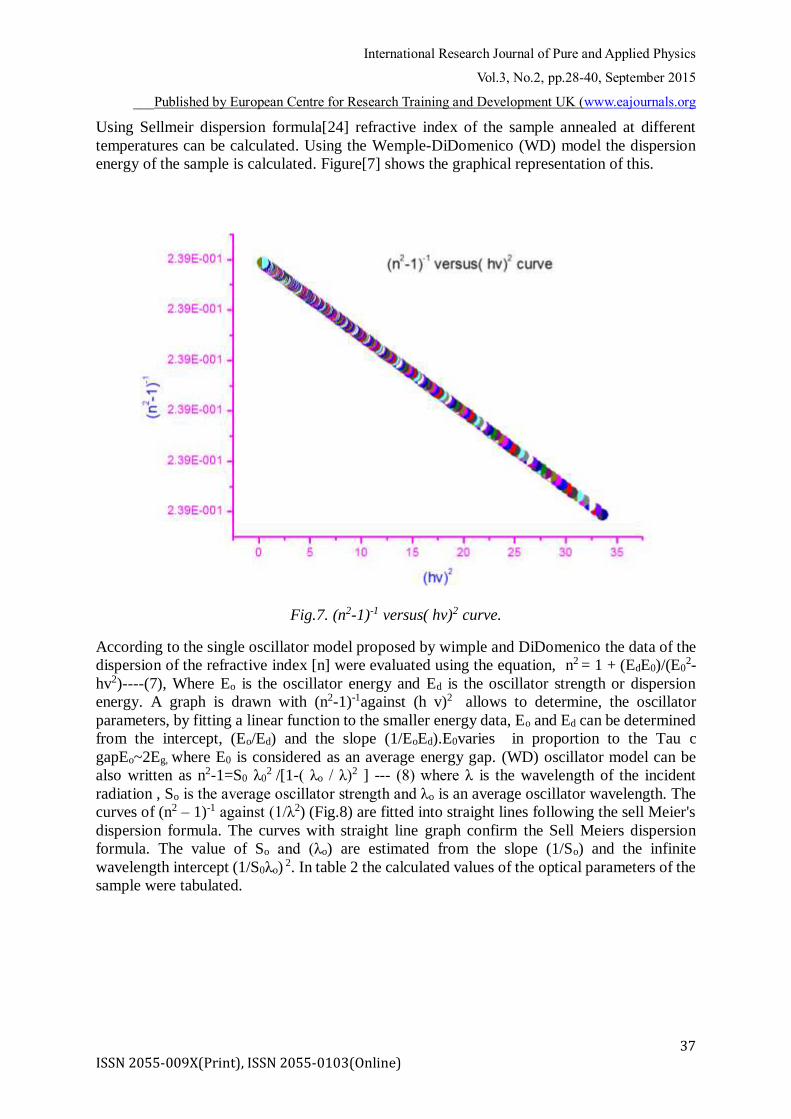
Using Sellmeir dispersion formula[24] refractive index of the sample annealed at different
temperatures can be calculated. Using the Wemple-DiDomenico (WD) model the dispersion
energy of the sample is calculated. Figure[7] shows the graphical representation of this.
Fig.7. (n2-1)-1 versus( hv)2 curve.
According to the single oscillator model proposed by wimple and DiDomenico the data of the
dispersion of the refractive index [n] were evaluated using the equation, n2 = 1 + (EdE0)/(E02-
hv2)----(7), Where Eo is the oscillator energy and Ed is the oscillator strength or dispersion
energy. A graph is drawn with (n2-1)-1against (h v)2 allows to determine, the oscillator
parameters, by fitting a linear function to the smaller energy data, Eo and Ed can be determined
from the intercept, (Eo/Ed) and the slope (1/EoEd).E0varies in proportion to the Tau c
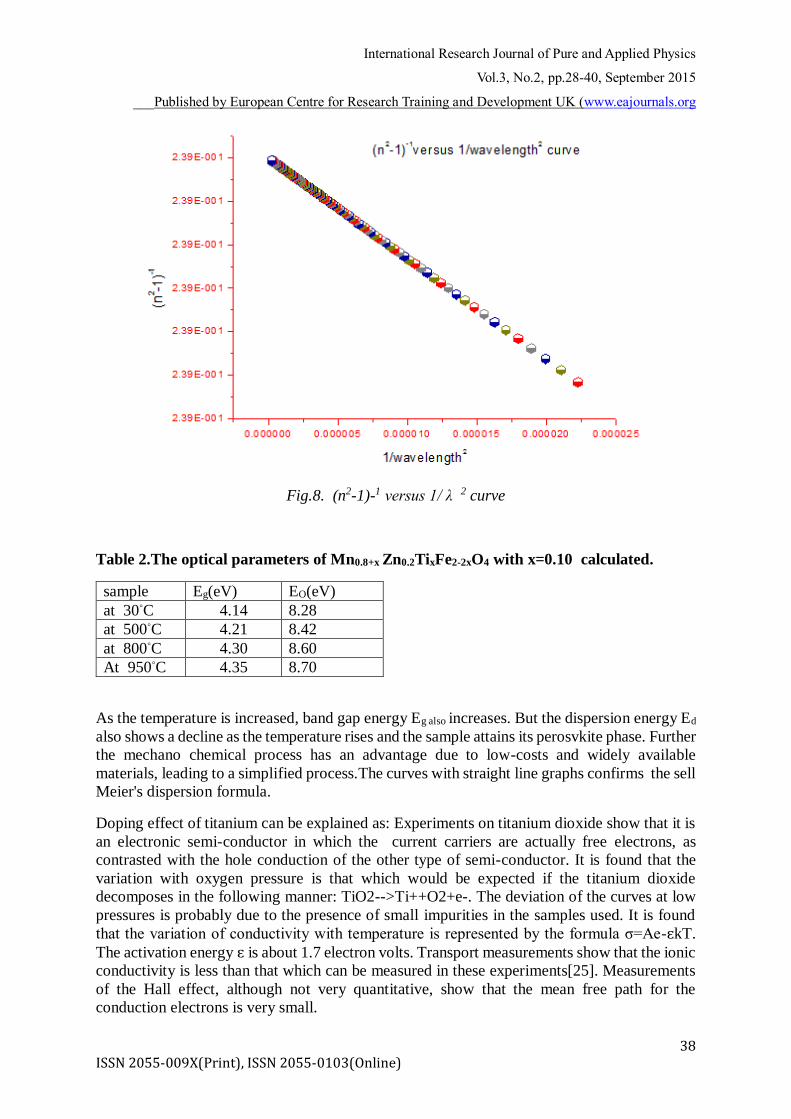
gapEo~2Eg, where E0 is considered as an average energy gap. (WD) oscillator model can be
also written as n2-1=S0 λ02 /[1-( λo / λ)2 ] --- (8) where λ is the wavelength of the incident
radiation , So is the average oscillator strength and λo is an average oscillator wavelength. The
curves of (n2 – 1)-1 against (1/λ2) (Fig.8) are fitted into straight lines following the sell Meier's
dispersion formula. The curves with straight line graph confirm the Sell Meiers dispersion
formula. The value of So and (λo) are estimated from the slope (1/So) and the infinite
wavelength intercept (1/S0λo) 2. In table 2 the calculated values of the optical parameters of the
sample were tabulated.
International Research Journal of Pure and Applied Physics
Vol.3, No.2, pp.28-40, September 2015
___Published by European Centre for Research Training and Development UK (www.eajournals.org
38 ISSN 2055-009X(Print), ISSN 2055-0103(Online)
Fig.8. (n2-1)-1 versus 1/ λ 2 curve
Table 2.The optical parameters of Mn0.8+x Zn0.2TixFe2-2xO4 with x=0.10 calculated.
sample Eg(eV) EO(eV)
at 30◦C 4.14 8.28
at 500◦C 4.21 8.42
at 800◦C 4.30 8.60
At 950◦C 4.35 8.70
As the temperature is increased, band gap energy Eg also increases. But the dispersion energy Ed
also shows a decline as the temperature rises and the sample attains its perosvkite phase. Further
the mechano chemical process has an advantage due to low-costs and widely available
materials, leading to a simplified process.The curves with straight line graphs confirms the sell
Meier's dispersion formula.
Doping effect of titanium can be explained as: Experiments on titanium dioxide show that it is
an electronic semi-conductor in which the current carriers are actually free electrons, as
contrasted with the hole conduction of the other type of semi-conductor. It is found that the
variation with oxygen pressure is that which would be expected if the titanium dioxide
decomposes in the following manner: TiO2-->Ti++O2+e-. The deviation of the curves at low
pressures is probably due to the presence of small impurities in the samples used. It is found
that the variation of conductivity with temperature is represented by the formula σ=Ae-ɛkT.
The activation energy ɛ is about 1.7 electron volts. Transport measurements show that the ionic
conductivity is less than that which can be measured in these experiments[25]. Measurements
of the Hall effect, although not very quantitative, show that the mean free path for the
conduction electrons is very small.

International Research Journal of Pure and Applied Physics
Vol.3, No.2, pp.28-40, September 2015
___Published by European Centre for Research Training and Development UK (www.eajournals.org
39 ISSN 2055-009X(Print), ISSN 2055-0103(Online)
CONCLUSION
With the increase in annealing temperature, the UV emission peak shifts significantly to higher
wavelengths. The increase in the band gap energy Eg increases the dielectric properties of the
material. It is confirmed that tunable band gaps are obtained by varying annealing temperatures.
Band gap energy and the optical properties of the material Mn0.8+x Zn0.2TixFe2-2xO4 with x=0.10
can be taken as a better candidate for UV_VIS shielding applications. Optical measurements
confirmed that absorbance and reflectance increases with temperature. According to Wemple-
DiDomenico single-oscillator model the dispersion energy decreases as the sample attains its
cubic spinel structure. For new generation electronic equipments this will prove as a future
component. As higher the band gap energy more the material becomes dielectric at higher
temperature
REFERENCES
S.S. Suryavanshi, R.S. Patil, S.A. Patil, S.R. Sawant, J. Less-Common Met. 168 (1991) 169.
M.B. Reddy, V. Reddy, Phys. Status Solidi A 120 (1990) 575.
T.M. Meaz, S.M. Attia, A.M. Abo El Ata, J. Magn. Magn.Mater.257 (2003) 296.
C. Prakash, J.S. Baijal, J. Less-Common Met. 107 (1985) 51.
S.S. Suryavanshi, C.N. Jadhav, S.A. Patil, S.R. Sawant, Mater. Res. Bull. 24 (1989) 1201.
S. Kumer, R. Kumer, V.R. Dogra, A. Dogra, Alimuddin, J. Appl. Phys. 99 (2006) 08M910.
Paul SaAnchezyArvidsstashns, 2001, Computational study of structural and
electronicproperties of superconducting La-doped SrTiO3
KingerY,Bowen,Uhlmann,Text book Introduction to ceramics, Optical properties .Chapter
13page647
Reenu Jacob, Harikrishnan G Nair, JayakumariIsac-Optical Band Gap Analysis Of Nano-
Crystalline CeramicPbSrCaCuO, Journal of
Advances in Physics,2014,ISSN 2347-3487.
Vinila, V.S., Jacob, R., Mony, A., Nair, H.G., Issac, S., Rajan, S., Nair, A.S. and Isac, J. (2014)
XRD Studieson Nano Crystalline Ceramic Superconductor PbSrCaCuO at Different
Treating Temperatures. Crystal Structure Theoryand Applications, 3, 1-9.
http://dx.doi.org/10.4236/csta.2014
T. Dhannia, S. Jayalekshmi, M. C. SanthoshKumar, T. PrasadaRao and A. ChandraBose, Effect
of Aluminium
Doping and Annealing on Structural and Optical Properties of Cerium Oxide Nanocrystals,
Journal of Physics and
Chemistry of Solids, 70 (11), (2009) 1443 - 1447.
Xie, Q. and McCourt, F. (2008) Nanotechnology Engineering NE 320L Lab Manual.
University of Waterloo, Waterloo, 35-39.
Keigo Suzuki, And Kazunori Kijima. 2005. Optical Band Gap Of Barium Titanate
Nanoparticles Prepared By Rf-Plasma Chemical Vapor Deposition, Japanese Journal of
Applied Physics, Vol. 44, No. 4a, 2005, Pp. 2081–2082, The Japan Society of Applied
Physics.
RONSON CT STE K.2012.NANOCOMPOSIX.Com.UV/VIS/IR SPECTROSCOPY
ANALYSIS OF NANOPARTICLES
G. VENKATA CHALAPATHIa, M. THAIDUNa, D. SUBRAMANYAMa, B. SRINIVASA
RAOa, C. BALANARAYANAa, B. RAJESH

International Research Journal of Pure and Applied Physics
Vol.3, No.2, pp.28-40, September 2015
___Published by European Centre for Research Training and Development UK (www.eajournals.org
40 ISSN 2055-009X(Print), ISSN 2055-0103(Online)
KUMAR.2015 SYNTHESIS AND CHARACTERIZATION OF Fe DOPED CdSe
NANOPARTICLES FOR SPINTRONIC DEVICE
K. Latha and D. Ravinder, “Electrical-conductivity of Mn-Zn ferrites,” Physica Status Solidi
A, vol. 139, pp. K109–K112,1993.
X.M Lu,J.S.Zhu, W.Y. Zang, G.Q. Ma, Y.N.Wang, thin solid Films 274 (1996) 165
N.Golego, S.A Studenikin, M. Cocivera, Chem. Mater. 10 (1998) 2000.
H. Sumi and Y. Toyozawa, J. Phys. Soc. Jpn. 31, 342 (1971).
[20] Dennis P. Shay -DEVELOPMENT AND CHARACTERIZATION OF HIGH
TEMPERATURE, HIGH ENERGY DENSITY DIELECTRIC MATERIALS TO
ESTABLISH ROUTES TOWARDS POWER ELECTRONICS CAPACITIVE
DEVICES- The Pennsylvania State University The Graduate School Department of
Materials Science and Engineering May2014.
S. Kugler: Lectures on AmorphousSemiconductors- 4 May 2013 ...
www.slideserve.com/Leo/optical-properties.
A. Verma, T. C. Goel, R. G. Mendiratta, and M. I. Alam,“Dielectric properties of NiZn
ferrites prepared by the citrate precursor method,” Materials Science and Engineering
B, vol.60, no. 2, pp. 156–162, 1999.
S. H. Wemple and M. DiDomenico, Jr., Phys. Rev. B 3, 1338 (1971).
S. Mishra, T. K. Kundu, K. C. Barick, D. Bahadur, and D.Chakravorty, “Preparation of
nanocrystalline MnFe2O4 by doping with
Ti4+ ions using solid-state reaction route,” Journalof Magnetism and Magnetic Materials, vol.
307, no. 2, pp. 222–226, 2006.
http://www.researchgate.net/post/Is_Titanium_Dioxide_an_n-type_or_a_p-
type_semiconductor