optical control of aptamer-based sensors using a
TRANSCRIPT

Optical Control of Aptamer-Based Sensors Using a Photocleavable Linker
Zhesen Tan, Trevor A. Feagin, Jennifer M. Heemstra*
Department of Chemistry, Emory University, Atlanta, Georgia, United States
Abstract
Aptamer-based sensors rely on the ability of nucleic acids to bind to target molecules with high
affinity and specificity via molecular recognition. Due to their ease of production and the high
thermal stability of nucleic acids, aptamer-based sensors are emerging as attractive candidates
for detecting a wide range of chemical and biological targets. A current limitation of aptamer-
based sensors, however, is the inability to control their activity in a time-resolved manner,
limiting their utility in applications that require precise temporal control over function. Here, we
demonstrate that temporal control over structure-switching (SS) aptamer sensors can be
achieved using an equilibrium-shifting photocleavable linker that is placed between the aptamer
and complementary strand. Installation of this linker significantly increases the effective molarity
of the complementary strand, temporarily shifting the equilibrium of the sensor to disfavor target
binding, and thus rendering the sensor functionally inert to the target molecule. To restore
activity, the linker can be cleaved by UV irradiation, which returns the sensor into its functional
equilibrium state, and allows for a dose-dependent response in the presence of target. To
demonstrate the generalizability of our photocleavable linker design, we have shown that the
linker can be grafted onto a different SS biosensor and still provide time-resolved control over
activity. This represents a key benefit of our approach, as it allows the caging strategy to be
easily adapted for use with aptamer sensors for a wide range of target molecules. Together,
this research demonstrates that precise temporal control over aptamer sensors can be achieved
without modifying the actual nucleotide sequence of the sensor, creating a generalizable
method for control of sensor function. We anticipate that this will be particularly useful when
deploying aptamer sensors in complex biological environments.
1. Introduction
Biosensors are analytical devices that are capable of binding to a specific target molecule and
converting this molecular recognition event into a detectable signal. Natural receptors such as
antibodies and enzymes have commonly been employed as the recognition element in

biosensors, but nucleic acid aptamers have emerged over the past two decades as a promising
alternative.(Liu et al, 2009) Aptamers are short oligonucleotides that adopt folded structures,
which allow them to bind to a broad range of small molecule or protein targets. Unlike
antibodies, where production involves host animals or hybridoma cell lines, aptamers are
generated through a combinatorial selection process termed Systematic Evolution of Ligands
via EXponential enrichment (SELEX) (Tuerk et al, 1990; Ellington et al, 1990). This in vitro
selection process does not require animals or cell lines, and can yield aptamers having high
binding affinity and specificity for the desired target. And, as an additional key benefit relative to
antibodies, aptamers can be chemically synthesized, reducing batch-to-batch variation and
allowing for the introduction of functional group modifications. Additionally, the robust nature of
nucleic acids offers higher resistance to thermal or chemical denaturation compared to protein-
based affinity reagents, enabling aptamer sensors to function under a diverse range of assay
conditions (Peterson et al, 2015).
While the utility of aptamer biosensors has been demonstrated in a variety of bioanalytical
applications, the ability to achieve temporal control over their sensing activity remained relatively
unexplored. We recognized that the availability of generalizable methods for achieving time-
resolved control of biosensor function would expand the repertoire of potential applications for
aptamer sensors. To meet this need, we envisioned utilizing a covalent self-caging strategy
similar to that employed by naturally occurring enzymes and protein receptors, which allows for
stimuli-responsive control of their ligand-binding activity. In nature, self-caged proteins, such as
zymogens (Nelson et al, 2000) and protease-activated receptors (Saito et al, 2005), are
temporarily inactivated by a covalently-bound inhibitor. However, these proteins can be
converted into their active form in a stimuli-responsive manner through cleavage of the peptide
chain at a site between the active protein and the inhibitor.
We hypothesized that this approach would be well-suited to SS biosensors, as these are
comprised of an aptamer receptor bound to a short complementary strand via Watson-Crick
base pairing. The aptamer and complementary strand are often labeled with a fluorophore and
quencher, respectively, providing a dose-dependent fluorescent signal as target binding
displaces the complementary strand (Nutiu et al, 2003). Importantly, binding of the aptamer to
the complementary strand and the target is mutually exclusive, and thus the complementary
strand can be viewed as a reversible inhibitor. By analogy to the covalent self-caging strategy
used by proteins, we anticipated that covalently linking the aptamer to the complementary
strand would shift the equilibrium of this interaction to favor binding of the complementary strand

even in the presence of high concentrations of the target molecule. However, stimuli-responsive
cleavage of the linker would be expected to restore the SS biosensor to its functional state,
allowing for target-dependent displacement of the complementary strand to generate a dose-
dependent fluorescence signal (Figure 1) (Tan et al, 2016).
Figure 1. The equilibrium of a covalently caged biosensor is temporarily shifted to disfavor target binding.
This equilibrium shift can be reversed by cleaving the stimuli-responsive linker, restoring the ability of the
biosensor to bind to the target molecule and generate a dose-dependent fluorescent signal. F =
fluorophore, Q = quencher, CL = cleavable linker. (Reproduced from ref. 8 with permission from American
Chemical Society).
To generate the stimuli-responsive linker between the aptamer and complementary strand, we
chose a photolabile group that can be cleaved by UV irradiation (Tang et al, 2006). Light
represents an ideal choice as an external stimulus for the activation of caged biomolecules due
to its bioorthogonality and noninvasiveness (Riggsbee et al, 2010; Mayer et al, 2006).
Photocaging methods have been employed to achieve photoresponsive control over the activity
of functional nucleic acids (Heckel et al, 2005; Lusic et al, 2007; Hwang et al, 2014; Ting et al,
2004). However, these methods rely on sequence-specific modification of nucleobases, which
limits their generality. In comparison, our approach requires no modifications to the nucleotide
sequence of the biosensor, imparting significantly higher generalizability and ease of use.
Additionally, the shift in equilibrium observed in covalent self-caging is largely independent of
the chemical structure of the cleavable linker, and thus we envision future expansion of our
approach to encompass additional linker-stimuli combinations.
We first developed this method using the DNA biosensor for L-tyrosinamide (L-Tym), and then
validated the versatility by grafting the same photocleavable linker onto the DNA biosensor for
ochratoxin A (OTA) (Chen et al, 2012). We found that with a small amount of optimization (e.g.
changing the concentration of the biosensor), we were able to achieve an analogous level of
photoresponsive control over biosensor activity (Tan et al., 2016). One potential hurdle to
F
QCL
F
Q+
cleavage
CL
F
F
little to no fluorescence signal
dose-dependentfluorescence signal
Q
Q
activation

broadly adapting this approach would be instances of biosensors where the termini of the
aptamer and complementary strand are separated by a large amount of sequence distance and
cannot be truncated, as we did with the L-Tym biosensor. In these cases, the intervening
nucleotides could act as part of the linker to still allow photoresponsive control of the biosensor.
However, additional optimization would be required, and there is likely a maximum number of
nucleotides that can be accommodated. Fortuitously, many SS biosensors do have close
alignment of the aptamer and complementary strand termini, and thus based upon our initial
experience with the L-Tym and OTA biosensor architectures, we anticipate that the
photocleavable linker can be easily transferred to other sensors to impart a similar level of
stimuli-responsive control.
2. Materials
2.1. DNA Synthesis
1. 6-Fluorescein phosphoramidite (Glen Research, cat. No. 10-1964)
2. 5’-BHQ-1 phosphoramidite (Glen Research, cat. No. 10-5931)
3. PC spacer phosphoramidite (Glen Research, cat. No. 10-4913)
4. Spacer phosphoramidite 9 (Glen Research, cat. No. 10-1909)
5. All DNA was synthesized by the University of Utah DNA/Peptide Synthesis Core Facility
using an ABI 394 synthesizer
Table 1. DNA sequences
Name Sequence (5’-3’)
TA-0S BHQ1-CACATCAAT/PC spacer/FAM/ATTGATGTGGTGTGTGAGTGCGGTGCCC
TA-1S BHQ1-CACATCAAT/PC spacer/PEG3/FAM/ATTGATGTGGTGTGTGAGTGCGGTGCCC
TA-2S BHQ1-CACATCAAT/PC spacer/PEG3/PEG3/FAM/ATTGATGTGGTGTGTGAGTGCGGTGCCC
TA-3S BHQ1-CACATCAAT/PC spacer/PEG3/PEG3/PEG3/FAM/ATTGATGTGGTGTGTGAGTGCGGTGCCC
OA-1S GATCGGGTGTGGGTGGCGTAAAGGGAGCATCGGACA/FAM/ PEG3/PC spacer/TGTCCGAT/BHQ1
OA-CS TGTCCGAT/BHQ1

2.2. Preparation of Stock Solutions
1. Binding buffer: 10 mM Tris-HCl, 100 mM NaCl, 5 mM KCl, 2 mM MgCl2, 1 mM CaCl2, pH
7.5
2. 7.5 mM L-tyrosinamide (L-Tym, Sigma-Aldrich) freshly prepared in binding buffer
3. 5 µM purified DNA in binding buffer
2.3. Denaturing PAGE for Gel Separation and Purification
1. Multiple Mini-Vertical Gel Casting Chamber GCC-204 (C.B.S. Scientific)
2. Vertical Mini-Gel System MGV-102 (C.B.S. Scientific)
3. VWR power supplies (300V)
4. Tris/Borate/EDTA (TBE) buffer (1x): 90 mM Tris, 90 mM boric acid and 2.5 mM EDTA in
Milli-Q purified water
5. Polyacrylamide gel buffer: 8% acrylamide/bisacrylamide (29:1) and 8 M urea prepared in
TBE buffer
6. N,N,N′,N′-Tetramethylethylenediamine (TEMED)
7. Ammonium persulfate (APS)
8. RNA loading dye, 2x (New England BioLabs)
9. Crush and soak buffer: 0.5 M ammonium acetate, 1 mM EDTA, pH 8
10. Amicon Ultra 0.5 mL centrifugal filters 10 kDa membrane (EMD Millipore)
11. Corning Costar Spin-X centrifuge tube filters, pore size 0.22 µm
12. Fisher Scientific accuSpin Micro 17 microcentrifuge
13. Maestrogen UltraBright UV transilluminator
14. Typhoon FLA-7000 laser scanner
15. ImageQuant TL 8.1 software
2.4. Photocleavage and Tm Measurements
1. Corning 96-well flat bottom clear polystyrene plate (wrap the lid with aluminum foil)
2. Cleavage box - a 14 cm tall white card box wrapped in aluminum foil (Figure 2)
3. Feit Eelctric 60 W Equivalent Red Spiral SFL light bulb
4. Maestrogen UltraBright UV transilluminator

5. Shimadzu UV-1800 UV-VIS spectrophotometer with an MMC-1600 8 multi-cell (cell path
length = 1 cm)
6. Origin 9.1 software
Figure 2. Experimental setup for the UV irradiation process, which includes the cleavage box, a clear
bottom 96-well plate, and a lid wrapped in aluminum foil.
2.5. Fluorescence Measurements
1. Corning 384-well flat bottom black polystyrene plate
2. Corning 96-well flat bottom clear polystyrene plate
3. Biotek Synergy Mx Microplate Reader
4. Fisher Scientific Isotemp Standard Lab incubator
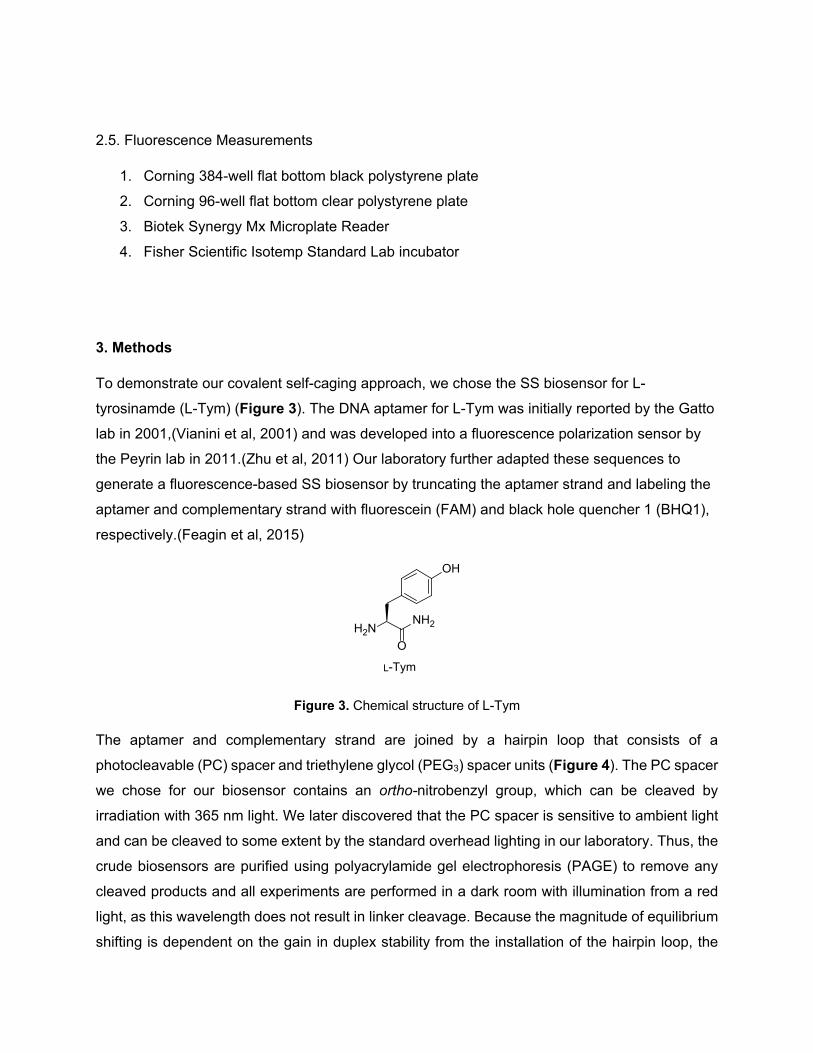
3. Methods
To demonstrate our covalent self-caging approach, we chose the SS biosensor for L-
tyrosinamde (L-Tym) (Figure 3). The DNA aptamer for L-Tym was initially reported by the Gatto
lab in 2001,(Vianini et al, 2001) and was developed into a fluorescence polarization sensor by
the Peyrin lab in 2011.(Zhu et al, 2011) Our laboratory further adapted these sequences to
generate a fluorescence-based SS biosensor by truncating the aptamer strand and labeling the
aptamer and complementary strand with fluorescein (FAM) and black hole quencher 1 (BHQ1),
respectively.(Feagin et al, 2015)
H2NNH2
O
OH
L-Tym
Figure 3. Chemical structure of L-Tym
The aptamer and complementary strand are joined by a hairpin loop that consists of a
photocleavable (PC) spacer and triethylene glycol (PEG3) spacer units (Figure 4). The PC spacer
we chose for our biosensor contains an ortho-nitrobenzyl group, which can be cleaved by
irradiation with 365 nm light. We later discovered that the PC spacer is sensitive to ambient light
and can be cleaved to some extent by the standard overhead lighting in our laboratory. Thus, the
crude biosensors are purified using polyacrylamide gel electrophoresis (PAGE) to remove any
cleaved products and all experiments are performed in a dark room with illumination from a red
light, as this wavelength does not result in linker cleavage. Because the magnitude of equilibrium
shifting is dependent on the gain in duplex stability from the installation of the hairpin loop, the

effect of linker length on the duplex stability of the biosensors was explored. Biosensors
containing a varying number of spacer units were synthesized and the thermal melting
temperature of each structure was determined by monitoring the temperature-dependent
hyperchromicity at 260 nm. In addition to optimizing the linker length, the biosensor concentration
was also tuned to provide optimal signal-to-background, further improving the performance of our
biosensor.
T A A C T A C A C5'
A T T G A T G T G G T G T G T G A G T G C G G T G C C C3'
BHQ1HN
O
O2N
OPO
-O
O
O PO
-O O
OFAM
3
3 n
PC spacer
PEG3 spacer
Figure 4. Structure of L-Tym biosensor. FAM = fluorescein, BHQ1 = Black Hole Quencher 1.
(Reproduced from ref. 8 with permission from American Chemical Society).
Once the linker length and biosensor concentration were optimized, we tested our hypothesis
for equilibrium shifting of the biosensor. The caged biosensor was irradiated at 365 nm for
varying lengths of time prior to the addition of L-Tym. After incubation for 20 min at 25 oC in the
presence of varying concentrations of L-Tym, fluorescence intensity was measured using a
microplate reader, which enabled calculation of the percentage of complementary strand that
was displaced in response to the target molecule. An additional experiment was conducted to
demonstrate the ability of our biosensor to respond to L-Tym in real time as the uncaging
occurs. In this experiment, the caged biosensor was combined with varying concentrations of L-
Tym, and fluorescence intensity was measured at varying times during the irradiation of the
sample.
This protocol describes the application of our photocaging method using the L-Tym biosensor.
However, with only a small amount of re-optimization, this approach can be applied to a SS
biosensor for a different small molecule target.
3.1. DNA Purification Using Denaturing PAGE

1. Prepare 8% denaturing polyacrylamide gels in a gel casting chamber (GCC-204). Inject
a mixture of 50 mL of polyacrylamide gel buffer, 50 µL of TEMED, and 200 µL of 10%
w/v APS into a gel casting chamber pre-loaded with glass plates and spacers.
2. Insert 1-well gel combs into each gel cassette immediately and let it sit for 30 min, or
until the gel is solidified.
3. Pre-run the gel for 20 min (260 V). While waiting, prepare a 60 µM crude biosensor
solution in binding buffer.
4. After 20 min, turn off the power supply and remove the gel comb. Load a mixture of 150
µL of 60 µM biosensor solution with 150 µL of 2x RNA loading dye onto the 8%
polyacrylamide gel.
5. Turn on the power supply (260 V) and let the gel run for 30 min.
6. When gel separation is complete, carefully remove the polyacrylamide gel from the gel
cassette.
7. To visualize the bands, excise a small vertical section from the gel and place it on the
Maestrogen UltraBright UV transilluminator (high intensity, 365 nm). The remainder of
the gel is kept away from any UV exposure to avoid unwanted cleavage of the PC
spacer.
8. Locate the upper band (uncleaved biosensor) on the excised gel and align it to the
remainder of the gel. Then, excise the indicated area on the remainder of the gel to
collect the purified biosensor.
9. Cut the gel section containing the purified biosensor into small pieces and soak the gel
pieces in 2 mL of crush and soak buffer.
10. Cool the mixture in a freezer until the buffer is frozen, then heat on a heat block at 90 oC
for 2 hours (or 65 oC overnight).
11. Let the mixture cool to room temperature and transfer it to a 0.22 µm Corning Costar
Spin-X centrifuge tube filter (try to minimize transfer of any gel pieces). Spin the filter
tube at 2,000 X G for 2 minutes in a Fisher Scientific accuSpin Micro 17 microcentrifuge
to remove any remaining gel pieces.
12. Transfer the eluted fraction to an Amicon Ultra 0.5 mL centrifugal filter (10 kDa) and spin
at 15,000 X G for 15 minutes in a Fisher Scientific accuSpin Micro 17 microcentrifuge to
remove the crush and soak buffer. Repeat this step twice by diluting the purified
biosensor with binding buffer.

13. To recover the purified biosensor, place the Amicon Ultra filter device upside down in a
clean collection tube. Spin the tube at 1,000 X G for 2 minutes to transfer the purified
biosensor from the filter device to the collection tube.
3.2. Optimization of Biosensor Concentration
1. Prepare biosensor solutions having varying DNA concentrations (0.1, 0.3, 1, and 3 µM)
in 10 mM Tris-HCl, 100 mM NaCl, 5 mM KCl, 2 mM MgCl2, 1 mM CaCl2, pH 7.5.
2. Incubate the samples at 90 oC for 5 min followed by rapid cooling in ice to ensure proper
annealing. Allow the solutions to warm to room temperature prior to use.
3. Transfer 100 µL of each solution into different wells on a 96-well flat bottom clear
polystyrene plate.
4. Place the sample plate on top of the cleavage box and irradiate the sample with UV light
(high intensity, 365 nm) for 40 min on a Maestrogen UltraBright UV transilluminator.
Incubate the sample solutions at 25 oC for 15 min. The microplate containing sample is
covered with a lid at all times.
5. After cleavage, transfer 50 µL of each solution into different wells on a 384-well flat
bottom black polystyrene plate.
6. Measure the fluorescence intensity using excitation/emission wavelengths of 490/520
nm on a Biotek Synergy Mx Microplate Reader. All fluorescence values are standardized
using a control solution containing only fluorophore-labeled aptamer in the same
concentration.
7. Plot the percent of biosensors dehybrized versus biosensor concentration.
8. Using the result of this analysis, we choose the biosensor concentration (1 µM) that
provides ~95% of hybridization between the aptamer and complementary strand after
cleavage. We have found that this approximate level of hybridization provides optimal
signal-to-background while still allowing strand displacement to take place in the event of
target binding.
9. Calculate the average KD value for the duplex using equation 1, in which [Apt] is aptamer
concentration, [CS] is complementary strand concentration, and [Apt-CS] is the
concentration of the hybridized duplex.
𝐾𝐾𝐷𝐷 = [𝐴𝐴𝐴𝐴𝐴𝐴][𝐶𝐶𝐶𝐶][𝐴𝐴𝐴𝐴𝐴𝐴−𝐶𝐶𝐶𝐶]
(1)

3.3. Tm Measurements
1. Prepare 2 µM of each of the biosensor in Table 1 and transfer 100 µL of each solution
into different wells on a 96-well flat bottom clear polystyrene plate.
2. Perform cleavage following Step 4 in Section 3.2.
3. After cleavage, dilute the cleaved and uncleaved biosensor with binding buffer into a
final concentration of 1 µM.
4. Anneal the cleaved and uncleaved biosensors following Step 4 in Section 3.3.
5. Transfer the sample solutions to an MMC-1600 8-cell cuvette for UV measurements
using a Shimadzu UV-1800 UV-VIS spectrophotometer.
6. Record the UV absorbance at 260 nm, with a ramp rate of 0.5 ºC/min in 0.5 ºC intervals
from 5 ºC to 90 ºC.
7. Determine the Tm values by taking the first derivative of the melting curves using Origin
9.1 software.
3.4. Quantification of Cleavage Kinetics on Denaturing PAGE
1. Prepare 2 µM biosensor solution in 10 mM Tris-HCl, 100 mM NaCl, 5 mM KCl, 2 mM
MgCl2, 1 mM CaCl2, pH 7.5, and transfer 100 µL of the solution into each well on a 96-
well flat bottom clear polystyrene plate.
2. Perform cleavage following Step 4 in Section 3.2.
3. Dilute cleaved and uncleaved biosensors to a final concentration of 1 µM using an equal
volume of 2x RNA loading dye.
4. Perform gel separation on denaturing PAGE using 10-well gel combs following Step 1-6
in Section 3.1.
5. Stain the gel with SYBR Green II solution for 10 min followed by fluorescence imaging
on a Typhoon FLA-7000 laser scanner using a SYBR Green II filter set.
6. Quantify the cleavage yield using ImageQuant TL 8.1 software and fit the data to a first
order kinetic model using Origin 9.1 software.
cleavage time (min) 0 1 2 5 10 20 30 40cleavage yield (%) 0 5 11 27 53 83 92 96

Figure 5. Monitoring the photocleavage of L-Tym biosensor using denaturing PAGE. (Reproduced from
ref. 8 with permission from American Chemical Society).
3.5. Dose-Responsive Fluorescence Measurements
1. Prepare 2 µM biosensor solution in10 mM Tris-HCl, 100 mM NaCl, 5 mM KCl, 2 mM
MgCl2, 1 mM CaCl2, pH 7.5, and anneal by following Step 4 in Section 3.3.
2. Prepare cleaved biosensor following Steps 1-2 in Section 3.2 with varying lengths of
time, ranging from 0 to 20 min.
3. Prepare L-Tym sample solutions in varying concentrations from the L-Tym stock in
Section 2.2.
4. Mix cleaved and uncleaved biosensor (final concentration = 1 µM) with L-Tym sample
solutions in a 384-well flat bottom black polystyrene plate to give a final volume of 50 µL.
5. Cover the sample plates with a lid and incubate the samples at 25 ºC for 20 min.
6. Measure the fluorescence intensity using excitation/emission wavelengths of 490/520
nm on a Biotek Synergy Mx Microplate Reader. All fluorescence values are standardized
using a control solution containing 1 µM of fluorophore-labeled aptamer.
7. Calculate the percent displacement (%D) using the standardized fluorescence values
and equation 2:
%𝐷𝐷 = � 𝐹𝐹−𝐹𝐹0𝐹𝐹𝑚𝑚−𝐹𝐹0
� × 100 (2)
in which F is the measured fluorescence, Fo is the fluorescence of the uncleaved
biosensor in the absence of ligand, and Fm is the fluorescence of the fluorophore-labeled
aptamer strand.
3.6. Real-Time Monitoring of Biosensor Response upon UV Irradiation
1. Prepare 2 µM biosensor solution and anneal by following Step 4 in Section 3.3.
2. Mix uncleaved biosensor (final concentration = 1 µM) with L-Tym sample solutions in a
96-well flat bottom clear polystyrene plate to give a final volume of 100 µL. A 96-well
plate is used in this assay, as it has a higher surface area exposed to the UV light, and
thus provides more efficient photocleavage.
3. Place the sample plate on top of the cleavage box. Irradiate the sample with UV light
(high intensity, 365 nm) on a Maestrogen UltraBright UV transilluminator while
measuring the fluorescence intensity after each UV irradiation. All fluorescence values

are standardized using a control solution containing only 1 µM fluorophore-labeled
aptamer.
4. Calculate the percent displacement (%D) using the standardized fluorescence values
and equation 2.
Notes
1. The PC modifier used in our biosensor design is PC Spacer Phosphoramidite (Glen
Research, cat. No. 10-4913), not to be confused with PC Linker Phosphoramidite (Glen
Research, cat. No. 10-4920).
2. As previously mentioned, the PC spacer utilized in our biosensor is sensitive to ambient
light. To prevent any unwanted cleavage, all biosensor solutions were kept away from
ambient light. All experiments were performed in a dark room with illumination from a red
light, and samples were stored in tubes wrapped in aluminum foil for transporting outside
of the dark room.
3. It is important to note that small molecule degradation may occur under red light. The
red light used in these experiments was compatible with L-Tym, but we found that OTA
was degraded when exposed at a close distance to this light source.
4. The conditions for DNA gel purification (voltage and separation time) were optimized for
TA-1S. A different biosensor with different DNA sequence may require re-optimization to
achieve good separation.
5. The choice of centrifugal filter used in Section 3.1 was based on the molecular weight of
the biosensor. Uncleaved TA-1S has a molecular weight of ~13,000 g/mol and therefore
a 10kDa filter was used to retain the purified TA-1S.
6. The cleavage box (Figure 4) used in this method was constructed with a white card box
with dimensions of 14 cm (h) x 15 cm (l) x 10 cm (d). The exterior wall of the box is
wrapped with aluminum foil to prevent any ambient light from entering the box, which
may interfere with the cleavage of the PC spacer.
7. The UV transilluminator generates heat when the light source is on, which can build up
inside the cleavage box and contribute to sample evaporation during UV irradiation. To
minimize the sample evaporation, release the heat by lifting the cleavage box from the
UV transilluminator from time to time throughout the cleavage process. We suggest
carrying out this step at 10 minute intervals, we have found this to be effective in keeping
sample evaporation to a minimum.

Acknowledgements
This work was supported by the National Science Foundation (CHE 1818781, CHE 1904885,
and CBET 1818476 to J.M.H.). Oligonucleotides were synthesized by the DNA/Peptide Facility,
part of the Health Sciences Center Cores at the University of Utah.
1. Liu J, Cao Z, Lu Y. 2009. Functional Nucleic Acid Sensors. Chem Rev 109, 1948-1998. 2. Tuerk C, Gold L. 1990. Systematic evolution of ligands by exponential enrichment: RNA ligands to bacteriophage T4 DNA polymerase. Science, 249, 505-510. 3. Ellington AD, Szostak JW. 1990. In vitro selection of RNA molecules that bind specific ligands. Nature, 346, 818-822. 4. Peterson AM, Jahnke FM, Heemstra JM. 2015. Modulating the Substrate Selectivity of DNA Aptamers using Surfactants. Langmuir, 31, 11769-11773. 5. Nelson DL, Cox MM (2000) Lehninger Principles of Biochemistry. 3rd edn. Worth Publishers, New York, NY 6. Saito T, Bunnett NW. 2005. Protease-activated receptors. NeuroMolecular Med, 7, 79-99. 7. Nutiu R, Li Y. 2003. Structure-Switching Signaling Aptamers. J Am Chem Soc, 125, 4771-4778. 8. Tan Z, Feagin TA, Heemstra JM. 2016. Temporal Control of Aptamer Biosensors Using Covalent Self-Caging to Shift Equilibrium. J Am Chem Soc, 138, 6328-6331. 9. Tang X, Dmochowski IJ. 2006. Controlling RNA Digestion by RNase H with a Light-Activated DNA Hairpin. Angew Chem Int Ed, 45, 3523-3526. 10. Riggsbee CW, Deiters A. 2010. Recent advances in the photochemical control of protein function. Trends Biotechnol, 28, 468-475. 11. Mayer G, Heckel A. 2006. Biologically Active Molecules with a “Light Switch”. Angew Chem Int Ed, 45, 4900-4921. 12. Heckel A, Mayer G. 2005. Light Regulation of Aptamer Activity: An Anti-Thrombin Aptamer with Caged Thymidine Nucleobases. J Am Chem Soc, 127, 822-823. 13. Lusic H, Young DD, Lively MO, Deiters A. 2007. Photochemical DNA Activation. Org Lett, 9, 1903-1906. 14. Hwang K, Wu P, Kim T, Lei L, Tian S, Wang Y et al. 2014. Photocaged DNAzymes as a General Method for Sensing Metal Ions in Living Cells. Angew Chem Int Ed, 53, 13798-13802. 15. Ting R, Lermer L, Perrin DM. 2004. Triggering DNAzymes with Light: A Photoactive C8 Thioether-Linked Adenosine. J Am Chem Soc, 126, 12720-12721. 16. Chen J, Fang Z, Liu J, Zeng L. 2012. A simple and rapid biosensor for ochratoxin A based on a structure-switching signaling aptamer. Food Control, 25, 555-560. 17. Vianini E, Palumbo M, Gatto B. 2001. In Vitro Selection of DNA Aptamers That Bind L-Tyrosinamide. Bioorgan Med Chem, 9, 2543–2548. 18. Zhu Z, Schmidt T, Mahrous M, Guieu V, Perrier S, Ravelet C et al. 2011. Optimization of the structure-switching aptamer-based fluorescence polarization assay for the sensitive tyrosinamide sensing. Anal Chim Acta, 707, 191-196. 19. Feagin TA, Olsen DPV, Headman ZC, Heemstra JM. 2015. High-Throughput Enantiopurity Analysis Using Enantiomeric DNA-Based Sensors. J Am Chem Soc, 137, 4198-4206.