opportunities for low-carbon mobility actions in canadian
TRANSCRIPT
Opportunities for Low-Carbon Mobility Actions in Canadian
Municipalities: Best Practices and Guidance
March, 2020

2
Copyright © 2020 The Delphi Group and Pollution Probe
All rights reserved. The use of any part of this document, whether it is reproduced, stored in a retrieval
system, or transmitted in any form or means (including electronic, mechanical, photographic,
photocopying or recording), without the prior written permission of The Delphi Group and Pollution
Probe is an infringement of copyright law.
The Delphi Group Pollution Probe
428 Gilmour Street 208 – 150 Ferrand Drive
Ottawa, ON, K2P 0R8 Toronto, ON, M3C 3E5
Canada Canada
Tel.: (613) 562-2005 Tel: (416) 926-1907
Fax: (613) 562-2008 Fax: (416) 926-1601
www.delphi.ca www.pollutionprobe.org
For more information, please contact:
Joe Rogers Steve McCauley
Senior Director Senior Director, Policy
[email protected] [email protected]
(613) 562-2005 x 222 (416) 926-1907 x 252
Erin Williamson Derek May
Consultant Senior Project Manager
[email protected] [email protected]
(613) 562-2005 x 229 (416) 926-1907 x 236

3
About
The Delphi Group
The Delphi Group is a Canadian strategic consultancy providing innovative solutions in the areas of
climate change and corporate sustainability. As a pioneer in sustainability and environmental risk
management, The Delphi Group has more than 25 years of experience in helping some of Canada’s best-
known companies improve the sustainability of their organizations – as well as the local and global
communities in which they operate.
Pollution Probe
Pollution Probe is a national, not-for-profit, charitable organization that exists to improve the health and
well-being of Canadians by advancing policy that achieves positive, tangible environmental change.
Pollution Probe has a proven track record of working in successful partnership with industry and
government to develop practical solutions for shared environmental challenges.
Natural Resource Canada
Natural Resources Canada (NRCan) seeks to enhance the responsible development and use of Canada’s
natural resources and the competitiveness of Canada’s natural resource products. We are an established
leader in science and technology in the fields of energy, forests, and minerals and metals, and use our
expertise in earth sciences to build and maintain an up-to-date knowledge base of our landmass. NRCan
develops policies and programs that enhance the contribution of the natural resources sector to the
economy and improve the quality of life for all Canadians. We conduct innovative science in facilities
across Canada to generate ideas and transfer technologies. We also represent Canada at the
international level to meet the country’s global commitments related to the sustainable development of
natural resources.

4
Acknowledgements
The Delphi Group and Pollution Probe would like to acknowledge that this study was made possible
through funding support from Natural Resources Canada.
The Delphi Group and Pollution Probe would like to thank the following organizations for their time and
contributions to this study, including sharing valuable insights and expertise during interviews and
directing the project team to important resources and data to support our work.
AES Engineering
City of Edmonton
City of Montreal
European Federation for Transportation and Environment
Pembina Institute
Region of Peel
The International Council on Clean Transportation
University of Calgary, Canadian Energy Systems Analysis Research (CESAR) Initiative
University of Toronto, Transportation and Air Quality Research Group (TRAQ)
The Delphi Group and Pollution Probe are solely liable and responsible for the contents of this
document. Inclusion of the names of organizations is for acknowledgement purposes only and does not
constitute an endorsement of the contents.
5
Table of Contents
Abbreviations and Acronyms ......................................................................................................................... 6
Executive Summary ....................................................................................................................................... 7
1. Introduction and Background ................................................................................................................... 9
1.1 Project Objective and Methodology .................................................................................................. 10
1.2 Benefits of ZEVs and disadvantages of ICE vehicles in cities ............................................................. 11
2. Taking Stock............................................................................................................................................. 14
3. LCMA Costs and Benefits ........................................................................................................................ 23
3.1 Advantages ........................................................................................................................................ 23
3.2 Disadvantages .................................................................................................................................... 26
3.3 Environmental Impact ....................................................................................................................... 28
3.4 Economic cost/benefit ....................................................................................................................... 31
4. Overcoming Barriers ............................................................................................................................... 36
5. Conclusion ............................................................................................................................................... 46
Appendix A: LCMA Case Studies by Type of Action ..................................................................................... 48
Low Emission Zones ................................................................................................................................. 48
Parking Space Removal ............................................................................................................................ 56
Restricted Road Access ............................................................................................................................ 62
Congestion Charges ................................................................................................................................. 67

6
Abbreviations and Acronyms
BEV Battery Electric Vehicle
CAC Criteria Air Contaminant (synonymous with “air pollutant”)
CAD Canadian Dollars
CAV Connected and Autonomous Vehicle
DCFC Direct Current Fast Charger
FCEV Hydrogen Fuel Cell Electric Vehicle
GHG Greenhouse Gas
HDV Heavy-Duty Vehicle
ICE Internal Combustion Engine
LCMA Low-Carbon Mobility Action
LEZ Low-Emission Zone
LTZ Limited Traffic Zone
NOx Nitrogen Oxides
OECD Organisation for Economic Co-operation and Development
PCF Pan-Canadian Framework on Clean Growth and Climate Change
PHEV Plug-in Hybrid Electric Vehicle
PM Particulate Matter
PM2.5 Particulate Matter with a diameter of less than or equal to 2.5 micrometres
PM10 Particulate Matter with a diameter of less than or equal to 10 micrometres
SEK Swedish Krona (currency)
SOx Sulphur Oxides
TCO Total Cost of Ownership
TRAP Traffic-Related Air Pollution
ULEV Ultra-Low Emission Vehicle
ULEZ Ultra-Low Emission Zone
VOC Volatile Organic Compound
ZEV Zero Emission Vehicle
ZEZ Zero Emission Zone

7
Executive Summary
The impacts of greenhouse gas (GHG) and air pollutant emissions from transportation are felt most
acutely in cities. Over 80% of Canada's population resides in cities, and even greater numbers commute
into cities regularly for work or leisure. The number and concentration of vehicles required to service
these populations is significant. As a result, transportation is the leading source of GHG and air pollutant
emissions in most Canadian cities.
This study sought to explore effective means by which cities can discourage the use of internal
combustion engine (ICE) vehicles to help address emissions. It used primary research in the form of
expert interviews and secondary research via a literature review to inform the findings presented in this
guidance document. The intent of this document is to serve as a public-facing best practice guide to
inform the establishment of low-carbon mobility actions (LCMAs) in Canada’s cities.
Through their research, the project team determined that four broad types of LCMAs were within the
study’s scope: parking space removal, congestion charges, restricted road access, and low emission
zones. In addition to these four types of actions there are a significant number of complementary
actions cities can take that will help in the planning and delivery of LCMAs, as well as optimizing
emissions reductions and achieving stakeholder buy-in. These actions are defined in Section 2, and are
subsequently referenced throughout the document.
In addition to actions, the document identifies 15 distinct stakeholder groups that cities should involve
in LCMA planning and delivery. Actions that each group is well-positioned to contribute to are indicated.
Drawing from global municipal case study data, Section 3 and Appendix A overview LCMA advantages
and disadvantages, along with environmental and economic impacts. LCMAs were found to be effective
in helping cities to achieve environmental targets and mitigate adverse health impacts from
transportation emissions. They were also found to be effective at promoting public transit and active
transportation, as well as reducing congestion – a growing problem in many parts of Canada.
Barriers associated with LCMAs can be significant, especially in a Canadian context where such measures
are only beginning to be explored. Common barriers and possible means to overcome them are
described in Section 4. These barriers consist of: public acceptance, social equity, costs/limited budgets,
political risk, impacts on local businesses, and increased congestion in adjacent areas.
Findings indicate that of the four primary types of LCMAs, low emission zones are the most effective at
reducing transportation emissions as they tend to remove the greatest number of ICE vehicles from city
roads. Perhaps not surprisingly, however, low emission zones are also the most costly and complex to
implement.
Restricted road access zones are essentially scaled-down versions of low emission zones, which limits
their environmental and economic benefits yet makes implementation more feasible. They can be a
great way to send market signals to the general public and businesses alike, letting stakeholders know
that low-carbon transport is a priority for local government, that efforts in this area will only intensify in
the future, and that palpable benefits can be realized through LCMA implementation.

8
Parking space removal and limiting new parking space development is a highly scalable action and can
be rolled out gradually to give people time to adjust. It is already being applied to a limited degree in
certain Canadian cities. However it is difficult to directly attribute emissions reductions to this LCMA.
Congestion pricing is an effective action to reduce emissions while generating revenue that can be
allocated to low-carbon mobility initiatives. To be made more palatable to the general public,
congestion pricing must account for low-income and car-captive segments of the population, and viable
alternatives to travel by passenger vehicles must be made available.
There was no consensus among experts on which type of LCMA is most appropriate for Canadian cities.
However experts did stress that cities should start small and gradually increase the scope and stringency
of LCMAs to give the general public and businesses time to acclimatize themselves to a low-carbon
transportation paradigm. Beginning LCMAs as small-scale demonstrations, and/or initially focusing
efforts on highly polluting classes of vehicles is a logical and feasible starting point for Canadian cities.

9
1. Introduction and Background
The transportation sector in Canada accounted for 24% of national greenhouse gas (GHG) emissions in
2017.1 In 2016, the federal government introduced the Pan-Canadian Framework on Clean Growth and
Climate Change (PCF), which articulates Canada’s plan to meet its climate change commitments and
grow the economy. Four key areas were identified for concerted action with the Provinces and
Territories on transportation:
1. Setting emissions standards and improving efficiency
2. Putting more zero-emission vehicles on the road
3. Shifting from higher- to lower-emitting modes and investing in infrastructure
4. Using cleaner fuels
In order to accelerate the adoption of zero-emission vehicles (ZEVs), the Government of Canada set
ambitious targets of having 10% of all light-duty vehicle sales be ZEVs by 2025, 30% by 2030, and 100%
by 2040. As of the end of September 2019, ZEVs accounted for approximately 3.5% of new light-duty
vehicle sales in Canada. At that time, the rolling stock of ZEVs on Canada’s roads numbered
approximately 136,000. The leading provinces in terms of ZEV adoption are BC and Quebec, where ZEVs
represent 10% and 7% of new light-duty vehicle sales, respectively.2
Additional federal government measures to support ZEV adoption include:
• Budget 2017 allocation of $182.4M to support EV charging infrastructure (through the Electric
Vehicle and Alternative Fuel Infrastructure Deployment Initiative, or EVAFIDI)
• Budget 2019 allocation of $130M to support EV charging infrastructure at MURBs and
workplaces, and to support the electrification of last mile deliveries and transit vehicles (through
the Zero-Emission Vehicle Infrastructure Program, or ZEVIP)
• $300M is earmarked for the federal iZEV Program, which provides consumers with rebates of up
to $5,000 for the purchase of an eligible ZEV
• $265M has been allocated to the Accelerated Capital Cost Allowance for ZEVs purchased by
Canadian businesses
• Natural Resources Canada’s Generation Energy Council, consisting of 14 experts from across the
country with a mandate to advise on how Canada can transition to a reliable, affordable, low-
carbon economy
• The establishment of the Advisory Council on Climate Action, which will support the Canada’s
commitments under the Paris Agreement by helping the Government identify further
opportunities to reduce carbon pollution in the transportation and building sectors, using
sustainable financial mechanisms
• In 2018 Canada endorsed CALSTART’s Global Commercial Vehicle Drive to Zero Program, which
is focused on catalyzing the deployment of zero and low emissions medium- and heavy duty
vehicles such as buses and delivery vehicles
1 Environment and Climate Change Canada. 2019 National Inventory Report 1990 – 2017: Greenhouse Gas Sources and Sinks in Canada. Part 3. 2 Electric Mobility Canada. Electric Vehicle Sales in Canada – Q3 2019. 2019. (https://emc-mec.ca/wp-content/uploads/EMC-Sales-Report-2019-Q3_EN_v2.pdf)

10
Municipalities around the world are grappling with vehicle congestion on core roadways and the
associated air pollution. In addition, municipalities are setting GHG reduction targets and looking for
ways to improve local air quality. An area of municipal policy development that touches on each of
these issues is the creation of internal combustion engine (ICE) vehicle restricted or free zones and
implementation of other low-carbon mobility actions (LCMAs). Key elements of strategies aimed at
discouraging the use of ICE vehicles include:
• Controlling access to parking;
• Congestion and/or emission charges;
• Restricting road access; and,
• Low emission zones.
There are numerous international examples of municipalities implementing these types of actions (e.g.,
Madrid, Paris, London, Oslo, Bogota, Mexico City, New York, etc.) as well as complementary measures
such as decarbonizing public transit and regional freight movement. However, there are limited
informational resources for Canadian municipalities wishing to do the same. The intent of this project is
to develop a resource for Canadian municipalities that wish to explore or establish LCMAs as a means to
discourage the use of ICE vehicles in certain areas and encourage the use of ZEVs along with active
mobility and public transit.
1.1 Project Objective and Methodology
The objective of this project is to create a public-facing best practice guidance document to inform the
establishment of LCMAs. This document, intended for Canadian municipalities:
• Provides an overview of current and proposed actions globally;
• Expresses the value proposition for such actions (e.g., benefits of ZEVs/disadvantages of ICE vehicles in cities);
• Identifies barriers, challenges, and key considerations for the implementation of such actions; and,
• Provides solutions/approaches drawn from municipal best practice including stakeholder involvement and roles.
The project methodology included the following key components:
• Analysis framework: A framework was created to capture each type of LCMA determined to be in-scope along with the information to support a qualitative assessment on impacts including (but not limited to): environmental impact (GHGs and criteria air contaminants (CACs)), cost of implementation, cost of compliance, effectiveness of enforcement and social equity and fairness.
• Best practice research and interviews: The team conducted desktop research on LCMAs that have been implemented or are under consideration in leading international cities. Desktop research was augmented by expert interviews to collect information to populate the analysis framework and determine how challenges and barriers have been addressed.
Interviews were conducted with recognized experts in the field of sustainable transportation, specifically with respect to municipal actions. Organizations included academic and research

11
institutes, non-governmental organizations, municipal governments and transportation professionals.
• Synthesis: The team used the analysis framework to synthesize the following information into a report format:
o Challenges and opportunities associated with each type of action (based on the impacts included in the framework), translated into a Canadian context.
o Stakeholders involved and roles.
o Implementation best practice (best practice leveraging domestic and international examples, but adapted to ensure that barriers, opportunities and solutions reflect a Canadian context).
• Taken together, the information collected through the desktop literature review and interviews provides a comprehensive look at LCMAs and served as the basis for this report.
• Deliverables: Project deliverables included an interim report to present an annotated table of contents informed by outcomes of the synthesis; a draft report for comment; and a final report.
1.2 Benefits of ZEVs and disadvantages of ICE vehicles in cities
The combustion process that powers a conventional ICE vehicle produces GHG emissions (e.g., carbon
dioxide (CO2), methane (CH4), nitrous oxide (N2O)) and criteria air contaminant emissions (e.g.,
particulate matter (PM), volatile organic compounds (VOCs), nitrogen oxides (NOx), carbon monoxide
(CO)), which are released through the tailpipe, contributing to local air pollution and climate change.3
ZEVs, which include battery electric vehicles (BEVs), plug-in hybrid electric vehicles (PHEVs), and
hydrogen fuel cell electric vehicles (FCEVs), offer the potential to significantly reduce greenhouse gas
emissions and local air pollutants. ZEVs do not emit exhaust gases during electrically powered vehicle
operations. However, while there are no harmful tailpipe emissions, GHGs and other air pollutants may
be emitted when producing the electricity or fuel (i.e., generating electricity or producing hydrogen)
that powers these vehicles.4
GHG Emissions
The amount of GHG emissions reductions depends on the source of energy (i.e., electricity or hydrogen),
the carbon intensity of production (i.e., local energy supply mix, or hydrogen pathway), and the types of
vehicles used. A wide variety of studies, including one recently undertaken by the National Energy
Board,5 suggest that significant GHG emission savings can be achieved through the use of electric
vehicles, particularly BEVs, by leveraging low-emitting sources of electricity to charge the vehicles.6,7 The
3 Pollution Probe. Primer on Automobile Fuel Efficiency and Emissions. 2009. (http://www.pollutionprobe.org/publications/a-primer-on-automobile-fuel-efficiency-and-emissions/) 4 National Energy Board. How much CO2 do electric vehicles, hybrids and gasoline vehicles emit? 2018. (https://www.neb-one.gc.ca/nrg/ntgrtd/mrkt/ftrrtcl/2018-09-12hwmchcrbndxd-eng.html) 5 Ibid. 6 Maroufmashat, A., and Fowler, M. Policy Considerations for Zero-Emission Vehicle Infrastructure Incentives: Case Study in Canada. World Electric Vehicle Journal. 2018. (https://www.mdpi.com/2032-6653/9/3/38/pdf) 7 Schuller, A. and Stuart, C. (carbone 4). From Cradle to Grave: e-mobility and the energy transition. European Climate. 2018. (https://europeanclimate.org/wp-content/uploads/2018/09/From-cradle-to-grave-e-mobility-and-the-energy-transition_IT_SP_UK_EU.pdf)
12
same could be true using renewable energy powered electrolysis to produce hydrogen for FCEVs.
Regionally, emission reduction benefits from electric vehicle adoption will be greatest in the provinces
with less carbon-intensive electricity grids (e.g., Québec, Manitoba, British Columbia (BC), Prince Edward
Island, Ontario, Newfoundland and Labrador, and Yukon).8,9 However, in more carbon-intensive
jurisdictions (e.g., Alberta), renewable and distributed generation sources, such as rooftop solar
photovoltaics, could be used to enhance and supplement grid-supplied electricity.10
CAC Emissions
Air pollutants (i.e., CACs) contribute to poor air quality and/or smog formation, and can have direct,
negative impacts on human health, such as eye, nose or throat irritation, decreased lung function,
respiratory problems, cardiac disease, or cognitive development disorders.11 Common CACs include
particulate matter (including PM10, PM2.5, and ultrafine particles, or PM0.1), carbon monoxide (CO),
nitrogen oxides (NOx), sulphur oxides (SOx), and volatile organic compounds (VOCs).12 Recent efforts to
mitigate emissions from ICE vehicles (e.g., the development and commercial adoption of gasoline direct-
injection engines) have in some cases led to an increase in ultrafine particle emissions, which are
believed to have significant impacts on human health, though more research is required on this
emerging topic.13 The predominant use of ICE vehicles in highly congested traffic zones (e.g., city
centres) significantly contributes to local air pollution. On the other hand, ZEVs have no, or limited,
tailpipe emissions of air pollutants, and as a result, their use can have significant positive impacts on
human health by improving local air quality. The use of ZEVs in cities shifts emissions from vehicle
tailpipes to power plants (or hydrogen production facilities), which are typically located away from
dense population centres and can be better equipped to control and monitor air pollutants than
individual vehicles.14 This is of particular interest to dense, highly populated cities that struggle with
local air quality issues.
Additional Benefits
Noise Pollution: Road traffic has been identified as one of the primary sources of environmental noise
pollution in cities. Compared to ICE vehicles, ZEVs are quieter as they do not produce conventional
engine noise. The quieter driving environments of ZEVs can have significant mental health benefits,
8 National Energy Board. Feature Article: How much CO2 do electric vehicles, hybrids and gasoline vehicles emit? 2018. (https://www.neb-one.gc.ca/nrg/ntgrtd/mrkt/ftrrtcl/2018-09-12hwmchcrbndxd-eng.html) 9 Pollution Probe and The Delphi Group. Accelerating the Deployment of Zero Emission Vehicles: Atlantic Canada and the Prairies. 2018. (http://www.pollutionprobe.org/publications/accelerating-deployment-zevs-atlantic-canada-prairies/) 10 National Energy Board. Feature Article: How much CO2 do electric vehicles, hybrids and gasoline vehicles emit? 2018. (https://www.neb-one.gc.ca/nrg/ntgrtd/mrkt/ftrrtcl/2018-09-12hwmchcrbndxd-eng.html) 11 Pollution Probe. Primer on Automobile Fuel Efficiency and Emissions. 2009. (http://www.pollutionprobe.org/publications/a-primer-on-automobile-fuel-efficiency-and-emissions/) 12 Statistics Canada. Human Activity and the Environment: Annual Statistics. 2006. (https://www150.statcan.gc.ca/n1/pub/16-201-x/2006000/9515-eng.htm) 13 Southern Ontario Centre for Atmospheric Aerosol Research (SOCAAR). Near-Road Air Pollution Pilot Study. 2019. (https://tspace.library.utoronto.ca/bitstream/1807/96917/4/Near%20Road%20Study%20Report.pdf) 14 Pollution Probe and The Delphi Group. Accelerating the Deployment of Zero Emission Vehicles: Atlantic Canada and the Prairies. 2018. (http://www.pollutionprobe.org/publications/accelerating-deployment-zevs-atlantic-canada-prairies/)

13
including being more focused, less stressed, and happier than when driving an ICE vehicle.15 Excessive
and prolonged exposure to noise, including from ICE vehicles, has been linked to a range of serious
health problems, such as stress, high blood pressure, productivity losses, sleep disturbance, annoyance,
cardiovascular disease, cognitive impairment, and others.16 These benefits of course extend beyond ZEV
drivers and passengers to the general public in urban environments.
Total Cost of Ownership (TCO): ZEVs (specifically electric vehicles) have a lower TCO when compared to
conventional ICE vehicles, but the difference varies by region and vehicle mileage.17 The TCO includes
factors such as purchase price, fuel cost, operating and maintenance costs, annual mileage,
depreciation, etc.18 In addition, vehicle subsidies are a key factor in influencing TCO.19 The upfront
purchase price is typically higher for ZEVs than for comparable ICE vehicles. Bloomberg New Energy
Finance expects the costs of batteries (for electric vehicles) will fall below $13020 per kilowatt-hour by
2025, a rate that should enable purchase cost parity between electric vehicles and ICE vehicles to begin
around 2024.21 On the other hand, ZEVs have lower operational and maintenance costs than ICE
vehicles. For example, Plug’n Drive suggests that the average electric vehicle driver in Canada, travelling
20,000 km per year, can save as much as $2,000 each year on fuel.22 In addition, ZEVs require less
maintenance than ICE vehicles because they have far fewer moving parts and fewer fluids to change
(such as oil and transmission fluid),23 which can save hundreds of dollars each year on maintenance.24
Finally, ZEVs currently have higher depreciation rates than conventional ICE vehicles. However, some
used electric vehicle models are beginning to show retained value improvements25 and greater
depreciation for electric vehicles may help with social equity, as it makes used electric cars more
affordable for consumers who may not be able to afford a new electric vehicle.26
15 LEVC. Electric Vehicles Reduce Stress Behind the Wheel. 2018. (https://www.levc.com/corporate/news/ev_reduce_stress/) 16 World Health Organization. Burden of disease from environmental noise. 2011. (https://www.who.int/quantifying_ehimpacts/publications/e94888.pdf?ua=1) 17 Coren, M.J. Electric cars are changing the cost of driving. Quartz. 2019. (https://qz.com/1737145/the-economics-of-driving-seven-teslas-for-2-5-million-miles/) 18 Pollution Probe and The Delphi Group. Accelerating the Deployment of Zero Emission Vehicles: Atlantic Canada and the Prairies. 2018. (http://www.pollutionprobe.org/publications/accelerating-deployment-zevs-atlantic-canada-prairies/) 19 Palmer, K. et al. Total cost of ownership and market share for hybrid and electric vehicles in the UK, US and Japan. Applied Energy, Volume 209. 2018. (https://www.sciencedirect.com/science/article/pii/S030626191731526X?via%3Dihub) 20 All monetary figures in this report are expressed in Canadian dollars unless otherwise indicated. 21 Hodges, J. Electric Cars May Be Cheaper Than Gas Guzzlers in Seven Years. Bloomberg. 2018. (https://www.bloomberg.com/news/articles/2018-03-22/electric-cars-may-be-cheaper-than-gas-guzzlers-in-seven-years) 22 Plug‘n Drive. Electric Car Benefits. 2018. (https://www.plugndrive.ca/electric-vehicle-benefits/) 23 Office of Energy Efficiency & Renewable Energy. Electric Car Safety, Maintenance, and Battery Life. 2018. (https://www.energy.gov/eere/electricvehicles/electric-car-safety-maintenance-and-battery-life) 24 Plug‘n Drive. Electric Car Benefits. 2018. (https://www.plugndrive.ca/electric-vehicle-benefits/) 25 Muller, D. Used EV prices are finally heating up – a little. Automotive News. 2018. (https://www.autonews.com/used-cars/used-ev-prices-are-finally-heating-little) 26 Durbin, D. Electric cars have benefits, but likely won’t save you money. Phys Org. 2018. (https://phys.org/news/2018-02-electric-cars-benefits-wont-money.html)

14
2. Taking Stock
Low-carbon mobility actions (LCMAs) can be defined as any direct measure that discourages, restricts or
bans certain vehicles (e.g., ICE vehicles) from operating in certain areas (e.g., urban cores). In addition to
direct actions, LCMAs can include complementary actions focused on increasing active transportation
and mass/public transit. While the specific motivation for each city to implement such measures may
vary (e.g., reducing congestion, minimizing impact on infrastructure, prioritizing pedestrians, improving
local air quality, etc.), all LCMAs work toward reducing transportation related GHG and CAC emissions.
Direct LCMAs for this study were divided into four categories:
• Parking space removal;
• Congestion/emission charges;
• Restricted road access; and,
• Low emission zones.
Each of these types of LCMAs is briefly described in Table 1, along with examples of cities that have
successfully implemented the actions. Detailed overviews of each bolded city and the LCMAs they have
implemented are found in Appendix A.
Table 1 – Direct LCMAs
Type of Action Description City Examples Parking space removal
Primarily involves the removal of public parking spots, usually in an urban core or in a specific/targeted neighbourhood, to discourage people from driving to or in the area. Can also include reducing or eliminating the minimum number of parking spots required in new or renovated developments.
• Oslo, Norway • Freiburg, Germany
• Amsterdam, Netherlands
• Zurich, Switzerland
• Copenhagen, Denmark
• Paris, France
• Portland, Oregon
• New York, New York
• San Francisco, California
Congestion/emission charges
Apply a charge to a certain area of a city or specific roads or bridges. Charges are typically applied on business days to reduce congestion, sometimes with exemptions or discounts for cleaner vehicles, taxis, buses, etc. The amount of the charge may vary by time of day or level of congestion. The main motivations for congestion charges are typically to reduce congestion/improve trip reliability, generate funds for public transit, and/or reduce emissions.
• London, England
• Stockholm, Sweden
• Singapore, Republic of Singapore
• New York, New York (pending)
• Oslo, Norway
• Gothenburg, Sweden
• Stockholm, Sweden
• Milan, Italy

15
Type of Action Description City Examples Restricted road access
Details of actions vary more in this category than others; however, the common theme among the restricted access initiatives is that they all restrict traffic in one way or another and the scale is small (e.g., a few blocks on one street or a few streets in one neighbourhood). The reasons for restricting access also vary by action/city, but examples include providing for transit priority, prioritizing pedestrian use, reducing pollution, minimizing impact on adjacent infrastructure, benefits to tourism, etc.
• Multiple Italian cities (e.g., Rome, Florence, Siena)
• New York, New York
• Toronto, Ontario
Low emission zones (LEZs)
LEZs typically cover large areas of a city (e.g., entire city or city centre) and restrict access for (i.e., ban or charge) certain vehicles (e.g., older, higher polluting vehicles). In addition, many LEZs provide preferential access and parking to the least polluting vehicles (e.g., ZEVs). The restrictions may apply 24/7 or be similar in nature to congestion charges where they apply only on business days. LEZs may ban certain types of vehicles or impose access charges. A number of cities that currently have LEZs are tightening restrictions (year-over-year) and moving toward zero emission zones (ZEZs). The main motivation for implementing LEZs is typically to reduce local air pollution.
• Madrid, Spain
• Paris, France (and over two dozen more French cities)
• London, England
• Milan, Italy
• Brussels, Belgium
• Amsterdam, Netherlands
• Barcelona, Spain
• Lisbon, Portugal
• Berlin, Germany
• Glasgow, Edinburgh, Aberdeen, and Dundee, Scotland (pending)
• Laval, Quebec27
Direct LCMAs do not work in isolation but must be part of a larger strategy.28 As a result, in addition or
as a precursor to direct LCMAs, cities may introduce complementary actions as well. Complementary
actions identified through this study have captured in the tables below.
The tables present brief descriptions of complementary actions within five categories that could be
implemented along with the direct actions outlined above. Many of these complementary actions can
be used as means to overcome the sometimes substantial barriers to implementing LCMAs, as noted in
Section 4. The bolded cities in the tables were assessed as part of the project’s literature review, and
27 La Presse. Towards a car-free neighbourhood in Laval. 2020. (https://www.lapresse.ca/actualites/grand-montreal/202002/03/01-5259397-vers-un-quartier-sans-voiture-a-laval.php) 28 C40 Cities Climate Leadership Group. How to design and implement a clean air or low emission zone. C40 Knowledge Implementation Guides. 2019. (https://www.c40knowledgehub.org/s/article/How-to-design-and-implement-a-clean-air-or-low-emission-zone?language=en_US)

16
case study details can be found in Appendix A. The remainder of this report focuses on the four direct
LCMAs identified above.
Table 2 – Complementary LCMAs Related to Infrastructure and Public Transit
Type of Action Description City Examples Enhance and connect active transportation infrastructure
A focus on increasing active mobility (cycling and walking) can involve a variety of actions, such as:
• Reallocating road space to cycling and pedestrian use – example, expanding bike lanes, prioritizing pedestrians (e.g., wider sidewalks, benches, green space, etc.)
• Improving pedestrian and cycling safety (e.g., through infrastructure and technology)
• Reducing speed limits on urban streets
• Offering or enhancing shared micro-mobility services (e.g., bike sharing, e-bike sharing, scooter sharing)
• Increasing accessibility to active modes (e.g., grants and rebates for bikes/e-bikes/cargo bikes).
A Montreal-based study from 2016 found that every 7% increase in length of dedicated cycling infrastructure will lead to a 2% reduction in municipal transportation GHG emissions.29
• London, England
• Stockholm, Sweden • Singapore, Republic of
Singapore
• Oslo, Norway
• Freiburg, Germany
Allocate LCMA revenues to public and active transit improvement
A common point raised among experts is that stakeholders impacted by LCMAs must be provided with viable alternatives to meet their travel needs. Improving accessibility to public and active transit is the most widely cited measure for ensuring safe and convenient travel in an area impacted by LCMAs. Allocating revenues generated from LCMAs exclusively to public and active transit enhancements is a way to ensure that benefits accrue to all members of society. It can also help to ensure that stakeholder buy-in for LCMAs is strong.
• London, England
• Paris, France
Enhance public transit service and coverage
A focus on increasing or improving mass/public transit can involve a variety of actions, such as:
• More frequent service (buses, trains)
• Longer service hours
• Additional and/or revised bus routes
• Increased number of low-carbon transit vehicles (buses, trains)
• Decreased fees or free transit
• Fare integration across multiple modes and areas
• Increased number of park and ride spaces.
• London, England
• Stockholm, Sweden
• Singapore, Republic of Singapore
• Oslo, Norway
• Tallinn, Estonia
29 Zahabi, S.A.H. et al. Exploring the link between the neighborhood typologies, bicycle infrastructure and commuting cycling over time and the potential impact on commuter GHG emissions. Transportation Research Part D: Transport and Environment, Volume 47. 2016. (https://www.sciencedirect.com/science/article/pii/S136192091630270X)

17
Type of Action Description City Examples There is widespread agreement among experts that the implementation of any direct LCMAs should be complemented by improved access to viable public transit options.
Enhance public charging/ refueling infrastructure for ZEVs
ZEV adoption can be accelerated through the provision of easy-to-access public charging infrastructure. Even if infrastructure utilization is low initially, its presence can help to inspire confidence and interest in emerging transportation technologies. Level 2 EV charging is appropriate for locations such as multi-unit residential buildings, workplaces, and commonly-visited amenities (e.g., shopping centres, parks, theatres, gyms). Level 3 charging (DCFC) is more appropriate for highway corridors and sites frequented by medium- and heavy-duty vehicles. Cities can address this independently and through working with networks of public and private sector partners.
• San Francisco, California
• London, England
• Paris, France
• Oslo, Norway
Table 3 – Complementary LCMAs Related to Financial Levers
Type of Action Description City Examples Variable parking fees/structure
Variable parking fees or structure can involve a variety of actions, such as:
• Preferential parking and pricing for ZEVs
• Variable parking fees that discourage driving by reflecting the real-time, real costs of parking
• Increased parking fees inside congestion or low emission zones.
• Singapore, Republic of Singapore
• San Francisco, California
Support for impacted low-income households and/or small businesses
To ensure LCMAs do not disproportionately disadvantage low-income earners or small businesses, consider offering tailored support to impacted stakeholder groups in these categories. Such support could take the form of transit vouchers, ZEV purchase rebates (for new and, perhaps more importantly, used ZEVs), or preferential trade-in/scrappage program offerings for low-income households. For low-income neighbourhoods, support could include expanded accessibility to public transit options.
For small businesses, support could take the form of free/discounted advertising in public spaces, free/discounted consulting, membership on advisory councils or task forces, or data and analytics related to LCMAs.
• Brussels, Belgium
• Portland, Oregon
Support for ZEV car sharing, ride sharing, delivery and transit fleets
Fleet vehicles log far more mileage than privately owned vehicles, and should therefore be prioritized for electrification. Consider offering municipal rebates or other incentives for ZEV purchases by fleets. Over their lifetime, these vehicles will generate the greatest GHG and CAC emissions reductions and related benefits.
• Utrecht, Netherlands
• Laval, Quebec
• La Rochelle, France

18
Type of Action Description City Examples Health taxes on heavily polluting vehicles
A small percentage of vehicles on the road are responsible for a disproportionate amount of total transportation GHG and CAC emissions. Cities can explore the feasibility of imposing a health tax on heavily polluting vehicles to encourage vehicle owners to adopt better maintenance practices and consider the adoption of cleaner vehicles.
A portion of revenues from the taxes could be allocated to initiatives in neighbourhoods most impacted by heavily polluting vehicles (e.g., residential areas and schools near major highways).
Adjust public parking rates
Cities are capable of increasing public parking rates to encourage public transit and ride sharing usage. They can also implement variable parking rates based on time of day, location, or usage levels to discourage the use of ICE vehicles during peak hours, which would thereby reduce congestion.30
• San Francisco, California
• Davis, California
Compile economic data for impacted businesses
Limiting vehicular access to retail hubs can understandably make local business owners nervous. Providing them with detailed economic impact analyses and case study data from other municipal LCMAs can help to alleviate concerns and encourage buy-in.
• Toronto, Ontario
Municipal gas tax Cities in Canada are able to impose municipal petroleum taxes in addition to what provinces and the federal government levy. Only three Canadian municipalities charge such a tax – Montreal, Vancouver, and Victoria. This can be an effective tool for discouraging ICE vehicle use and enhancing municipal tax revenues, which can be allocated to low-carbon mobility initiatives.
• Montreal, Quebec
• Vancouver, BC
• Victoria, BC
Table 4 – Complementary LCMAs Related to Regulatory Instruments
Type of Action Description City Examples Car free days Introduce a regular (e.g., weekly, monthly, annual) car-free
day in a certain area of the city (e.g., urban core). This builds support for a permanent ban on vehicles, as residents and visitors experience what the city/area would be like with no cars.
• Paris, France
• Milan, Italy
• Copenhagen, Denmark
• Brussels, Belgium • Munich, Germany
• Addis Ababa, Ethiopia
• Jakarta, Indonesia
• Reykjavik, Iceland
• Minneapolis, Minnesota
• San Antonio, Texas
• Bogota, Colombia
• Mexico City, Mexico
30 Donald Shoup’s The High Cost of Free Parking was highly recommended by several expert interviewees in relation to the subject of public parking space removal.

19
Type of Action Description City Examples LCMA exemptions
Consider exempting certain types of vehicles and/or users from roads impacted by LCMAs. Exemptions may be phased out over time as restrictions become more stringent.
• Vehicles exempted might include: transit vehicles, ride-share and taxi fleets, rental vehicles, ZEVs, delivery vehicles, high-occupancy vehicles, scooters/mopeds, motorcycles, etc.
• Users exempted might include: local residents, disabled permit holders, captive drivers (those who require a personal vehicle for work, or work night shifts when transit may be unavailable), first responders, low-income households, etc.
• Paris, France
• London, England
• Stockholm, Sweden
• Singapore, Republic of Singapore
Phase in increasingly stringent standards/ restrictions
As road users will become more familiar with and accepting of usage restrictions over time, it is advised that cities beginning the process of implementing LCMAs start small, with a narrow scope of impacted roadways and users. As actions are refined, standard practices emerge, and users become accustomed to restrictions, phase in further restrictions gradually.
It is advisable to begin LCMAs as demonstrations, in part to help alleviate public pushback. LCMAs can be made permanent once it has been demonstrated that benefits are being realized (via data collection, monitoring, and surveys), and once public and key stakeholder group buy-in has occurred.
• Paris, France
• London, England
• Madrid, Spain
• Toronto, Ontario
• Stockholm, Sweden
Provide ample lead time
Ensure that the public and impacted stakeholder groups are provided with ample lead time to adapt their behaviours and/or vehicles accordingly. This will allow residents and businesses to adapt, and to cultivate interest in low-carbon mobility as well as champions for it.
• Milan, Italy
• Rome, Italy
• Brussels, Belgium
Establish ICE vehicle phase-out timelines and targets
Longer term targets or visions can be an effective way to send market signals, and inform the private sector about the types of changes to local transportation systems that will be taking place in the coming years. Establishing timelines and targets related to ICE vehicle restrictions, or restrictions on certain types of heavily-emitting vehicles (e.g., heavy-duty diesel trucks) can encourage companies and citizens alike to begin actively exploring alternative options.
• Milan, Italy
• Rome, Italy
• Copenhagen, Denmark
• Oslo, Norway
• Madrid, Spain
• Brussels, Belgium
• Dusseldorf, Germany
• Stuttgart, Germany
• Paris, France
• Athens, Greece
Factor fleet carbon intensity into bids on City contracts
Cities can weight evaluation criteria for municipal public works, development, and service bids to favour contractors with low-emission fleets. Many construction and service vehicles are amenable to electrification or hybridization, and as these vehicles interface closely and frequently with the general public, they should be prioritized for emissions reductions. Giving clean fleet operators favourable treatment would encourage the adoption of ZEVs in commercial fleets.
• New York City, New York

20
Type of Action Description City Examples Monitor and collect data from adjacent areas
A common concern related to LCMAs is that while they may address problems in one part of a city (e.g., congestion, air quality), they have the potential to exacerbate these problems in adjacent areas. If LCMAs do not fundamentally change transportation decision-making, they can end up funnelling the traffic restricted in one area to another area. Data should be collected from areas nearby LCMA zones to ensure negative impacts are not simply shifted to new locations. Data collection and traffic modelling prior to LCMA implementation will help municipalities develop potential mitigation measures and strategies.
• Stockholm, Sweden
• Toronto, Ontario
• New York City, New York
Table 5 – Complementary LCMAs Related to Partnerships
Type of Action Description City Examples Collaboration with local transportation hubs on decarbonization strategies and supporting mechanisms
Hubs such as ports, airports, goods movement centres, etc., are often overseen by a dedicated body. These bodies should work with municipal authorities on the co-development of decarbonization strategies and supporting mechanisms such as charging infrastructure.
• Region of Peel, Ontario
• La Rochelle, France
Consultation Consult with key stakeholder groups and the general public early on in the planning processes. To be most effective, LCMAs should be co-developed with those who will be impacted, and will likewise see the most benefits. Major barriers will take time and expertise to overcome, and this expertise will likely have to be cultivated within city staff. Thorough consultations will also ensure that any major red flags are examined and addressed prior to implementation.
• Toronto, Ontario
• Freiburg, Germany
Develop educational materials
Develop and share educational materials aimed at fleet technicians and vehicle operators to reduce the learning curve on ZEVs. Consider doing this in collaboration with a dedicated fleet taskforce.
Materials aimed at the general public, to inform consultations and communications campaigns, should also be developed. These materials should focus on the risks associated with vehicle emissions and the benefits of LCMAs. They should also focus on communicating proposed LCMA rules, and describing the alternative modes of travel available.
• London, England
• Stockholm, Sweden
Communication Clearly communicate and explain the rationale for LCMAs to the public. Highlight health and air quality impacts, as these benefits accrue to everyone and have immediate effects. Further, it is important to explain what any revenues associated with LCMAs will, or could, be used for. Communications should be clear, brief and in simple language, and should also be accessible via a variety of mediums.
• London, England
• Stockholm, Sweden

21
Type of Action Description City Examples Encourage ZEV and related equipment manufacturing locally
LCMAs have the potential to lead to spikes in local ZEV adoption, and this could encourage more related manufacturing close to where the market for ZEVs is greatest. Vehicle and equipment manufacturers often make decisions on where to locate production facilities based on where the most robust markets for ZEVs are. Cities implementing LCMAs should look to leverage local capacity and experience in manufacturing so it can serve an expanding ZEV market.
• Geneva, Switzerland
ZEV demonstrations and ride and drives
Ride and drive events, which provide people with hands-on experience using ZEVs, can be hosted by cities to help raise awareness. Such events can be targeted at the general public but also at fleets. They can be hosted in collaboration with local EV societies, automakers, dealerships, and early adopter fleets.
• Sacramento, California
• Atlanta, Georgia
Commercial vehicle strategy
Develop decarbonization strategies explicitly for local commercial vehicles, which include light, medium and heavy duty fleets. In terms of emissions inventories (e.g., PM), commercial vehicles have the biggest impacts on human health. A strategy to guide the regulation of these vehicles and engagement with fleets will be one of most difficult aspects of LCMAs, especially given that ZEV options are limited and much more expensive for medium and heavy duty trucks. Commercial fleet operations are also highly sensitive to factors such as fuel cost, congestion and access to destinations. Even relatively small changes in policy can be magnified in fleet operations and have major impacts on profitability.
• Region of Peel, Ontario
• La Rochelle, France
Table 6 – Complementary LCMAs Related to Planning and Urban Design
Type of Action Description City Examples Remove/reduce minimum parking space requirements for new developments
Local building codes and bylaws can be amended to reduce parking requirements on new and renovated developments. Incentivizing developers to provide for alternative types of land uses, such as green spaces, retail, or active transportation corridors can be a more environmentally friendly and lower-cost option. Inversely, the imposition of parking space maximums for new developments could lead to comparable benefits.
• Amsterdam, Netherlands
• Madrid, Spain
Provide more and/or cheaper parking at public transit hubs
To make public transit usage more convenient for out-of-town commuters, cities can choose to increase the number of parking spaces at key transit hubs, especially terminal hubs on city peripheries. Additionally, cities can reduce daily parking rates or provide discounted monthly or annual parking passes to encourage commuters to choose public transit. Providing ZEV charging infrastructure at priority parking areas in transit hubs can further encourage low-carbon mobility.
• Oshawa, Ontario
• Calgary, Alberta
• Amsterdam, Netherlands

22
Type of Action Description City Examples Neighbourhood densification
The densification of both city centres and suburbs is integral to increasing low-carbon mobility usership levels. If access to personal vehicles is to be limited, a sufficient range of amenities must be made available locally to meet the needs of residents. Mixed, densified neighbourhoods make the movement of people via low-carbon modes of transport more viable.
• Region of Peel, Ontario
Use reclaimed real estate creatively
Be creative when engaging in actions such as removing public parking spaces or narrowing roads. The public should be able to palpably experience the benefits of LCMAs. The re-allocation of land previously reserved for vehicles should be focused on providing local amenities that will drive visitors to the area. Amenities such as food stands, patios, green spaces, farmers’ markets and pedestrian and cycling infrastructure are examples of land uses that may be appropriate. Cities could host contests for the best ideas or seek ideas from students and neighbourhood organizations.
• Toronto, Ontario
• Amsterdam, Netherlands
• Montreal, Quebec
Integration of transportation and land-use planning
Wherever possible, cities should incorporate low-carbon transportation into major land-use planning initiatives (e.g., managed lane strategies with ZEV privileges, first/last mile ZEV mobility options as part of public transit systems).
• New York City, New York
Incorporate ZEV transportation into municipal energy plans
Accounting for increases in the use and provision of electricity due to ZEV adoption should be a part of any modern municipal energy plan. It is not only important that ZEVs have access to charging, but that the electricity used to charge them is as low-carbon as possible. Local utilities will need to consider and plan for the impact of increased ZEV uptake on their distribution assets.
Prepare for CAVs Connected and autonomous vehicles (CAVs) have the potential to significantly increase or decrease emissions from transportation. Cities should monitor emerging developments in the CAV space and be prepared to guide and leverage connectivity and automation gains as network capacities emerge.
• Singapore, Republic of Singapore

23
3. LCMA Costs and Benefits
3.1 Advantages
LCMAs can help to facilitate the achievement of municipal policy objectives, especially those related to
environmental targets and human health impacts. The primary advantage common to all types of
LCMAs are greenhouse gas (GHG) and criteria air contaminant (CAC) emissions reductions. Common
secondary advantages include the promotion of active transportation and public transit, and reduced
congestion.
Reducing emissions from municipal transportation systems contributes to GHG reductions and improved
local air quality. Many cities have adopted GHG reduction targets or are more generally looking to
engage in climate change mitigation efforts. As transportation is the leading source of GHG emissions in
most Canadian cities, and as alternatives to fossil fuel-powered transport become more viable every
year, engaging in efforts to decarbonize local transportation networks can have significant and
immediate impacts on a city’s GHG profile.
Like GHG emissions, transportation tends to be the largest source of CACs in Canadian cities.31 Because
CACs are known to have a wide range of negative human health effects, mitigating their release can lead
to reduced incidences of a range of common ailments, substantive savings to public health systems, a
more productive labour force, and a generally enhanced quality of life for city residents. While dollar
figures regarding human health may not be the best metric by which to gauge CAC reduction impacts, a
2014 OECD study on the health effects of on-road transport in Canada found that traffic-related air
pollution leads to over $32 billion annually in avoidable healthcare costs.32 In Toronto alone, traffic-
related air pollution is responsible for approximately 1,300 premature deaths and 3,550 hospitalizations
each year.33
Due to their ability to stem emissions of GHGs and air pollutants, LCMAs provide cities with a powerful
set of tools by which they can contribute to climate change mitigation and help to protect the health
and well-being of residents.
Promoting the use of public transit and active transportation offers cities benefits in a number of areas.
Travelling on a diesel bus is more energy efficient and reduces GHG emissions by an average of 70%
when compared to travel by single-occupancy car.34 Efficiency benefits and emissions reductions are
compounded further when transit vehicles use lower carbon fuels or alternative powertrains, and also
when utilization rates of public transit increase. Restricting the use of internal combustion engine
vehicles promotes the use of public transit and active transport. In turn, increased ridership generates
31 Statistics Canada. Human Activity and the Environment: Annual Statistics. 2006. (https://www150.statcan.gc.ca/n1/pub/16-201-x/2006000/9515-eng.htm) 32 Organisation for Economic Co-operation and Development (OECD). The Cost of Air Pollution: Health Impacts of Road Transport. 2014. (http://www.oecd.org/env/the-cost-of-air-pollution-9789264210448-en.htm) 33 Environmental Commissioner of Ontario (ECO). Climate Action in Ontario: What’s Next? 2018 Greenhouse Gas Progress Report. 2018. (https://docs.assets.eco.on.ca/reports/climate-change/2018/Climate-Action-in-Ontario.pdf) 34 BBC. Climate Change: Should you fly, drive or take the train? 2019. (https://www.bbc.com/news/science-environment-49349566)
24
more revenue for cities to invest back into public transit networks and active transportation
infrastructure. Further, increased transit usage provides cities with the justification for transit system
expansion and enhancements. Investments in public transit are more likely to gain public approval if
systems are broadly utilized and viewed as integral to getting around.
LCMAs are also valuable tools for cities due to their ability to reduce congestion. Through limiting the
number of vehicles on the road and through enhancements to public and active transit, LCMAs
contribute to improved travel times and increased productivity and quality of life for residents.
Parking Space Removal
The removal of public parking spaces, and limiting the creation of new spaces, can significantly improve
the value proposition for active and public transit. For many urban residents and commuters, taking
public transit or choosing active transportation is still viewed as a more inconvenient option than driving
a passenger vehicle. However, cities can help to tip the scales of convenience towards transit and active
mobility by engaging in LCMAs such as the removal of parking spaces. By making travel via passenger car
slightly less convenient and more expensive, commuters will be encouraged to adopt low-carbon and
lower-cost options.
Like all LCMAs, the removal of parking spaces should be accompanied by the enhancement of public
transit networks and pedestrian and cycling infrastructure. In many cases, the removal of public parking
can create additional space for low-carbon transit infrastructure. It can also create space for amenities
that will attract people to a given area. Food stands, patios, green space, farmers’ markets and public
gathering places all serve to make neighbourhoods more desirable, and these types of land uses are
appropriate for areas formerly reserved for parking.
Congestion/Emissions Charges
Aside from emissions reductions and shifting commuters to low-carbon mobility options, the two major
advantages of congestion charges are reduced congestion and travel times and revenue generation.
Congestion charges are intended to discourage the use of highly trafficked roadways in certain areas at
certain times. Like other LCMAs, congestion charges are not typically meant to impose a prohibitive
barrier to passenger vehicle usage, but they are meant to make that option slightly more inconvenient
for commuters. Congestion itself is already serving to detract from the value proposition of car
ownership and use among residents of Canada’s biggest cities, and the implementation of congestion
charges could help to accelerate this trend.
Congestion charges are also a way by which cities can collect revenues that can be put towards road
maintenance and public and active transit enhancements. Several experts interviewed for this project
mentioned that gas tax revenues (which are primarily used for road maintenance) are likely to trend
downwards in the coming years due to the rising popularity of ZEVs. Congestion charges can help to
supplant this decline in revenue for municipal governments. Further, a significant portion of congestion
is caused by non-residents who commute into cities on a regular basis. These commuters do not pay
property taxes or their share of the gas taxes that cities need to maintain their transportation
infrastructure. Applying a congestion charge can ensure that the users of roads are the ones who pay
the most to maintain them.

25
Restricted Road Access
Restricting access to privately-owned passenger vehicles on certain roads has proven to be an effective
way to encourage the use of public and active transit. Transit vehicles move more freely and become
more reliable when they have less private vehicular traffic with which to contend. This helps to improve
ridership and allows for more frequent public transit service.
Restricting the use of passenger vehicles also serves to make streets safer for active transportation.
Many studies have shown that networks of dedicated bike paths, separated from vehicular traffic, can
lead to significant increases in the number of urban residents who choose to cycle rather than drive or
take another form of motorized transport.35 If cyclists do not have to constantly contend with large
vehicles and drivers who are often distracted and frustrated, they are likely to cycle more often. Some
Canadian cities have even established targets for the proportion of short trips that should be taken using
active mobility. In addition to environmental benefits, public transit has been shown to offer significant
health benefits over driving, as users must walk at various points between their origin and destination. A
study by the American Heart Association found that people who use public transit are 44% less likely to
be overweight, 27% less likely to have high blood pressure, and 34% less likely to have diabetes,
compared to people who drive as part of their daily routine.36
Restricting access on certain roads is much easier to implement than a large-scale low emission zone,
and is also more likely to gain public support. Many cities have begun restricting access on certain
streets at certain times of the week or year, and these initiatives tend to be popular. This type of action
could gradually be phased in and scaled up to help people become accustomed to not being able to
drive a car anywhere, at any time.
Low Emission Zones
The primary advantage of low emission zones (LEZs) in cities are GHG and CAC emissions reductions.
Whenever the use of internal combustion engines is restricted or limited, air quality benefits will be
realized. As is demonstrated by preliminary data collected at LEZ sites around the world, air quality
benefits can be significant and immediate (see Appendix A for examples). These benefits are most
pronounced when LEZs target the most polluting vehicles.
Beyond air quality improvements and GHG reductions, LEZs benefit cities by promoting physical activity
through the use of active transportation and public transit. They may also provide cities with the
opportunity to reclaim some of the valuable real estate currently reserved for roads and parking. What
cities do with that extra space depends on the preferences and priorities of local residents.
Several experts interviewed stated that the implementation of LEZs can lead to corollary economic
benefits by enhancing ZEV sales locally and potentially attracting the manufacture of ZEVs and the
equipment required to support them.
35 Winters, M. and Teschke, K. Route Preferences Among Adult in the Near Market for Cycling: Findings of the Cycling in Cities Study. American Journal of Health Promotion. 2010. (http://cyclingincities-spph.sites.olt.ubc.ca/files/2015/01/Winters-Teschke-2010-Route-preferences-among-adults-in-the-near-market-for-bicycling-findings-of-the-cycling-in-cities-study.pdf) 36 McKie, H. Health Benefits of Public Transit. Green Action Centre. 2017. (https://greenactioncentre.ca/healthy-travel/health-benefits-of-taking-transit/)
26
It is worth noting that some cities, such as London, Amsterdam, Madrid, Paris, and Brussels, have
already announced plans to transition beyond LEZs to zero emission zones (ZEZs), which would restrict
travel by any fossil fuel powered vehicle in certain areas.37
3.2 Disadvantages
If LCMAs were purely beneficial to cities, their implementation would currently be far more widespread.
Pioneering cities with regard to LCMAs tend to have high population densities and spatial constraints. In
North American cities, which tend to be less dense and larger geographically than their European and
Asian counterparts, the impetus for implementing LEZs has not been as strong as in other parts of the
world. In the recent past, when congestion and air pollution emerged as major issues in North America,
highways and arterial roads still had room for expansion, new parking lots could be constructed, and
suburban sprawl could provide residents seeking a little space with an alternative to bustling
downtown cores.
As times have changed, however, cities in North America are beginning to take a closer look at LCMAs.
As they engage in exploring some options, a number of significant disadvantages need to be addressed.
Disadvantages common to all LCMAs include social equity issues, lack of public acceptance and
political risk.
When the use of internal combustion engine vehicles is restricted or discouraged, certain residents may
be more affected than others. High income earners tend to be able to navigate their way around
restrictions by paying more to use road and parking infrastructure, and by having the ability to move to
an area nearby their workplace or a transit hub. Low income residents are most often confined to
certain neighbourhoods that may not be conveniently located to employment centers or accessible
transit. Many low income earners are “car captives” – forced to use a personal vehicle to avoid
prohibitively long commutes via transit, or by working shifts outside of typical 9-to-5 schedules. When
planning and implementing an LCMA, special accommodations must be made for low-income
neighbourhoods to ensure that the already constrained mobility of their residents is not further
constrained.
Perhaps the most commonly cited disadvantage of LCMAs, especially in a North American context, is
lack of public acceptance. North American cities were built to facilitate the use of privately-owned cars,
and many residents view the use of a car as a right rather than a privilege. Limiting this “right” in any
way will invariably cause outrage among certain residents and stakeholder groups. Planning for and
limiting public opposition is an integral component of any LCMA.
Closely related to the disadvantage of lack of public acceptance is political risk on the part of the elected
officials who choose to move forward with LCMA implementation. Four year political cycles are not
particularly amenable to planning for the long term. Officials who decide to champion an LCMA must
offer a strong and clear value proposition to the public to avoid becoming politically unpopular and
being forced to abandon their efforts.
37 European Federation for Transport and Environment. Low-Emission Zones are a success – but they must now move to zero-emission mobility. 2019. (https://www.transportenvironment.org/sites/te/files/publications/2019_09_Briefing_LEZ-ZEZ_final.pdf)

27
Parking Space Removal
If not planned properly, the removal of public parking can lead to congestion and the saturation of
available parking spaces for residents. Streets can become clogged with parked cars and the amount of
time spent in search of a parking space can increase significantly. Lack of acceptance is not only likely
from residents, but from local business owners.
The car culture has permeated many facets of North American urban planning. As a consequence, most
developers and urban planners feel there’s a logic to making as much parking available as possible, in
order to alleviate congestion. Most simply try to meet existing demand for parking rather than
attempting to change behaviour. This approach does not account for the fact that offering a lot of public
parking encourages personal vehicle use and discourages the use of public transit.
Another disadvantage of parking space removal is related to population density. In parts of cities where
density is low, it is difficult to offer convenient and affordable public transit that will take residents to
employment or recreational hubs. Residents in these areas may feel that driving a personal vehicle is the
most viable way to get to certain parts of a city, but in order to do so, they will need somewhere to park.
Congestion/Emissions Charges
Provincial and federal jurisdiction over certain roadways can pose a barrier to cities looking to
implement congestion charges. In these cases, cities will need support from higher levels of government
to implement charges, and may be asked to share some of the revenues.
A common concern related to congestion charging on certain roads is that it will drive traffic to adjacent
roads which may become heavily congested. Another concern is that it might disadvantage residents
who live in areas that aren’t well serviced by public transit.
Restricted Road Access
In order for cities to restrict access to certain roads (or certain sections of roads), they must first have
adequate transportation alternatives in place to meet the needs of residents and visitors. In many cases
such alternatives are lacking.
Another disadvantage to limiting access is that it may take time for transit and active transportation
utilization rates to increase. In the interim, opponents may use the lack of utilization as a justification for
cancelling a restricted road access project. A related disadvantage is that unless the active
transportation infrastructure in restricted access zones is well-connected to a city-wide network, it may
not prove to be useful to active commuters.
Another barrier to the implementation of restricting road access is the question of how to treat
commercial vehicles. Although medium and heavy duty commercial vehicles are among the biggest
emitters on the road, low-carbon alternative powertrain options are currently limited in these classes.
These vehicles provide services that are pivotal to the well-being of urban neighbourhoods, and must be
accommodated in restricted road access scenarios.
While restricting access to certain roads is easier to implement than a broader low emission zone, the
environmental benefits tend to be much smaller. These benefits are also more difficult to quantify, as air
pollutants and GHGs will move freely between restricted areas and nearby areas with no restrictions.

28
Low Emission Zones
Costs and logistical challenges around the monitoring and enforcement of LEZs can be significant.
Likewise, because LEZs tend to be large in scope, they require a significant amount of lead time,
planning and consultation prior to implementation. Businesses, fleets, transit authorities, and the
general public all require strategies on how best to adapt to a LEZ.
Related to this is the fact that the regulatory complexity of introducing a LEZ is substantial. LEZs offer the
most in terms of environmental benefits, so perhaps it should be expected that they are the most
difficult to implement. Some experts feel that this burden should not be the responsibility of municipal
officials, but should rather be addressed by higher levels of government with regulatory authority over
vehicle manufacturing and emissions standards.
Several experts noted that because ZEV uptake is still quite low in most North American cities, a LEZ that
restricted the use of internal combustion engine vehicles would essentially amount to a car ban. Also, as
previously noted, many individuals and businesses require the use of larger vehicles for which there are
few alternatives to combustion engines. The ZEVs that are on the road today tend to be owned by
affluent individuals, which compounds the social equity challenge related to this LCMA.
A common concern regarding LEZs and other LCMAs is that they will lead to increased congestion in
adjacent areas. Emissions avoided within the LEZ could simply be transferred to nearby areas unless
appropriate measures are taken to change transportation behavioural patterns. The central focus of
such measures should be the build out of public transit and active transportation infrastructure, which in
itself can be seen as a barrier from the perspective of cash-constrained cities.
3.3 Environmental Impact
GHG reductions attributable to LCMAs are especially difficult to quantify through monitoring and
measurement, as a large portion of ambient GHGs enter cities from external locations, and GHGs are
difficult to confine to, or exclude from, a specific area that is participating in an LCMA. Further, the types
of trips that contribute the most to GHG emissions are longer commutes from outside of cities.
Common CACs are easier to quantify as they are shorter-lived in the troposphere, with residence times
ranging from several hours to a few days, making it easier to pin-point their sources.38 Air quality
benefits (i.e., reductions in CAC concentrations) from LCMAs are immediate and significant. Whenever
any vehicle that combusts fossil fuels is taken off the road, air quality benefits will be realized.
This section presents case study findings related to the environmental impacts of the four types of
LCMAs within the scope of this study. Please refer to Appendix A for details and references related to
the case studies highlighted in this section.
38 Dryden, R. et al. Public Perceptions of How Long Air Pollution and Carbon Dioxide Remain in the Atmosphere. Risk Analysis, Volume 38. 2018. (https://www.cmu.edu/ceic/assets/docs/publications/published-papers/2017-and-2018/dryden-et-al-2018-risk-analysis.pdf)

29
Low Emission Zones
Most experts agree that LEZs have the greatest potential to achieve significant environmental benefits.
However, the trade-off is that LEZs also tend to be the costliest and most complex type of LCMA to
implement.
Madrid, Spain: Madrid’s LEZ had the goal of reducing traffic-related air pollution (TRAP) by 40% in the
city centre. On the day the LEZ came into effect, traffic on Madrid’s busiest street was reduced by 33%,
and traffic on other impacted streets was reduced between 6 and 14%. Over the initial seven months of
the LEZ, TRAP reached its lowest levels in 10 years. NO2 levels in the city centre were reduced by 48%.
Paris, France: Paris’ LEZ had the goal of reducing NOx levels by 19%, PM10 by 8%, and PM2.5 by 13%. By
the end of Phase 2 of the LEZ (in June, 2019), only 3% of vehicles were removed from Paris’ roads, yet
NOx levels were reduced by 15%, and PM2.5 by 11%. These results were due to the fact that the LEZ
targeted the highest polluting, oldest vehicles. Subsequent Phases of the LEZ will become increasingly
stringent, leading to further emissions reductions.
London, England: London’s ultra-low emission zone (ULEZ) came into force in April, 2019. As of
September, 2019, NOx levels had been reduced by 36% and transportation-related CO2 levels were
reduced by 4%. Traffic flow was reduced from 3 to 9% during the first six months of the ULEZ. No
significant changes in PM levels have been reported, although monitoring is ongoing.
Parking Space Removal
Like the other LCMAs explored in this report, parking space removal encourages the use of public transit
and active transportation. This contributes to reductions of CACs and GHGs, and reduces congestion.
Directly attributing environmental benefits to this LCMA is difficult, and is most commonly done via
proxies such as increases in public transit and active transportation utilization.
Oslo, Norway: Oslo removed over 700 public parking spots from its downtown core between 2017 and
2019, and replaced them with bike lanes, green spaces and benches. Parking garages are available on
the periphery of the city centre, and traffic is encouraged to take a ring road around, rather than
through, the downtown core. The approximately 50 parking spaces still available downtown are for
disabled permitted vehicles and EV charging.
Freiburg, Germany: The neighbourhood of Vauban, home to roughly 5,000 residents, established a car-
and parking-free policy over 20 years ago. Parking spaces for residents are located at the periphery of
the neighbourhood, and less than 0.5 spaces per residence are available. The neighbourhood includes a
network of pedestrian and cycling paths and every home is within walking distance to a tram stop,
schools, businesses, and shopping centres. As a result, only 18% of residents own a motor vehicle
compared to 40% in nearby neighbourhoods (and 80% in the USA). 57% of households that owned a car
when moving to Vauban end up getting rid of it. Car sharing rates are very high, with 39% of households
having a car share membership. 64% of all trips in Vauban are taken by bicycle.
Amsterdam, Netherlands: In 2019, Amsterdam began a process of removing roughly 1,500 public
parking spaces each year until 2025, when a total of 11,200 spaces will have been removed. The city is
not revoking parking permits, but is not replacing them when a driver with an existing permit leaves the

30
city, gives up their car, or dies. The total number of permits is thereby being reduced by 2.2% every year.
Former parking spots are being replaced with green spaces, bicycle parking, and wider sidewalks.
Restricted Road Access
Because restricted road access areas are essentially LEZs on a smaller scale, they are likely to derive
comparable environmental benefits as LEZs, though scaled down proportionately. This type of LCMA is
useful when a city does not have the support or resources required to implement a LEZ, and restricting
access on certain sections of certain roads can serve to demonstrate benefits or to help transition to
broader LEZs.
Italian Cities: Limited traffic zone (LTZ), or Zona Traffico Limitato, is the term used in Italy to describe
restricted road access. Numerous Italian cities of all sizes have adopted this approach, in large part to
mitigate pollutants and congestion in historic city centres. Only permitted local residents, buses, taxis,
delivery vehicles, motorcycles/scooters and other types of exempted vehicles are permitted. Italian LTZs
have resulted in improved public transit ridership and travel times, improved safety for pedestrians and
cyclists, and reduced air and noise pollution.
New York City, New York: In recent years, New York City has created several permanent pedestrian-only
zones (e.g., Times Square, Herald Square, Madison Square Park). It also recently limited a 1.6 km stretch
of 14th St to transit only, and findings indicate that traffic levels on surrounding streets have not changed
drastically, yet transit reliability and speed on the 1.6 km stretch have significantly improved.
Preliminary findings from Times Square indicate that NOx levels have been reduced by 50 to 60% since
the pedestrian-only zone took effect.
Toronto, Ontario: Traffic was restricted on a portion of King St. in Toronto to address congestion levels
that were making public transit prohibitively slow. The move to prioritize public transit led to improved
transit reliability and travel times. One year after the demonstration was launched, transit ridership had
increased by 17% on the busy route. Reduced vehicular traffic also allowed Toronto to create new green
spaces and public gathering places in a highly densified area of its downtown core.
Congestion/Emission Charges
Congestion charges are intended to limit the amount of traffic in busy areas, and often target heavy
emitting and/or older vehicles. Both of these objectives serve to reduce emissions of GHGs and CACs,
leading to positive environmental impacts in affected areas. The charges can also serve as a source of
revenue generation for municipalities, providing funds required to enhance components of the
transportation system, such as public transit and active transportation infrastructure and accessibility,
which also offer environmental benefits.
London, England: London charges a fee for entering a large area of its downtown core during weekdays,
although some vehicles (e.g., motorcycles, taxis, disabled permitted vehicles) are exempt from this fee.
Local residents receive a 90% discount, as do ZEVs. One year after the charge was introduced (in 2002),
bus ridership in the impacted area increased by 16%. Bus wait times were reduced by 30% and average
road speeds increased by 10-15%. The total number of motor vehicles driving in the congestion charge
zone has decreased by 25%. However, the number of taxis and ride sharing vehicles has increased
significantly, and has negatively impacted transit efficiency and wait times. The number of cyclists using
the zone increased by 210% between 2000 and 2016.

31
Stockholm, Sweden: Stockholm first introduced congestion pricing via a seven month demonstration in
2006, and following a municipal referendum it was made permanent in 2007. The charge varies based
on time of day, being highest during the morning and evening rush hours. Following implementation,
the number of trips made by car on affected streets have decreased by 20%, and transit ridership has
increased by 6-9%. Traffic levels on streets adjacent to the congestion zone decreased by roughly 5%.
With regard to emissions, the charges have led to GHG reductions of 15-20% from traffic in the city
centre, as well as NOx reductions of 8.5% and reductions of other CACs ranging from 10-14%.
Singapore, Republic of Singapore: In 1975, Singapore became the first city in the world to introduce
congestion pricing. The system was overhauled and digitalized in 1998, with more than 80 automatic
charge points installed across the city that levied charges varying by time of day, location, and type of
vehicle. Since the overhaul, traffic-related GHG emissions have been reduced by 10-15% and public
transit ridership has increased by 15%. Weekday traffic levels have decreased by 24%.
3.4 Economic cost/benefit
Comprehensive cost/benefit analyses which account for factors such as time savings, environmental and
health benefits, loss of convenience and administrative expenses, should be conducted pre- and post-
implementation on any municipality-led LCMA. Lessons can be learned from case study findings with
regard to mitigating LCMA costs and optimizing revenues. Demonstrating that LCMAs will not impose a
financial burden on a city is one of the ways by which support can be gained from key stakeholder
groups who might otherwise be indifferent or skeptical towards LCMAs.
The economic costs and benefits of leading municipal LCMAs are highlighted below. In many cases, cities
either do not calculate or do not publicly release all financial metrics related to LCMA implementation.
Costs, revenues and benefits vary greatly from city to city depending on factors such as geography,
demographics, traffic levels, urban density, transit accessibility, applicable rates, exemptions, monitoring
and enforcement mechanisms, ambition of targets, and type of LCMA. For details and references related
to the case study findings in this section, please refer to Appendix A.
Low Emission Zones
Madrid, Spain: As of 2020, older diesel (model year 2006 and older) and gasoline (model year 2000 and
older) vehicles will be banned from entering Madrid’s downtown core. All vehicles entering downtown
Madrid are required to display a sticker, each of which cost €5. Police checks and roadside cameras are
currently used to authenticate stickers, and drivers who break the rules are fined €90. Prior to the LEZ
coming into effect, Madrid experienced a boom in sales of EVs and hybrids. Although the city accounts
for roughly 7% of Spain’s population, 58% of national ZEV sales now occur in Madrid. In the lead-up to
the LEZ’s implementation, ZEV sales in the Madrid increased 219% from the previous year.
An unexpected effect of Madrid’s LEZ was that property values in the affected area rose more than
those in surrounding neighbourhood. However, three quarters of small businesses in the LEZ reported
declines in business during year one of implementation. Among those businesses, the average decline in
revenue was 14%. Many feel the government’s lack of communication to the public was to blame for the
declines, as unclear messaging led some to believe that all types of motor vehicles were banned from
the LEZ.

32
Paris, France: Every vehicle entering the Paris LEZ must display a clean air sticker, which cost €4 each.
The municipal government’s budget to implement the LEZ was €12 million, though it also received
funding from the Government of France. Fines for non-compliance are €68 for cars and motorcycles and
€135 for trucks. Police manually enforce the LEZ restrictions, a method which has a low cost but also
results in lower compliance levels and effectiveness. Paris reduced that cost of using public transit to
help compensate for the LEZ restrictions.
London, England: The expansion of the ULEZ in October 2021 is estimated to cost £700 million for new
monitoring infrastructure. The ULEZ is expected to raise £220 million per year, which is intended to
cover operating and installation costs. Any additional revenues that may be generated from the ULEZ
will be used to make public transit “clean and green” and on initiatives to reduce total transport
network pollution. Unlike other London schemes (e.g., congestion charge), the ULEZ has not been
designed and implemented to raise funds, but the goal is to change driver behaviour. Fines for non-
compliance range from £160 for cars, vans, and motorcycles to £1,000 for trucks, buses, and specialty
vehicles.
Small businesses and charities in London are supported in replacing older vehicles with EVs with up to
£6,000 towards purchase and operating costs. In coordination with the ULEZ, London launched an £18
million scheme to install 75 DCFCs to support the transition to EVs. Sales of EVs in London have
increased at a higher rate than in neighbouring municipalities as a result of the ULEZ.
Parking Space Removal
Oslo, Norway: There have been spill over economic benefits stemming from Oslo’s parking space
removal, such as increased use of bike share operations. Bike sharing has tripled in the three years of
transition. A benefit to local business owners is that there has been a 10% increase in pedestrians in the
city centre, which can result in increased shopping/spending. Fees from a toll ring road around Oslo are
used to pay for the transition (e.g., new bike lanes, revitalized public areas, improved public transport,
etc.). Oslo’s government is currently compiling tax records to measure the economic impact of its
reforms.
Freiburg, Germany: Freiburg’s budget for the entire project (i.e., not just the transport initiatives) was
$112 million. This budget included costs to build new community-oriented facilities including a primary
school, community centre and several daycare centres. Funds to repay the city’s loans were raised in
large part through the selling of municipally owned land to residential developers. Approximately $6.5
million was provided by state-level government agencies.
Amsterdam, Netherlands: In response to this and other LCMAs, the prevalence of cargo bike deliveries in
Amsterdam has been rising rapidly. Some courier service providers, such as DHL, have been increasingly
shifting from van to cargo bike deliveries in Amsterdam and other Dutch cities.
Other economic impacts resulting from the shift to reduce public parking spaces have yet to be
published. This is in part due to the fact that the reductions only began in mid-2019, and will continue
until 2025.

33
Restricted Road Access
Italian Cities: The primary goal of Italy’s LTZs is to improve quality of life in city cores, rather than
revenue generation. LTZs are meant to address congestion, air pollutants and noise, so in many cases
economic data has not been collected or analysed.
In the case of Rome’s LTZ, it had the following impacts between 1999 and 2004 (which span economic as
well as environmental indicators):
• Overall traffic reduction of 13%
• Travel speeds for buses increased
• Delivery vehicle volumes decreased from 13,000 to 10,000 per day
• Increased use of motorcycles, scooters and walking as means of transport
• Motorcycle and scooter sales increased significantly; total number of motorcycles/scooters owned
in Rome went from 400,000 in 1996 to 600,000 in 2004 (they are typically authorized to enter LTZs)
Rome conducted a follow-up assessment of its LTZ in 2014. Between 2004 and 2014 the following
impacts were realized:
• The total number of trips by car decreased by 5%
• Public transit ridership levels increased by 3.6%
• The total number of pedestrian and cycling trips increased by 1.5%
New York City, New York: The pedestrian only zone in Times Square – an area bounded by Broadway and
Seventh Ave between 42nd and 47th Streets – cost $72 million to implement and converted over 10,000
square metres of land to pedestrian space.
Vehicles that ignore the rules of the 14th Street Transit and Truck Priority Corridor will be issued fines
starting at $65. However, the restricted zones in NYC are not intended to be revenue generators. Costs
to implement LCMAs are being derived in part from existing bridge tolls and a Manhattan congestion
charge that will come into effect in 2021.
Toronto, Ontario: Total implementation costs of the King Street pilot have not been published, however,
several financial metrics have been tracked and published by Toronto.
Customer spending data suggests that year-over-year growth (2017-2018) in total consumer spending
on King Street decreased slightly (by 0.8%) after the pilot was implemented, with reductions primarily in
the restaurant sector. This is a trend that existed during the year before the pilot was implemented,
indicating that these differences may not have resulted from the pilot itself. Spending in both the retail
and services sectors appears to have grown faster during the year after the pilot was installed compared
to the rate of growth in the year before the pilot began.
To assist local businesses, Toronto issued 14 permits for new patio spaces along the King Street corridor.
The city also launched the “Food is King” promotion which offered a $15 credit to Torontonians who
used a line-skipping app at any one of 52 participating restaurants in the corridor. This promotion
resulted in a $426,005 increase in sales for participating restaurants compared with the weekly average
three weeks before the promotion.

34
To assist individual drivers, the Toronto Parking Authority began offering a promotional parking discount
of up to $10 through its GreenP app, effective at all GreenP parking spaces in the corridor. In 2018, this
promotion was used over 78,000 times, representing over $500,000 in savings for local drivers.
Congestion Charges
London, England: London now charges a flat daily rate of £11.50 to enter the zone, up from £5 when it
was first implemented in 2003. In October 2017 the city introduced a toxicity charge (T-charge) of an
additional £10, which is generally applied to diesel and gas vehicles registered before 2006 and some
later models. The T-Charge was replaced by the ULEZ in 2019. The penalty for failing to pay the ULEZ
rate (which is enforced by cameras) is £160.
Ride sharing services have surged in popularity in recent years as a result of London’s LCMAs. The
number of registered taxis and ride sharing vehicles in the city increased by over 75% between 2013 and
2017 alone.
London’s congestion charge is cash flow positive. One source states that in 2017, the approximate
operating costs were £90 million and net revenue was approximately £160 million. Another source
indicates capital costs of £161.7 million (~$265 million CAD), annual operating costs of £130 million
(~$213million CAD), and annual net revenues of £137 million (~$225 million CAD).
Stockholm, Sweden: Following a seven month trial in 2006, Stockholm’s congestion charge was made
permanent in 2007. The charge varies by time of day and level of congestion, with a daily maximum of
105 SEK (~$14 CAD). Peak hours (7:30-8:30am and 4-5:30pm) cost the most at ~$4 CAD; 30 minutes
before and after the peak periods cost ~$3 CAD); and the rest of the period costs between ~$1.50 and
$2 CAD per hour. Low emission vehicles are charged discounted rates, which serves to promote
their use.
Stockholm’s congestion charges are cash flow positive, yielding large annual surpluses. Annual costs and
revenues, as of 2009, are summarized in the table below. At that time, the annual surplus for Stockholm
was 654 million SEK (~$92 million CAD), with annual operating costs being roughly 25% of total
revenues.
35
Figure 1 – Annual Operating Costs and Revenues (in millions SEK) from Stockholm’s Congestion Pricing
Initiative (2009 data)39
Singapore, Republic of Singapore: Singapore’s congestion charge is in effect Monday to Saturday, 7am-
8pm. The charge is $0 to about $4.00 depending on the road, the time, and local traffic conditions. Rates
are set based on real-time travel speeds and congestion. Each vehicle needs to be equipped with an in-
vehicle unit (transponder) and a pre-paid smart card. The transponder costs around $146.
Revenues have supported public transit, street safety, and transit oriented development (e.g., expanded
bus and rail and the construction of new intermodal hubs).
Initial costs of the manual system were ~$276,000 with annual operating costs of ~$329,000. Annual
revenues were estimated to be 11 times the cost.
Capital costs of the electronic system were estimated to be ~$145 million (in 1998), half of which was
for the purchase and installation of ~1.1 million transponders. In the early 2000s, annual net revenues
were estimated to be around $132 million, with annual operating costs of only $24 million.
39 Eliasson, J. The Stockholm congestion charges: an overview. Centre for Transport Studies. 2014. (https://www.transportportal.se/swopec/CTS2014-7.pdf)

36
4. Overcoming Barriers
When restricting mobility in any way, cities need to ensure that affected people and businesses have
access to viable alternatives. The benefits of LCMAs and complementary actions should accrue to all
members of society in a way that palpably enhances the availability of low-carbon mobility options.
These benefits can be leveraged to help cities overcome barriers to LCMA implementation.
This section highlights common barriers faced during the planning and implementation of LCMAs. These
barriers are categorized as: public acceptance, social equity, costs/limited budget, political risk, impacts
on local businesses, and increased congestion in adjacent areas. For each barrier, a series of potential
mitigation measures and the key stakeholder groups that cities should consider collaborating with on
such measures are provided. The mitigation measures in this section are defined in Section 2, and a
stakeholder legend is provided below.
It is interesting to note that certain mitigation measures can be used to address multiple barriers
simultaneously. This suggests that such measures should be prioritized by city officials. These measures
include: enhancing public transit and service coverage, enhancing and connecting active transportation
infrastructure, allocating LCMA revenues to public and active transit improvement, providing ample lead
time, introducing LCMA exemptions, consulting with key stakeholder groups throughout the entire
process, developing educational materials and a communications strategy, using reclaimed real estate
creatively, supporting impacted low-income households and/or small businesses, and supporting ZEV
car sharing, ride sharing, delivery and transit fleets.
Key Stakeholder Group Legend
Symbol Description Symbol Description A Academia NGO Non-governmental organizations
AI Automotive industry NM Neighbouring municipalities
B Local businesses PA Parking authorities
D Developers PH Public health authorities
G Higher levels of government PTA Provincial Transportation Authorities
GP General public SA Social advocacy groups
IP Charging/refueling infrastructure providers TA Transit authorities
F Local fleet operators

37
Table 7 – Public Acceptance: Mitigation Measures and Key Stakeholders
Enhance public transit service and coverage
•The most widely cited measure to enhance public acceptance, it will ensure citizens have viable alternatives to personal vehicle use.
•Stakeholder Groups: TA G NM GP SA
Enhance and connect active transportation infrastructure
•A significantly higher proportion of citizens would opt for active transport if convenient, reliable, well-connected and safe options were available.
•Stakeholder Groups: TA GP D B SA
Allocate LCMA revenues to public and active transit improvement
•This will demonstrate to the public that LCMAs can tangibly enhance mobility options for everyone in cities.
•Stakeholder Groups: G GP SA
Enhance public charging/refueling infrastructure for ZEVs
•This will address a core barrier to ZEV usage - a lack of access to convenient and affordable public charging/refueling infrastructure - and can help raise awareness.
•Stakeholder Groups: IP AI D B SA
Provide ample lead time
•Informing and engaging the public early in the planning process can provide the time required to address concerns, modify plans, and allow citizens to adapt.
•Stakeholder Groups: GP B TA
Begin LCMAs as demonstrations, and if they work, make them permanent
•An effective approach has been to start small (both temporally and geographically), monitor results, and then expand on actions that have a high level of support.
•Stakeholder Groups: GP SA B G
LCMA exemptions
•This can address accessibility issues and the limitations of car-captive and low-income citizens, and can facilitate the provision of essential goods and services.
•Stakeholder Groups: PTA SA B
Consult with key stakeholder groups throughout the entire process
•LCMAs should be co-developed with the general public to ensure communal benefits are optimized and that they do not disproportionately disadvantage certain groups.
•Stakeholder Groups: GP PH SA TA G B A AI IP
Develop educational materials and communications strategy
•It is critical that the public understands the rationale for LCMAs - including health, mobility, environmental and economic benefits - as well as any new rules of the road.
•Stakeholder Groups: GP PH SA A TA B
Use reclaimed real estate creatively
•Reclaimed space should be used for amenities that all can enjoy, and optimal land use options should be discussed and co-developed with each affected community.
•Stakeholder Groups: B D TA GP A SA

38
Table 8 – Social Equity: Mitigation Measures and Key Stakeholders
Enhance public transit service and coverage
•Low-income areas tend to be far from employment hubs and have higher than normal exposure to TRAP. These areas should be prioritized for low-carbon transit expansion.
•Stakeholder Groups: TA G NM GP SA
Enhance and connect active transportation infrastructure
•Active transport is the most affordable and healthiest mobility option. Allowing all citizens to take advantage of it will help cities meet a wide range of LCMA objectives.
•Stakeholder Groups: TA GP D B SA
Allocate LCMA revenues to public and active transit improvement
•Enhancing access to mobility options that can be used by all will help to ensure that marginalized communities will reap tangible benefits from LCMAs.
•Stakeholder Groups: G GP SA
Enhance public charging/refueling infrastructure for ZEVs
•Providing public infrastructure improves the value proposition of ZEV ownership or usage. Cities should address any infrastructure gaps, especially in low-income areas.
•Stakeholder Groups: IP AI D B SA
Support for impacted low-income households and/or small businesses
•These groups are more vulnerable than others to shifts in mobility pricing and access. Targeted support for these groups can help to mitigate that vulnerability.
•Stakeholder Groups: SA A B TA AI D
Support for ZEV car sharing, ride sharing, delivery and transit fleets
•Targeting high mileage and/or large fleet vehicles through LCMAs can yield significant air quality and climate benefits without inconveniencing a majority of travellers.
•Stakeholder Groups: F TA AI IP
Health taxes on heavily polluting vehicles
•These taxes could generate LCMA revenues while encouraging a shift to cleaner vehicles. Health benefits and revenues would accrue to all citizens.
•Stakeholder Groups: F G AI SA
LCMA exemptions
•To ensure that LCMAs don't pose barriers to the mobility of low-income, car-captive, or local residents, exemptions should be issued, especially during the early days of LCMAs.
•Stakeholder Groups: SA G NM A
Monitor and collect data from adjacent areas
•LCMAs should drive behavioural change, not simply change locations of problems. Data collection and traffic modelling in and around LCMA areas can ensure this happens.
•Stakeholder Groups: A NGO G NM SA
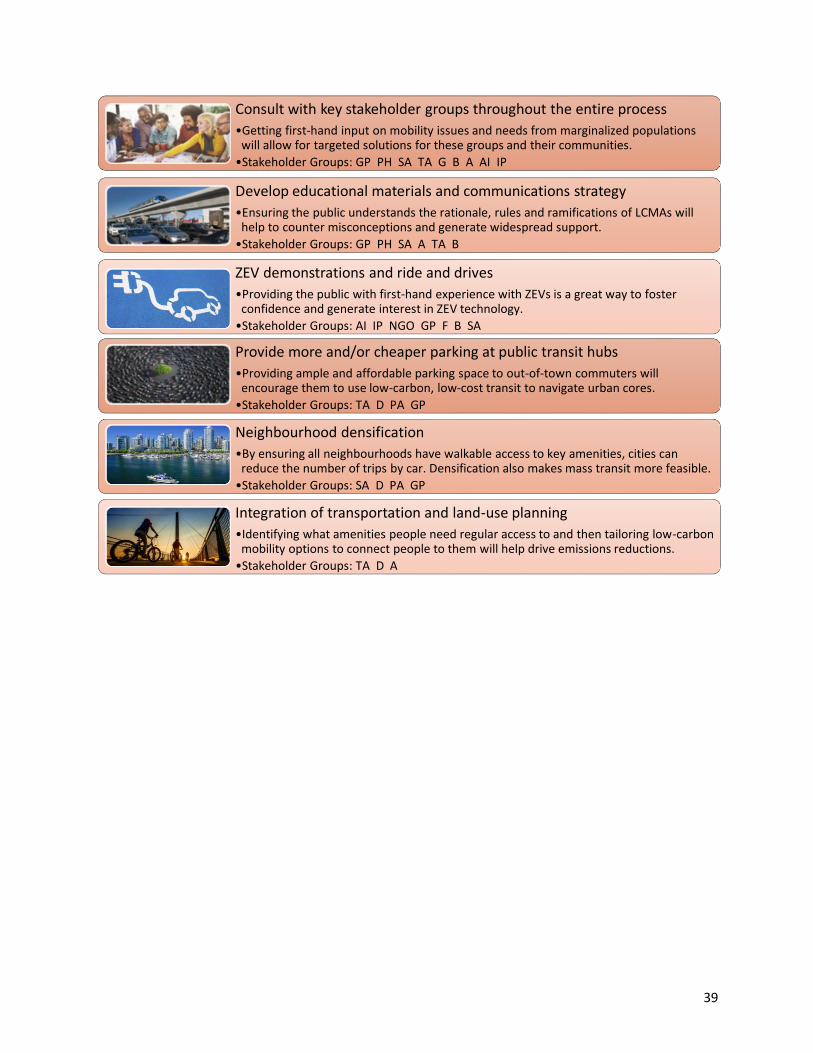
39
Consult with key stakeholder groups throughout the entire process
•Getting first-hand input on mobility issues and needs from marginalized populations will allow for targeted solutions for these groups and their communities.
•Stakeholder Groups: GP PH SA TA G B A AI IP
Develop educational materials and communications strategy
•Ensuring the public understands the rationale, rules and ramifications of LCMAs will help to counter misconceptions and generate widespread support.
•Stakeholder Groups: GP PH SA A TA B
ZEV demonstrations and ride and drives
•Providing the public with first-hand experience with ZEVs is a great way to foster confidence and generate interest in ZEV technology.
•Stakeholder Groups: AI IP NGO GP F B SA
Provide more and/or cheaper parking at public transit hubs
•Providing ample and affordable parking space to out-of-town commuters will encourage them to use low-carbon, low-cost transit to navigate urban cores.
•Stakeholder Groups: TA D PA GP
Neighbourhood densification
•By ensuring all neighbourhoods have walkable access to key amenities, cities can reduce the number of trips by car. Densification also makes mass transit more feasible.
•Stakeholder Groups: SA D PA GP
Integration of transportation and land-use planning
•Identifying what amenities people need regular access to and then tailoring low-carbon mobility options to connect people to them will help drive emissions reductions.
•Stakeholder Groups: TA D A

40
Table 9 – Costs/Limited Budgets: Mitigation Measures and Key Stakeholders
Allocate LCMA revenues to public and active transit improvement
•This will demonstrate that financial benefits will accrue to all citizens, leading to shorter, more reliable travel times, enhancing productivity and quality of life.
•Stakeholder Groups: TA GP NM G
Variable parking fees/structure
•This will ensure optimized parking asset utilization while discouraging the use of personal vehicles in high traffic areas. It can also raise capital for other initiatives.
•Stakeholder Groups: PA GP SA B
Adjust public parking rates
•This can be used to encourage more traffic to areas that can accommodate it (e.g., transit hubs) while discouraging traffic in congested areas.
•Stakeholder Groups: PA GP SA B
Health taxes on heavily polluting vehicles
•A targeted tax would generate revenue and derive communal health benefits while easing financial burdens on drivers of conventional vehicles.
•Stakeholder Groups: G AI PH NGO A GP
Provide ample lead time
•Adequate lead time can allow cities to build a coalition of the willing and generate funding and other types of support prior to implementation.
•Stakeholder Groups: GP B TA
Municipal gas tax
•Used to generate municipal tax revenues while discouraging the use of ICE vehicles.
•Stakeholder Groups: G NM IP GP SA B

41
Table 10 – Political Risk: Mitigation Measures and Key Stakeholders
Enhance public transit service and coverage
•Ensuring public transit networks are reliable, affordable, convenient and scalable will help to stem opposition to restrictions in personal vehicle use.
•Stakeholder Groups: TA G NM GP SA
Enhance and connect active transportation infrastructure
•Initially prioritizing active transportation in a few linked corridors will minimize disruption while providing data and demonstrating benefits and utilization levels.
•Stakeholder Groups: TA GP D B SA
Allocate LCMA revenues to public and active transit improvement
•Demonstrating to the public that LCMAs are a means to tangibly improve mobility for everyone will help to attain broad-based buy-in.
•Stakeholder Groups: TA GP NM G
Support for impacted low-income households and/or small businesses
•High income earners are better able to adjust to LCMAs by paying more to use an ICE vehicle or by buying a ZEV. Targeted support for other groups can help to balance this.
•Stakeholder Groups: SA A B TA AI D
Compile economic data for impacted businesses
•Local businesses may be concerned that LCMAs will result in declines in sales. Providing them with case study data and monitoring financial impacts from LCMAs is critical.
•Stakeholder Groups: B SA NM NGO A
LCMA exemptions
•Exemptions can address concerns that LCMAs will negatively impact the movement of local residents or force some drivers to purchase new vehicles.
•Stakeholder Groups: SA G NM A
Phase in increasingly stringent standards/restrictions
•Phasing in restrictions slowly will reduce the shell shock for most drivers and allow residents to see the benefits LCMAs offer before things ramp up.
•Stakeholder Groups: TA G SA AI IP D F B GP
Provide ample lead time
•Providing ample lead time will foster a clearer understanding of LCMAs and ZEVs, allow for extensive consultation and planning, and give road users time to prepare and adapt.
•Stakeholder Groups: GP F AI IP TA B SA
Consult with key stakeholder groups throughout the entire process
•Collaborating with key stakeholder groups will ensure that LCMAs serve the needs of specific areas, and lead to more opportunities than barriers.
•Stakeholder Groups: GP PH SA TA G B A AI IP
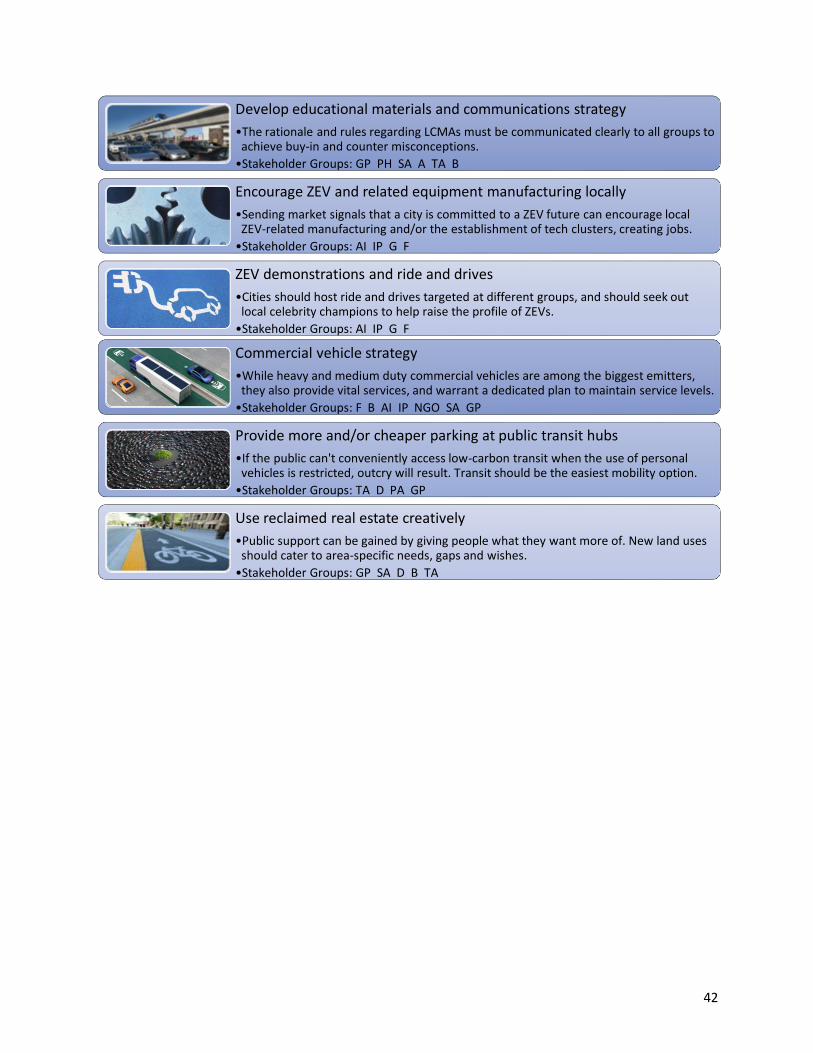
42
Develop educational materials and communications strategy
•The rationale and rules regarding LCMAs must be communicated clearly to all groups to achieve buy-in and counter misconceptions.
•Stakeholder Groups: GP PH SA A TA B
Encourage ZEV and related equipment manufacturing locally
•Sending market signals that a city is committed to a ZEV future can encourage local ZEV-related manufacturing and/or the establishment of tech clusters, creating jobs.
•Stakeholder Groups: AI IP G F
ZEV demonstrations and ride and drives
•Cities should host ride and drives targeted at different groups, and should seek out local celebrity champions to help raise the profile of ZEVs.
•Stakeholder Groups: AI IP G F
Commercial vehicle strategy
•While heavy and medium duty commercial vehicles are among the biggest emitters, they also provide vital services, and warrant a dedicated plan to maintain service levels.
•Stakeholder Groups: F B AI IP NGO SA GP
Provide more and/or cheaper parking at public transit hubs
•If the public can't conveniently access low-carbon transit when the use of personal vehicles is restricted, outcry will result. Transit should be the easiest mobility option.
•Stakeholder Groups: TA D PA GP
Use reclaimed real estate creatively
•Public support can be gained by giving people what they want more of. New land uses should cater to area-specific needs, gaps and wishes.
•Stakeholder Groups: GP SA D B TA
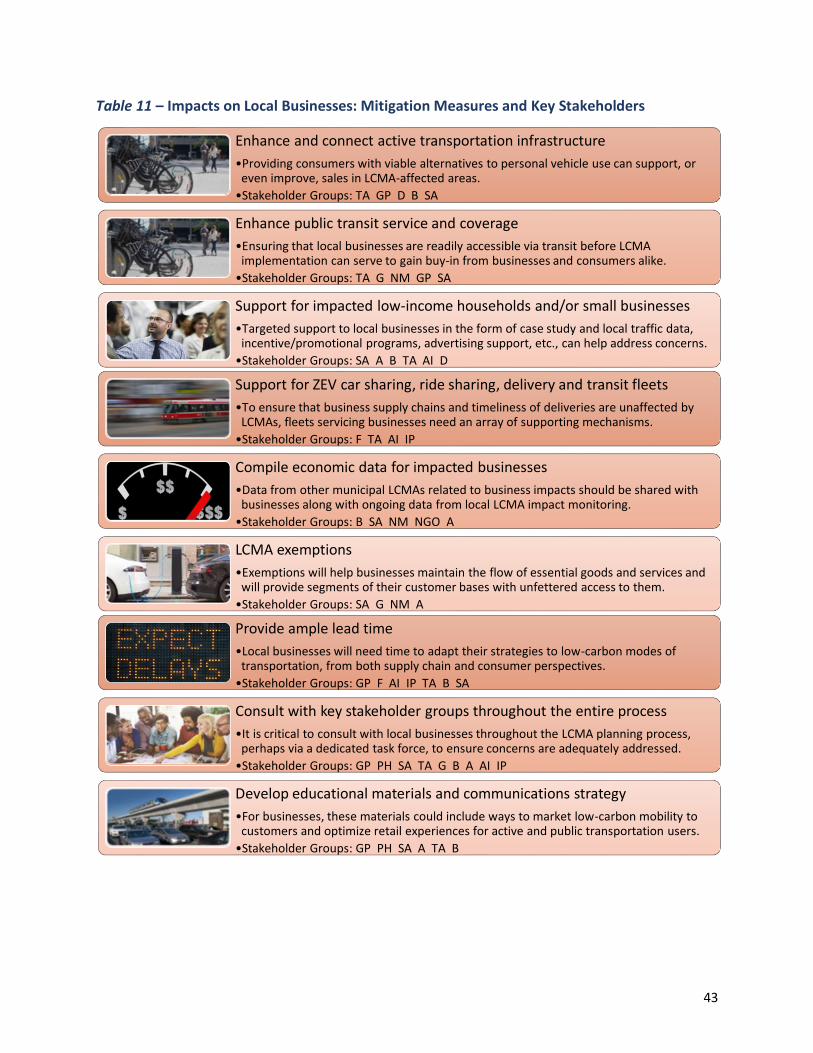
43
Table 11 – Impacts on Local Businesses: Mitigation Measures and Key Stakeholders
Enhance and connect active transportation infrastructure
•Providing consumers with viable alternatives to personal vehicle use can support, or even improve, sales in LCMA-affected areas.
•Stakeholder Groups: TA GP D B SA
Enhance public transit service and coverage
•Ensuring that local businesses are readily accessible via transit before LCMA implementation can serve to gain buy-in from businesses and consumers alike.
•Stakeholder Groups: TA G NM GP SA
Support for impacted low-income households and/or small businesses
•Targeted support to local businesses in the form of case study and local traffic data, incentive/promotional programs, advertising support, etc., can help address concerns.
•Stakeholder Groups: SA A B TA AI D
Support for ZEV car sharing, ride sharing, delivery and transit fleets
•To ensure that business supply chains and timeliness of deliveries are unaffected by LCMAs, fleets servicing businesses need an array of supporting mechanisms.
•Stakeholder Groups: F TA AI IP
Compile economic data for impacted businesses
•Data from other municipal LCMAs related to business impacts should be shared with businesses along with ongoing data from local LCMA impact monitoring.
•Stakeholder Groups: B SA NM NGO A
LCMA exemptions
•Exemptions will help businesses maintain the flow of essential goods and services and will provide segments of their customer bases with unfettered access to them.
•Stakeholder Groups: SA G NM A
Provide ample lead time
•Local businesses will need time to adapt their strategies to low-carbon modes of transportation, from both supply chain and consumer perspectives.
•Stakeholder Groups: GP F AI IP TA B SA
Consult with key stakeholder groups throughout the entire process
•It is critical to consult with local businesses throughout the LCMA planning process, perhaps via a dedicated task force, to ensure concerns are adequately addressed.
•Stakeholder Groups: GP PH SA TA G B A AI IP
Develop educational materials and communications strategy
•For businesses, these materials could include ways to market low-carbon mobility to customers and optimize retail experiences for active and public transportation users.
•Stakeholder Groups: GP PH SA A TA B

44
Commercial vehicle strategy
•Municipal commercial vehicle strategies should ensure that the needs of local businesses are met without necessitating additional resources or costs.
•Stakeholder Groups: F B AI IP NGO SA GP
Provide more and/or cheaper parking at public transit hubs
•Making transit the cheapest and easiest option for consumers to choose will help to ensure sales stability while allowing local business staff to travel to work with ease.
•Stakeholder Groups: TA D PA GP
Neighbourhood densification
•Densified areas see more foot traffic and have larger customer bases for local businesses than low-density, un-mixed areas where residents become car-captives.
•Stakeholder Groups: SA D A B GP
Use reclaimed real estate creatively
•Local businesses may be able to expand into reclaimed spaces (e.g., via patios, food stands), and a greater number of useful amenities will attract more people to an area.
•Stakeholder Groups: GP SA D B TA
Integration of transportation and land-use planning
•It is integral that LCMAs do not limit access to local businesses. Providing a range of mobility options within commercial areas will help to prevent this from happening.
•Stakeholder Groups: TA D A

45
Table 12 - Increased Congestion in Adjacent Areas: Mitigation Measures and Key Stakeholders
Enhance and connect active transportation infrastructure
•This will help to ensure that anyone willing and able to switch to active transportation can do so safely and reliably. This infrastructure should be maintained year-round.
•Stakeholder Groups: TA GP D B SA
Allocate LCMA revenues to public and active transit improvement
•Channelling as many travellers as possible to the most efficient modes will reduce the number of privately owned vehicles on the road at any given time.
•Stakeholder Groups: TA GP NM G
Enhance public transit service and coverage
•Transit corridors should be expanded to better reflect regional travel patterns and volumes. Transit must be affordable and reliable to be the go-to option for commuters.
•Stakeholder Groups: TA G NM GP SA
Support for ZEV car sharing, ride sharing, delivery and transit fleets
•These fleets provide essential services and log lots of kilometres. Their operations should be optimized and prioritized for high congestion areas.
•Stakeholder Groups: F TA AI IP
Provide more and/or cheaper parking at public transit hubs
•Improving access to public transit is the best way to reduce congestion. Terminal transit hub parking facilities should include EVSE to encourage ZEV adoption.
•Stakeholder Groups: TA D PA GP
Phase in increasingly stringent standards/restrictions
•Phasing in standards will allow cities to avoid surprising commuters with sudden shifts and provide time for behavioural changes towards low-carbon mobility to take hold.
•Stakeholder Groups: TA G SA AI IP D F B GP
Monitor and collect data from adjacent areas
•Areas bordering LCMAs may see increases in traffic after LCMA implementation. They should be monitored as closely as LCMAs to ensure traffic doesn't simply shift locations.
•Stakeholder Groups: A G NM SA
Collaboration with local transportation hubs on decarbonization strategies and supporting mechanisms
•Transportation hubs can be re-worked into employment hubs to help avoid congestion.
•Stakeholder Groups: TA D B PA F NM GP
Consult with key stakeholder groups throughout the entire process
•To drive behavioural change and reduce congestion city-wide, key levers and needs should be identified through consultation and prioritized through LCMAs.
•Stakeholder Groups: GP PH SA TA G B A AI IP
Commercial vehicle strategy
•Within strategies, cities should consider actions such as off-peak deliveries, priority truck lanes, and/or funneling truck traffic into areas that can accommodate them.
•Stakeholder Groups: F B AI IP NGO SA GP

46
5. Conclusion
The planning and implementation of any LCMA should be accompanied by a suite of complementary
actions to address barriers, offer palpable benefits to the public and key stakeholder groups, and track
progress. There is no consensus among experts on which type of LCMA is most appropriate for Canadian
cities. Factors such as local demographics, geography, density, and transit accessibility will to a large
extent dictate whether or not a given LCMA is appropriate for a given municipality.
In terms of environmental and human health impacts, not all types of vehicles are created equal. Many
experts stress that the highest emitting vehicles, as well as those vehicles which are used most
frequently (i.e., fleet vehicles), should be prioritized by LCMAs and complementary measures. Targeting
a segment of the vehicle population rather than the entire on-road fleet can serve as a way to make
LCMAs more palatable to the general public while achieving significant progress on decarbonizing local
transportation networks.
In general, experts stress that carrots must be provided to impacted stakeholder groups alongside any
sticks. In other words, when any kind of restriction is placed on mobility options, viable alternatives
must be made available to ensure an adequate level of support is sustained. The transition to low-
carbon transportation will be a gradual process, and actions that might only have a minor impact in the
short term can serve to lay the foundations for bigger, more impactful actions further down the road. It
may be difficult to quantify benefits of smaller-scale actions when looked at in isolation, but the ability
of such actions to help in the transition to more ambitious and impactful ones should not be overlooked.
Low Emission Zones
LEZs are the most effective LCMA in terms of achieving deep reductions of GHG and CAC emissions from
municipal transportation systems. This is due to the fact that LEZs have the potential to remove the
greatest number of internal combustion engine vehicles from municipal roads. However, LEZs are also
the most expensive, complex and time-consuming to implement. They require broad stakeholder buy-in
and typically also require support from higher levels of government to be realized. They are most
appropriate for municipalities with a high level of public and private support for environmental
sustainability, and in such cases they can be used as cornerstones of municipal climate action plans.
Parking Space Removal
Reductions in air pollution and GHG emissions are difficult to quantify and attribute to this LCMA.
However, this type of action can be phased in, beginning with pilots, and can be scoped in proportion to
a municipal governments’ ambitions and targets. It can initially be focussed on new developments or
areas with particularly high levels of congestion. It can be an effective tool for encouraging the use of
low-carbon modes of transport. It is already being implemented at small scales in numerous Canadian
municipalities, and gradually scaling up efforts in this area will give stakeholders time to adjust.
Restricted Road Access
Restricted road access zones are essentially scaled-down versions of LEZs, which limits their
environmental and economic benefits yet makes implementation more feasible. They can be a great
way to send market signals to the general public and businesses alike, letting stakeholders know that

47
low-carbon transport is a priority for local government, that efforts in this area will only intensify in the
future, and that palpable benefits can be realized through LCMA implementation. It typically represents
a minor change in lifestyle or business practices to those affected, and can be a great way to gradually
wean society off of the use of internal combustion engine vehicles.
Congestion Pricing
Congestion pricing may be a good way to generate revenue to pay for municipal transportation
infrastructure, especially from out-of-town commuters who may not otherwise contribute to municipal
tax revenues. These revenues could be used to supplant decreased gas tax revenues in the medium to
long term, as ZEV adoption continues to accelerate. While it is an effective way to generate positive
year-over-year revenues for cities, especially large cities, it may not be the most palatable LCMA from
the perspective of the general public (and therefore their elected officials). Congestion pricing measures
must account for low-income and car-captive segments of the population, ensuring that all members of
the public are given equal access to the transportation infrastructure that is a public good. Experts agree
that revenues generated from congestion pricing should be prioritized for enhancing local public transit
networks.

48
Appendix A: LCMA Case Studies by Type of Action
Low Emission Zones
MADRID, SPAIN
Description In November 2018, Madrid began restricting access to gas vehicles of model year (MY) 2000 and older and diesel vehicles of MY 2006 and older. Exceptions are made for cars in these categories that have private parking access and are registered to enter (i.e., residents). However, this is a temporary exception; as of 2020, older diesel and gas vehicles will not be allowed to enter the city centre at all. Taxis have until 2022 before the ban goes into effect.
It’s part of a larger initiative, Madrid Central, which focuses on reduction of NOx. The boundary is on and within the M-30 ring road, covering 5 km2. Madrid Central was part of Spain’s effort to avoid going before the European justice for exceeding the limits of NO2 since 2010.
Restrictions depend on type of vehicle and its label, and are issued based on an emissions test. For example, ZEVs and hybrid vehicles are allowed to drive and park in regulated spaces. Whereas the older diesel (2006) and gas (2000) vehicles cannot receive a label. Residents with newer cars can enter, if registered, but can only park on their own street. Exceptions to the parking restrictions include disabled permit holders and authorized commercial and industrial vehicles.
Environmental labels include: 0 – ZEVS ECO – hybrids B and C – modern gas and diesel
The stickers (€5 each) became mandatory in April 2019. Drivers who do not display a sticker are fined €90.
Advantages • Reduce levels of NO2, as well as other CACs and GHGs
• Reduced noise
Disadvantages

49
MADRID, SPAIN Environmental Impact
On the first day of the ban, traffic on Madrid’s busiest street (Gran Via) was reduced by one third. Other streets in the city centre experienced a reduction of between 6% and 14% traffic. The expectation is that approximately 20% of cars entering the city centre will be impacted by the ban.
Goal is to reduce air pollution by up to 40%. By mid-2019 transportation-related GHG emissions in central Madrid had declined by 44%,
In first seven months, the lowest air pollution was recorded in the last 10 years.
Levels of NO2 fell by 48% in the city centre.
Economic Impacts
Boom in sales of ZEVs and hybrids – in the lead-up to the LEZ’s implementation, low-emission vehicle sales in the Madrid increased 219% from the previous year. Madrid now accounts for 58% of total ZEV sales in Spain.
EV and hybrid sales increased to be three times greater than in neighbouring Catalonia.
In the first year of implementation, property values in affected areas rose more than those in surrounding neighbourhoods.
During the first year of the LEZ, roughly 75% of local small and medium sized businesses surveyed stated that business had declined – by an average of 14% – from the same time the previous year. Some feel this decline was due to Madrid’s messaging to the public, which wasn’t as clear as it could have been, and resulted in deterring all types of vehicles from the city’s core.
Effectiveness of Enforcement
Fines for violating the ban are around $100. Policed with 115 surveillance cameras (to monitor license plates of those that enter and those that park in the area) and police checks.
Social Equity and Fairness
Some see this as inequitable, targeting low-income residents that are more likely to drive older cars.
Challenges/ Barriers
Madrid Central was introduced by a left-wing mayor. When a new right-wing mayor was elected in June 2019, he suspended the initiative. A court reinstated the initiative 5 days later, after a spike in pollution and large environmental protests.
However, the right-wing government is in the process of easing the restrictions and modifying Madrid Central into a new plan called Madrid 360. The new plan would not be as progressive, allowing C sticker cars into the LEZ, reducing parking fees, and increasing motorcycle parking spots. Selling the stickers caused issues, with long line ups and shortage of stickers.
Stakeholders • Municipal government
• Local businesses
• Local fleets
Government Roles and Responsibilities

50
MADRID, SPAIN References https://www.businessinsider.com/madrid-ban-cars-traffic-pollution-2018-12
https://www.bbc.com/news/world-europe-46403397 https://elpais.com/elpais/2018/12/12/inenglish/1544607623_776238.html https://www.bbc.com/news/world-europe-48886405 https://www.forbes.com/sites/anagarciavaldivia/2019/06/24/new-conservative-mayor-suspends-madrid-low-emissions-zone-despite-it-success-reducing-air-pollution/#53b2ecae3b97 https://elpais.com/elpais/2019/09/30/inenglish/1569845738_731257.html https://www.forbes.com/sites/anagarciavaldivia/2019/06/24/new-conservative-mayor-suspends-madrid-low-emissions-zone-despite-it-success-reducing-air-pollution/#53b2ecae3b97 https://www.transportenvironment.org/sites/te/files/publications/2019_09_Briefing_LEZ-ZEZ_final.pdf https://www.southeusummit.com/europe/spain/madrids-driving-ban-is-up-in-the-air-but-so-are-small-local-businesses/
PARIS, FRANCE
Description The Paris low emission zone is based on clean air stickers (Crit’Air vignettes), with six categories used to identify a vehicle’s air pollutant emissions (which correspond to the EURO emissions standards, with lower numbers being less polluting). The least polluting vehicles get preferential parking and road access. Over two dozen other French cities are also using the same classification system to determine which vehicles can access their LEZs at certain times.
The Paris LEZ, which encompasses the entire city (inside the Boulevard Périphérique), has been phased in over time with increasing restrictions. Phase 1 came into effect in July 2017. Phase 3 (July 2019 to 2022) has the following weekday (8am to 8pm) restrictions:

51
PARIS, FRANCE
• HDVs – need to have at least Crit’Air 3 stickers – for diesel HDVs, this is at least Euro 5, registered on or after October 1, 2009; for gas HDVs, this is at least Euro 3
• All other vehicles – need to have at least Crit’Air 3 stickers – for diesel cars and light duty vans, this is at least Euro 4, registered on or after January 1, 2006; for gas cars or light duty vans, this is at least Euro 2; for motorcycles, this is at least Euro 2, registered on or after July 1, 2004.
For trucks and buses, the ban also applies on weekends.
The plan is to phase out older vehicles over time and ban all diesels from the city centre. Phase 4 (2022 – 2024) moves to Crit’Air 2 sticker (Euro 4 to 6 depending on the type of vehicle); Phase 5 (2024 – 2030) moves to Crit’Air 1 sticker (no diesel vehicles, Euro 4 motorcycles, Euro 5 gas cars and light duty vans); 2030 onwards moves to Crit’Air green sticker (no gas or diesel vehicles, only ZEVs allowed). This is known as a Zero Emission Zone (ZEZ).
There are exemptions for the LEZ, such as removal companies, frozen goods vehicles, fuelling vehicles, vehicles with a disabled parking card, etc.
Paris is offering subsidies for other forms of transport (i.e., public transit) as a complementary measure to support/ease the ban. It would also like to pedestrianize the city centre and limit certain streets to EVs by 2020. In addition, the first Sunday of every month is completely car-free in the urban core (10am - 6pm).
Advantages • Improved local air quality
• Improved health
• Reduced congestion
Disadvantages
Environmental Impact
Expected reduction of emissions: 19% for NOx, 8% for PM10, 13% for PM2.5.
Goal: half exceedances of WHO guidelines.
Phase 2 removed only 3% of vehicles, but reduced NOx by 15% and PM2.5 by 11%.
Economic Impacts
The City provided financial assistance to small-to-medium enterprises (SMEs) to replace vehicles. The City budget for this program was €12 million with additional financial assistance from the state.
Stickers can be purchased online for about €4.
Effectiveness of Enforcement
The fine of entering with a Crit’Air 4 sticker is €68 for cars and motorbikes; €135 for trucks. Currently, police manually enforce the ban. Manual police enforcement has a lower cost, but typically results in lower compliance levels and effectiveness.
Social Equity and Fairness
Challenges/ Barriers
Stakeholders • Municipal and national governments
• Transit authorities

52
PARIS, FRANCE Government Roles and Responsibilities
References https://www.lez-france.fr/en/information-about-the-critair-vignette/french-environmental-zones-zcr/french-environmental-zones.html https://www.bbc.com/news/world-europe-46403397 https://www.businessinsider.com/cities-going-car-free-ban-2018-12#in-paris-the-first-sunday-of-every-month-is-free-of-cars-2 https://www.rac.co.uk/drive/news/motoring-news/law-change-for-uk-drivers-in-french-cities/ https://urbanaccessregulations.eu/countries-mainmenu-147/france/paris https://www.transportenvironment.org/sites/te/files/publications/2019_09_Briefing_LEZ-ZEZ_final.pdf https://www.theguardian.com/environment/2019/mar/17/air-pollution-london-low-emission-zone-deadly-toxic-fumes https://www.transportenvironment.org/sites/te/files/publications/TE%20Air%20Quality%20Report_FINAL_12032018%20NEW.pdf http://www.bestfact.net/wp-content/uploads/2016/01/CL1_146_QuickInfo_LEZParis-18Dec2015.pdf
London, England
Description London started with a LEZ in 2008 for heavy vehicles that covers Greater London, operating 24/7, 365 days a year. The minimum standard for large vans and minibuses is Euro 3 and for buses, trucks, and specialist heavy vehicles is Euro 4. The daily charge is £100 for vans and minibuses and £200 for trucks, etc. if the standards are not met. The emissions standards for the LEZ will be raised to equal ULEZ standards in 2020, with increasing daily charges as well between £100 and £300.

53
London, England
The ultra-low emission zone (ULEZ) was introduced in April 2019, covering all vehicles. Being phased in, starting with a 21 km2 area (central London, same area that is covered by the Congestion Charge), expanding to cover the entire city (inside the north and south Circular roads) in 2021.
The ULEZ limits are: Euro 3 or better for motorcycles, mopeds, etc. Euro 4 or better for gas cars, vans, minibuses and specialist vehicles. Euro 6 or better for diesel cars, vans, minibuses and specialist vehicles. Euro 6 for trucks, buses, and specialist HDVs. The main objective of the ULEZ is to change driver behaviour.
Rather than a ban on vehicles that don’t meet emissions limits, those vehicles have to pay to enter the ULEZ. The charges are £12.50 for cars, motorcycles, and vans and £100 for heavier vehicles (over 3.5 t) and buses over 5 t. The ULEZ is in effect 24/7, 365 days a year. The ULEZ charges are in addition to the Congestion Charge.
Residents within the ULEZ zone will be exempt from the ULEZ charge until October 2021 to give them more time to change vehicles to meet the ULEZ standards.
Vehicles for disabled people are exempt until October 2025. Taxis are exempt from ULEZ, as they have separate emissions standards to meet.
London also has an ultra-low emission street on Islington and Hackney where gas and diesel vehicles are banned weekdays from 7am - 10am and 4pm - 7pm. Access is restricted to cyclists, pedestrians, and low emitting vehicles (<75 g/km CO2). This has been in place since July 2018. London is considering implementing a zero-emission zone (ZEZ) for central London by 2022 with a goal of 90% vehicles entering the area being zero emission capable by 2030.
Advantages • Improved local air quality
• Increased local ZEV sales
• Reduced congestion
Disadvantages
Environmental Impact
First six months of ULEZ (April to September, 2019):
• Average compliance rate over 24 hours was 77%
• Average compliance rate during congestion charging hours was 74%
• 36% reduction of roadside concentration of NO2 (from February 2017 to September 2019 – this includes data from when the T-charge was introduced through to the first six months of ULEZ)
• 4% reduction of CO2 from road transport in central zone (13% since 2016)
• 3% to 9% reduction in traffic flows from May to September 2019 compared to same period in 2018
• 38% reduction of non-compliant vehicles in the zone during congestion charging hours
London has a higher market share of ULEVs/ZEVs than in the UK overall.

54
London, England
London’s LEZ: Small improvements in NOx and NO2, but none in PM. No resulting improved health impacts (e.g., children lung capacity). Further reductions are needed to deliver quantifiable health benefits.
Economic Impacts
Data from a 2003 estimate: €6-10 million capital plus €5-7 million operating costs for city-wide automatic (camera) enforcement. This can be compared to €2.8 million capital plus €4 million operating costs for a manual enforcement system.
The expansion of the ULEZ in October 2021 is estimated to cost £700 million for new monitoring infrastructure. The ULEZ is expected to raise £220 million per year, which is intended to cover operating and installation costs. Any additional revenues that may be generated from the ULEZ will be used to make public transit “clean and green” and on initiatives to reduce transport network pollution overall. Unlike other London schemes (e.g., congestion charge), the ULEZ has not been designed and implemented to raise funds, but the goal is to change driver behaviour.
Effectiveness of Enforcement
Penalty charges range from £160 for cars, vans, motorcycles to £1000 for trucks, buses, and specialist vehicles.
ULEZ and LEZ tracked by fixed and mobile cameras.
Automatic enforcement ensures higher compliance, increasing the environmental impact and the financial benefits.
Social Equity and Fairness
• Cycle superhighways were set up to make it safer to choose cycling.
• Extra buses and routes have been introduced.
• Residents within ULEZ and vehicles for disabled people are given more time to comply.
• SMEs and charities are supported in replacing older vehicles with EVs with up to £6000 for the purchase and operating costs.
• £18 million scheme to install 75 DCFCs to support the transition to EVs. Challenges/ Barriers
Stakeholders • Municipal government
• Vehicle manufacturers
• Fleet operators
Government Roles and Responsibilities
References https://www.london.gov.uk/sites/default/files/ulez_six_month_evaluation_report_oct19.pdf https://www.bbc.com/news/world-europe-46403397 https://www.ft.com/content/6378f18a-8dc5-11e9-a1c1-51bf8f989972 https://tfl.gov.uk/modes/driving/low-emission-zone

55
London, England https://tfl.gov.uk/modes/driving/ultra-low-emission-zone https://urbanaccessregulations.eu/countries-mainmenu-147/united-kingdom-mainmenu-205/london https://c40-production-images.s3.amazonaws.com/good_practice_briefings/images/7_C40_GPG_LEV.original.pdf?1456788962 https://www.transportenvironment.org/sites/te/files/publications/2019_09_Briefing_LEZ-ZEZ_final.pdf https://www.transportenvironment.org/sites/te/files/publications/TE%20Air%20Quality%20Report_FINAL_12032018%20NEW.pdf https://www.theguardian.com/uk-news/2019/may/16/ulez-cuts-number-of-worst-polluting-cars-in-central-london https://theconversation.com/londons-new-charge-on-polluting-vehicles-heres-everything-you-need-to-know-76255 https://www.thelancet.com/journals/lanpub/article/PIIS2468-2667(18)30202-0/fulltext#seccestitle190 https://www.citymetric.com/horizons/will-london-s-ultra-low-emissions-zone-improve-city-s-health-4572 http://www.em-solutions.co.uk/blog/low-emission-zones-are-they-effective/ https://journals.plos.org/plosone/article?id=10.1371/journal.pone.0102999 https://theconversation.com/londons-new-charge-on-polluting-vehicles-heres-everything-you-need-to-know-76255

56
Parking Space Removal
OSLO, NORWAY
Description In early 2019, Oslo completed removing over 700 parking spaces from its downtown core. Spots were replaced with bike lanes, plants, tiny parks, and benches (as part of Oslo's vision towards a car-free city centre). Cars were completely banned on some streets as well and delivery trucks are restricted to specific hours in the morning. Parking garages are available on the periphery of the city centre.
There are traffic restrictions that are used to encourage cars travelling through to take a ring road around instead of through the centre.
The few parking spots that are left (~50) are for disabled drivers or for EV charging.
They have also improved public transit (including increased service, new lines, and lowering the cost of tickets) and the cycling network (converting parking to bike lanes), including better lighting and snow removal.
Oslo took a gradual approach and made the transformation over several years. Advantages • Improved quality of life.
• Improved social connection.
• Increased/improved foot traffic to local businesses.
• Improved and cheaper public transit.
• Safer and improved cycling infrastructure.
• Decreased local air pollution and GHGs.
Disadvantages Environmental Impact
The number of pedestrians in Oslo’s city centre has increased by 10% since the parking spot phase out.
Parking space removal created additional room for forms of public transit and active transportation. It also created room for new public gathering places and green spaces.
Economic Impacts
There have been spill over economic benefits, such as increased use of bike share operations. Bike sharing has tripled in the three years of transition. A benefit to local business owners is that there has been a 10% increase in pedestrians in the city centre, which can result in increased shopping/spending.
Fees from a toll ring road around Oslo are used to pay for the transition (e.g., new bike lanes, revitalized public areas, improved public transport, etc.).

57
OSLO, NORWAY
The government is currently compiling tax records to measure the economic impact of its reforms.
Effectiveness of Enforcement
Social Equity and Fairness
Complementary measures to improve equity include:
• Decreasing cost of transit while improving service
• Providing grants for electric bikes
• Operating bike share year-round, including pilot testing cargo bikes
Challenges/ Barriers
Initially, the city wanted to ban cars from the centre (within Ring 1), but after one year of backlash, back and forth, resistance from shopkeepers, etc. the city changed tactics and decided to remove all on-street parking instead. In effect, cars are allowed, but they have nowhere to stop/park. This was considered to be a more gradual, palatable approach to eliminating cars with the goal of making it harder to use a car than not.
As noted, prior to implementation, there was a perception that businesses would be negatively impacted. However, the opposite has happened. Pedestrianized areas are some of the most popular in the city. There is more foot/bike traffic than there are car visits, with 10% more pedestrians in the city centre in the first year after removing the parking.
As with any major societal transition, effecting behaviour change is a key challenge. By making it harder to use a car than other modes of transport, along with supportive, complementary measures, the city attempted to nudge car drivers into a change of habit. Cars are still seen as a status symbol, so it remains a challenge to move people from their cars onto public transit or active modes.
Stakeholders • Municipality
• Business owners
• Residents and community groups
Government Roles and Responsibilities
References https://www.witpress.com/elibrary/wit-transactions-on-ecology-and-the-environment/226/36274 https://www.fastcompany.com/90294948/what-happened-when-oslo-decided-to-make-its-downtown-basically-car-free https://cleantechnica.com/2019/03/05/oslo-is-almost-car-free-and-likes-it-that-way/ https://www.nbcnews.com/news/world/no-parking-oslo-aims-limit-cars-city-center-n932021 https://www.economist.com/europe/2019/05/30/norways-capital-is-the-latest-city-to-declare-war-on-cars

58
Freiburg, Germany (neighbourhood: Vauban)
Description No parking was established more than 20 years ago in Vauban, a dense middle-class neighbourhood of about 5,000 residents. Parking garages are located at the periphery of the neighbourhood (with less than 0.5 spots per residence). Pedestrian were given priority and cars are allowed at 3 miles/hour only for temporary pickup/drop off.
There is a network of pedestrian and cycling paths and every home is within walking distance to a tram stop, schools, businesses, and shopping centres.
This car-free neighbourhood and parking-free neighbourhood was part of a bigger sustainable urban development project (including housing, energy, water, and mobility).
Advantages • Improved quality of life.
• Improved health and social connection.
• Decreased local air pollution and GHGs.
Disadvantages
Environmental Impact
In terms of car ownership, in Vauban 183 of 1,000 people own cars (vs. ~400 of 1,000 in nearby neighbourhoods and ~800 of 1,000 in the U.S.). Reduced car ownership results in reduced fuel consumption, reduced driving, reduced CACs and GHGs, etc.
• 57% of households that owned a car when moving to Vauban let their car go.
• 70% of households do not have a car
• 64% of all journeys in Vauban are by bike
• 19% transit mode share
• 39% households with car sharing membership
Economic Impacts
The budget from the city for the entire project (i.e., not just the transport initiatives) was $112 million. This budget included costs to build new community-oriented facilities including a primary school, community centre and several daycare centres. Funds to repay the city’s loans were raised in large part through the selling of municipally owned land to residential developers. Approximately $6.5 million was provided by state-level government agencies.
Effectiveness of Enforcement
Cars are not banned, but the design makes it easier to walk or bike instead of going to the garage to get your car and then drive on streets that are prioritized for pedestrians. The goal was to make it easier to decide not to own a car by establishing the right infrastructure - public transport, easy walking distances, bike lanes, etc.

59
Freiburg, Germany (neighbourhood: Vauban) Social Equity and Fairness
Improved social equity, making it easier for those who can't afford cars, or are too young/old to drive, to be able to get around. More equitable options for transportation were provided and prioritized.
Homes without cars are provided with car sharing tickets and public transport concessions.
Some accusations that Vauban is too focused on the environmentally aware, educated middle class, leaving little room for diversity.
A former French military barracks in the neighbourhood was converted into co-operative, low-cost community housing.
Widespread public consultation was used throughout the design and planning process.
Forum Vauban was established as an NGO that was financially and administratively supported by the City. The Forum established working groups with experts and general public on all aspects of the development (e.g., legal, financial, social, transport, energy, etc.). The City dedicated 5-7 staff to the development project.
Challenges/ Barriers
Regional laws required a parking space for every home. The community negotiated to reduce this to one spot for every two homes and located in garages at the edge of the development (i.e., no parking in front of buildings and houses). As part of the compromise, the government required a plot of land to be put aside in case future residents wanted more parking. It was established as a park that could be converted to parking; however, 20 years later, it is still a park.
Lack of developers willing to take the risk - the thought at that time was that people would not want to live in apartments that didn't come with parking. The residents ended up creating building cooperatives to develop the project themselves.
Retrofitting existing areas to this format is more difficult than designing new development for this format (e.g., challenge to add public transit into existing infrastructure, grid road systems are not always bike/pedestrian friendly, etc.).
This is a big opportunity for new developments, but it is harder for existing areas.
Stakeholders • Developers
• Community advocacy groups and the general public/residents
• Municipal government
Government Roles and Responsibilities
Three main parties:
• Project Group Vauban (local authority administration)
• City Council Vauban Committee (political platform for information exchange, discussion and decision making)
• Forum Vauban (local citizen association)

60
Freiburg, Germany (neighbourhood: Vauban) References https://www.fastcompany.com/90327301/what-can-we-learn-from-this-thriving-
car-free-german-neighborhood-get-rid-of-parking-spaces https://www.smartcitiesdive.com/ex/sustainablecitiescollective/words-most-successful-model-sustainable-urban-development/229316/ https://www.uclg-cisdp.org/sites/default/files/Freiburg_2010_en_final.pdf http://urbed.coop/sites/default/files/Case%20studies_1.pdf https://itdpdotorg.wpengine.com/wp-content/uploads/2014/07/26.-092211_ITDP_NED_Vauban.pdf
Amsterdam, Netherlands
Description Amsterdam has decided to control access to permitted, on-street parking in its centre. Targets street parking, rather than a ban on driving. Starting in summer 2019, the City will remove ~1,500 parking permits per year, resulting in a removal of 11,200 parking spaces by 2025. They are not revoking parking permits, they are just not replacing them (e.g., when a driver with an existing permit leaves the city, gives up their car, or dies). The maximum number of parking permits will be reduced every six months by approximately 1.1%. At the same time, the annual costs for parking permits will increase and there will be restrictions on location of parking. Parking spots will be replaced with trees, bike parking, and wider sidewalks.
Additional spots are being removed, as major construction and restoration work takes place on waterside streets, harbour quaysides, and other major streets.
Permit restrictions do not impact special permits (e.g., disabled, care providers, car shares, etc.).
This initiative is part of the broader Amsterdam Low-Car City Agenda.
Advantages • Minimizes controversy, causes the least possible inconvenience to residents/car owners.
• Still enough parking (including underground garages).
• Frees up space for living – bikes, sidewalks, trees, etc.
• Impacts a minority – only 22% of journeys happen by car.

61
Amsterdam, Netherlands
• Improved cycling infrastructure (65-70% of journeys happen by bike). Disadvantages • Higher costs for car-captive residents
Environmental Impact
• Added green space and urban biodiversity
Economic Impacts
In response to this and other LCMAs, the prevalence of cargo bike deliveries in Amsterdam has been rising rapidly. Some courier service providers, such as DHL, have been increasingly shifting from van to cargo bike deliveries in Amsterdam and other Dutch cities.
Effectiveness of Enforcement
No driver is being stripped of the right to park. Permits are being retired by attrition.
Social Equity and Fairness
Challenges/ Barriers
Stakeholders
Government Roles and Responsibilities
Amsterdam’s government is currently run by a coalition of leftist and centrist parties, and the Green Left party GroenLinks has the largest share. A promise to reduce the number of parking spaces forms a key element of the government’s mandate. This helped to mitigate political barriers to getting the public parking phase out implemented.
References https://www.citylab.com/transportation/2019/03/amsterdam-cars-parking-spaces-bike-lanes-trees-green-left/586108/ https://www.citylab.com/transportation/2017/03/do-dutch-bikes-need-more-road-space/520998/ https://www.amsterdam.nl/bestuur-organisatie/college/wethouder/sharon-dijksma/persberichten/aantal-beschikbare/ http://sustainableamsterdam.com/2019/01/the-future-of-the-car-in-amsterdam/

62
Restricted Road Access
Italian Cities
Description Limited traffic zone (LTZ) is an area closed to non-residential traffic. City buses, taxis, permitted residents, delivery vehicles, and motorcycles/scooters are allowed to drive in the zones. The main intent is to increase pedestrian areas, commercial/tourism activities, and reduce pollution. Implemented in historical cities across Italy (e.g., Florence, Pisa, Siena) to help preserve historical sites.
For example, the LTZ was established in 1990 in Florence, covering the city centre and controlled by 20 automatic gates. Restrictions are in effect weekdays from 7:30am – 8pm and Saturdays from 7:30am – 4pm. Plus additional night times from April to October.
Advantages • Reduced noise and congestion
• Reduced pollution and GHGs
• Improved safety and accessibility for pedestrians and cyclists
• Improved transit travel times
Disadvantages
Environmental Impact
• Reductions in air pollutants and GHG emissions from transportation
However, to date few cities have quantitatively evaluated the effectiveness of LTZs on air quality, traffic safety, or even traffic volumes. In most cases, LTZs are implemented quickly, by mayoral decrees, so no baseline data is collected prior to implementation by which to gauge an LTZ’s environmental achievements.
Economic Impacts
The primary goal of Italy’s LTZs is to improve quality of life in city cores, rather than revenue generation. LTZs are meant to address congestion, air pollutants and noise, so in many cases economic data has not been collected or analysed.
In the case of Rome’s LTZ, it had the following impacts between 1999 and 2004:
• Overall traffic reduction of 13%
• Travel speeds for buses increased
• Delivery vehicle volumes decreased from 13,000 to 10,000 per day
• Increased use of motorcycles, scooters and walking as means of transport
• Motorcycle and scooter sales increased significantly; total number of motorcycles/scooters owned in Rome went from 400,000 in 1996 to 600,000 in 2004 (they are authorized to enter LTZs)
Rome conducted a follow-up assessment of its LTZ in 2014. Between 2004 and 2014 the following impacts were realized:
• The total number of trips by car decreased by 5%

63
Italian Cities
• Public transit ridership levels increased by 3.6%
• The total number of pedestrian and cycling trips increased by 1.5%
Effectiveness of Enforcement
LTZ are enforced through automated cameras. If the vehicle entering the zone is not registered, a fine (between €76 and 100) is sent to the registered owner of the vehicle.
Social Equity and Fairness
Challenges/ Barriers
Stakeholders Government Roles and Responsibilities
References https://www.poderezollaio.org/limited-traffic-zone.html http://www.serviziallastrada.it/it/?option=com_content&view=category&layout=blog&id=31&Itemid=121&lang=en&utm_source=visitflorence.com&utm_campaign=DiscoverTuscany&utm_medium=referral&utm_content=/tourist-info/driving-in-florence-ztl-zone.html https://www.visitflorence.com/tourist-info/driving-in-florence-ztl-zone.html https://mydigitalpublication.com/publication/?i=362529&article_id=2649534&view=articleBrowser#%22issue_id%22:362529,%22view%22:%22articleBrowser%22,%22article_id%22:%222649534%22
New York City, New York
Description New York created permanent pedestrian only zones (e.g., Times Square, Herald Square, Madison Square Park, etc.). Recently, the city has restricted traffic in Central Park, with cars being permanently prohibited.
It also recently limited a one mile stretch of 14th St to transit vehicles and trucks only, and found that traffic levels on surrounding streets have not changed drastically, but transit reliability, speed, etc. has significantly improved (apparently this was modelled after the Toronto King St. project). This is part of an 18 month pilot project which began in July, 2019. The pilot will be evaluated by collecting data on bus performance, safety, parking, traffic, truck volume, and pedestrians.

64
New York City, New York The Department of Transportation’s Commissioner stated in October of 2019 that the pilot would serve as a template for similar projects in other parts of NYC.
NYC also has “summer streets” where seven miles of streets are blocked off to traffic for three Saturdays in August between 7am and 1pm.
Advantages • Reduced traffic injuries
• Enhanced transit reliability and speed
• Enhanced foot traffic for local businesses
Disadvantages
Environmental Impact
50% to 60% lower levels of NOx in Times Square
Economic Impacts
The Times Square project – area bounded by Broadway and Seventh Ave between 42nd and 47th streets – cost $72 million and converted over 10,000 square metres to pedestrian space.
Vehicles that ignore the rules of the 14th Street Transit and Truck Priority corridor will be issued fines starting at $65. However, the restricted zones in NYC are not intended to be revenue generators. Costs to implement LCMAs are being derived in part from existing bridge tolls, gas taxes and a Manhattan congestion charge that will come into effect in 2021.
Effectiveness of Enforcement
Enforcement of the 14th St pilot is currently done manually via on-the-ground NYPD traffic agents.
Social Equity and Fairness
Challenges/ Barriers
The 14th St pilot is currently being challenged in court by a consortium of groups including the National Motorists Association. Some city transportation officials anticipated that the pilot would lead to crippling congestion on adjacent streets due to diverted traffic, but this hasn’t proven to be the case. NYC is now looking to expand on the success of the pilot in other high traffic areas of the city.
Stakeholders Government Roles and Responsibilities
References https://www.businessinsider.com/cities-going-car-free-ban-2018-12#new-york-city-banned-cars-from-central-park-3 https://nypost.com/2018/04/20/de-blasio-hails-historic-ban-on-cars-in-central-park/ https://nyc.streetsblog.org/2018/06/27/say-goodbye-to-cars-in-central-park/ https://www.vox.com/the-goods/2019/10/28/20932554/new-york-san-francisco-car-free-zones https://www.nytimes.com/2019/10/03/nyregion/car-ban-14th-street-manhattan.html

65
New York City, New York https://www.nytimes.com/2019/08/08/nyregion/14th-street-busway.html https://ny.curbed.com/2017/4/19/15358234/times-square-snohetta-before-after-photos https://pollutionfree.wordpress.com/2011/05/12/the-impact-of-pedestrian-zones-on-urban-air-quality/ https://www1.nyc.gov/html/brt/downloads/pdf/14th-street-priority-jun2019.pdf
Toronto, Ontario
Description While all modes of transportation are accommodated in the King Street Transit Priority Corridor (between Bathurst St. and Jarvis St.), the movement of vehicles is restricted (i.e., no through traffic from one block to the next on King St).
The initiative started as a pilot project in November 2017 and in April 2019 it was made into a permanent transit priority corridor. The corridor provides priority to streetcars by restricting through traffic of vehicles at most intersections. The design of the street also expanded space for the streetcar stops and opened up curb lane use for public space (e.g., seating areas, urban forest, parklets, planters), cafes, loading zones, cycling infrastructure (e.g., bike parking), and taxi stands.
The City of Toronto created a website that provides data and analytics on the King Street Corridor, as well as instructions no how to navigate it and other resources.
Advantages • Improved transit reliability
• Improved speed
• Improved capacity
• Support economic prosperity and improved place-making
• The transit corridor has not led to increases in traffic volumes on adjacent streets
Disadvantages Environmental Impact
• King St transit users went from 72,000 per day to 84,000 one year after demonstration was launched (~17% increase); this includes a 33% increase in ridership during the morning rush hour, and a 44% increase during the evening rush hour
• Green spaces and public gathering places were added

66
Toronto, Ontario
• The number of cyclists using King St during the morning and evening rush hours increased by 175%
• Daily car volumes on King St decreased by roughly 7% during the pilot. On adjacent east-west corridors, car volumes increased by roughly 5%.
Economic Impacts
Total implementation costs of the King Street pilot have not been published, however, several financial metrics have been tracked and published by Toronto.
Customer spending data suggests that year-over-year growth (2017-2018) in total consumer spending on King Street decreased slightly (by 0.8%) after the pilot was implemented, with reductions primarily in the restaurant sector. This is a trend that existed during the year before the pilot was implemented, indicating that these differences may not have resulted from the pilot itself. Spending in both retail and services sectors appears to have grown faster during the year after the pilot was installed compared to the rate of growth in the year before the pilot began.
To assist local businesses, Toronto issued 14 permits for new patio spaces along the King Street corridor. The city also launched the “Food is King” promotion which offered a $15 credit to Torontonians who used a line-skipping app at any one of 52 participating restaurants in the corridor. This promotion resulted in a $426,005 increase in sales for participating restaurants compared with the weekly average three weeks before the promotion.
To assist individual drivers, the Toronto Parking Authority began offering a promotional parking discount of up to $10 through its GreenP app, effective at all GreenP parking spaces in the corridor. In 2018, this promotion was used over 78,000 times, representing over $500,000 in savings for local drivers.
Effectiveness of Enforcement
Social Equity and Fairness
The City partnered with Ryerson University to implement a student design build competition to create interactive public space installations on reclaimed land within the corridor.
Efforts were made to compensate drivers and local businesses impacted by the pilot (see “Economic Impacts”).
Challenges/ Barriers
Stakeholders • Municipal government
• Transit authorities
• Local businesses
• Local parking authority
• Academia
Government Roles and Responsibilities
References https://www.toronto.ca/city-government/planning-development/planning-studies-initiatives/king-street-pilot/
https://www.toronto.ca/city-government/planning-development/planning-studies-initiatives/king-street-pilot/data-reports-background-materials/

67
Congestion Charges
LONDON, ENGLAND
Description Congestion charge:
The charge covers a 21 square km area in central London and applies weekdays between 7am and 6pm. There is a £11.50 flat daily rate for entering the zone (up from £5 when it was first implemented in 2003).
Exemptions include registered disabled people, motorcycles, taxis, and minicabs. Residents receive a 90% discount on the charge. There is also a discount for cleaner vehicles (i.e., meets Euro 6 standards, emits ≤ 75 g/km CO2, and has a minimum 20 mile zero emission range; OR is registered as an EV).
The goal was to reduce congestion and generate funds for public transport.
Toxicity charge (T-charge): Introduced in October 2017 at £10 for older, more polluting vehicles. Generally applied to diesel and gas vehicles registered before 2006 and some later models. The T-Charge covered the same zone as the Congestion Charge and was in addition to the Congestion Charge. The T-Charge was replaced by the ULEZ in 2019.
Advantages • Reduced congestion
• Improve travel time and reliability
• Improved public transit and ridership
• Increased funding and long-term funding source for public transport services
• Improved air quality and public health Disadvantages
Environmental Impact
One year in to the congestion zone, one report indicated that 29,000 (16%) more people used the bus to get into the zone during morning rush hour, compared to a year before. Bus riders also experienced a 30% reduction in average wait times due to less congestion and enhanced service levels. Average road speeds within the zone increased by 10-15%. In the first year, public approval of the congestion zone went from 40% to 55%.
Between 2002 and 2014, number of private cars entering the zone decreased by 39%.
The total number of vehicles driving in the zone is 25% lower than a decade ago. However, taxis and private car hire (Uber, etc.) trips into the zone increased by over 29% since 2000.

68
LONDON, ENGLAND The increase of taxis/car hire vehicles in the zone has impacted the efficiency of the bus service, leading to a reduction in ridership.
The number of cycling trips in the zone increased 210% between 2000 and 2016.
Economic Impacts
In 2017, the approximate operating costs were £90 million and net revenue was approximately £160 million.
Another source indicates: Capital cost of £161.7 million (~$265 million CAD). Annual operating costs of £130 million (~$213million CAD). Annual net revenue of £137 million (~$225 million CAD).
Effectiveness of Enforcement
All by camera. Penalty for not paying is £160.
Social Equity and Fairness
300 extra buses were put in service on the day that the congestion charge was introduced in 2003. Bus routes were updated and frequency increased. Road space has been reallocated to cycle and pedestrian use. 8,500 park and ride spaces added.
Challenges/ Barriers
Keeping up with the times. While the congestion charge has been effective in reducing private car congestion, it needs reform given the increase in minicabs, private car hire (over a 75% increase in registrations between 2013 and 2017), decreased transit ridership, etc. to meet the financial and logistical challenge of a good transport system. A new approach is needed to generate funds for the city’s transport system and to address the changes in the last 15 years in how people move (e.g., Uber, increased deliveries, etc.).
Stakeholders
Government Roles and Responsibilities
References http://theconversation.com/london-congestion-charge-what-worked-what-didnt-what-next-92478 https://www.researchgate.net/publication/228658456_Making_sustainable_transport_politically_and_publicly_acceptable_Lessons_from_the_EU_USA_and_Canada https://www.citylab.com/transportation/2018/04/londons-congestion-charge-needs-updating/557699/ https://tfl.gov.uk/modes/driving/congestion-charge https://www.london.gov.uk/what-we-do/transport/mayors-new-ps10-toxicity-charge-londons-most-polluting-cars http://nyc.streetsblog.org/wp-content/uploads/2018/01/TSTC_A_Way_Forward_CPreport_1.4.18_medium.pdf

69
STOCKHOLM, SWEDEN
Description Congestion pricing was implemented as a seven month trial starting in 2006. After the trial, a referendum was held and a majority vote led to a permanent congestion charge starting in 2007. It covers the city centre (34 km2) and applies on weekdays between 6am and 6:30pm. There is no congestion charge on holidays or for the month of July (as most Swedes take that month off work). The charge varies by time of day and level of congestion, with a daily maximum of 105 SEK (~$14 CAD). Peak hours (7:30-8:30am and 4-5:30pm) cost the most at ~$4 CAD; 30 minutes before and after the peak periods cost ~$3 CAD); and the rest of the period costs between ~$1.50 and $2 CAD per hour. Low emission vehicles are charged discounted rates, which serves to promote their use.
Exempt vehicles include large buses, motorcycles and mopeds.
Primary objectives of the charge were to reduce congestion, increase accessibility, and improve the environment.
Advantages • Improved travel times both inside and outside the zone
• Reduced congestion
• Reduced emissions; improved air quality and public health
Disadvantages • More crowded conditions on public transport
Environmental Impact
Car trips in the congestion zone decreased 20% (about 100,000 trips during peak congestion period each day) with immediate impact on improved travel times. Transit ridership increased by 6-9%. Traffic volumes on outlying streets reduced by just over 5%.
Once the trial period was over, traffic congestion returned to almost pre-trial levels. When it was reinstated, the 20% decrease returned and has remained steady.
• CO2 emissions reduced by 15-20%
• NOx (8.5%) and PM10 reductions as well
• Air pollutants between 10 and 14%
Economic Impacts
2 billion SEK (~$270 million CAD) for installation and first year operation. 1.05 billion SEK of which was for set up, including extensive testing, training, etc. It is assumed that a similar system could now be built for half the cost or less. Annual operating costs 100 million SEK (~$13.5 million CAD). Annual revenues about 1.3 billion SEK (~$175 million CAD).

70
STOCKHOLM, SWEDEN
Plus over $300 million for complementary measures including buses, transit improvements, and park and ride lots.
Operating costs are roughly 25% of annual revenues
• Shorter travel times valued at 536 million SEK annually
• Increased road safety valued at 125 million SEK
• Health and environmental benefits valued at 86 million SEK
Effectiveness of Enforcement
18 unmanned control points - Automatic by cameras (also used transponders when the system first started). Makes for a reliable capture rate and more cost-effective operation.
A 500 SEK (~68 CAD) fine is applied after 4 weeks of non-payment. After which, this money can be directly removed from the offender’s bank account.
Monthly invoices are sent to the owner of the car.
Social Equity and Fairness
The year before the trial, the city extended public transit services (16 new routes), purchased new buses (197 new buses), and increased park and ride capacity (2,800 new spaces).
They also improved bike and pedestrian infrastructure.
Payment options are automatic account debiting, online, by mail, and in-person at shops and banks.
Challenges/ Barriers
Public and political opposition
Sweden’s Green Party demanded the trial period during the 2002 federal election in exchange for its support for a national social-democratic government.
“Familiarity breeds acceptability” – public, media, and political opinions changed quite drastically from long before (moderate) to right before (negative) to during (positive) the trial and then stayed positive after the permanent installation.
Stakeholders Government Roles and Responsibilities
Setting goals and restrictions is the mandate of local policymakers, while system details and design is the mandate of transportation system experts.
In designing congestion charges, the goals need to be explicit, relevant, and quantified (e.g., revenue generation, congestion reduction, local air quality improvements, etc.). Up-to-date and accurate transport models are needed to design the system, so data collection pre- and post-implementation is crucial. Local governments should ensure they have the political and legal leeway to make minor adjustments once the system is up and running. Complex is okay, as systems that are too simple can have design restrictions that are difficult to solve when problems emerge.
References http://www.transportportal.se/swopec/CTS2014-7.pdf https://www.roadtraffic-technology.com/projects/stockholm-congestion/ https://www.toolsofchange.com/userfiles/Stockholm%20Congestion%20Pricing%20-%20FINAL%202014.pdf

71
STOCKHOLM, SWEDEN https://theicct.org/sites/default/files/publications/congestion_apr10.pdf http://www.transportportal.se/swopec/CTS2014-7.pdf https://transportstyrelsen.se/en/road/Congestion-taxes-in-Stockholm-and-Goteborg/ http://nyc.streetsblog.org/wp-content/uploads/2018/01/TSTC_A_Way_Forward_CPreport_1.4.18_medium.pdf
SINGAPORE, REPUBLIC OF SINGAPORE Description Congestion charging in place since 1975 in the central business zone (Restricted
Zone, RZ). Started as a windshield sticker based scheme for the morning rush (7:30-9:30am) manually enforced at the roadside. Was modified over the years to extend to 10:15am in the morning and include the evening peak period. Exempted vehicles at the beginning included 4+ car-pooling and taxis, but those exemptions were eliminated over time. In 1994, all day congestion charge was introduced, with the price depending on mid-day trips or rush times. It was also expanded to include three motorways outside the central business zone.
As of 1998, the system changed to electronic road pricing with more than 80 automatic charge points across the city with charges varying by time of day, location, and type of vehicle. The charge period is Monday to Saturday, 7am-8pm. The charge is $0 to about $4.00 depending on the road, the time, and local traffic conditions. Rates are set based on real-time travel speeds and congestion.
Each vehicle needs to be equipped with an in-vehicle unit (transponder) and a pre-paid smart card. The transponder costs around $146.
Singapore recently procured a global navigation satellite system (GNSS) based electronic road pricing system for implementation in 2020. At a cost of around $535 million, it will be a full distance, time, location, and vehicle type pricing scheme. It will use 4G and also still be compatible with the transponder/smart card system.
The upgrade is providing the opportunity to enable equitable congestion management (similar proportions of high, middle and low income commuters
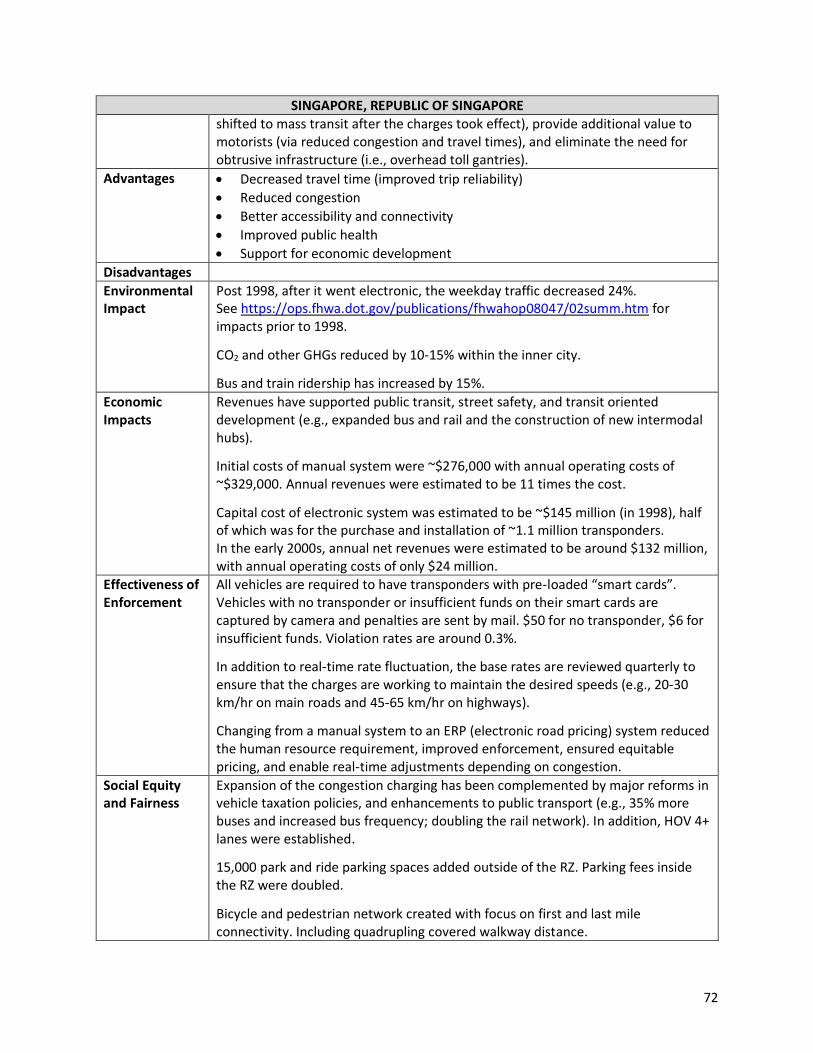
72
SINGAPORE, REPUBLIC OF SINGAPORE shifted to mass transit after the charges took effect), provide additional value to motorists (via reduced congestion and travel times), and eliminate the need for obtrusive infrastructure (i.e., overhead toll gantries).
Advantages • Decreased travel time (improved trip reliability)
• Reduced congestion
• Better accessibility and connectivity
• Improved public health
• Support for economic development
Disadvantages
Environmental Impact
Post 1998, after it went electronic, the weekday traffic decreased 24%. See https://ops.fhwa.dot.gov/publications/fhwahop08047/02summ.htm for impacts prior to 1998.
CO2 and other GHGs reduced by 10-15% within the inner city.
Bus and train ridership has increased by 15%.
Economic Impacts
Revenues have supported public transit, street safety, and transit oriented development (e.g., expanded bus and rail and the construction of new intermodal hubs).
Initial costs of manual system were ~$276,000 with annual operating costs of ~$329,000. Annual revenues were estimated to be 11 times the cost.
Capital cost of electronic system was estimated to be ~$145 million (in 1998), half of which was for the purchase and installation of ~1.1 million transponders. In the early 2000s, annual net revenues were estimated to be around $132 million, with annual operating costs of only $24 million.
Effectiveness of Enforcement
All vehicles are required to have transponders with pre-loaded “smart cards”. Vehicles with no transponder or insufficient funds on their smart cards are captured by camera and penalties are sent by mail. $50 for no transponder, $6 for insufficient funds. Violation rates are around 0.3%.
In addition to real-time rate fluctuation, the base rates are reviewed quarterly to ensure that the charges are working to maintain the desired speeds (e.g., 20-30 km/hr on main roads and 45-65 km/hr on highways).
Changing from a manual system to an ERP (electronic road pricing) system reduced the human resource requirement, improved enforcement, ensured equitable pricing, and enable real-time adjustments depending on congestion.
Social Equity and Fairness
Expansion of the congestion charging has been complemented by major reforms in vehicle taxation policies, and enhancements to public transport (e.g., 35% more buses and increased bus frequency; doubling the rail network). In addition, HOV 4+ lanes were established.
15,000 park and ride parking spaces added outside of the RZ. Parking fees inside the RZ were doubled.
Bicycle and pedestrian network created with focus on first and last mile connectivity. Including quadrupling covered walkway distance.

73
SINGAPORE, REPUBLIC OF SINGAPORE Challenges/ Barriers
Stakeholders
Government Roles and Responsibilities
References https://ops.fhwa.dot.gov/publications/fhwahop08047/02summ.htm http://nyc.streetsblog.org/wp-content/uploads/2018/01/TSTC_A_Way_Forward_CPreport_1.4.18_medium.pdf http://roadpricing.blogspot.com/2016/03/singapore-will-have-worlds-first-gnss.html https://localgovernmentmag.co.nz/lg-magazine/transport-lg/electronic-%E2%80%A8road-pricing/