opportunities for innovation in fruit & vegetable retailing: a ......1 opportunities for...
TRANSCRIPT

International Food and Agribusiness Management Association 19th Annual World Forum and Symposium
Budapest, Hungary, June 20-23 2009
Global Challenges – Local Solutions Opportunities for Innovation in Fruit & Vegetable Retailing:
A Value Chain Approach Christian FISCHER Agribusiness, Logistics & Supply Chain Management Institute of Food, Nutrition and Human Health Massey University PBag 102 904, North Shore Mail Centre Auckland 0745 New Zealand Tel: +64–9–443–9771 Fax: +64–9–443–9640 Email: [email protected] Web: http://scm.massey.ac.nz

1
Opportunities for Innovation in Fruit & Vegetable Retailing: A Value Chain Approach
Christian Fischer
Agribusiness, Logistics & Supply Chain Management Institute of Food, Nutrition and Human Health
Massey University
[email protected] Tel: +64-9-443-9771
April 2009 First draft – please contact author for updates
0B0BAbstract An increase of the per capita intake of fruit and vegetables (F&V), while having grown steadily during the past, is still a major objective of public health policy. Conventional government measures have been focusing on communication campaigns aimed at changing consumption behaviour. However, there also seems to be a link between the supply density of F&V and consumption intensity. Countries with higher per capita F&V intake typically also have more specialised F&V retailers (greengrocers). Where access to F&V is easier, consumption levels may be higher. Given that a competitive greengrocer industry may be socially desirable this study discusses opportunities for innovation in the greengrocer industry at the product, process and system level, using a value chain approach. It is argued that there is potential to transform the industry’s current commodity-based value chain model from ‘distributing fresh produce’ to the ‘catering of meal solutions and health contributions’ for the 21st-century food consumer. Keywords: fruit and vegetables, consumption, retailing, marketing, value chain, innovation

2
1B1BIntroduction Public and private organisations have been advocating for a long time an increase in the intake of fruit and vegetables (F&V) for nearly all strata of population. The consumption habit is thought to contribute to healthy lifestyles, reduce obesity rates and prolong life expectancy (WHO, 2002; current). It is not a new issue. As far back as 60 years ago there were calls for citizens to increase their F&V intake on health grounds (Kitchen, 1949). In the meanwhile, per capita F&V has been steadily grown all over the world (see XXTable 1XX in the following section). However, while there is no consensus on what an optimum, or minimum, intake of F&V is (e.g., the WHO recommends at least 400 grams a day whereas the Harvard School of Public Health advocates double the amount), it is widely acknowledged that F&V consumption should be further increased. Another aspect which has been receiving growing attention is that an increased F&V intake may not only be good for consumers’ health but also for the planet’s. According to a recent session of the American Association for the Advancement of Science annual meeting, roughly 30% of global warming is attributable to society’s greenhouse gas emissions which stem from the production of foods and beverages. And half of this comes from the production, distribution and consumption of meat (mainly beef, pork and chicken). Conversely, F&V growing and eating generates only very little greenhouse gases. For example, a kilogram of beef served as a meal produces about 19 kg of CORR2RR, as compared to only 280 grams for a kg of potatoes (Raloff, 2009). As to the reasons of why consumers are reluctant to eat more F&V, studies have shown that this may not be primarily due to economic determinants such relatively higher F&V prices (as compared to other foods) (Dresler-Hawke, 2007) or low incomes (Bertail and Caillavet, 2008). Food choice is a complex psycho/socio-economic issue. Government programmes to promote F&V consumption have tended to focus on communication/information campaigns (e.g., Rowely, 2006). However, awareness-rising activities alone have not always yielded satisfactory results (Della et al., 2009). Therefore, other strategies have also been recommended. One is to increase the availability, variety and convenience of F&V in grocery stores (Glanz and Yaroch, 2004). For instance, the Australian National Action Plan to Increase the Consumption of Vegetables and Fruit (2000-2005) lists, in addition to social marketing and community interventions, food supply initiatives: “actions and policies by growers, manufacturers, distributors/transporters and retailers to increase access to quality fruit and vegetables” (p. 6). In the UK, a three-year, £800,000 government-funded pilot programme has been introduced in 2008, designed to encourage more consumers to eat F&V by increasing F&V promotions in corner shops (Hurst, 2008). Besides the public-health motives to increase the availability and the shopping and consumption convenience of F&V there are also efficiency issues in the supply chain that need to be addressed. During the last decades, improvements in international F&V trade and logistics (among other things) have secured a wide variety of fresh products, available all year around in many countries. However, considerable quantities of food are lost in processing, transport, supermarket storage and people’s kitchens (Lundqvist et al., 2008). For instance, in the US as much as 30% of food, worth some $48.3 billion,

3
is thrown away. The American Food Marketing Institute estimates that about 8-10% of total ‘perishable’ food is wasted before it reaches consumers, about twice the amount that is generated by European retailers (The Economist, 2008), although some estimates for Europe also amount to 5-10% (van Uffelen et al., 2004). One reason for the US-Europe difference may be the enthusiasm of US store managers for large F&V displays and for offering the widest possible range of produce leading to significant unsold ‘shrinkage’ (The Economist, 2008). In Europe, the displays tend to reflect seasonal and regional availability which is also what consumers expect since it guarantees the freshest and tastiest products. Hence, there seems to be a need for a further enhancement of F&V retailing systems all over the world, for reasons of both increasing socially-desired consumption and reducing wastage. While modern supply chain management techniques and tools (e.g., the use of cold-storage systems, third-party logistics providers, efficient consumer response etc.) have already been adopted by large supermarket chains (Cook, 2008; Murray, 2007; Epperson and Estes, 1999), the specialised F&V retail industry (“greengrocers”) have not yet systematically embraced them. This is the topic which this paper intends to address. The paper aims at generating insights into the potentially existing structural marketing problems of the F&V retailing industry and at identifying opportunities for industry innovations at the product, process and system level. The analysis consists of desk research and case study work. It is an exploratory study attempting to consolidate existing literature and data, completed by expert knowledge obtained from industry professionals. At this stage, the approach is conceptual rather than empirical. Nevertheless, official statistics are used wherever relevant and available to support the arguments. The paper’s structure is as follows. After this introduction, international F&V consumption trends are reviewed and the business characteristics of the greengrocer industry are discussed. This includes a review of the recent and relevant literature. Hereafter, the industry supply chain is discussed and options for innovations are presented. Section four provides conclusions and discusses implications for management and policy support. 2B2BReviewing international F&V consumption trends and retail characteristics The prevailing agri-food system paradigm is “consumer-driven agriculture” or “from fork to farm”. Therefore an effort is made to build an understanding of current consumption trends before moving upstream in order to discuss supply characteristics. 6B6BF&V consumption During the last 40 years F&V per capita consumption has increased throughout the world. XXTable 1XX reports annual growth rates for the world, different regions and
4
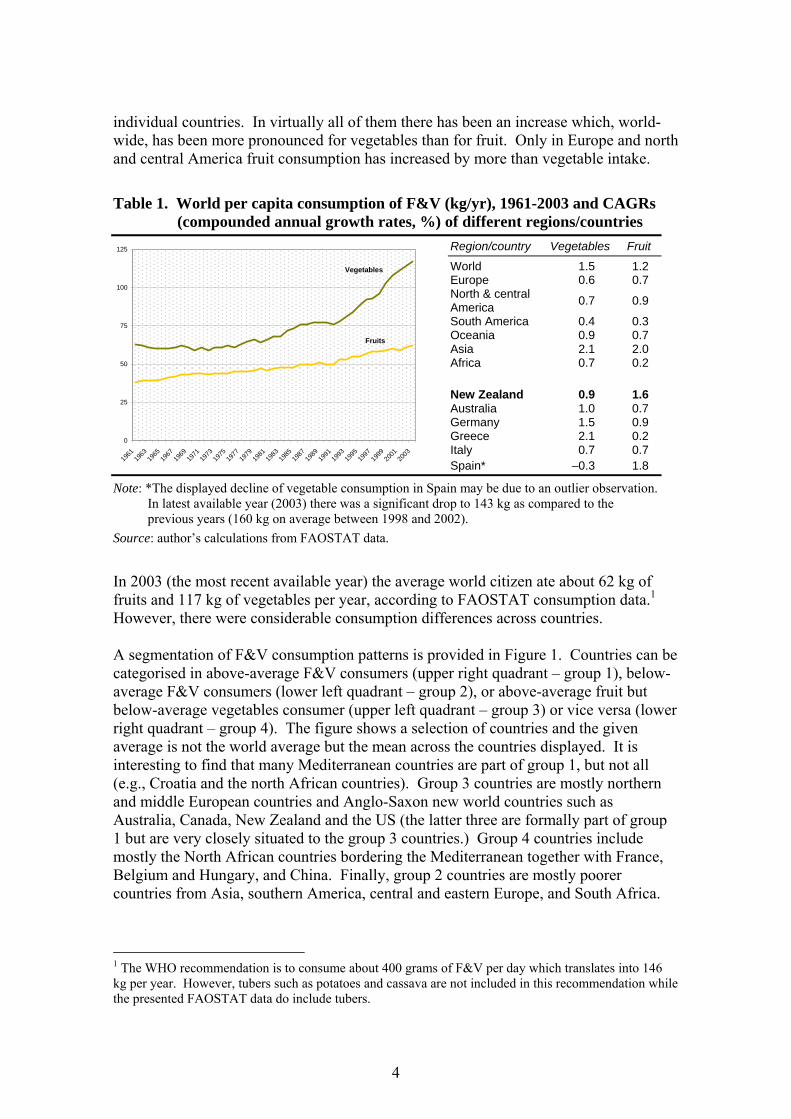
individual countries. In virtually all of them there has been an increase which, world-wide, has been more pronounced for vegetables than for fruit. Only in Europe and north and central America fruit consumption has increased by more than vegetable intake.
Table 1. World per capita consumption of F&V (kg/yr), 1961-2003 and CAGRs (compounded annual growth rates, %) of different regions/countries
Region/country Vegetables Fruit
World 1.5 1.2 Europe 0.6 0.7 North & central America 0.7 0.9
South America 0.4 0.3 Oceania 0.9 0.7 Asia 2.1 2.0 Africa 0.7 0.2 New Zealand 0.9 1.6 Australia 1.0 0.7 Germany 1.5 0.9 Greece 2.1 0.2 Italy 0.7 0.7
0
25
50
75
100
125
1961
1963
1965
1967
1969
1971
1973
1975
1977
1979
1981
1983
1985
1987
1989
1991
1993
1995
1997
1999
2001
2003
Fruits
Vegetables
Spain* –0.3 1.8
Note: *The displayed decline of vegetable consumption in Spain may be due to an outlier observation. In latest available year (2003) there was a significant drop to 143 kg as compared to the previous years (160 kg on average between 1998 and 2002).
Source: author’s calculations from FAOSTAT data.
In 2003 (the most recent available year) the average world citizen ate about 62 kg of fruits and 117 kg of vegetables per year, according to FAOSTAT consumption data.1 However, there were considerable consumption differences across countries. A segmentation of F&V consumption patterns is provided in XXFigure 1XX. Countries can be categorised in above-average F&V consumers (upper right quadrant – group 1), below-average F&V consumers (lower left quadrant – group 2), or above-average fruit but below-average vegetables consumer (upper left quadrant – group 3) or vice versa (lower right quadrant – group 4). The figure shows a selection of countries and the given average is not the world average but the mean across the countries displayed. It is interesting to find that many Mediterranean countries are part of group 1, but not all (e.g., Croatia and the north African countries). Group 3 countries are mostly northern and middle European countries and Anglo-Saxon new world countries such as Australia, Canada, New Zealand and the US (the latter three are formally part of group 1 but are very closely situated to the group 3 countries.) Group 4 countries include mostly the North African countries bordering the Mediterranean together with France, Belgium and Hungary, and China. Finally, group 2 countries are mostly poorer countries from Asia, southern America, central and eastern Europe, and South Africa.
PP
1PP The WHO recommendation is to consume about 400 grams of F&V per day which translates into 146
kg per year. However, tubers such as potatoes and cassava are not included in this recommendation while the presented FAOSTAT data do include tubers.

5
Figure 1. Per capita consumption of F&V (kg/yr), 2003, in different countries
Source: author’s draft, compiled from FAOSTAT data. Heterogeneity in F&V consumption does not only exist across countries but also within them. Previous research has identified different types of F&V consumers in various countries. Here only the situations in the US (Lindsay et al. 2009), France (Bertrail and Caillavet, 2008), Australia (Nijmeijer et al., 2004), Croatia (Kovačić et al., 2002), Japan (Shim et al., 2001), the UK (van der Pol and Ryan, 1996) and Germany (Hörman and Lips, 1996) are reviewed. Given the different methods used to segment F&V consumers, the studies’ results are hardly comparable. Nevertheless, they provide valuable insights into the ‘mechanics’ of F&V consumption. The US study (Lindsay et al. 2009) investigates F&V consumption as a function of consumption intention, consumption attitudes and other variables which are postulated by the ‘theory of planned behaviour’. The study finds that causal relationships between these variables partly differ significantly across different population segments. However, the study also finds that there is no significant link between attitudes and consumption intentions in half of the identified consumer segments. From this the authors conclude (p. 15) to “moving away from trying to change beliefs about a product or a desired action [i.e., attitudes] and moving towards overcoming barriers to action by making products [F&V]… more available through new distribution channels and decreasing participation costs (e.g., time, effort, money).” In other words, to improve the supply situation rather than favouring communication campaigns. In their study of French F&V consumers, Bertrail and Caillavet (2008) show that neither income nor education disparities fully explain existing purchasing patterns. Nor do price differences entirely determine consumption choices in all segments. The study clearly proves the existing diversity in F&V demand and is mostly concerned with identifying possible (economic) policy options to increase F&V intake in the segments characterised with the lowest consumption levels. However, the study also highlights the importance of “home production” (i.e., growing some F&V at home either using an
Greece
Turkey
Israel
China
Italy
Portugal
TunisiaEgypt
Netherlands
Spain
Denmark
Malta
AustriaSlovenia
UK
Switzerland
Belgium
Croatia
NorwayMexico
Finland
Iceland
Chile
Algeria
Thailand
India
IndonesiaJapan
NZCanada
France
USA
Ireland
GermanyAustralia
Sweden
HungaryCzech Republic
Argentina
PolandRussia
Brazil
South Africa
0
20
40
60
80
100
120
140
160
180
200
0 50 100 150 200 250 300
Vegetables
Frui
ts
∅ 113
∅ 97

6
orchard or a “kitchen garden”) for more than half (55%) of consumers. This home production fulfils different functions for low-income segments (where it complements F&V purchases for money reasons) and high-income groups (where it substitutes them due to freshness motivations). In both cases, however, home production may divert sales from greengrocers to garden centres and nurseries where seeds and seedlings are typically bought. As to Australian consumers, Nijmeijer et al.’s (2004) study in fact does not identify different types of vegetables consumers but shows that there may be different reasons for buying different types of vegetables (salads or vegetables for boiling). The main factor which predicts consumption of all types of vegetables is preparation convenience. The study also argues that determinants for vegetable consumptions are different to those for fruit intake. Fruit consumption patterns in Japan have been analysed by Shim et al. (2001). Their study highlights the special role of aesthetics and food safety in the buying motivations of Japanese consumers. This is related to the unique and important role in Japanese life of buying fresh fruit as a gift item. Consequently, prices and convenience properties have been found as being less important. In Japan, “direct mail order from a grower” is also a common way to purchase fruit. The study highlights that cultural factors such as special norms and traditions can significantly influence purchasing decisions. The importance of national culture is also revealed by Kovačić et al. (2002) when they analyse the role of city markets (similar to farmer markets but merchants do the selling, not farmers) as a sales channel for F&V in Croatia. Visiting a market is a cultural activity that is part of the general lifestyle. These types of markets have disappeared in many parts of the world but are still important, in particular for F&V, in many Mediterranean countries. In Croatia it was estimated that 45% of all fruit and 49% of all vegetables were bought on city markets during the 1990ies. The main reasons why F&V consumers buy on city markets are the wide product range, and the quality and freshness of the products. Customers are not always satisfied with the “value” (quality/price) they get, partly because they usually cannot select the products themselves (the merchant/stall holder does it). Nevertheless, the strong competition between the different F&V merchants on a market guarantees a wide range of products and their high quality and freshness. Dealing with UK consumers, van der Pol and Ryan (1996) find that product quality is rated as the most important purchasing criterion for F&V. Moreover, the study finds that shopping convenience (packed vs unpacked produce) and preparation convenience (whole vs chopped vegetables) does not enhance F&V purchasers’ utility in cases where the shopper looses the opportunity to assess produce quality (packaged fruit or chopped and packaged vegetables cannot be inspected closely). The study reveals that super-markets are preferred to corner shops as a shopping location, mostly for quality reasons. In a study of German F&V consumers (Hörman and Lips, 1996), 47% survey respondents claimed that product quality was best in city/farmer markets, followed by specialised F&V shops (20%). Contrary to the UK, the quality of supermarket F&V was perceived as inferior, and people mostly buy them for reasons of lower prices and
7
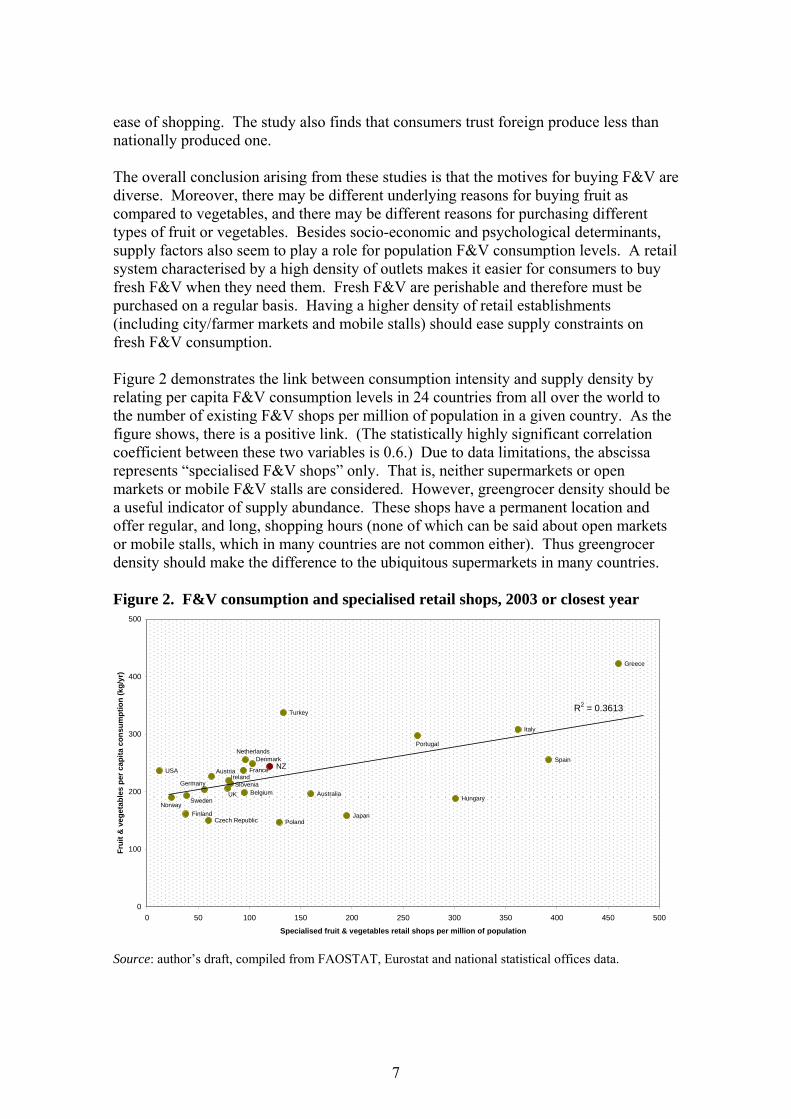
ease of shopping. The study also finds that consumers trust foreign produce less than nationally produced one. The overall conclusion arising from these studies is that the motives for buying F&V are diverse. Moreover, there may be different underlying reasons for buying fruit as compared to vegetables, and there may be different reasons for purchasing different types of fruit or vegetables. Besides socio-economic and psychological determinants, supply factors also seem to play a role for population F&V consumption levels. A retail system characterised by a high density of outlets makes it easier for consumers to buy fresh F&V when they need them. Fresh F&V are perishable and therefore must be purchased on a regular basis. Having a higher density of retail establishments (including city/farmer markets and mobile stalls) should ease supply constraints on fresh F&V consumption. XXFigure 2XX demonstrates the link between consumption intensity and supply density by relating per capita F&V consumption levels in 24 countries from all over the world to the number of existing F&V shops per million of population in a given country. As the figure shows, there is a positive link. (The statistically highly significant correlation coefficient between these two variables is 0.6.) Due to data limitations, the abscissa represents “specialised F&V shops” only. That is, neither supermarkets or open markets or mobile F&V stalls are considered. However, greengrocer density should be a useful indicator of supply abundance. These shops have a permanent location and offer regular, and long, shopping hours (none of which can be said about open markets or mobile stalls, which in many countries are not common either). Thus greengrocer density should make the difference to the ubiquitous supermarkets in many countries. Figure 2. F&V consumption and specialised retail shops, 2003 or closest year
Source: author’s draft, compiled from FAOSTAT, Eurostat and national statistical offices data.
Greece
Turkey
Italy
SpainNZFranceUSA
Belgium AustraliaHungary
Finland JapanCzech Republic Poland
PortugalNetherlands
Denmark
AustriaIreland
SloveniaUK
Germany
SwedenNorway
0
100
200
300
400
500
0 50 100 150 200 250 300 350 400 450 500
Specialised fruit & vegetables retail shops per million of population
Frui
t & v
eget
able
s pe
r cap
ita c
onsu
mpt
ion
(kg/
yr)
R2 = 0.3613

8
The correlation displayed in XXFigure 2XX may not imply causality. In fact, it could be that a high density of specialised F&V retail shops is a function of consumption intensity rather than vice versa. Heavy consumers of F&V may simply value more strongly a better availability, wider range and higher quality of F&V in the market place which in turn may open commercial opportunities to specialised retailers. This interpretation is underlined by XXFigure 3XX which shows that in many countries with high per capita con-sumption of F&V specialised retailers command a higher share of overall F&V sales. Figure 3. Share (%) of sales in specialised F&V retail shops in overall F&V retail
sales (excluding open markets and mobile stalls), 2002 (*1997, **2004)
Source: author’s draft, compiled Eurostat and Statistics New Zealand data. 7B7BGreengrocer industry characteristics The greengrocer industry has been shrinking during the last decade in many countries, but not in all. The percentage change from the earliest to the latest available years is displayed in XXFigure 4XX. As it is shown, the number of specialised F&V retailers has declined strongest in northern and eastern Europe. In central Europe (Belgium, France, Austria, Germany) and in New Zealand the decline has been less pronounced. In Mediterranean Europe (with the exception of Italy) there has even been an increase in enterprises. Overall, however, the situation seems to be one of an industry in crisis.
0 20 40 60
Sweden
Finland
Norway*
Austria
Germany*
France*
New Zealand**
Denmark
UK*
Italy*
Spain
Netherlands*
Hungary
Poland

9
Figure 4. Change (%) in number of enterprises in the specialised F&V retail
(greengrocer) industry, different countries and periods
Source: author’s draft, compiled from Eurostat and Statistics New Zealand data. Missing economic viability would be the main reason why there has been this strong decline in the greengrocer industry in many countries. If an F&V shop does not earn its owner a living it will close. XXTable 2XX provides an overview of the most recently available average financial situation of greengrocers in different countries. Starting with the income situation, it can be seen that income is generated from different sources. The highest income source is turnover generated from the retail sales of F&V that were purchased for this purpose. However, there are other sources of income. In Australia, at least some greengrocers also engage in wholesale sales and this income is listed separately. In New Zealand, in particular, the greengrocer industry includes many growers who run a F&V store at the orchard gate and in which own produce is sold as well as additionally purchase-in products. This results in almost 10% of income (on average across the industry) derived from self-grown produce. Finally, there is a small amount of additional non-operational income, for instance derived from financial investments.
Portugal, 1996-2006
Greece, 2004-2006
Spain, 1999-2006
Germany, 1995-2006
France, 1996-2006
Austria, 1995-2006
NZ, 2000-2008
Belgium, 1999-2006
Italy, 1995-2006
Finland, 1995-2006
Ireland, 1995-2006
UK, 1995-2006
Hungary, 2001-2006
Netherlands, 1995-2006
Denmark, 1995-2006
Poland, 1996-2006
Sweden, 1995-2006
Norway, 1995-2006
-75 -50 -25 0 25 50

10
Table 2. Incomes, expenses and operating profits of specialised F&V retail industries, different countries and years
Australia New Zealand Germany Spain Greece Italy 2005/6, A$ 2007, NZ$ 2005, € 2006, € 2006, € 2006, € Total industry income 3,547.6m 519m 983m 2,412m 703.7m 2,800m
No. of enterprises 3,330 454 3,645 16,207 5,020 18,887 No. of staff (persons employed) 19,166 2,090 16,000 34,158 10,276 31,238
Staff per enterprise 5.8 4.6 4.4 2.1 2.0 1.7 Income per enterprise 1,065,345 1,143,172 269,685 148,837 140,179 148,255
Turnover (retail sales) as % of total income 77.5 90.0 n/a n/a n/a n/a
Income from other goods & services (% of total income)
1.6 9.6 n/a 0.05 0.2 0.2
Income from wholesale sales (% of total income)
19.5 n/a n/a n/a n/a n/a
Other (non-operating) income 1.4 0.4 n/a n/a n/a n/a
Purchases of goods bought for resale (% of operating income)
74.4 68.7 64.3 71.0 82.9 68.8
Wages & salaries (% of operating income) 9.2 9.3 13.3 9.7 3.4 4.0
Other expenses (% of operating income) 12.2 18.6 13.2 7.1 5.7 12.2
Total expenses (% of operating income) 95.8 96.5 90.8 87.8 91.9 85.0
Operating profit before tax (% of operating income) 4.2 3.5 9.2 12.2 8.1 15.0
Operating profit before tax (monetary units) 44,444 39,801 24,721 18,165 11,295 22,280
Source: author’s draft, compiled from Eurostat and national statistical offices data.
Looking at expenses, the biggest cost position is the purchase of goods bought for resale. This cost varies between 64.3% of operating income in Germany to 82.9% in Greece. Expenses for wages and salaries also vary widely between the listed countries, from 3.4% in Greece to 13.3% in Germany. Other expenses (which include rents or mortgage payments) are highest in New Zealand (18.6%), and lowest in Greece (5.7%). Overall, total expenses amount to between 85.0% of operating income in Italy and 96.5% in New Zealand. Consequently, operating profit margins vary between 3.5% of operating income in New Zealand to 15% in Italy. The apparent gross profits (in monetary units) seem to be highest in Australia. Using an average exchange rate of 1.65 A$/€ for the 2005/2006 period, A$44,444 translate into €26,936. However, this is not significantly more than the German figure of €24,721 for 2005. The New Zealand result of NZ$39,801 for 2007 equals €20,948 (using an

11
exchange rate of 1.95 NZ$/€). This lies in between the Italian level (€22,280) and the Spanish one (€18,165), both for 2006. The lowest gross profits per shop, at €11,295, were earned in Greece. This does not surprise because Greece already has one of the highest greengrocer densities in the world (XXFigure 2XX), yet the number of shops is still increasing (XXFigure 4XX). It is also interesting to find that while the Australian greengrocer stores are the largest (on average 5.8 staff), they are not significantly more profitable than German and NZ ones (about 4.5 staff), or the Mediterranean ones (about 2 staff). In fact, Italy seems to have the smallest F&V shops (1.7 staff) but profits are roughly at the same levels than the Australian or German shops. Furthermore, Italian shops appear to be mostly owner-run (only 4% staff costs), as are Greek ones (3.4%). However, Italian greengrocers seem to have a much higher pricing power since their gross margin is 31.2% while the Greek one is only 17.1%. This can probably be explained by the higher F&V shop density in Greece, which results in higher competition and thus reduced pricing power for shop owners. From a con-sumer’s point of view, however, such the Greek situation may be ideal – many shops, and low prices – which may partly contribute to the high per capita F&V consumption rate in Greece. In conclusion, this section has argued that there may be a link between a country’s retail system and its F&V consumption level. The more highly differentiated the supply structure of F&V, the easier it will be to consume them, provided no other constraints such as low incomes or high prices exist. Nonetheless, in practice it may not be easy to restructure an existing retail system. Such systems have evolved over decades and there may be many reasons behind their existing structures which have not been considered here. For instance, the high greengrocer density in Mediterranean countries may be related to the fact that these countries are also strong producers of F&V. As a result, setting up an F&V shop may be easy because procuring fresh produce is. In other words, barriers to entry to the greengrocer industry are low. This may be different in an import-dependent country where marketing channels are more structured and controlled. Moreover, in order to increase the effective F&V supply density in a country, a crucial aspect of F&V shops is that they are located in (or very close to) housing areas. They also must have long business hours. If they are located in distant shopping malls, only accessible by car and at certain times, there is no big difference to supermarkets. Looking forward, the general business climate – the mega trends – for greengrocers should be positive. Per capita consumption has been steadily growing during the last decades, and even more importantly, there is still strong, and potentially increasing, public interest in increased F&V consumption. At the same time, income and price constraints have eased as consumers have become more affluent all over the world. In addition, consumers probably also have lost home cooking skills and interests, and have become more convenience-oriented. Thus there may have developed demand for pre-prepared meal solutions (in contrast to the existing ‘commodity offerings’), an issue which is particularly important for vegetables, many of which are usually not eaten raw. Hence, there is a need for the greengrocer industry to adapt to changing market conditions and to make use of emerged but so far untapped opportunities.

12
3B3BReconfiguring the greengrocer value chain This section describes opportunities for innovation in F&V retailing. The focus is on greengrocer shops. While in many countries most F&V are sold in supermarkets, the business approach of chain retailers is much different from the one of small, independent and specialised stores. Supermarkets’ procurement practices have changed significantly during the last decades. Many chain retailers have adopted modern supply chain management techniques and tools (e.g., the use of cold-storage systems, third-party logistics provid-ers, efficient consumer response, etc.; Murray, 2007; Epperson and Estes, 1999). In addition, many supermarket chains do not procure their produce from wholesalers anymore (or at least not fully) but have instead engaged in direct supply contracts with grower-shippers (Cook, 2008). Only imported produce may be sourced from wholesalers-importers, but that is in the case a supermarket chain’s purchasing department does not import it itself. XXFigure 5XX illustrates this situation with a thick line from shipper/packer to chain retailers and a thin one from wholesale & import. Figure 5. The F&V industry supply chain
Source: author’s draft The F&V industry supply chain has also changed in other ways during the last decades. While its depiction in XXFigure 5XX is schematic and generic, and in reality may differ from country to country, it contains the fundamental supply stages: grower-shippers –> distribution –> consumers. Input suppliers and F&V processors are also depicted but these supply chain participants are of minor interest here. Focus is given to the retail stage which in many countries mainly consists of supermarkets and greengrocers. However, as discussed above, in some countries corner shops (“convenience stores”) play a role in F&V retailing (e.g., UK, New Zealand), while in others (e.g.,
Retail
Input supplier Grower Shipper/packer
postharvest handling*
*sorting, packaging, treatment, quality assessment
Processing
Wholesale & import
Food service/catering**
Consumer**restaurants, canteens,hospitals, festivals/events
Open market,mobile stalls
Chain retailer/supermarket
SpecialisedF&V retailer/ greengrocer
Cornershop

13
Mediterranean ones) open markets (farmer/city/wet markets) and/or mobiles stalls (e.g., in Germany) have some significance. What has become increasingly important during the last years is the food service sector, which procures most of its F&V from traditional wholesalers-importers. For instance, in the US it has been argued that nowadays almost 50% of fresh produce is sold through the food service channels (Cook, 2008; Thornsbury et al., 2006). Moreover, there is evidence that the industry’s supply chain has moved away form its historic, decentralised, fragmented structure to an organisational format that is more highly integrated through direct ownership, joint partnerships, strategic alliances, and/or various other formal and informal vertical coordination arrangements among growers, processors and distributors (Maruyama and Hirogaki, 2007; Lentz, 2004; Epperson and Estes, 1999). Most greengrocer stores still operate on a traditional business model. However, there could be potential to transform the industry’s current commodity-based value chain from ‘distributing fresh produce’ to the ‘catering of meal solutions and health contributions’ for the 21st-century food consumer. Other retail industries have experienced systemic change during the last decades. For instance, in many countries during the last 30 years the baking industry went through a significant transformation from village bakers to in-mall sales outlets that now do most of the baking, café bakeries, etc. Similarity, during the last decade or so, petrol stations have turned into mini-supermarkets. However, little has changed in the way F&V are retailed and yet there greengrocers could offer value-added F&V offerings such as fresh juices, fruit salads, ready-to-use vegetable mixes and pre-prepared vegetable dishes, and nutrition-related health products and services, in addition to their fresh and unprocessed produce. It has been argued that a pharmacy can be more than a place to buy drugs. It could be a comprehensive source of health information (Norman and Ramírez, 2000). The same may apply to greengrocers – they could cater to the health and convenience needs and wants of modern consumers. In XXFigure 5XX greengrocers are displayed next to the food service sector. There is a reason for this. The concept of the value chain was developed by Porter (1985, 1998). A value chain analysis identifies the different activities an organisation performs, and links them to its competitive position. It is a quantitative analysis tool aiming at an evaluation of which activities add value, and which do not. Behind the concept is the insight that an organisation is more than a random collection of machinery, equipment, people and money. Only if these things are arranged into a workable system with interlinked activities it will become possible to produce something for which customers are willing to pay. Porter argued that the ability to perform particular activities and to manage the linkages between them is a source of competitive advantage. The basic value chain model distinguishes between primary activities and support activities. Primary activities are directly concerned with the creation or delivery of a product or service. (In a value chain chart they are usually depicted in a vertical way.) The primary activities are linked to support activities (which give rise to ‘overhead’ cost) that help to improve their effectiveness or efficiency. (Support activities are usually depicted in a horizontal way.) If a bundle of activities (the ‘value chain’) is managed well, an organisation will be able to sell its products/services at a profit

14
(‘margin’). Hence, value is created that is higher than the sum of the costs of all activities in the value chain. The value chain concept is a basic, even simplistic business model. It has been criticised widely. For instance, Norman and Ramírez (2000) argue that successful companies do not just add value but they create it. Nevertheless, the value chain has become a generally accepted term and the concept – or extensions of it – are today used widely in management theory and practice (in particular by economic/industrial development organisations – see, e.g., FIAS, 2007; Humphrey and Memedovic, 2006). XXFigure 6XX depicts the value chain of the traditional greengrocer store. The depiction is qualitative rather than based on empirical estimates. Nevertheless, from the discussions above it appears that much of the traditional activities of typical greengrocer stores are centred on produce procurement, display and storage (depicted in green). Value is created by procuring produce at the lowest possible price and selling it at the highest possible one. Given that the F&V supply chain is generally highly competitive, traditional greengrocers are typically price takers, i.e., the market sets maximum sales prices (Spencer, 2004). If a greengrocer is good at produce storage and handling (e.g., by using effectively potentially existing cool storage facilities, managing the detrimental effects of light and/or moisture on fresh produce), s/he may be able to increase shelf life and to reduce produce wastage. In addition, by managing effectively promotions and sales prices (primary activity depicted in red) of produce that needs to be sold rapidly, greengrocers can increase revenues while reducing wastage, thus creating value and gaining competitive advantage vis-à-vis their peers. Finally, as in every business, there are general administration activities, such as human resource management, bookkeeping, store facility maintenance, etc. In a typical greengrocer store, often owner-run, these tasks may, however, be minor and can be summarised into one single support activity called ‘store administration’ (depicted in yellow). Figure 6. The traditional greengrocer value chain
Source: author’s draft
Store administration
Prod
uce
proc
urem
ent
Prod
uce
stor
age
Prod
uce
disp
lay
Sale
s, p
rom
otio
n an
d pr
ice
man
agem
ent
Marg
in
Margin
Store administration
Prod
uce
proc
urem
ent
Prod
uce
stor
age
Prod
uce
disp
lay
Sale
s, p
rom
otio
n an
d pr
ice
man
agem
ent
Marg
in
Margin

15
A reconfigured value chain of the future greengrocer store is depicted in XXFigure 7XX. It assumes that some modern management approaches and techniques are implemented in order to support a strategic re-orientation from ‘distributing fresh produce’ to the ‘catering of meal solutions and health contributions’ for the 21st-century food consumer. However, it should be noted that this value chain configuration has been devised for the community-based store. That is, the greengrocer that is located in a densely populated urban or suburban living area inhabited by a typical mix of singles, families and elderly people from a wide range of incomes and educational backgrounds. The (semi-)rural greengrocer, located near a country road and attached to an orchard is a different type of store and is not considered here, although some of the suggestions made below may also be used in this setting. In short, a modern neighbourhood-based greengrocer would offer value-added, processed F&V products, spends time on processing activities rather than on produce sourcing and storage, adds complementary products and services related to healthy eating and living, and tries to better understand and to respond efficiently to its local customer wants and needs. The modern neighbourhood-based greengrocer store adds and creates value by managing business partnerships – with suppliers, third-party logistics providers, processing technology providers and consumers – rather than adding a small margin from commodity distribution activities. As a result, the modern neighbourhood-based greengrocer store could achieve significantly higher profits. Figure 7. The reconfigured greengrocer value chain
Source: author’s draft Value-adding is a must in highly competitive food industries. However, it has also become a “much-misused term and has become jargonised in recent years” (Spencer, 2004, p. 128). Three different forms of value-adding can be distinguished (Spencer, 2004):
Store administration
Partnership management
Inbo
und
logi
stic
s
Prod
uce
stor
age
&
disp
lay
In-s
tore
pro
cess
ing
Man
agem
ent
of c
usto
mer
s,
mar
ketin
g &
sa
les
Marg
in
Margin
Store administration
Partnership management
Inbo
und
logi
stic
s
Prod
uce
stor
age
&
disp
lay
In-s
tore
pro
cess
ing
Man
agem
ent
of c
usto
mer
s,
mar
ketin
g &
sa
les
Marg
in
Margin

16
(a) strategies to substantially differentiate products for sale into specific or targeted market segments (e.g., quality or size grading of fresh produce, and selling the individual categories at different prices to different customers);
(b) strategies of further process commodities to a form which is closer to the final consumer product (e.g., cutting, mixing and packaging of lettuce to fresh-cut salad mixes rather than selling unprocessed and unpackaged lettuces);
(c) strategies to enhance the recovery and return from processing the whole com-modity or its functional components, through processing lower grade, waste or by-products and managing the overall consumption of a raw material by conver-ting as short shelf-life product to storable form (e.g., freezing or drying of F&V).
The basic aim of these forms of value-adding is to create a substantial benefit to the next user or end user of a product – saving time and/or cost, or providing some sort of addi-tional benefit from the product such as health advantage, taste, versatility or storage life. Innovation – the development and subsequent widespread use of new or improved products, processes and organisational systems – and value creation often go hand in hand (Trienekens et al., 2008). PFPF
2FPFP If an innovation is deemed useful it can be sold at a
profit and thus value is created. Process innovation can be linked to value-adding strategy (a): a product is not physically modified but it is marketed in a different way. Value-adding strategy (b) refers to product innovations: a different product is created by physical manipulation. Value-adding strategy (c), in a wider sense, may be linked to systemic innovation. It is about doing things in a different way, resulting in modified products but also requiring that an entire organisational system (e.g., an industry supply chain) changes more profoundly. The invention of deep-frozen food products and the subsequent need for building a new cold-chain infrastructure may be a good example. Overall, however, it should be kept in mind that borders between the different types of innovation/value-adding are fluent (and academic) and that in practice a strict allocation into one category or another may not always be easy and universally accepted. 8B8BOpportunities for product innovations Modern neighbourhood-based greengrocer stores could produce and sell more value-added offerings such as freshly pressed fruit juices, smoothies, fruit salads, fruit-based desserts and ice-creams, fresh-cut and ready-to-use salads and vegetable mixes, pre-prepared vegetable dishes, and others. In supermarkets, many of these products are already available in the F&V section. In fact, the fresh-cut industry has been growing steadily and significantly during the last decades (for an overview see the presentations from FRESHCONEX (2009)). However, typically these products are produced and delivered by larger food processors, are fully packaged and highly branded. PP
2PP As Trienekens et al. (2008) state, “the innovation field is characterised by a multi-formity of definitions,
of designs and units of analysis” (p. 108). In fact, the authors don’t use the term “system innovation” but refer to “organisational innovations” in addition to product, process and “marketing” innovations. However, marketing can itself be defined as a process. Therefore – for the sake of simplicity – in this paper only the terms product, process and system innovations are used.
17
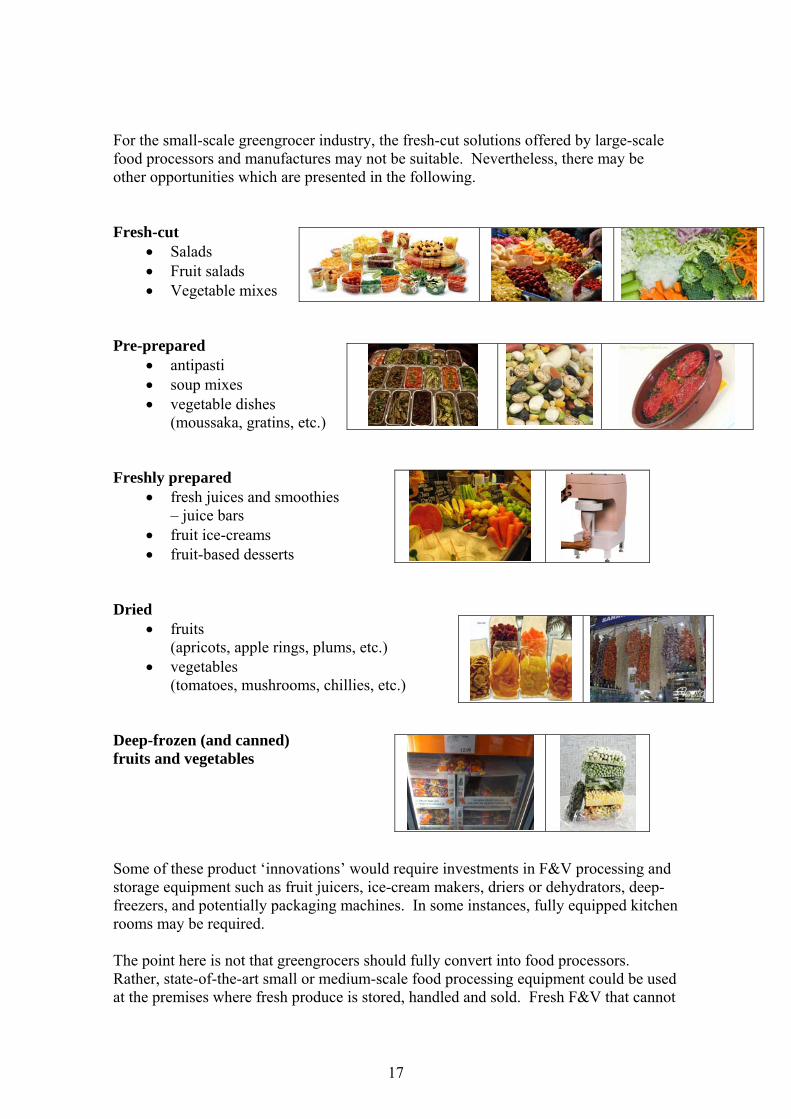
For the small-scale greengrocer industry, the fresh-cut solutions offered by large-scale food processors and manufactures may not be suitable. Nevertheless, there may be other opportunities which are presented in the following. Fresh-cut
• Salads • Fruit salads • Vegetable mixes
Pre-prepared
• antipasti • soup mixes • vegetable dishes
(moussaka, gratins, etc.) Freshly prepared
• fresh juices and smoothies – juice bars
• fruit ice-creams • fruit-based desserts
Dried
• fruits (apricots, apple rings, plums, etc.)
• vegetables (tomatoes, mushrooms, chillies, etc.)
Deep-frozen (and canned) fruits and vegetables Some of these product ‘innovations’ would require investments in F&V processing and storage equipment such as fruit juicers, ice-cream makers, driers or dehydrators, deep-freezers, and potentially packaging machines. In some instances, fully equipped kitchen rooms may be required. The point here is not that greengrocers should fully convert into food processors. Rather, state-of-the-art small or medium-scale food processing equipment could be used at the premises where fresh produce is stored, handled and sold. Fresh F&V that cannot

18
be sold in time could be processed immediately, thus reducing wastage. Freshly, and competently, prepared F&V preparations could command considerably higher prices than the underlying raw commodities. Of course, food safety regulations, staff qualification and time requirements need to be considered and feasible solutions have to be found to make an F&V retailer competitively engaging in (part-) food processing and food service activities. But it should be possible. One way to make this happen would be to engage in smart business partnerships. For example, a F&V wholesaler could do much of the required processing on a larger scale and deliver to affiliated greengrocer customers. In many countries, there are juice bar franchisers and ice-cream chains that may be interested in licensing their equipment and preparation expertise, and potentially even their brands. Overall, however, this goes already beyond mere product innovations and results in modified or new business processes or even organisational systems. 9B9BOpportunities for process innovations Category management is used by retailers to generate shopper enthusiasm for certain products. While there are different definitions of the concept, most generally it is a marketing strategy in which a full line of products (instead of the individual products or brands) are managed as a strategic business unit. In greengrocer stores, category management could be improved first by trying to implement a different marketing approach for fruit than for vegetables. As discussed above, both categories are consumed in quite a different way by many consumers. An even finer approach to category management would be to differentiate marketing efforts between different types of fruit (e.g., citrus fruit many need to be dealt with differently as pip fruit) and vegetables (lettuces differently to tubers, etc.). Moreover, certain fruits and vegetables could be especially promoted due to their health proprieties (e.g., pomegranates, avocados, broccoli, celery). In addition, health information in form of books, booklets or leaflets could be sold. Offering some fresh preparations in the shop such as juices, or ready-to-eat snacks may result in impulse purchases. A category may be created named ‘fruit-based health’ and could even include complementary products which are usually sold (without prescription) in pharmacies or drug stores. Finally, one of the studies discussed above has argued that home production of fruit and vegetables may play a significant role for some income groups, at least in some countries. A specific new category for greengrocers could be ‘grow your own’. Seeds and seedlings could be sold together with some necessary equipment and books, DVDs, etc. on how to produce own one’s herbs, vegetables, berries etc. A prerequisite of such a modified greengrocer concept would be to gain a thorough understanding of the local market and in particular of customer needs and wants. This requires systematic demand management.

19
Demand management and efficient consumer response (ECR). ECR is a form of logistics management through which supermarkets are incorporating aspects of quick-response inventory planning, electronic data interchange, and logistics planning. While it is a management technique which was primarily developed for supermarkets, some principles of it are also relevant for small independent retailers such as greengrocers. In essence, ECR requires collaborative business partnerships in order to better fulfil customer demand. One problem for small, independent retailers is often that no systematic assessment of customer needs and wants are conducted due to a lack of time and technical skills. However, specific demand studies for individual retail stores could easily and very cost-effectively be conducted by university students (e.g., of marketing) as part of their study projects. Using established methods such as conjoint analysis (Gustafsson et al., 2007) could help shop owners to better understand what their customers want and how they could optimise their product assortments, pricing, promotions, etc. This would result in a much more systematic marketing process. Improving on staff training. If some of the above suggestions are implemented into greengrocer stores it would very likely require, at least partly, higher qualified staff. If preparations of F&V are to be produced, food preparation skills may be required, as well as some qualification in food safety practices. If some new machinery and/or equipment are to be used, appropriate operator training needs to take place. If health information is to be sold together with fresh or pre-prepared produce, employees need to be briefed about it. All this would require a different management approach as compared to the traditional low-skill produce handling. However, more highly skilled staff would help to increase customer loyalty by building trust in a store, an aspect which is increasingly important in food and health industries. 10B10BOpportunities for system innovations Changing the greengrocer business model in the above described way would have implications for the entire F&V supply chain. If greengrocers’ main tasks evolve from ‘distributing fresh produce’ to the ‘catering of meal solutions and health contributions’ for the 21st-century food consumer they need to reorganise their current way of conducting business. As mentioned above, this would probably mean that a significant amount of time will be spent on managing business partnerships. At the same time, there will be less time for traditional tasks such as the frequent personal procurement visits of wholesale markets, mostly for reasons of physical inspections to verify produce quality. However, this activity could easily be outsourced. Use of third-party logistics providers (3PLs). In many industries, non-core tasks are being transferred to more competent business partners (Langley, 2008). The delivery of produce instead of individual pick-up could also be a more efficient way of distribution from an industry supply chain point of view. One large truck doing one delivery tour to several greengrocer stores is certainly more time and fuel efficient than many greengrocers going individually. Thus, ordering F&V via phone, fax or online and getting delivered may in the end not be much more expensive if fuel and time savings are properly accounted for.

20
Implementing reverse logistics systems. In a modernised supply chain architecture where greengrocers get regular deliveries by trucks from a wholesaler, produce could also be sent ‘back to the source’ without much extra cost. Assume that a wholesaler has some processing activities in place where fresh produce, which is not attractive enough anymore for selling fresh but still perfectly fit for human consumption in particular when processed or prepared in one way or another, could be sent back to. In other words, instead of being sold at a discount, produce is shipped back, processed and then sold as a value-added product. Clearly this would be attractive for both greengrocer and wholesaler, but it would require the introduction of an effective and efficient reverse logistics system. Yet, using the just described 3PLs, such a supply system change would not be impossible. 4B4BConclusions The greengrocer store of the future would be much different to the one of today. Internally, it would be more technology-intensive, using state-of-the-art equipment and machinery for F&V processing and storage. Skill levels of both staff and management would be considerably higher than compared to today. Staff would need to be able to handle processing, packaging and storage technology while being competent in advising customers on consumption and health issues. Management would be able to competently handle business partnerships with 3PLs, processing technology providers, and market research providers in order to better understand customer needs and wants. Externally, the greengrocer store would be more intensively integrated in the industry supply chain. Fresh, and perhaps processed, produce would be delivered rather than personally picked up, and not-perfectly-fresh-anymore one potentially sent back to wholesalers for further processing. The greengrocer industry’s transformation process would, however, be gradual. Maybe prototype stores will be developed from which the industry can learn. Business partnerships will initially develop but also will break up again. Nevertheless, if the greengrocer industry does not do anything it may just disappear. The competition from chain retailers is strong and as the figures above have shown the number of greengrocer stores is in fact rapidly declining in many countries. As in so many other industries, ‘grow or go’ is a reality. This paper has highlighted some opportunities for innovation in F&V retailing. Society may need, and thus have an interest in, a healthy and competitive greengrocer industry. Given this situation, perhaps public funds could be acquired for setting up pilot schemes and/or prototype stores. But action should happen soon. The best way to build the future is to start now.

21
5B5BReferences Bertail, P. and Caillavet, F. (2008): Fruit and Vegetable Consumption Patterns: A
Segmentation Approach. American Journal of Agricultural Economics, 90 (3), 827-842.
Cook, R. (2008): Supermarket Challenges and Opportunities for Fresh Fruit and Vegetable Producers and Shippers: Lessons from the US Experience. In Selvan, K.: Supply Chain Management in Food Industry. Icfai Books, Hyderabad, India.
Della, L., DeJoy, D. and Lance, C. (2009): Explaining Fruit and Vegetable Intake Using a Consumer Marketing Tool. Health Education & Behavior, XX (X), xx-xx. DOI: 10.117/1090198108322820
Dresler-Hawke, E. (2007): Take five: the cost of meeting the fruit and vegetable recommendations in New Zealand. Contributed paper. Australian and New Zealand Marketing Academy Conference. Dunedin, New Zealand, December 3-5.
Economist, The (2008): Supply-chain management: Shrink rapped. May 17, p. 78. Epperson, J. and Estes, E. (1999): Fruit and Vegetable Supply-Chain Management,
Innovations, and Competiveness: Cooperative Regional Research Project S-222. Journal of Food Distribution Research, 30 (3), 39-43.
FIAS (The Foreign Investment Advisory Service, a joint facility of the International Finance Corporation, the Multilateral Investment Guarantee Agency, and the World Bank) (2007): Moving Toward Competitiveness: A Value Chain Approach. The World Bank: Washington, DC.
FRESHCONEX (2009): Congress presentations. HHTUTUhttp://www1.messe-berlin.de/vip8_1/website/Internet/Internet/www.freshconex/englisch/DownloadCenter/index.jspUUTTHH
Glanz, K. and Yaroch, A. (2004): Strategies for increasing fruit and vegetable intake in grocery stores and communities: policy, pricing, and environmental change. Preventive Medicine, Vol. 39, pp. 75-80.
Gustafsson, A., Herrmann, A. and Huber, F. (2007): Conjoint Analysis as an Instrument of Market Research Practice. In: Gustafsson, A., Herrmann, A. and Huber, F. (eds.): Conjoint Measurement: Methods and Applications, 4th Ed. Springer: Berlin, 3-30.
Hörmann, D. and Lips, M. (1996): Consumer’s attitudes and behavior when buying fruit and vegetables from various production methods. ISHS Acta Horticulturae. Vol. 429: Proceedings of the XIII International Symposium on Horticultural Economics, pp. 431-438.
Hurst, B. (2008): Small Stores to Encourage Fruit and Veg Consumption. RetailWire, March 12. HHTUTUwww.retailwire.com/Discussions/Sngl_Discussion.cfm/13408UUTT
Humphrey, J. and Memedovic, O. (2006): Global Value Chains in the Agrifood Sector. United Nations Industrial Development Organisation, Vienna, Austria. HHTUTUhttp://www.unido.org/fileadmin/import/60026_01_global_value_chains_agrifood_sector.pdfUUTT
Kitchen, C. (1949): Fresh Fruit and Vegetable Distribution. The Journal of Marketing, Vol. 14, No. 2, pp. 325-329.
Kovačić, D., Radman, M. and Haas, R. (2002): Segmentation of city market customers in Croatia – towards a marketing strategy for fruit and vegetable markets. Die Bodenkultur, 53 (4), 2007-216.
Langley, C. (2008): The State of Logistics Outsourcing – Third-Party Logistics. Results and findings of the 13th annual study. Capgemini, Oracle, DHL. HHTUTUhttp://3plstudy.comUUTTHH

22
Lentz, W. (2004): Changing Market Channels for Fresh Fruits and Vegetables and Implications for the Structure of the Farm Sector. ISHS Acta Horticulturae. Vol. 655: XV International Symposium on Horticultural Economics and Management, Berlin, Germany, pp. 63-71. HHTUTUhttp://www.actahort.org/books/655/655_35.htmUUTT
Lundqvist J., de Fraiture, C. and Molden, D. (2008): Saving Water: From Field to Fork – Curbing Losses and Wastage in the Food Chain. SIWI Policy Brief.
Maruyama, M. and Hirogaki, M. (2007): The Evolution of Fresh Produce Supply Chains: From Spot Markets to Contracts. International Review of Retail, Distribution and Consumer Research, 17 (4), 359-376.
Murray, S. (2007): Food industry: taking a bite out of waste levels. Special Report on Supply Chain Management. Financial Times, December 10.
Nijmeijer, M., Worsely, A. and Astill, B. (2004): An exploration of the relationships between food lifestyle and vegetable consumption. British Food Journal, 106 (7), 520-533.
Norman, R. and Ramírez, R. (2000): From Value Chain to Value Constellation: Designing Interactive Strategy. Harvard Business Review on Managing the Value Chain. The Harvard business review paperback series: Boston, MA.
Porter, M. (1985, 1998): Competitive Advantage: Creating and Sustaining Superior Performance. The Free Press: New York.
Raloff, J. (2009): The carbon footprints of raising livestock for food. ScienceNews – Magazine of the Society for Science & the Public. February 15. HHTUTUwww.sciencenews.org/view/generic/id/40934/title/UUTTHH
Rowley, C. (2006): Go for 2&5 – Building a national approach to fruit and vegetable consumption. HHTUTUhttp://www.horticulture.com.au/librarymanager/libs/58/Go%20for%202&5%20-%20Summary%20Doc.pdfUUTTHH
Shim, S., Gehrt, K. and Lotz, S. (2001): Export implications for the Japanese fruit market: fruit-specific lifestyle segments. International Journal of Retail & Distribution Management, 29 (6), 298-314.
Spencer, S. (2004): Price Determination in the Australian Food Industry, a Report. Australian Government Department of Agriculture, Fisheries and Forestry, Canberra.
Thornsbury, S., Hinson, R., Martinez, L. and Reaves, D. (2006): Fresh Produce Intermediaries: Impacts of Change in Away-from-Home Food Markets and Trade Practices. Choices, 21 (4), 253-258.
Trienekens, J., van Uffelen, R., Debaire, J. and Omta, O. (2008): Assessment of innovation and performance in the fruit chain. British Food Journal, 110 (1), 98-127.
van der Pol, M. and Ryan, M. (1996): Using conjoint analysis to establish consumer preferences for fruit and vegetables. British Food Journal, 98 (8), 5-12.
van Uffelen R., Splinter G., van Kooten O. and Botden, N. (2004): Waste reduction in the supply chain of arable vegetables. ISHS Acta Horticulturae. Vol. 655: XV International Symposium on Horticultural Economics and Management, Berlin, Germany, pp. 283-289. HHTUTUhttp://www.actahort.org/books/655/655_35.htmUUTT
WHO (2002): World Health Report 2002 – Reducing Risks, Promoting Healthy Life. World Health Organisation, Geneva, Switzerland.
WHO (current): Promoting fruit and vegetable consumption around the world. HHTUTUhttp://www.who.int/dietphysicalactivity/fruit/en/index.htmlUUTT