opportunities for black bear corridors through …
TRANSCRIPT

OPPORTUNITIES FOR BLACK BEAR CORRIDORS THROUGH SOUTHERN GEORGIA
By
EVA E.D. KENNEDY
(Under the Direction of Rosanna G. Rivero)
ABSTRACT
Loss of natural areas due to urban development is occurring at a rapid rate across the
United States. Large predatory species tend to suffer most from the resulting habitat
fragmentation because of their wide-ranging nature, naturally lower population sizes, and
tendency for human-conflict. In an attempt to help save the state’s threatened species, the state of
Florida has planned a wildlife corridor that will extend to the Okefenokee National Wildlife
Refuge in southern Georgia. It is essential that Georgia begin planning a corridor extension
through the state to account for growing wildlife populations and to mitigate human-wildlife
conflicts. Early identification of high-value natural lands and ideal wildlife road crossing
locations will help public and private entities work together to protect Georgia’s native wildlife.
A preliminary identification of southern Georgia wildlife corridors is performed, using the
Linkage Mapper and Circuitscape Geographic Information System (GIS) toolkits.
INDEX WORDS: environmental planning, wildlife corridor, American black bear, Ursus
americanus, Linkage Mapper, Circuitscape, geospatial information
systems (GIS), wildlife crossings

OPPORTUNITIES FOR BLACK BEAR CORRIDORS THROUGH SOUTHERN GEORGIA
By
EVA E.D. KENNEDY
B.A., Emory University, 2009
A Thesis Submitted to the Graduate Faculty of The University of Georgia in Partial Fulfillment
of the Requirements for the Degree
MASTER OF ENVIRONMENTAL PLANNING & DESIGN
ATHENS, GEORGIA
2014

© 2014
Eva E.D. Kennedy
All Rights Reserved

OPPORTUNITIES FOR BLACK BEAR CORRIDORS THROUGH SOUTHERN GEORGIA
By
EVA E.D. KENNEDY
Major Professor: Rosanna G. Rivero
Committee: Jack Crowley
Jeffrey Hepinstall-Cymerman
Jason Lee
Electronic Version Approved:
Maureen Grasso
Dean of the Graduate School
The University of Georgia
May 2014
iv
DEDICATION
This thesis is dedicated to my husband, Justin. Our mutual love of nature heartens my
commitment to the great outdoors. You convince me that I am more capable than I give myself
credit and remind me to stay in touch with my “inner child.” Without your keys to Warnell, I
never could have finished this project.
To my parents: my interest in Environmental Planning began while lying in our
driveway, orchestrating the daily lives of ants. You instilled my creativity and scientific insight;
you taught me to value my perceptiveness.
To my brother: you taught me patience and, above all, you taught me that small acts of
kindness really do make people’s days. You are the coolest person I know.
And to all of the animals in my life: you have taught me the value of being a quiet
observer.

v
AKNOWLEDGEMENTS
I would like to give endless thanks to my committee members: Rosanna Rivero, Jack
Crowley, Jeff Hepinstall-Cymerman, and Jason Lee. In particular, I would like to thank Jeff and
Jason, who unwittingly became involved in this project and were, nevertheless, whole-heartedly
willing to help.
Special thanks go to Greg Nelms, Mike Chamberlain, and Michael Hooker for sharing
their bear-knowledge and for steering my research in the right direction. Thanks, as well, to
Rachel Strom at the Southern Georgia Regional Commission for her help in finding GIS data for
the project.

vi
TABLE OF CONTENTS
AKNOWLEDGEMENTS ........................................................................................................................................ V
LIST OF TABLES ............................................................................................................................................... VIII
LIST OF FIGURES ................................................................................................................................................. IX
CHAPTER 1 ............................................................................................................................................................... 1
PURPOSE .................................................................................................................................................................................. 1
ROADS AND BLACK BEARS ............................................................................................................................................... 2
URBAN DEVELOPMENT AND BLACK BEARS ................................................................................................................ 5
ROLE OF PLANNING: TOOLS AND OBJECTIVES ......................................................................................................... 10
CONCLUSION ........................................................................................................................................................................ 12
CHAPTER 2 ............................................................................................................................................................ 22
STUDY AREA SELECTION ................................................................................................................................................. 22
BRIEF INTRODUCTION TO GEOGRAPHIC INFORMATION SYSTEMS (GIS) ......................................................... 25
CHARACTERIZATION OF BLACK BEAR HABITAT IN THE STUDY AREA ............................................................ 26
GEOSPATIAL MODEL AND GIS ANALYSES FOR CORRIDOR IDENTIFICATION ................................................. 28
CHAPTER 3 ............................................................................................................................................................ 45
RESISTANCE RASTER ........................................................................................................................................................ 45
PINCHPOINT MAPPER (CIRCUITSCAPE) ....................................................................................................................... 47
SUMMARY ............................................................................................................................................................................. 48
CHAPTER 4 ............................................................................................................................................................ 60
CONCLUSION ........................................................................................................................................................................ 60
LIMITATIONS ........................................................................................................................................................................ 61

vii
FUTURE IMPLICATIONS ..................................................................................................................................................... 64
REFERENCES........................................................................................................................................................ 68

viii
LIST OF TABLES
Table 2.1: Study Area County Population Trends (US Census 2000 & 2010)............................. 22
Table 2.2: NARSAL State of Georgia Land Cover Data (NARSAL, Land cover trends) ........... 23

ix
LIST OF FIGURES
Figure 1.1: Distribution of black bear in Georgia (GA DNR, 2013) ............................................ 14
Figure 1.2a: Side-by-Side Comparison of Land Cover in Georgia, 1974 & 2008 (NARSAL, Land
cover trends) ......................................................................................................................... 15
Figure 1.2b: Side-bySide Comparison of Impervious Surfaces in Georgia, 1991 & 2008
(NARSAL, Land use trends) ................................................................................................ 16
Figure 1.3: Georgia’s Highway System (ESRI, USGS, GDOT) .................................................. 17
Figure 1.4: Examples of Wildlife Over and Under-pass Crossing Structures .............................. 18
Figure 1.5: Island Biogeography (Adapted from MacArthur & Wilson, 1967) ........................... 19
Figure 1.6: Metapopulation Figure representing and describing Harrison’s (1991) Four Types of
Metapopulations (Adapted from Hilty et al., 2006) .............................................................. 20
Figure 1.7: Florida Wildlife Corridor (Florida Wildlife Corridor, 2014) ..................................... 21
Figure 2.1a: Study Area Location: Georgia, USA ........................................................................ 38
Figure 2.1b: Study Area Conservation Lands and Major Cities ................................................... 39
Figure 2.2: Altamaha River Corridor ............................................................................................ 40
Figure 2.3: Land Cover Classifications ........................................................................................ 41
Figure 2.4: Existing Land Cover and Black Bear Habitat in the Study Area ............................... 42
Figure 2.5: GIS Analysis Flow-chart ............................................................................................ 43
Figure 2.6: Altamaha River as a Potential Connection to the Central Bear Population ............... 44
Figure 3.1: Resistance Raster ........................................................................................................ 50
Figure 3.2: Cost-Weighted Distance Output ................................................................................. 51
Figure 3.3: Least-Cost Paths Between Existing Conservation Lands >0.15 sq km ...................... 52
x
Figure 3.4a: Linkage Mapper Output (Truncated at 200k) ........................................................... 53
Figure 3.4b: Linkage Mapper Output (Truncated at 60 k)............................................................ 54
Figure 3.5: Pinchpoint Mapper Output ......................................................................................... 55
Figure 3.6: Pinchpoint Mapper Output with Existing Bridges Along Major Highways .............. 56
Figure 3.7: Potential Corridor 1 .................................................................................................... 57
Figure 3.8: Potential Corridor 2 .................................................................................................... 58
Figure 3.9: Potential Corridor 3 .................................................................................................... 59

1
CHAPTER 1
INTRODUCTION & LITERATURE REVIEW
Purpose
Urban development across the United States is expanding as human population continues
to rise. Projections from the 2010 US Census anticipate a national population growth of
approximately 24% by the year 2040 (WCCPS, 2013). Meanwhile, 50 million acres of forestland
in the United States are expected to disappear by the year 2050 as a result of urbanization (Alig,
Stewart, Wear, Stein, & Nowak, 2010). The state of Georgia is predicted to experience a
population growth and average forest loss even greater than the national average. The population
of Georgia is projected to increase by 40% by the year 2040 (WCCPS, 2013). Approximately
7,754 square kilometers of forestland within the state are expected to disappear by the year 2050
(Nowak & Walton, 2005). These numbers are particularly troubling because Georgia is currently
home to 62 species that are federally listed as threatened or endangered (USFWS, 2013).
Furthermore, US Fish and Wildlife identifies habitat loss as the greatest threat to wildlife in
Georgia (USFWS, 2012). The dramatic land cover changes and increases in impervious surfaces
due to development across the state are illustrated in Figures 1.2a and 1.2b. It is of utmost
importance to put systems in place now that will mitigate future urban impacts on native species.
The American black bear (Ursus americanus, hereafter, ‘black bear’) is the largest
terrestrial species in the southeast. It is estimated that black bears occupy only seven percent of
their historical habitat in the Southeastern Coastal Plain (Wooding, Cox, & Pelton, 1994). The
Louisiana black bear sub-species (U.a. luteolus) is federally listed as threatened, while the

2
Florida sub-species (U.a. floridanus) has been proposed as threatened but currently remains
unlisted. These population reductions are primarily a result of historical and continuing conflict
with humans (Treves & Karanth, 2003; Johnson & Klemens, 2005).
Black bears in Georgia are fragmented into Northern, Central, and Southern populations
(Figure 1.1). Studies are beginning to find that these divided populations have a lack of genetic
exchange between one another (Cook, 2007). This is due to increasing fragmentation and habitat
destruction (Pelton et al., 1999). Black bear populations have remained viable because of their
wide-ranging nature. Unfortunately, the continued expansion and intensity of human-altered
landscapes are proving to be formidable barriers (Pelton et al., 1999; Wooding et al., 1994).
Roads and Black Bears
Today, roadways and urban expansion are primary causes of death and reduced breeding
success for many wildlife species in the United States (US DOT, 2011). The state of Georgia has
$8,642 million in funding towards state route widening, bypasses, and the development of
additional connections to major highways over the next four years (GDOT, 2013). This
expansion is driven by the rapid population increase (more than twice the national average from
2000 to 2010) and increased industry that demands greater road capacity for increased freight
and commuters (GDOT, 2013). Studies have found a strong correlation between road densities
and population declines in large carnivores (Johnson & Klemens, 2005). A national report on
annual wildlife-vehicular collisions estimated that the number of reported collisions is
approximately 300,000 per year (Huijser, 2007). This number most likely reflects only a portion
of overall vehicle-wildlife collisions due to a lack of reporting (Forman et al., 2003; Huijser,
2007).

3
Georgia roadways currently occupy 122,917 linear miles of the state’s 58,056 square
miles of existing land (US DOT, 2010; Figure 1.3). The state’s overall lack of alternative
transportation infrastructure catalyzes residents’ reliance on personal motor vehicles (CDC,
2011). This vehicular dependence results in traffic congestion and drives the Georgia
Department of Transportation (GDOT), politicians, and planners to increase roadway
development.
In the face of this continual rise in demand for new highways, the Federal Highway
Administration (FHWA) is also working extensively to repair and provide funding for existing
infrastructure. According to the 2012 National Bridge Inventory, almost twenty-five percent of
highway bridges in the US are structurally deficient or functionally obsolete (US FHWA, 2012).
The alarming state of vehicular transportation infrastructure, coupled with the increasing demand
for road creation and widening, is indicative of the large amount of road construction to come.
Highway construction and improvement projects are crucial opportunities to incorporate
structures that allow wildlife to safely cross roadways (Figure 1.4). While wildlife crossings can
be a costly endeavor, the structures can offer an immeasurable benefit to wildlife and humans
(US DOT, 2011; US FHWA, 2008). The average property damage due to a vehicular-wildlife
collision is approximately $1,577 (Forman et al., 2003). A long-term study evaluating the
effectiveness of wildlife crossing structures in Banff National Park, Canada, estimated that the
rate of large mammal vehicular mortality on the Trans-Canada Highway (TCH) had reduced by
80% since the initial installations (Clevenger, 2007). The 24 wildlife crossings, interspersed
above and beneath the highway, were incorporated during the highway’s expansion during the
1990s. The structures were originally designed for large terrestrial species and consist of a
variety of over and under-pass structures. During a decade-long study, Clevenger (2007)

4
revealed the crossings’ successful utilization by wildlife, reporting, “10 species of large
mammals [had] used Banff’s 24 crossings more than 84,000 times” (p. 15).
Designs that retrofit existing structures and topography have proven effective and can
minimize implementation costs (US DOT, 2011). Florida has implemented wildlife-crossing
structures along many of their major roadways. In the southwestern region of the state, a network
of 26 crossings utilizes existing overpasses, abandoned underpasses, and enhanced culvert
structures (Land & Lotz, 1996). The structures cross multiple sections of two major highways
adjacent to Fakahatchee Strand State Preserve, Florida Panther National Wildlife Refuge, and
Big Cypress National Preserve. Although the crossings were initially designed for the Florida
panther and Florida black bear, studies have documented a variety of species taking advantage of
them (FFWCC, 2012; Foster & Humphrey, 1995; Land & Lotz, 1996).
Even when utilizing pre-existing crossing opportunities, design must remain an important
consideration. Certain species do exhibit preference towards crossing structure elements such as
size, available cover, and opportunities for feeding (Mata, 2003; Land & Lotz, 1996; US DOT,
2011). An observational study along the Rias Baixas motorway in northwestern Spain found that
larger body size positively correlated with animals’ crossing-structure-width preference (Mata,
2003). This is an important factor to consider when designing crossings for larger species like the
black bear that may refuse smaller structures.
Another significant factor determining crossing structure use is “experience.” This is
particularly apparent with large mammal species. Studies in both Canada and Florida have
shown a significant increase in crossing structure usage by black bear and large ungulates over
time (Land & Lotz, 1996; Clevenger, 2007). This could be due to road avoidance, a pronounced
behavior in large predators (Weaver, Paquet, & Ruggiero, 1996). Road crossings should be

5
implemented as early as possible to encourage adjustment as soon as possible. It is also
important that long-term monitoring or repeated studies are performed to appropriately assess
wildlife usage of installed crossings (US DOT, 2011).
Roadways are an essential landscape component to consider when connecting wildlife
populations. The potential threat that wildlife-vehicle conflicts pose denotes the need to
implement safe crossing mechanisms and alternative routes that avoid highways. Possible
planning devices for the mitigation of highway effects on wildlife movements will be discussed
in the Results and Discussion chapters.
Urban Development and Black Bears
Urban development introduces problems of habitat connectivity and population isolation
at a larger scale than roadways. Urban areas contain high road densities and the surrounding
roadways frequently have additional physical barriers including high traffic concentrations,
guardrails, fencing, and sound walls. These features can completely restrict wildlife crossings
over extended sections of urban roads. Noise and air pollution further deter species from
approaching urban areas. According to the University of Georgia (UGA) Natural Resources
Spatial Analysis Lab’s (NARSAL) analysis of Georgia’s land cover changes, urban development
has increased by twenty percent since 1974 (Land cover trends; Figure 1.2a). With high
population growth projected for the future, it is reasonable to assume that these urban
development trends will continue.
Additionally, the increased presence of humans raises the potential for direct conflict,
particularly for larger wildlife species that can provoke fearful and violent reactions. Studies
have found evidence linking predatory species’ avoidance of urban landscapes to human-caused
deaths (Hilty et al., 2006). In southern Georgia, black bear are hunted as a desired game species
6
or as a pest. Black bear will frequently empty or destroy feeding stations set up to attract other
game species, creating conflict with local hunters (Greg Nelms, personal communication, March
24, 2014).
Black bear have a greater frequency of human conflict than many other North American
predators because of their gregarious nature. As opportunistic foragers, black bears readily adapt
to urban environments that offer food in trashcans, vegetable gardens, and other accessible
locations. Black bears habituated to garbage bins and other artificial food sources are a rising
source of conflict. Termed “nuisance bears,” these individuals will repeatedly return to urban
environments in spite of relocation efforts by the Department of Natural Resources and other
black bear protection programs (FFWCC, 2012; M. Chamberlain, personal communication,
January 28, 2014). One study in Nevada found that black bears captured in urban areas returned
within 18 days despite relocation points more than 75 kilometers away and on the other side of
desert mountain ranges (Beckmann & Lackey, 2004). In a Florida Fish and Wildlife
Conservation Commission (2012) report of black bears euthanized between 2007 and 2011,
“68% were associated with seeking out unsecured garbage or other human-provided food
sources” (p. 12). Nuisance bears are a particular problem in Georgia. In a survey of agencies’
black bear management techniques, Georgia had the second-highest number of complaints-per-
person in the continental United States (Spencer, Beausoleil, & Martorello, 2007). In the same
study, agencies identified garbage or food attraction as the most common source of conflict.
Direct attacks on humans by large predatory species in the US are rare. However, a study
assessed bear attack records in North America from 1900 to 2009 and noted the increasing rate
of attacks appeared to reflect human population increases (Herrero, 2011). A rising frequency of

7
human-black bear interactions may cause an increase in violent conflicts. This indicates the
added importance of minimizing interactions between the large predators and urban residents.
In addition to creating conflict and barriers for wildlife, urban expansion directly destroys
existing habitats. Areas clear-cut for residential complexes or commercial districts remove
important ecosystem components. Young trees, trimmed plantings, and minimal plant diversity
are characteristic of landscaping around new development. Urban plantings, overall, tend to be
exotic or hybrid species that have lower quality or less available food and habitat structure for
wildlife. Urban roadside vegetation tends to be invasive exotic grasses, like Bermudagrass
(Cynodon dactylon), that disrupt nearby native plant communities (Forman et al., 2003).
Adjacent water systems and vegetation are also affected by the increase in rainwater runoff due
to cement, metal, and other impervious surfaces that inhibit absorption within urban areas. The
loss of natural habitat and the insertion of impervious surfaces and unnatural plant communities
result in degradation of the urban site and surrounding areas.
The large scale of habitat division and destruction involved in urban expansion requires
cohesive planning to guide future development and maintain productive natural ecosystems.
“Wildlife corridor” has a range of definitions (Collinge, 2009). For the purpose of this paper, the
term will be defined as swaths of interconnected greenspaces, usually running between two
significant conservation areas or wildlife populations, with the objective of increasing
connectivity for one or more species. Note that the corridor itself may not entirely consist of
valuable habitat. Instead, the objective of the corridor is to encourage successful wildlife
movement between two or more locations.
A variety of corridor models are being recognized as successful techniques in protecting
and restoring wildlife populations (Gilbert, Gonzalez, & Evans-Freke, 1998; Tewksbury et al.,

8
2002). One example, the Osceola-Ocala Corridor in Northern Florida, was designed and
implemented in an effort to reconnect two Florida black bear (U. a. floridanus) populations in
the area. A study examining the once isolated populations found promising breeding potential
between the two following the implementation of the corridor (Dixon, 2006). Black bears have
the potential to greatly benefit from wildlife corridors because they tend to be wide-ranging
species with low overall populations (WHCWG, 2010; Dixon, 2006; FGFFC, 1994). While
many agree that large predators have a high probability of benefitting greatly from wildlife
corridors, not many studies have evaluated the success of established corridors in connecting
dispersed populations (Dixon, 2006).
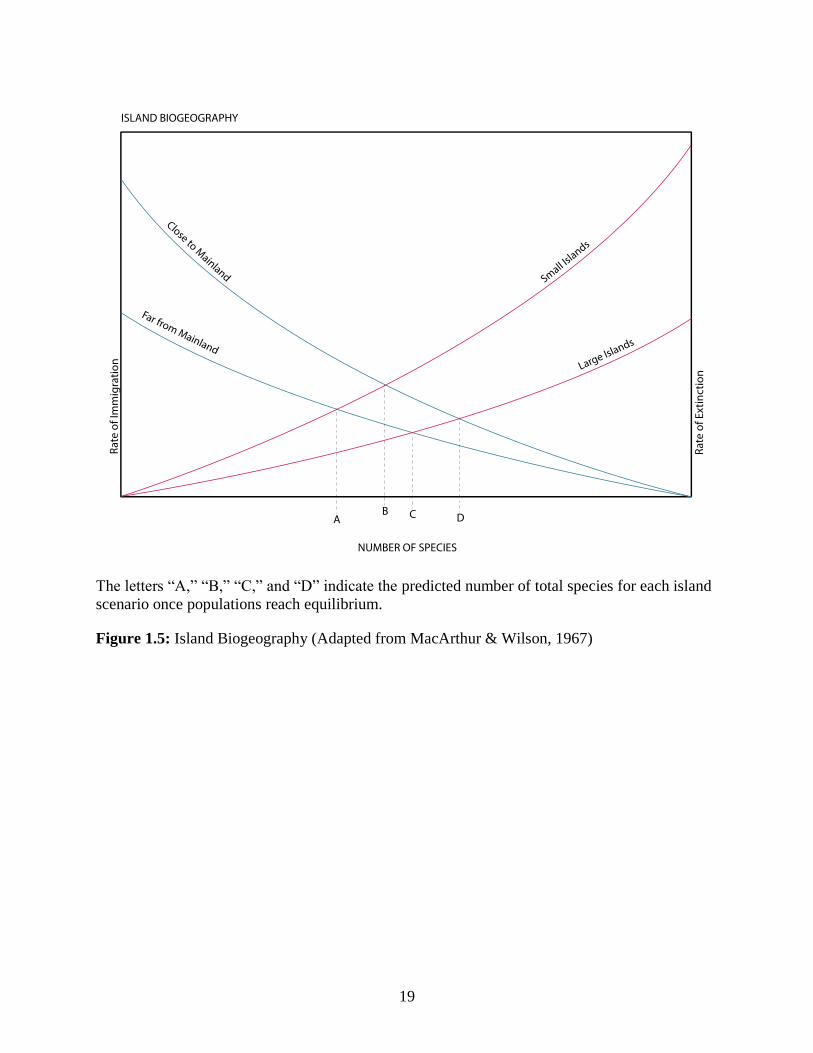
The concept of reconnecting isolated wildlife populations stems from the theory of island
biogeography and from the concept of “metapopulation.” R.A. MacArthur and E.O. Wilson
introduced the idea of “island biogeography” in their 1967 book, The Theory of Island
Biogeography. They proposed that diversity, population size, and extinction rates were
dependent upon an island’s proximity to the mainland, size, and topography (Figure 1.5). For
instance, a large island located close to the mainland with significant variations in topography
should host larger populations of a diversity of species. Proximity facilitates island access to
many different species and encourages colonization. Topographic diversity suggests a variety of
soil types, microclimates, thereby creating a variety of habitats that suit a greater number of
species. Larger island size generally supports larger populations because it minimizes conflict
over food sources, home ranges, and other resources. These higher colonization and lower death
rates result in a reduced extinction rate on larger islands close to the mainland. While MacArthur
and Wilson’s theory applies to islands separated by water, others began to apply their concept of
island biogeography to patches of habitat isolated by surrounding altered landscapes.

9
After The Theory of Island Biogeography was published, criticism arose regarding
MacArthur and Wilson’s neglect to account for species’ adaptability and the inherent bias in
their model. Hilty, Lidicker and Merenlender (2006) point out the theory’s preference towards
species with “good vagility […] those that can fly, swim long distances, or float easily in water
or air currents” (p. 52). Furthermore, island biogeography only addresses locations separated by
water. Landlocked populations looking to emigrate must cross a variety of barriers that can vary
in difficulty. Dense urban development may be nearly impossible to navigate due to roadways,
humans, and the built environment. An agricultural landscape may appear easier but can also
contain barriers such as fencing or pesticides.
Richard Levins (1969) coined the term “metapopulation” to address population dynamics
in a more comprehensive manner. Levins developed a mathematical model that Hastings and
Harrison (1994) defined as representing “a ‘population of populations’ existing in a balance
between extinction and recolonization” (p. 168). Unlike MacArthur and Wilson’s island
biogeography theory, Levin’s metapopulation model addressed the dispersal and extinction
patterns of a single species across its entire population range. Susan Harrison (1991) expanded
upon the metapopulation concept, introducing four main categories of metapopulations and
describing the typical composition, movements, and extinction rates for each (Figure 1.6). It is
clear from these models that population compositions can vary greatly but they all rely on
species’ ability to disperse from one population concentration to another.
Black bear are well adapted to traverse a variety of land cover types. In central and
southern Georgia, the species prefers forested areas, but can be found in open field and pastures
(Cook, 2007). Some of the main predictors of black bear movements are available forest, food,
and protective cover in the form of vegetation, drainage ditches, and other landscape

10
characteristics that reduce their exposure (Cook, 2007; Rudis & Tansey, 1995; Sandell, 1989;
Doan-Crider, 2003). Black bear’s predisposition for large home ranges and occupation of a
variety of habitats makes the species a great candidate for wildlife corridors. The diverse habitat
suitability of black bear allows for the protection of a variety of habitats that can potentially
benefit other species. Furthermore, black bear’s ability to travel great distances suggests they
will take advantage of a corridor network’s full extent.
The state of Florida, along with federal and non-profit support, is working to implement a
wildlife habitat protection plan that spans from the southern Everglades to the Okefenokee
National Wildlife Refuge (ONWR) in southern Georgia (FL DEP, 2014; Figure 1.7). The
Okefenokee Swamp is the most notable network of swamp and marshland in the region. It is
approximately 700 square miles and includes areas of open water, forested swamps, bottomland
bogs, and even upland forests (NARSAL, 2012). The ONWR spans 402,000 acres of the
Okefenokee Swamp (approximately 92%) and is one of the only substantial areas of contiguous
protected native Southern Coastal Plain habitats (USFWS, Okefenokee).
The Florida corridor will allow species, including black bear and Florida panther (Puma
concolor coryi), to pass north and southward with minimal conflict with highways and urban
areas. This project is receiving state, federal, and non-profit funding and established components
are proving successful in encouraging black bear movement (Land & Lotz, 1996; Dixon, 2006).
It is essential that Georgia account for this eventual influx of black bear into the Okefenokee
region by developing a comprehensive plan for habitat connectivity within the state.
Role of Planning: Tools and Objectives
Planners are notoriously involved in the urban and transportation expansion boom that
began with World War II (Johnson & Klemens, 2005). In reflection of the shifting public focus

11
to environmental protection and ecological awareness, many planning professionals have begun
to experiment with mechanisms that enhance and restore the natural world. “Sustainability”
trends, such as alternative transportation, live-work-play communities, and green infrastructure
are urban-based examples of this transitioning culture. Still, the fundamental conflict between
human desire and the essential requirements of certain species and ecosystems remains a
prominent issue.
Johnson and Klemens (2005) eloquently characterize this conundrum:
It is ironic that the resulting [urban] sprawl has at its root so many people’s desire
to move closer to nature and away from the confines of the urban quagmire; in the
process of this movement, however, the very essence of what is natural is being
erased or eroded. (p. 199)
Ecologists, biologists, wildlife managers, and other scientific professionals continue to be at the
forefront of conservation and environmental protection initiatives. Unfortunately, the scientific
process is inherently reactionary; the recognition of deleterious trends can come after it is too
late to change their course.
At the same time, the planners and public officials that guide human land use patterns are
frequently disconnected with the concepts and methods involved in successful habitat and
species protection. This disconnect emphasizes the importance of enhancing communication
between the scientific community and planners. It also indicates the need for accessible models
for identifying and protecting important conservation areas.
Human development is the leading issue for black bear habitat conservation and
population persistence in Georgia (US FWS, 2012). It is essential that the planners and public
officials orchestrating the human activities detrimental to black bear habitat (urban and

12
transportation development) take preemptive measures to protect important natural areas. If
implemented correctly, protected natural spaces can benefit humans by reducing pollution,
creating opportunities for hunting and outdoor recreation, and even increasing adjacent property
values (Hilty et al., 2006). Harmonization of human benefits and black bear ecological
requirements will ensure the persistence of black bears in Georgia.
Corridor plans have used a variety of criteria to identify focal species for their projects.
Some use “keystone species,” species that create or significantly affect certain landscapes (Hilty
et al., 2006). Others have focused on threatened or endangered species because they require
immediate attention. Black bear are valuable as an “umbrella species” for a southern Georgia
corridor. “Umbrella” refers to an individual or group of species whose habitat requirements or
connectivity needs are representative of many other species’ needs (Hilty et al., 2006). By
managing for the needs of the umbrella species, many other species are protected as well. A
number of corridor projects have successfully designed plans using black bear in this way
(WHCWG, 2010; FL DEP, 2014; FFWCC, 2012; Cox et al., 1994).
Conclusion
In order to maintain viable black bear populations and minimize conflict with humans,
habitat connectivity must be addressed at a regional scale. The development and implementation
of a wildlife corridor network through Georgia will promote the species by maintaining access to
the variety of habitats they require and help divert potential nuisance bears away from urban
areas. Black bear will be encouraged to remain within the corridor by the connected suitable
habitats and implementation of road crossing mechanisms. This will be particularly important in
southern Georgia as the black bear population enlarges and disperses due to current growth rates
and increased connectivity with Florida populations. Without a protected network of natural

13
spaces, it is likely that black bear populations will weaken due to human conflict and reduced
genetic diversity, denning sites, escape cover, and food (Moritz, 2002; Dixon et al., 2006). A
wildlife corridor will assist black bear by maintaining access to the variety of habitats they
require and encouraging the dispersal of individuals away from the areas where they were born.
In this way, connectivity within Georgia will help expand the genetic diversity of the currently
fragmented black bear populations.
Wildlife corridors designed for black bear will promote other native wildlife as well. The
variety of forested, wetland, and early succession habitats that black bears prefer support
numerous game and non-game species in southern Georgia. While many are not as wide-ranging
as black bear, the corridors will protect existing habitat and provide linkages at a local scale as
well.

14
Figure 1.1: Distribution of black bear in Georgia (GA DNR, 2013)
Black Bear Range Map
In Georgia, there are three population centers for black bears. These include the North Georgia mountains,
the Ocmulgee River drainage system in central Georgia and the Okefenokee Swamp in the southeastern part
of the state. However, black bears can and do range over larger areas, especially in early spring and late
summer when natural food sources are scarce. Young male bears also roam larger areas in an effort to
establish their own territory.

15
Figure 1.2a: Side-by-Side Comparison of Land Cover in Georgia, 1974 & 2008 (NARSAL, Land cover trends)

16
Figure 1.2b: Side-bySide Comparison of Impervious Surfaces in Georgia, 1991 & 2008 (NARSAL, Land use trends)

17
Figure 1.3: Georgia’s Highway System (ESRI, USGS, GDOT)
Red arrows indicate the continuation of major interstates across state lines

18
Figure 1.4: Examples of Wildlife Over and Under-pass Crossing Structures
19
The letters “A,” “B,” “C,” and “D” indicate the predicted number of total species for each island
scenario once populations reach equilibrium.
Figure 1.5: Island Biogeography (Adapted from MacArthur & Wilson, 1967)

20
Patchy: Local populations are well connected with frequent dispersals between them. If and when populations in a certain patch become extinct, the area is quickly recolonized. This is one of the most common patterns and is most resistant to overall extinction.
Core-satellite: Highly similar to island biogeography theory and is also called “mainland-island.” There is one large, extinction resistant population with a satellite population that is in a separate, smaller habitat patch. Dispersal is mostly unidirectional (main population to satellite location). When extinction of the smaller population does happen, decolonization occurs soon after. This makes the satellite populations relatively resistant to extinction as well.
Classic Levins: A network of separated populations exists within a patchwork of habitats with dispersal, immigration, and extinction occurring within each one. Survival of the species with this population arrangement depends on the number of patches and the level of connectivity between them.
Nonequilibrium: The arrangement of the populations is in patches similar to those in Classic Levins. However, the populations have little to no dispersal between one another. Also, there is no larger, secure population to recolonize patches that go extinct. This metapopulation configuration is at highest risk for complete extinction.
Figure 1.6: Metapopulation Figure representing and describing Harrison’s (1991) Four Types of
Metapopulations (Adapted from Hilty et al., 2006)

21
Figure 1.7: Florida Wildlife Corridor (Florida Wildlife Corridor, 2014)
22
CHAPTER 2
METHODS
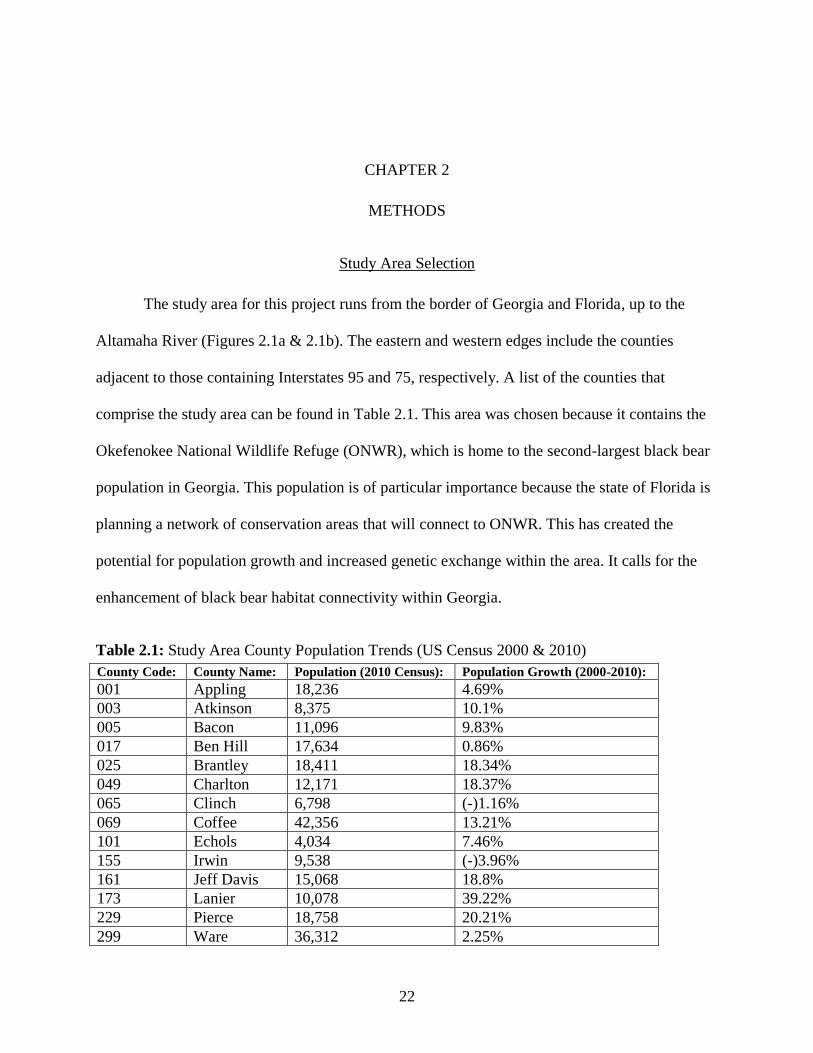
Study Area Selection
The study area for this project runs from the border of Georgia and Florida, up to the
Altamaha River (Figures 2.1a & 2.1b). The eastern and western edges include the counties
adjacent to those containing Interstates 95 and 75, respectively. A list of the counties that
comprise the study area can be found in Table 2.1. This area was chosen because it contains the
Okefenokee National Wildlife Refuge (ONWR), which is home to the second-largest black bear
population in Georgia. This population is of particular importance because the state of Florida is
planning a network of conservation areas that will connect to ONWR. This has created the
potential for population growth and increased genetic exchange within the area. It calls for the
enhancement of black bear habitat connectivity within Georgia.
Table 2.1: Study Area County Population Trends (US Census 2000 & 2010)
County Code: County Name: Population (2010 Census): Population Growth (2000-2010):
001 Appling 18,236 4.69%
003 Atkinson 8,375 10.1%
005 Bacon 11,096 9.83%
017 Ben Hill 17,634 0.86%
025 Brantley 18,411 18.34%
049 Charlton 12,171 18.37%
065 Clinch 6,798 (-)1.16%
069 Coffee 42,356 13.21%
101 Echols 4,034 7.46%
155 Irwin 9,538 (-)3.96%
161 Jeff Davis 15,068 18.8%
173 Lanier 10,078 39.22%
229 Pierce 18,758 20.21%
299 Ware 36,312 2.25%
23
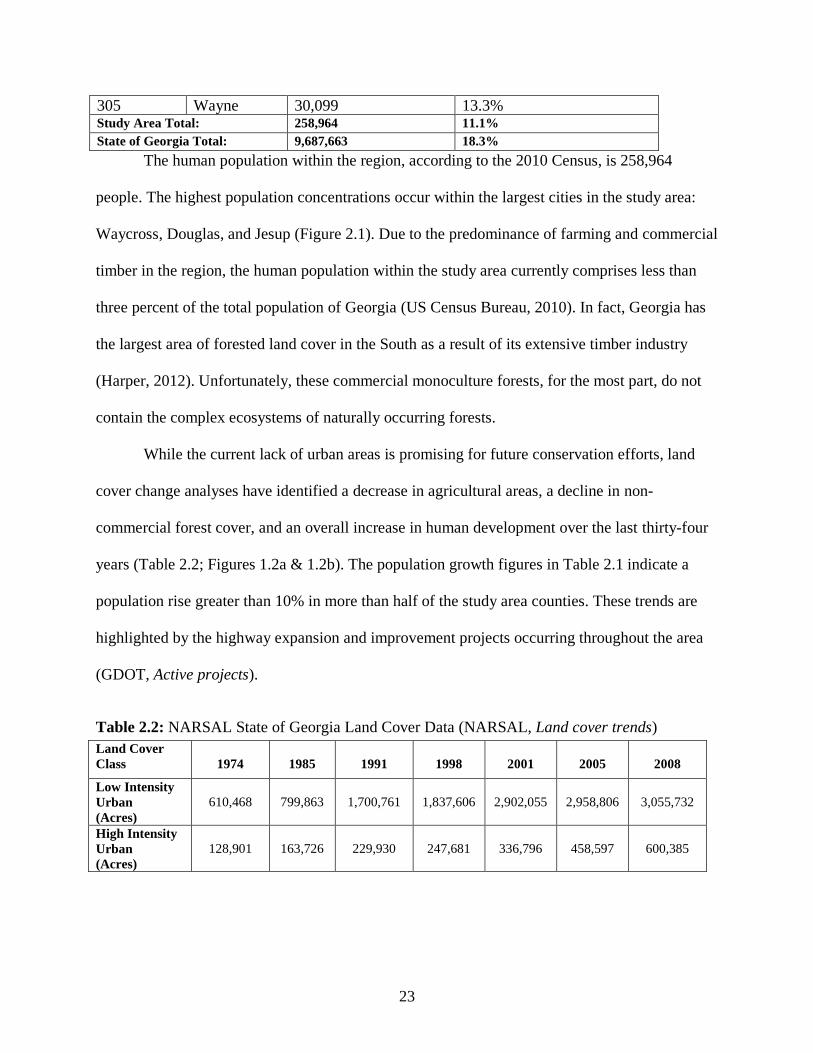
305 Wayne 30,099 13.3% Study Area Total: 258,964 11.1%
State of Georgia Total: 9,687,663 18.3%
The human population within the region, according to the 2010 Census, is 258,964
people. The highest population concentrations occur within the largest cities in the study area:
Waycross, Douglas, and Jesup (Figure 2.1). Due to the predominance of farming and commercial
timber in the region, the human population within the study area currently comprises less than
three percent of the total population of Georgia (US Census Bureau, 2010). In fact, Georgia has
the largest area of forested land cover in the South as a result of its extensive timber industry
(Harper, 2012). Unfortunately, these commercial monoculture forests, for the most part, do not
contain the complex ecosystems of naturally occurring forests.
While the current lack of urban areas is promising for future conservation efforts, land
cover change analyses have identified a decrease in agricultural areas, a decline in non-
commercial forest cover, and an overall increase in human development over the last thirty-four
years (Table 2.2; Figures 1.2a & 1.2b). The population growth figures in Table 2.1 indicate a
population rise greater than 10% in more than half of the study area counties. These trends are
highlighted by the highway expansion and improvement projects occurring throughout the area
(GDOT, Active projects).
Table 2.2: NARSAL State of Georgia Land Cover Data (NARSAL, Land cover trends)
Land Cover
Class
1974
1985
1991
1998
2001
2005
2008
Low Intensity
Urban
(Acres)
610,468
799,863
1,700,761
1,837,606
2,902,055
2,958,806
3,055,732
High Intensity
Urban
(Acres)
128,901
163,726
229,930
247,681
336,796
458,597
600,385

24
The study area does not include counties crossed by the two main interstates (I-75 and I-
95) because research has demonstrated black bears’ extreme avoidance of major roadways
(Brody & Pelton, 1989). While it is impossible to avoid all significant roadways in southern
Georgia, I-75 and I-95 represent the most impassible highway features in the region due to their
large footprint, high traffic volumes, and high vehicular speeds.
The Altamaha River was selected as a northern boundary for the study area (Figure 2.1b).
The river runs 137 miles from central Georgia, south of the city of Macon, eventually reaching
the Atlantic coast, south of Savannah. Both sides of the Altamaha contain unique and valuable
habitat for black bear and other native species in Georgia (GA DNR, 2005). Historically used to
transport people, agricultural goods, and timber, the Altamaha is still affected by pollution and
development (Altamaha River Partnership, History; Georgia Water Coalition, 2012). A recent
increase in public awareness of the Altamaha’s subjection to pollution, industry, and
development has encouraged restoration and protection of the river and the land bordering it.
In 2005, the Georgia Department of Natural Resources (DNR) identified the Altamaha as
a “high priority site” in the Georgia State Wildlife Action Plan. Since then, a significant portion
of land along the river has been placed into conservation easements or purchased for permanent
conservation by a variety of public and private entities (Figure 2.2). The Nature Conservancy
recently contributed a significant addition to the protected shoreline, purchasing 6,277 acres that
span almost nine miles of the Altamaha (Nature Conservancy, 2013). The extensive public,
nonprofit, and private initiative to protect the Altamaha River and surrounding lands makes it an
ideal preliminary target for black bear connectivity.
In addition, the Altamaha’s linkage with the Ocmulgee River creates the opportunity for
future corridor extensions to Georgia’s central black bear population (Figure 2.6). This central

25
population, located adjacent to the Ocmulgee River and south of Macon, is the smallest black
bear population in Georgia. It is currently presumed to be genetically isolated from the southern
and northern black bear communities (Cook, 2007).
Brief Introduction to Geographic Information Systems (GIS)
Esri, a current leader in geospatial software and data development, defines GIS as: “a
geographic information system (GIS) [that] integrates hardware, software, and data for capturing,
managing, analyzing, and displaying all forms of geographically referenced information” (n.d.).
There is no definite origin for GIS; documented computer-based use began in the mid-1900s.
GIS offers faster and more advanced data organization, interpretation, and geographic analysis
than previously available in printed charts and maps. The ability to input data, attach it to a
physical location, and manipulate it to illustrate current environments or project future conditions
has been invaluable for researchers, scientists, planners, and countless others interested in
landscape analysis and visualizing trends. Access to satellite imagery has further enhanced GIS,
allowing for large-scale land cover analysis. Recently, use of this technology has been extended
to the general public through programs such as Google Earth.
While a powerful tool, GIS relies on data defined and created by the user. It is important
that input data and parameters are based on existing research. In identifying potential wildlife
corridors, one must gain an understanding of the influential landscape factors and the behavioral
tendencies of the focal species in order to properly develop a geospatial model that accurately
maps black bear habitat needs. This project will utilize pre-existing geospatial data to analyze
existing, redefined, and created land cover and land use data and map habitat requirements
between existing protected areas.

26
Characterization of Black Bear Habitat in the Study Area
A variety of habitat types within the Southern Coastal Plain and Southeastern Plain
support black bear in Georgia (GA DNR, 2005). It is difficult to pinpoint habitats of highest
value for black bear because food availability shifts throughout the year and they are a highly
flexible species (Maehr et al., 2001). Females with cubs tend to be most selective about their
surrounding habitats. This is because they are anchored to smaller home ranges while raising
their young and need a greater variety of habitat types within a close proximity (Powell, 1986).
Black bear will enter open areas, usually under cover of darkness, but generally prefer
forested habitats with a mast-producing understory (FFWCC, 2012; Maehr et al., 2001; Cook,
2007). Forests with dense understories are preferred over those with minimal shorter vegetation
(Maehr et al., 2001). Den sites are frequent in these tightly vegetated areas or in sections of forest
with fallen trees. Low-growing trees and shrubs tend to produce the majority of fruits and insects
in the region as well. In order to maintain a productive understory, forest canopies must be
periodically thinned to allow sunlight to reach the vegetation below. Many of the high-value
mast producers, such as persimmon (Diospyros virginiana), blueberries (Vaccinium spp.), and
blackberries (Rubus spp.), require at least partial sunlight. Palmetto berries (Serenoa repens) and
gallberries (Ilex glabra) are some of the most common forest-dwelling mast-producers taken by
black bear in southern Georgia. In the past, systems were frequently exposed to fire and other
mechanisms that prevented an overgrowth of large-canopied hardwoods. Today, controlled
burning is being promoted as a management tool but the labor, cost, and conflict with adjacent
urban areas hinders its optimal use.
Bottomland forests and swamps are another set of attractive habitats for black bear. As
long as nearby upland areas are available for denning, these hydric systems can support a black

27
bear population. This is clear in the case of Okefenokee Swamp, home to the majority of the
second-largest black bear population in Georgia. In these bottomland forests, black bears feed
mainly on available soft masts like black gum (Nyssa sylvatica) and dewberry (Rubus trivialis)
(Cook, 2007).
Commercial pine stands are human-altered forests but are frequently utilized by black
bear. Timber stands offer the species a route of travel generally devoid of humans, busy
roadways, and other potential threats. However, mature commercial timber stands generally do
not offer a significant amount of food for black bear because of their dense canopy cover. These
areas also have the tendency to change drastically, due to harvesting, and clear-cuts are of
relatively low use to black bear if the area is chemically treated.
It is plausible that black bears utilize timber stands because of a lack of available native
forest. This is particularly apparent in Georgia, where approximately 98% of the state’s forests
are commercially harvested, to varying degrees (Harper, 2012). Some steps have been taken to
encourage timber stand management techniques that promote multidimensional habitat
throughout the growing and harvesting process. The Sustainable Forestry Initiative (SFI)
provides guidelines, certifications, and helps to ensure a higher market price for participating
companies’ products. Unfortunately, the maintenance of wildlife habitats within a lucrative
timber stand is high-cost and labor intensive. For this reason, the majority of commercial stands
in southern Georgia remain a monoculture.
Clearings adjacent to forested habitat can be as important as the forested area, depending
on the season. In early spring and summer these clearings provide sustenance in the form of
insects, cold-weather forages such as clover (Trifolium spp.), and soft masts (Cook, 2007; M.
Chamberlain, personal communication, January 28, 2014; M. Hooker, personal communication,
28
January 7, 2014). These edge habitats also attract white-tailed deer whose young are readily
taken by black bear (M. Chamberlain, personal communication, January 28, 2014). Early
succession habitats are conducive to soft mast producers like blackberries (Rubus spp.) and
pokeberries (Phytolacca americana), both high preference foods for the species (K. Miller,
personal communication, October 30, 2013).
Agricultural lands also attract black bear during certain times of the year. Row-crops can
provide a source of carbohydrate-rich foods in the fall, particularly peanuts and corn (M.
Chamberlain, personal communication, January 28, 2014; M. Hooker, personal communication,
January 7, 2014). Despite the caloric value of certain crops, they do not provide much cover for
black bear for most of the growing season. Due to the extensive nature of row-crops and
pastureland in southern Georgia, black bear in the area rely on drainage ditches, overgrown
fencerows, and other thin strips of vegetation to navigate between forested patches (M.
Chamberlain, personal communication, January 28, 2014; M. Hooker, personal communication,
January 7, 2014). Other agricultural products, like pecans, peaches, and blueberries, are sources
of black bear food and provide some consistent cover for travel.
Overall, it appears that black bear habitat-use is primarily dictated by the seasonal
availability of foods and access to forest cover. Females tend to be more discretionary when
raising cubs since they require reliable denning sites and sufficient food within their smaller
home ranges. It appears that habitats of highest value are located away from major roadways or
human development. These factors will be reflected in the geospatial model.
Geospatial Model and GIS Analyses for Corridor Identification
A number of studies have implemented GIS models to identify existing habitat and key
areas to connect for black bear. Cox, et al. (1994) analyzed existing native wildlife populations,

29
human development, native land cover, agricultural land, and other landscape characteristics to
identify important regions for black bear, Florida panther, and other wildlife native to Florida.
The SE GAP (2011) combined topographic data, land cover, species geographic ranges, and
species-habitat associations to identify potential habitat for black bear and other native species in
Georgia.
The GIS model used for this project is derived from the methodology implemented by the
Washington Wildlife Habitat Connectivity Working Group’s (WHCWG) for their Washington
Connected Landscapes Project (2010). The Connected Landscapes Project took a collection of
umbrella species into account, including black bear. Due to the limited breadth of this project,
black bear is the only species considered. The model will use WHCWG’s qualification and
grading system for black bear in the GIS analyses. A complete modeling and analysis flow-chart
is illustrated in Figure 2.5.
A “resistance” raster, created from overlaying roads, distances from roads, housing
density, and land cover data, guides the identification of optimal pathways between conservation
sites within the study area. Higher resistance values reflect an increased difficulty in black bear
movement through an area. The Connected Landscapes Project incorporated land cover, housing
density, roadways, forest structure, and topographical features to create their resistance raster
(WHCWG, 2010). Similar projects have used roads, forests, urban areas, and elevation as
significant landscape elements when characterizing landscape connectivity for black bear
(Cushman, McKelvey, & Schwartz, 2009; Cushman, McKelvey, Hayden, & Schwartz, 2006).
For this project, slope and elevation data are not included because there is less than a 500-foot
elevation change across the entire study area. No reports were found that identify any significant
topographical barriers for black bear in southern Georgia.
30
Forest structure is also not included in this analysis, due to a lack of available data.
Housing density, road type and proximity, and land cover data were categorized and valued
based on the methods identified in the Washington Connected Landscapes Project (WHCWG,
2010) and the Closing the Gaps in Florida’s Wildlife Habitat Conservation System report (Cox et
al., 1994). Resistance values and ranking methodologies from other black bear suitability
analyses were examined (Cushman, Landguth, & Flather, 2012; Cushman, et al., 2006).
However, the resistance values used could not be applied for this study because they fell
significantly below Linkage Mapper’s recommended maximum resistance values of at least 100
(McRae & Kavanagh, 2014).
Roads
Roadway analysis was simplified from the WHCWG’s criteria due to the relatively low
human population and highway traffic volume in the study area. Road data was obtained from
GDOT for each county within the study area. State and federal highways were then extracted
from the overall road network for analysis. Average annual daily traffic (AADT) values were
recorded for each road segment based on 2012 Georgia Department of Transportation data to
account for the greater crossing difficulty across roads with higher traffic volumes (WHCWG,
2010). Highway sections were then categorized, depending upon their AADT levels. “Low-
traffic highways” are defined as having AADT values less than 400, “high-traffic highways”
have greater than 5000, and “medium-traffic highways” fall in-between (US FHWA, 2009;
Transportation Research Board [TRB], 2011). Local roads were not included in the road-level
analysis because black bears in the area do not exhibit significant avoidance of such low-use
roads (Brody & Pelton, 1989).

31
Roads were buffered 500 and 1,000 meters, respectively, to account for the varying
highway avoidance distances of black bear according to traffic-levels (Brody & Pelton, 1989;
WHCWG, 2010). Road centerlines were erased from 500-meter buffers, which were erased from
1,000-meter buffers, to avoid overlapping resistance values. Road centerline and distance data
were converted to a raster and reclassified according to their traffic volumes and buffer distances
(Figure 2.5).
A number of freight railways cross through the study area and are owned by three main
entities: Norfolk Southern, CSX, and St. Mary’s Railway West. There is a lack in literature
clearly identifying the effects of railroads on wildlife. Some sources suggest adverse effects from
associated noise and habitat loss during railway construction. Others identify wildlife use of
railroad corridors for movement (Trewhella & Harris, 1990). Railroads are not identified as a
significant threat in the black bear management plans of neighboring southeastern states
(NCWRC, 2012; Ruth, 2011; FFWCC, 2012). Furthermore, the intermittent train schedule and
overall low density of railways in the study area minimize any barrier effect the system may have
on wildlife in the area. Existing railways were not included in the resistance raster due to the lack
of data identifying railroads as a barrier or threat to wildlife in the area.
Housing Density
Housing density was calculated at housing units per acre. Housing unit and census block
area data were taken from 2010 TIGER Census data. Housing densities were grouped into three
categories: “low density” at less than ten units per acre, “medium density” between ten and
eighty units per acre, and a “high housing density” of greater than eighty units per acre. A raster
was created from the three density categories. Raster values were reclassified and given

32
resistance scores “0,” “10,” and “100,” for the low, medium, and high-density areas, respectively
(WHCWG, 2010; Figure 2.5).
Land Cover Data Collection and Organization
Land cover data was obtained from the Southeastern Gap Analysis Project (SE GAP) that
is in cooperation with the Natural Resources Spatial Analysis Lab (NARSAL). This data was re-
organized into categories and subcategories based on professional opinion, published studies,
and the SE GAP Species Modeling Report for black bear (SE GAP, 2011). Categories reflect
each habitat’s use by black bear in southern Georgia. Professional opinion and published studies
were used to create and apply this ranking system. Preliminary attempts to separate valuable
black bear habitat into two levels based on cover and food availability were abandoned due to
lack of forest structure data and the seasonal ambiguity of the project. A complete table of the
study area land covers names and categories can be seen in Figure 2.5.
High quality natural habitat for black bear was defined as containing cover and/or food
for some portion of the year. Food and cover are important components that will help attract the
black bears through the region and provide security during travel. These primarily consist of
forested and wetland habitat types. Contiguous land covers within this category were then
subdivided into areas greater than and less than 0.15 square kilometers. Those greater than 0.15
square kilometers represent existing areas of highest quality and reflect the important black bear
habitat size identified in Closing the Gaps in Florida’s Wildlife Habitat Conservation System
report (Cox et al., 1994).
For the purpose of this initial design, seasonal changes are not incorporated into the
analysis. Cover remains moderately available throughout the year because of the relatively mild
winters in the study area. Subsequent analysis will be needed to assess how much food is

33
available to black bears within the corridor sections at specific times of the year. Despite
seasonal changes, the corridors will be viable networks because they are intended to primarily
serve as connective routes and do not need to fulfill permanent home range requirements.
Agricultural areas were divided into two categories: those within 300 meters of the
greater than 0.15-kilometer high quality habitat and those beyond that distance. The 300-meter
distance is derived from the model used in the SE GAP black bear analysis (2011). These areas
were identified using Euclidean Distances from the above-described highest quality habitats. As
with commercial timber stands, lack of reported conflict between farmers and black bear in the
region offsets the need to completely restrict the species’ use of these human-influenced areas
(G. Nelms, personal communication, February 24, 2014).
Land covers associated with urban development are grouped into a single category since
the corridor should avoid cities, roadways, and development when possible. This will help
discourage the potential for injury, property damage, and attraction of scavenging bears.
Published studies and repeated accounts by researchers of the serial tendencies of nuisance bears
indicate the importance of establishing black bear corridors at a distance from urban
environments.
Roadway and road-edge land cover data is included in the SE GAP “low, medium, and
high-intensity developed” land cover categories. Since right-of-ways are not delineated from
urban development in the land cover data, the overlapping highway layer, discussed above, will
account for the additional barrier-effect that highways have on black bear.
All remaining land cover types were grouped into a single category representing areas of
no particular threat or habitat value. Due to the generalist tendencies of black bear, there are few
land cover types that they will completely avoid (Maehr et al., 2001; M. Chamberlain, personal

34
communication, January 28, 2014; G. Nelms, personal communication, February 24, 2013).
Individual black bears have been observed traveling distances of two to three kilometers across
entirely open fields (M. Hooker, personal communication, February 5, 2014). For this reason,
any non-urban land cover that offers little refuge or food can still make up a portion of the
corridor. Until conservation lands are expanded and improved land management practices are
brought into the area, attempts at restricting urban development on these patches may be
necessary for protecting a cohesive network for the future.
Land cover data was reclassified based on the final eight categories. Resistance values for
urban areas, water, agricultural lands, and habitat types are based on the values used for black
bear in the Connected Landscapes Project (WHCWG, 2010, p. A-71). Open water is given a
higher score as a reflection of the WHCWG project. Black bears are avid swimmers and are
known to cross major waterways (G. Nelms, personal communication, February 24, 2014; M.
Hooker, personal communication, January 7, 2014). However, open water can act as a barrier to
less fit individuals and does not have habitat value by itself (Maehr et al., 2001). Because the
black bear habitat in southern Georgia differs from those identified in the Connected Landscapes
Project out of Washington State, black bear habitat values were correlated based on relative
quality for the two black bear populations. These categories were then given resistance values
accordingly (WHCWG, 2010).
The existing land cover in the study area can be seen in Figure 2.4. A full list of land
cover types in the study area and their corresponding categories and resistance values can be
found in Figure 2.5.

35
Conservation Lands
Existing conservation lands will represent the focal areas for the corridor to connect.
Conservation lands are managed natural areas that will usually remain protected in perpetuity.
ONWR is the largest conservation area in the study area and is the primary range of the southern
Georgia black bear population and is the southernmost focal area (Figure 2.1b). Conservation
areas along the Altamaha Corridor will make up the northernmost destination points. Protected
areas in-between will serve to create a network of corridors within the study area that run
between the target areas of ONWR and the Altamaha.
Geographic information for conservation lands in Georgia was obtained from the
National Resources Spatial Analysis Laboratory (NARSAL, 2012). It contains owner,
management, and land-use information for any land “assigned conservation measures that
qualify their intent to manage lands for the preservation of biological diversity and other natural,
recreational, and cultural uses” (NARSAL, 2012). This data was created in cooperation with
Georgia DNR and the US Geological Survey. Areas specifically dedicated to conservation of
wildlife and natural habitat were extracted from this layer to represent target areas for the
corridor to connect. The Three Kings WMA was removed from the data because it is no longer a
conservation easement. Flat Tub WMA was added to the existing data since it was created after
2012.
Only conservation lands with areas greater than 0.15 square kilometers were used in the
final analysis. This reflects the same minimum habitat size requirement as defined in the land
cover section. Smaller conservation lands are valued based upon their existing land cover
attributes, described in the previous section.

36
Linkage Mapper
The Linkage Mapper ArcGIS Toolkit was developed to model optimal connective
pathways between areas identified as particularly important for conservation (WHCWG, 2010;
McRae & Kavanagh, 2012). Road, housing density, and land cover data rankings are added
together to create a single “resistance” raster layer. Each raster pixel value represents the
difficulty level a black bear has crossing through that section of land. Areas of lowest resistance
values are indicative of desirable habitat with low human activity.
The significantly sized conservation lands, as described in the previous section, represent
the core areas to connect across the resistance raster. Linkage Mapper is used to calculate the
Euclidean distance, least-cost pathways, and cost-weighted distances between these Georgia
conservation lands. The initial resistance raster values were subsequently doubled to create a
second resistance raster. Linkage Mapper was run again with the second resistance raster as a
sensitivity analysis, testing whether significant changes resulted from the shift in resistance
values. A complete description of the tools and Python script utilized by Linkage Mapper can be
found in the Linkage Mapper User Guide (2014), available at:
https://code.google.com/p/linkagemapper/downloads/detail?name=LinkageMapper1_0_8.zip.
Pinchpoint Mapper (Circuitscape)
Circuitscape has been linked into the Linkage Mapper Toolkit extension “Pinchpoint
Mapper” (McRae & Shah, 2009; McRae, 2012). This extension calls on Circuitscape to identify
“pinch points” by assessing the least-cost corridors output from Linkage Mapper (McRae, 2013).
“Pinch points” are locations along the Linkage Mapper-identified least-cost corridors that have
higher resistance values. These areas were calculated using the pairwise mode in order to assess
the connectivity between each conservation area in the study region. This mode determines
37
constriction points between each conservation area along the corridor segments (McRae & Shah,
2013). These “pinch point” areas are indicative of landscape barriers, such as roads, that fall
within the corridor.
The cost-weighted distance cutoff for this project, which determines the maximum
corridor width, is set to 60 kilometers. This reflects the “limits of ‘frequent’ dispersal” identified
in Closing the Gaps in Florida’s Wildlife Habitat Conservation System (Cox et al., 1994)
report’s section on black bear (p. 51). There is no need to account for potential territorial
conflicts within the corridor space in this measurement since local bears are reported to have a
generally high tolerance for other individuals at a relatively close proximity (Powell, 1986; M.
Chamberlain, personal communication, January 28, 2014). While 60 kilometers is less than
corridor width values identified by other black bear corridor projects, this number has been
applied to adjacent populations and should best represent the dispersal behaviors of the southern
Georgia black bears in focus (WHCWG, 2010; Cox et al., 1994).
The Pinchpoint Mapper output data can then be analyzed with regards to barrier type and
degree. Mitigation methods are suggested in the following chapter. A complete description of the
tools and Python script utilized by Circuitscape can be found in the Circuitscape User Guide
(2013), available at:
https://circuitscape.googlecode.com/files/Circuitscape_3.5.8_User_Guide_rev3.pdf.

38
Figure 2.1a: Study Area Location: Georgia, USA

39
Figure 2.1b: Study Area Conservation Lands and Major Cities

40
Figure 2.2: Altamaha River Corridor

41
Figure 2.3: Land Cover Classifications

42
Figure 2.4: Existing Land Cover and Black Bear Habitat in the Study Area

43
Figure 2.5: GIS Analysis Flow-chart

44
Figure 2.6: Altamaha River as a Potential Connection to the Central Bear Population

45
CHAPTER 3
RESULTS
Resistance Raster
The road, housing density, and land cover data were combined to create a composite
resistance map ranging in values from zero to 1,350 (Figure 3.1). The pixel resolution for the
resistance raster was a 30-meter cell size. The study area contains relatively good quality black
bear habitat, overall. This is most likely reflecting the mix of agricultural land and commercial
timber stands that make up most of the area. Forty-five conservation areas larger than 0.15
square kilometers were identified for connectivity within the study area (Figure 3.2).
Linkage Mapper
Euclidean distances, or straight paths, between conservation areas ranged from five to
77,775 meters. Cost-weighted distance values reflect the potential meanderings and directional
changes necessary to avoid undesirable or high-conflict areas (i.e., high resistance values; Figure
3.3) and ranged from 30 to 703,293. The least-cost paths, which take into account the amount of
resistance a black bear would endure along a path, ranged from 30 to 152,789 (Figure 3.2). Cost-
weighted distance ratios between the least-cost paths and the Euclidean distance paths capture
how far off a straight-route a black bear must go because of landscape barriers. A cost-weighted
distance to Euclidean distance ratio of one is optimal (WHCWG, 2010, p. 46). The mean cost-
weighted distance to Euclidean distance ratio was 13.96.
The Linkage Mapper corridor output indicates a variety of intertwining pathways that
avoid larger urban areas, as expected (Figure 3.4a & 3.4b). A large percentage of the area north
46
of ONWR falls within the 200-kilometer maximum corridors distance (value automatically
selected by Linkage Mapper). This expanse of acceptable black bear habitat in the area most
likely reflects the extensive agricultural and commercial timber stands in the area. It is also
indicative of the relatively low traffic along the highways in the study area.
The “best” corridor options become particularly clear when the corridors are truncated to
the 60 kilometer cut-off for average black bear distances, identified in the Circuitscape section of
the previous chapter (Figure 3.4b). These paths clearly avoid Waycross and the other urban areas
in the region. The dominance of human-altered of the landscape is reflected in the thinning of the
corridors across the northern half of the study area.
When comparing the corridor output to the cost-weighted distance output, it is clear that
the corridors running northeast between ONWR and the Altamaha have the lowest overall cost-
weighted distances (Figures 3.2, 3.4a, & 3.4b). Areas of high cost-weighted distances stretch
from Waycross, just north of ONWR, westward across the northern portion of the study area.
While potential corridors do cross that area, their least-cost paths have higher values than those
extending to the northeast.
The wide swath extending westward from Okefenokee NWR supports the SE GAP
(2011) analysis identifying black bear habitat within that region (Figure 3.4b). Connectivity also
appears along the majority of the Altamaha River. The gap along the northeastern section of the
Altamaha may reflect the exclusion of the conservation lands that lie on the opposite bank,
outside of the study area (Figure 2.2). Inclusion of these areas would most likely close fill in this
gap of potential corridor space along the river.
The sparse corridors found along the southern Georgia border most likely reflect the
exclusion of the Florida conservation areas to the south of the study area. The resistance raster
47
values along the state border are not significantly higher than those reflected in the rest of the
study area and should not have affected the cost-weighted paths more than other parts of the
study area. Including conservation areas in Florida and in adjacent counties would likely increase
the corridor density in this area.
There were no significant changes in the least-cost path, cost-weighted distance to
Euclidean distance ratio, or corridor outputs in the sensitivity analysis.
Pinchpoint Mapper (CircuitScape)
Pinchpoint Mapper illustrates a connectivity map in the study area, reduced according to
the 60-kilometer cut-off described in the previous chapter. The output highlights points of
highest difficulty along each path (Figure 3.5). There is still a dense network in the northern
portion of the study area despite this reduction in travel-distance limit.
The most direct route to the Altamaha River Corridor appears to curve southeast of
Waycross, the largest city in the study area (Figure 3.7). It contains the densest collection of
least-cost paths as well. This potential corridor passes through the Little Satilla WMA, the
second-largest conservation area in the study area. Road intersections are unavoidable; this
corridor crosses eight highways, which appear to correlate with the pinch points identified along
the connections. Pre-existing bridges along highway-conflict areas offer an opportunity to
mitigate at least some roadway conflict in a relatively inexpensive manner (Figure 3.6).
Another viable corridor winds west of Waycross and passes through smaller conservation
areas until reaching the confluence of the Altamaha and Ocmulgee Rivers (Figure 3.8). Despite
this corridor’s greater overall length compared to the one discussed above, it takes a more direct
route towards the central Georgia black bear population that resides to the Northwest of the study
area (Figure 2.6). This path also has greater opportunity for meandering segments that touch
48
more conservation lands and other areas of existing habitat. This would allow for inclusion of
neighboring areas with unique habitat opportunities.
This linear corridor does contain more pinch points than the first corridor (Figure 3.8).
Most of these fall around the cities of Waycross and Douglas. There is room to avoid Douglas to
the East. Unfortunately, this would require multiple crossings of Route 441, one of the largest
roadways in the region. Waycross is another relatively unavoidable barrier, located at the north
end of ONWR. Fencing or other barriers may be necessary around these urban spaces to deter
black bears from entering the area. There are existing bridges in close proximity of the majority
of the highway-cased pinch points (Figure 3.6). However, mitigation would likely be more costly
than that required within the first corridor option.
The corridor with the most direct route to the Ocmulgee and towards the central black
bear population stretches up along the northwestern section of the study area (Figure 3.9). This
corridor meets areas of resistance between ONWR and Waycross (Figure 3.9 and 3.8). Unlike
the corridor previously discussed, it circumvents the city of Douglas. More than ten highways
cross this potential corridor, with Route 441 having the highest traffic and representing the
greatest road barrier along the corridor. Fortunately, there are a number of existing bridges,
particularly in the section parallel to Douglas that could be retrofitted with wildlife crossing
structures.
Summary
Results revealed a variety of corridor sections that can connect ONWR to conservation
areas along the Altamaha River. Some paths may be skewed due to the exclusion of conservation
areas outside of the study area in adjacent counties or states. Viable corridors through the middle
of the study area seem to follow the larger rivers in the area (Figures 3.8 & 3.9). Waycross,

49
Douglas, and Route 441 represent the greatest sources of conflict along the potential corridors.
The most direct connection between ONWR to the Altamaha River runs east from Okefenokee
and follows northwest along the river (Figure 3.7). Longer routes have the potential to connect
between more conservation areas. Corridors that reach the western end of the Altamaha along the
northern study area boundary reach more directly to the black bear population in central Georgia.

50
Figure 3.1: Resistance Raster

51
Figure 3.2: Cost-Weighted Distance Output

52
Figure 3.3: Least-Cost Paths Between Existing Conservation Lands >0.15 sq km

53
Figure 3.4a: Linkage Mapper Output (Truncated at 200k)

54
Figure 3.4b: Linkage Mapper Output (Truncated at 60 k)

55
Figure 3.5: Pinchpoint Mapper Output

56
Figure 3.6: Pinchpoint Mapper Output with Existing Bridges Along Major Highways
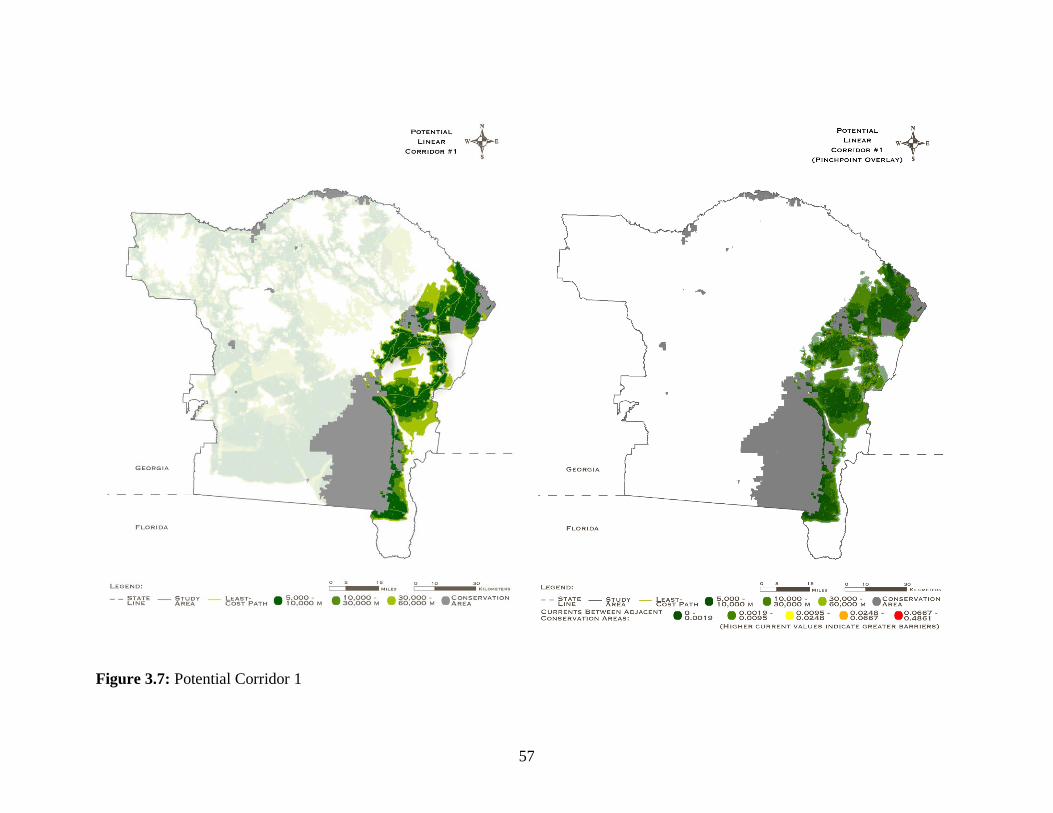
57
Figure 3.7: Potential Corridor 1
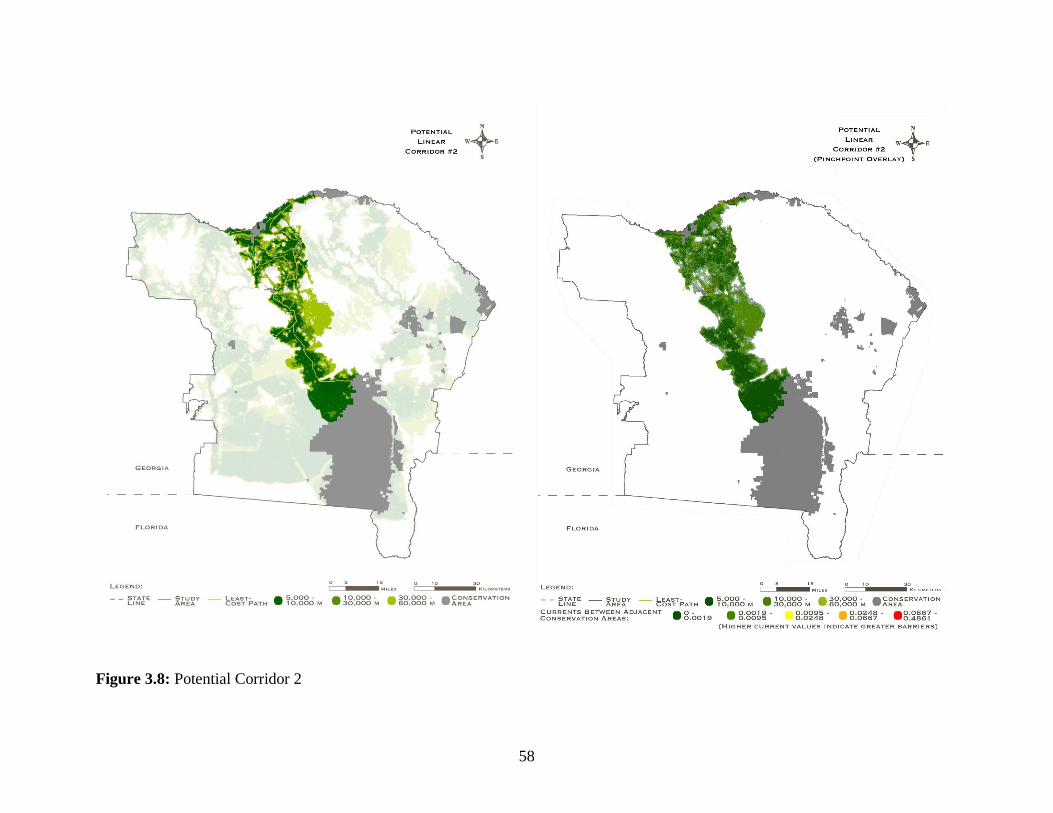
58
Figure 3.8: Potential Corridor 2

59
Figure 3.9: Potential Corridor 3

60
CHAPTER 4
DISCUSSION
Conclusion
This project utilized a series of geospatial analyses to identify a network of potential
wildlife corridors connecting ONWR to the Altamaha River with black bear as the focal species.
The analyses identified a variety of potential corridors with three main corridor sections. These
results indicates flexibility in creating a final wildlife corridor design. It will allow the final plan
to optimize use of existing available land, habitat quality, and areas distanced from urban
development. Urban development is growing throughout the United States. While southern
Georgia remains primarily rural, projected population growth indicates future urban expansion
throughout the state. It is essential to create a wildlife connectivity plan that will protect portions
of the currently un-urbanized region from development.
The state of Florida has already begun to implement their comprehensive wildlife plan.
With Georgia as the primary landmass connecting Florida to the rest of North America, it is
essential that a corridor plan be implemented to account for future influxes of a variety of
species.
Large carnivores, like black bear, should be highlighted in the final plan because they
tend to suffer most from human conflict. Human development quickly fractures large predators’
wide-ranging populations. These species often have difficulty recovering because of their
comparatively low overall populations. Their wide-ranging nature also predisposes these large
animals, particularly black bear, to cross through urban areas. These ventures frequently result in

61
injury or death. Vehicle-wildlife collisions are a significant source of fatalities, as are poaching
and euthanasia in response to nuisance behavior. A finalized corridor plan can use the highway-
caused pinch points, identified in Chapter 3, to locate likely important wildlife road crossings
and catalyze successful implementation of mitigation measures along roadways. Special
attention should also be paid to pinch points or sections of corridors adjacent to urban areas.
These areas may require active diversion mechanisms such as fencing or other forms of barriers
to deter wildlife from wandering into human developments.
A wildlife-monitoring plan must be included in the final design, particularly if road
crossings are installed. Monitoring studies ensure that black bear are utilizing the corridors and
can encourage participation in the protection and management of corridor lands. Once black bear
are determined to be traveling up to the Altamaha, the possibility of a corridor extension to the
central black bear population should be investigated.
The variety of possible routes identified in this study should be used as an advantage. The
design should maintain plasticity until a corridor that optimizes cost, minimizes implementation
effort, and accounts for stakeholder needs and opinions is identified. Further assessment of
existing land conditions, specific black bear locations, and more extensive landowner data will
help identify an ideal network of pathways and additional conservation lands.
Limitations
Black bear telemetry, sighting, road-kill, or other location data would enhance the
corridor design. These data would help better suit the corridor to the existing pockets of black
bear in the area. These data types have been used in previous projects to help identify which
areas of existing habitat are most used by black bear and what stretches of road create highest
conflict (WHCWG, 2010; Cox et al., 1994). Genetic testing and telemetry data has also been

62
used in validating resistance values across a landscape and identifying significant barriers
(Cushman, et al., 2006; Cushman, et al., 2012). Home ranges of females with cubs would
indicate areas of high importance for the species since they tend to establish more permanent
home ranges and are indicative of successful breeding populations (G. Nelms, personal
communication, February 24, 2014). Identification of current black bear patterns in the region
would be extremely valuable in identifying which corridor sections would have the greatest
impact.
A lack of up-to-date land cover data was another issue. Due to the ever-changing nature
of human-altered environments, it is nearly impossible to characterize an entire region without
some degree of error in the spatial data. Furthermore, the existing land cover data does not
capture the complexity of existing forest and habitat conditions. For example, a commercial pine
stand managed for wildlife is much different in character than one simply managed for maximal
harvest. Site visits and ground truthing are necessary to validate existing habitat quality. Forest
structure data also could improve this analysis.
The seasonality of black bear forages requires species-specific vegetation studies to
assess where food will be available within corridor sections throughout the year There is no
existing vegetation data for the area that goes into such detail. Conservation areas should serve as
starting points for this data development since the final corridor will run between them. Many
areas already have this information, to some degree, but it has not been converted into spatial
data. Detailed characterization of existing vegetation within these plots could help guide future
land management that would promote black bears and other species. This would create optimal
habitat within the corridor’s focal points. A comprehensive vegetative analysis would also guide

63
the creation of habitat sections previously lacking along the corridor. Native vegetation
completely missing from the region should be identified and restoration plans drawn up.
Parcel data for the area is highly restricted. Downloadable parcel data was publicly
available for only one of the fifteen counties in the study area. Landowner data for most counties
can be viewed online but the interface does not allow for regional assessment of land prices and
landownership. A number of counties charge a fee for parcel data downloads; others simply do
not have the means or technology to provide county data. The Southern Georgia Regional
Commission shared data for four counties in the study area but did not have access to the eleven
remaining. This lack of complete study area data and project funding negated the option to pay
for county data. Other states, such as Florida, have gone to great efforts to make landownership
data available to the public. Access to such data would facilitate future conservation projects.
Researchers in Georgia should work with counties to create accessible parcel data.
The incorporation of other focal species would have increased the significance of
identified corridors. Data limitations for black bear are likely similar for other species in
Georgia. In order to distinguish the highest value corridors, parallel studies that address the
habitat requirements and dispersal abilities of other native species should be performed. Corridor
data overlays for black bear and other species will identify which areas overlap and how to best
address the needs of multiple species in the area. Most other terrestrial species are more
sedentary than black bear and will likely have more restricted corridor connectivity outputs.
Species that tend to remain within a single habitat or small area are important to include in the
final corridor analysis since they can be most sensitive to fragmentation. Specific habitat needs
of such species should be met within existing conservation areas or within segments of the
corridor.

64
The resistance raster values were based on a single West Coast based study. It would be
ideal to have land cover values scaled according to local black bear habitats. There is a gap in
literature identifying how to properly scale resistance values for Linkage Mapper and
Circuitscape. Fine-tuning of input data was not possible due to limited access to hardware that
can efficiently run the GIS toolkits for this project. In developing a final corridor, it could be
useful to do a number of runs with different resistance values and observe any significant
changes that may appear.
The brief time-line of this project was an overarching limitation. It restricted the extent of
computer-based analysis, professional interviews and input, data creation, and ground truthing
that could be performed. Consultation with regional land managers, local landowners, and other
stakeholders to identify what areas have the highest potential for implementation should be
included in a longer-term project.
Future Implications
Community Benefits and Education
Areas along the corridor with lower quality land cover or in closer proximity to urban
areas can serve as dual-purpose property. Hiking, biking, equestrian, and other outdoor
recreation is easily incorporated into wildlife corridor sections. This can also prompt additional
funding by addressing the greenspace needs of a local community or private landowners.
Additional funding and community interest would be particularly valuable in degraded areas that
require environmental restoration. Active public education and garbage disposal programs would
be essential for these areas to reduce conflict with black bear and other wildlife along the
corridor. Maximized corridor widths along these sections would also help reduce the human
disturbance of wildlife passing through the area.

65
Regulated hunting of black bear along certain portions of the corridor, or within larger
areas connected by the corridor, would increase revenue for DNR via increased permitting and
ammunition sales. The wildlife corridor would most likely attract other game species into the
area as well. Turkey (Meleagris spp.), white-tailed deer (Odocoileus virginianus), northern
bobwhite (Colinus virginianus), and many other popular game species in Georgia, are attracted
to the mix of forest and edge-habitat that black bear require. This would improve the
department’s ability to manage existing lands and purchase additional areas along the corridor
while better monitoring and modeling populations to set appropriate take limits.
Once a corridor plan is completed, a public outreach program should be implemented that
explains the initiative and its importance. Government, non-profit, and private organizations
should be aware of land availability along the finalized plan. Landowners within the corridor
sections should be actively educated on the available tax credit, conservation easement, and other
government programs that assist participating landowners with restoration and conservation.
Many of these programs fall under the Farm Bill and provide federal assistance to owners with
wetlands, protected species, or restoration projects on their land.
Regional or statewide credit programs are another mechanism to facilitate environmental
protection in the region. These programs connect landowners with businesses that have been
required by the state to offset the environmental footprint of a project. New development that
disrupts a protected wetland or sensitive area must invest in the protection of a similar area
offsite. A number of companies within Georgia have set up mitigation banking programs that
simplify the process for both parties.
Public-private partnerships can also be voluntary. Ecotourism is a popular example of
privately owned businesses that focus on providing public and environmental benefits. Often
66
featuring outdoor activities and locally provided lodging and amenities, ecotourist destinations
are defined by their protection of natural spaces and benefit to the surrounding community. Little
Saint Simons Island, off the Georgia coast, is an excellent example of an ecotourist destination
that has protected an area from development and encouraged environmental education and
appreciation. Businesses centered on conservation efforts and environmental education would be
a valuable asset to the region.
Zoning regulations regarding the subdivision of parcels and proportions of developed to
undeveloped land guide development and encourage the protection of vegetated areas.
Restrictive covenants, such as those on Jekyll Island, off the coast of Georgia, can identify
minimum ratios of development to natural areas. Unified development codes can require that
developers purchase land to remain in conservation proportional to the intensity and size of their
project. A regional master plan is necessary in order to uphold many of these zoning regulations.
This emphasizes the close relationship planners and wildlife managers must have in order to
promote future land conservation.
Takeaway Message
The GIS models used for this project are powerful conservation tools. They expedite the
labor-intensive tasks involved in overlaying and calculating spatial data by hand, allowing land
managers and planners to operate more efficiently. In order to create a resistance layer that fully
characterizes the region, up-to-date land cover data and forest structure, among other habitat
components, are necessary. The limitations of this project denote the lack of spatial data for
southern Georgia.
Regardless of spatial data quality, it will remain important to reassess the output data of
these programs and arrive at the most realistic and appropriate solution. The GIS-created corridor

67
outputs are strictly based on the land cover and land use inputs provided to the program.
Synthesis of all contributing factors will guide the identification of a final corridor network. The
incorporation of wildlife corridor plans into regional Master Plans should be an overarching goal
since it would provide legal and regulatory backing for the design.

68
REFERENCES
Alig, R., Stewart, S., Wear, D., Stein, S., & Nowak, D. (2010). Conversions of forest land:
trends, determinants, projections, and policy considerations. Advances in threat
assessment and their application to forest and rangeland management/[edited by] John
M. Pye...[et al.].
Altamaha River Partnership. History. Retrieved February 26, 2014, from
http://www.altamahariver.org/history.html
Arizona Department of Transportation. (2007). Synthesis of animal-vehicle collision
mitigation measures. (Report No. FHWA-AZ-07-612). Springfield, VA: Reuer,
C. Retrieved from
http://www.ttap.colostate.edu/downloads/safety/AZ%20AnimalVehicle%20collisions.pdf
Beckmann, J.P. & Lackey, C.W. (2004). “Are desert basins effective barriers to
movements of relocated black bears (Ursus americanus)?” Western North American
Naturalist, 64(2), 269-272.
Brody, A.J. & Pelton, M.R. (1989). "Effects of roads on black bear movement in
western North Carolina." Wildlife Society Bulletin, 17(1), 5-10.
Centers for Disease Control and Prevention (CDC) (2011). CDC transportation
recommendations. Retrieved February 20, 2014, from
http://www.cdc.gov/transportation/recommendation.htm
Clevenger, T. (2007, March-April). Highways Through Habitats: The Banff Wildlife
Crossings Project. TR News 249.
http://onlinepubs.trb.org/onlinepubs/trnews/trnews249hwyhabitats.pdf.
Collinge, S.K. (2009). Ecology of fragmented landscapes. Baltimore, MD: Johns
Hopkins University Press.
Cook, K.L. (2007). Space use and predictive habitat models for american black bears
(Ursus americanus) In central Georgia, USA (MS thesis). University of Georgia.
Cox, J., Kautz, R., MacLaughlin, M., & Gilbert, T. (1994). Closing the gaps in Florida’s wildlife
habitat conservation system. Tallahassee, FL: Florida Game and Freshwater Fish
Commission. Retrieved from
http://research.myfwc.com/engine/download_redirection_process.asp?file=94cox%5F412
2%2Epdf&objid=48583&dltype=publication
69
Cushman, S.A., Landguth, E.L., & Flather, C.H. (2012). “Evaluating the sufficiency of protected
lands for maintaining wildlife population connectivity in the U.S. northern Rocky
Mountains.” Diversity and Distributions, 18, 873-884.
Cushman, S.A., McKelvey, K.S., Hayden, J., & Schwartz, M.K. (2006). “Gene flow in complex
landscapes: Testing multiple hypotheses with causal modeling.” The American
Naturalist, 168(4), 486-499.
Cushman, S.A., McKelvey, K.S., & Schwartz, M.K. (2009). “Use of empirically derived source-
destination models to map regional conservation corridors.” Conservation Biology 23(2),
368-376.
Dixon, J.D., Madan O.K., Wooten, M.C., Eason, T.H., McCown, J.W. & Paetkau, D.
(2006). "Effectiveness of a regional corridor in connecting two Florida black bear
populations." Conservation Biology, 20(1),155-162.
Doan-Crider, D.L. (2003). Movements and spaciotemporal variation in relation to food
productivity and distribution, and population dynamics of the Mexican black bear in the
Serranias del Burro, Coahuila, Mexico (PhD Diss.). Texas A&M University-Kingsville.
Florida Department of Environmental Protection (FL DEP) (2014). Florida forever.
Retrieved January 27, 2014, from http://www.dep.state.fl.us/lands/fl_forever.htm.
Florida Fish and Wildlife Conservation Commission (FFWCC) (2012). Florida black bear
management plan. Florida Fish and Wildlife Conservation Commission, Tallahassee,
Florida.
Florida Wildlife Corridor (2014). Route map. Retrieved from
http://www.floridawildlifecorridor.org/about/about-expedition/route-map/
Forman, R.T.T. (2000). "Estimate of the area affected ecologically by the road system
in the United States." Conservation Biology, 14(1), 31-35.
Forman, R.T.T., Sperling, D., Bissonette, J.A., Clevenger, A.P., Cutshall, C.D., Dale, V.H.,
Fahrig, L., France, R., Goldman, C.R., Heanue, K., Jones, J.A., Swanson, F.J.,
Turrentine, T., & Winter, T.C. (2003). Road ecology. Washington DC: Island Press.
Foster, M.L. & Humphrey, S.R. (1995). “Use of highway underpasses by Florida panthers and
other wildlife.” Wildlife Society Bulletin, 23(1), 95-100.
Georgia Department of Natural Resources (GA DNR) (2013). Black bear fact sheet. Melissa
Cummings. Retrieved from
http://georgiawildlife.com/sites/default/files/uploads/wildlife/pa/pdf/presskits/Bear%20Pr
ess%20Folder%20June2013.pdf
Georgia Department of Natural Resources (GA DNR) (2005). Georgia Comprehensive
70
Wildlife Conservation Strategy. Social Circle, GA. Retrieved from
http://www1.gadnr.org/cwcs/Documents/strategy.html
Georgia Department of Transportation (GDOT) (2012). Geographic transportation reporting
analysis and query system (GeoTRAQS). Retrieved from
http://www.dot.ga.gov/informationcenter/maps/geotraqs/Pages/default.aspx
Georgia Department of Transportation (GDOT) (2013). Statewide transportation
improvement program FY 2014-2017. Atlanta, GA: Walkder, R. Retrieved from
http://www.dot.ga.gov/Projects/programs/transportation/Documents/STIP/2014-
2017/STIP14-17.pdf
Georgia Department of Transportation (GDOT). Active projects. Retrieved February 10,
2014, From
http://www.dot.ga.gov/informationcenter/gastimulus/Pages/ActiveProjects.aspx
Georgia Water Coalition (2012). 2012’s worst offenses against Georgia’s water. Retrieved
from http://www.garivers.org/gawater/pdf%20files/Altamaha6.pdf
Gibbs, J.P. & Shriver, W.G. (2002). “Estimating the effects of road mortality on turtle
populations.” Conservation Biology, 16(6), 1647-1652.
Gilbert, F., Gonzalez, A., & Evans-Freke, I. (2014). “Corridors maintain species
richness in the fragmented landscapes of a microecosystem.” Proceedings: Biological
Sciences, 265(1396), pp. 577-582.
Gunter, J.E. (1987). Georgia forest landowners manual. Retrieved from the University
of Georgia Warnell School of Forest Resources:
http://warnell.forestry.uga.edu/SERVICE/LIBRARY/index.php3?docID=47&docHistory
%5B%5D=6&docHistory%5B%5D=24
Harper, R.A. (2012). Georgia, 2011 – forest inventory and analysis facesheet. e-Science
Update SRS-053. Asheville, NC: US Department of Agriculture Forest Service, Southern
Rsearch Station.
Hastings, A. & Harrison, S. (1994). “Metapopulation dynamics and genetics.” Annual
Review of Ecology & Systematics, 25, 167-188.
Herrero, S., Higgins, A., Cardoza, J.E., Hajduk, L.I., & Smith, T.S. (2011). "Fatal attacks
by American black bear on people: 1900-2009." The Journal of Wildlife Management,
75(3), 596-603.
Hilty, J.A., Lidicker, W.Z. Jr., & Merenlender, A.M. (2006). Corridor ecology.
Washington DC: Island Press.
Huijser, M. P., McGowen, P. T., Fuller, J., Hardy, A., & Kociolek, A. (2007). Wildlife-
71
vehicle collision reduction study: report to congress (No. FHWA-HRT-08-034).
Jaeger, A.G.J. & Fahrig, L. (2004). "Effects of road fencing on population persistence."
Conservation Biology, 18(6), 1651-1657.
Johnson, E.A. & Klemens, M.W. (2005). Nature in fragments. West Sussex, NY: Columbia
University Press.
Kambourova-Ivanova, N., Koshev, Y., Popeorgiev, G., Ragyov, D., Pavlova, M., Mollov,
I., & Nedialkov, N. (2012). "Effect of traffic on mortality of amphibians, reptiles, birds
and mammals on two types of roads between Pazardzhik and Plovdiv region (Bulgaria) -
Preliminary results." ACTA Zoologica Bulgarica, 64(1), 57-67.
Kociolek, A.V., Clevenger, A.P., St. Clair, C.C., & Proppe, D.S. (2011). "Effects of road
networks on bird populations." Conservation Biology, 25(2), 241-249.
Land, D., & Lotz, M. (1996). Wildlife crossing designs and use by Florida panthers
and other wildlife in southwest Florida. Trends in Addressing Transportation Related
Wildlife Mortality, 323.
Levins, R. R. (1969). Some demographic and genetic consequences of environmental
heterogeneity for biological control. Entomol Soc Amer Bull, (3), 237-240.
Lindenmeyer, D.B. & Fischer, J. (2006). Habitat fragmentation and landscape change.
Washington DC: Island Press.
MacArthur, R.H. & Wilson, E.O. (1967). The Theory of Island Biogeography. Princeton, NJ:
Princeton University Press.
Maehr, D.S., Hoctor, T.S., Quinn, L.J., & Smith, J.S. (2001). Black bear habitat management
guidelines for Florida. Technical Report No. 17. Florida Fish and Wildlife Conservation
Commission, Tallahassee, Florida, USA.
Mata, C. (2003). Effectiveness of wildlife crossing structures and adapted culverts in a
highway in Northwest Spain. Retrieved from University of California, eScholarship Web
Site: http://escholarship.org/uc/item/3t24s427#page-1
McRae, B.H. (2012). Pinchpoint mapper connectivity analysis software. The Nature
Conservancy, Seattle WA. Available at: http://www.circuitscape.org/linkagemapper.
McRae, B.H. (2013). Pinchpoint mapper user guide version 1.0. Seattle, WA: The Nature
Conservancy. Retrieved from https://code.google.com/p/linkage-
mapper/downloads/detail?name=LinkageMapper1_0_8.zip
McRae, B.H., Beier, P., Dewald, L.E., Huynh, L. Y. & Keim, P. (2005). "Habitat barriers
limit gene flow and illuminate historical events in a wide-ranging carnivore, the
American puma." Molecular Ecology, 14(7), 1965-1977.
72
McRae, B.H., Hall, S.A., Beier, P., & Theobald, D.M. (2012). “Where to restore
ecological connectivity? Detecting barriers and quantifying restoration benefits.” PLoS
ONE, 7(12), e52604. doi:10.1371/journal.pone.0052604
McRae, B.H. & Kavanagh, D.M. (2011). Linkage mapper connectivity analysis software. The
Nature Conservancy, Seattle WA. Available at:
http://www.circuitscape.org/linkagemapper.
McRae, B.H. & Kavanagh, D.M. (2014). Linkage mapper user guide version 1.0. Seattle,
WA: The Nature Conservancy. Retrieved from https://code.google.com/p/linkage-
mapper/downloads/detail?name=LinkageMapper1_0_8.zip
McRae, B.H. & Shah, V.B. (2013). Circuitscape user’s guide. Santa Barbara, CA:
University of California. Retrieved from
https://circuitscape.googlecode.com/files/Circuitscape_3.5.8_User_Guide_rev3.pdf
Moritz, C. (2002). “Strategies to protect biological diversity and the evolutionary processes
that sustain it.” Systematic Biology 51(2), 238-254.
Natural Resources Spatial Analysis Labratory (NARSAL), University of Georgia. (September,
2012). Conservation lands of Georgia, 2012. Retrieved from
http://narsal.uga.edu/conservation-lands
Natural Resources Spatial Analysis Lab (NARSAL). Georgia landcover trends.
Retrieved February 21, 2014, from http://narsal.uga.edu/glut/data-stats/georgia-
landcover-trends
Natrual Resources Spatial Analysis Lab (NARSAL). Georgia land use trends. Retrieved
February 23, 2014, from http://narsal.uga.edu/glut
The Nature Conservancy (2013). 6,277 new acres protected along Altamaha River. Retrieved
February 26, 2014, from
http://www.nature.org/ourinitiatives/regions/northamerica/unitedstates/georgia/newsroom
/6277-new-acres-protected-along-altamaha-river.xml
North Carolina Wildlife Resources Commission (NCWRC) (2012). North Carolina black bear
management plan. NCWRC, Raleigh, North Carolina.
Nowak, D. J., & Walton, J. T. (2005). Projected urban growth (2000–2050) and its
estimated impact on the US forest resource. Journal of Forestry, 103(8), 383-389.
Pelton, M. R., Coley, A.B., Eason, T.H., Doan Martinez, D.L., Pederson, J.A., van Manen, F.T.,
& Weaver, K.M. (1999). American black bear conservation action plan. In Servheen C.,
Herrero S., & Peyton, B. (Eds.), Status survey and conservation action plan. Bears (pp.
144-156). Gland, Switzerland: IUCN.
73
Powell, R. (1986). “Black bear home range overlap in North Carolina and the concept of
home range applied to black bears.” Bears: Their biology and management 7, 235-242.
Rudis, V.A. & Tansey, J.B. (1995). “Regional assessment of remote forests and black
bear habitat from forest resource surveys.” The Journal of Wildlife Management, 59(1),
170-180.
Ruth, D. (2011). South Carolina black bear management and conservation strategy. Retrieved
from http://www.dnr.sc.gov/wildlife/publications/pdf/blackbearmanagmentDRAFT.PDF
Sandell, M. (1989). The mating tactics and spacing patterns of solitary carnivores. In
J. Gittleman (Ed.), Carnivore behavior, ecology, and evolution (pp. 164-182). Ithaca,
NY: Cornell University Press
Smith, D. J., Harris, L. D., & Mazzotti, F. J. (1996). A landscape approach to examining
the impacts of roads on the ecological function associated with wildlife movement and
movement corridors: problems and solutions (No. FHWA-PD-96-041).
Southeast Gap Analysis Project. (2007). Descriptions of ecological systems for
modeling of LANDFIRE biophysical settings. Retrieved from
http://www.basic.ncsu.edu/segap/datazip/region/se_lc_systems_descriptions.pdf
Southeast Gap Analysis Project (2011). Species analysis report: American black bear.
Retrieved from http://www.basic.ncsu.edu/segap/datazip/reports/SppReport_mABBE.pdf
Spencer, R.D., Beausoleil, R.A., & Martorello, D.A. (2007). “How agencies respond to human-
black bear conflicts: A survey of wildlife agencies in North America.” Ursus, 18(2), 217-
229.
Tewksbury, J.J., Levey, D.J., Haddad, N.M., Sargent, S., Orrock, J.L., Weldon, A.,
Danielson, B.J., Brinkerhoff, J., Damschen, E.I., & Townsend, P. (2002). “Corridors
affect plants, animals, and their interactions in fragmented landscapes.” Proceedings of
the National Academy of Sciences of the United States of America, 99(20), pp. 12923-
12926.
Transportation Research Board (2011). Guidelines for the preservation of high-
traffic-volume roadways. (No. S2-R26-RR-2). Washington, DC: Peshkin, D., Smith, L.,
Wolters, A., Krstulovich, J., Moulthrop, J., & Alvarado, C.
Treves, A. & Karanth, K.U. (2003). “Human-carnivore conflict and perspectives on
carnivore management worldwide.” Conservation Biology, 17(6), pp. 1491-1499.
University of Virginia Weldon Cooper Center for Public Service. (2013) Observed and
Total Population for the U.S. and the States, 2010-2040. Retrieved January 27, 2014.
www.coopercenter.org/demographics

74
US Census Bureau (2010). State & country quick facts. Retrieved February 14, 2014.
http://quickfacts.census.gov/qfd/index.html#
US Department of the Interior: U.S. Geological Survey. (2012). Southern coastal
plain. Drummond, M.A. Retrieved from
http://landcovertrends.usgs.gov/east/eco75Report.html.
US Department of Transportation Federal Highway Administration (US FHWA) (2008).
Wildlife-vehicle collision reduction study. (Publication No. FHWA-HRT-08-034).
McLean, VA: Huijser, M.P., McGowen, P., Fuller, J., Hardy, A., Kociolek, A.,
Clevenger, A.P., Smith, D., & Ament, R.
US Department of Transportation Federal Highway Administration (US FHWA) (2009).
Manual on uniform traffic control devices. Retrieved from
http://mutcd.fhwa.dot.gov/pdfs/2009r1r2/pdf_index.htm
US Department of Transportation Federal Highway Administration (US FHWA) (2010).
Highway statistics 2010. Washington, DC. Retrieved from
https://www.fhwa.dot.gov/policyinformation/statistics/2010/
US Department of Transportation Federal Highway Administration (US FHWA). (2012).
Deficient bridges by state and highway system. Available from the National Bridge
Inventory database, http://www.fhwa.dot.gov/bridge/deficient.cfm
US Department of Transportation (US DOT) (2011). Wildlife crossing structure handbook
design and evaluation in North America (Publication No. FWHA-CFL/TD-11-003).
Lakewood, CO: Clevenger, A.P. & Huijser, M.P. Retrieved from
http://www.cflhd.gov/programs/techdevelopment/wildlife/
US Fish and Wildlife Service (USFWS). Okefenokee national wildlife refuge. Retrieved March
30, 2014, from http://www.fws.gov/okefenokee/
US Fish and Wildlife Service (USFWS) (2013). Threatened and endangered species.
Retrieved February 6, 2014, from http://www.fws.gov/athens/endangered.html
US Fish and Wildilfe Service (USFWS) (2012). Partners for fish & wildlife. Retrieved January
16, 2014, from http://www.fws.gov/athens/partners.html
Washington Wildlife Habitat Connectivity Working Group (WHCWG). (2010).
Washington connected landscapes project: Statewide analysis. Retrieved from
http://waconnected.org/wp-content/themes/whcwg/docs/statewide-
connectivity/2010DEC%2017%20WHCWG%20Statewide%20Analysis%20FINAL.pdf
Weldon Cooper Center for Public Service (WCCPS) (2013). Observed and total population
for the U.S. and the States, 2010-2040. Retrieved January 27, 2014, from University of
Virginia Demographics Research Group.

75
Westemeier, R.L., Brawn, J.D., Simpson, S.A., Esker, T.L., Jansen, R.W., Walk, J.W.,
Kershner, E.L., Bouzat, J.L., & Paige, K.N. (1998). “Tracking the long-term decline and
recovery of an isolated population.” Science, 282(5394), 1695-1698.
Wooding, J.B., Cox, J.A., & Pelton, M.R. (1994). Distribution of black bears in the
southeastern coastal plain. In Annual Conference of Southeastern Association of Fish and
Wildlife Agencies (Vol. 48, pp. 270-275).