opinion of the company on the tender offer
TRANSCRIPT
- Translation -
Opinion of the Company on the Tender Offer
(Form 250-2)
of
President Bakery Public Company Limited
The Tender Offeror
Thai President Foods Public Company Limited
Independent Financial Advisor to the Shareholders
Grant Thornton Services Limited
19 September 2018
"This English translation has been prepared solely for the convenience of the foreign shareholders of President Bakery Public Company
Limited and should not be relied upon as the definitive and official document. The Thai version is the definitive and official document and
shall prevail in all respects in the event of any inconsistency with this English translation..
- Translation -
ACE_18_09_153
19 September 2018
Subject Submission of the Opinion of the Company on the Tender Offer (Form 250-2) of President Bakery
Public Company Limited and Opinion of the Independent Financial Advisor on the Tender Offer
To Secretary General of the Office of the Securities and Exchange Commission
President of the Stock Exchange of Thailand
Shareholders of President Bakery Public Company Limited
Enclosed 1. Copy of the Opinion of the Company on the Tender Offer (Form 250-2)
2. Copy of the Opinion of the Independent Financial Advisor on the Tender Offer
Pursuant to President Bakery Public Company Limited (1Company2 ) receipt of a copy of the Tender
Offer (Form 247-4) dated 29 August 2018 from Thai President Foods Public Company Limited as the Offeror,
the Company has prepared the Opinion of the Company on the Tender Offer (Form 250-2) and appointed Grant
Thornton Services Limited as an independent financial advisor to the shareholders of the Company in order to
prepare an opinion on the tender offer.
The Company hereby submits the Opinion of the Company on the Tender Offer (Form 250-2) and a
copy of the Opinion of the independent Financial Advisor on the Tender Offer to the Office of the Securities and
Exchange Commission, the Stock Exchange of Thailand, and the shareholders of the Company for your
consideration. The details are set out in the enclosure.
Please be informed accordingly.
Yours sincerely
7777.7777777777777777777..
(Mr. Apichart Thammanomai , Ms. Petcharat Anantawichai)
Director
Table of contents
Page
Section 1 Status of the Company relating to the historical and forecast operating 2
results, including the assumptions used in the forecast
Section 2 Opinion on the correctness of the Company’s information stated in the 19
Tender Offer
Section 3 Any relationship or agreement between the Company’s directors
and the Tender Offeror (either on behalf of oneself, as a director of the
Company, or as a representative of the Offeror), shareholding
in the Tender Offeror by the Company’s directors, and existing or
prospective contract/agreement between each other in various
areas (e.g. management, etc.)
3.1 Relationship between the Company�s directors and the Tender Offeror 20
3.2 Shareholding in the Tender Offeror by of the Company�s directors 20
3.3 Business operation in joint with or between each other 21
3.4 Existing or prospective contract/agreement between each other in 22
various areas
Section 4 Opinion of the Board of Directors of the Company to the security holders
4.1 Rationale to accept or reject the Tender Offer 23
4.2 Opinion and rationale of each director of the Company and the 24
number of shares held by each director (only in the case
where the opinion of the Company�s directors in 4.1 is not
unanimous)
4.3 Benefits and impacts from the business plan and policies stated in 24
the Tender Offer, including the feasibility of said plan and policies
4.4 Additional opinion of the Board of Directors of the Company (only in 26
the case where the Tender Offer is a tender offer to delist the security
from the SET)
Section 5 Opinion of the advisor to the shareholders who is a financial advisor 26
in the list approved by the Office of the SEC

Page 1
Opinion of the Company on the Tender Offer
19 September 2018
To: Security holders of President Bakery Public Company Limited
On 29 August 2018, President Bakery Public Company Limited (hereafter referred to as &PB', the
&Business' or the &Company') received a copy of the Tender Offer (Form 247-4) from Thai President Foods
Public Company Limited (hereafter referred to as &TFMAMA') (Collectively referred to as the &Tender
Offeror'). The details are as follows:
Number of offered securities Offered securities as a
percentage
Offer price per
unit Offer value
Security type Share/units Voting rights
Of total
issued
securities
of the
Company
Of total
voting rights
of the
Company
Common shares 238,937,200 238,937,200 53.10 53.10 61.16 14,613,399,152
Preferred shares
Warrant
Convertible
debenture
Other securities (if
any)
Total 53.10 Total 14,613,399,152
Tender offer price and tender offer period
The offer price of PB common share is THB 61.16 (Sixty-one baht sixteen satang) per share (the &Offer
Price'). In addition, the shareholders who accepted the Tender Offer (&Offeree') will be subject to a
brokerage fee of 0.25% of the Offer Price and value-added-tax (&VAT') of 7.00% the brokerage fee.
Therefore, the net price that the Offeree will receive is THB 60.996397 (Sixty point nine-nine-six-three-nine-
seven baht). The Offer Period will be for a total of 45 business days during 9:00 a.m. to 4:00 p.m. on any
business day from 3 September 2018 to 6 November 2018 (the &Offer Period'). The Offer Price is the final
offer which will not be changed and the Offer Period is the final period which will not be extended, subject to
the following conditions:

Page 2
� The Tender Offeror may reduce the Offer Price or extend the Offer Period in the case of any
event or action occurring during the Offer Period which causes severe damage to the status or
assets of the Company
� The Tender Offeror may change the offer or extend the Offer Period to compete with other
offeror who submitted a tender offer for shares of the Business during the Offer Period.
Conditions for the cancellation of the Tender Offer
The Tender Offeror may cancel the Tender Offer upon the occurrence of one or more of the following
events:
� any event or action occurring after the submission of the Tender Offer to the Office of the Securities
and Exchange Commission (the &SEC') but within the Offer Period which causes or may cause
severe damage to the status or the assets of the Business, where such event or action has not
resulted from the actions of the Tender Offeror or actions for which the Tender Offeror is
responsible; or
� any action conducted by the Business after the submission of the Tender Offer to the SEC but
within the Offer Period which causes or may cause a significant decrease in the value of the
securities of the Business; or
� any action conducted by the Business as defined in the Notification of the Capital markets
Supervisory Board No. TorChor. 14/2554 Re: Actions or exempt of actions that may affect the result
of Tender Offer dated 25 July 2011 (as amended).
Tender Offer Revocation Period
The Offeree can revoke the acceptance of the Tender Offer at the office of the Tender Offer Agent
during 9:00 a.m. to 4:00 p.m. on any business day from 3 September 2018 to 5 October 2018 (totaling 25
business days).
PB has considered the Tender Offer in the interest of the security holders and hereby express our
opinion for your consideration as follows:
1. Status of the Company relating to the historical and forecast operating results, including the
assumptions used in the forecast
1.1 Business Overview
PB is a public company with common shares as listed security on the SET. The Company was
incorporated on 29 October 1980 and listed on the SET since 25 December 2002. At present, PB has
registered capital of THB 450,000,000, consisting of 450,000,000 common shares at the par value of THB
Page 3
1 per share, and paid-up capital of THB 450,000,000, consisting of 450,000,000 common shares at the par
value of THB 1 per share. The Company is headquartered at 121/84-85 RS Tower, 29th Floor, Ratchadapisek
road, Din Daeng sub-district, Din Daeng district, Bangkok 10400. The Company is primarily engaged in the
production and sales of bread and bakery under the trademarks such as &Farm House', &Deliya' and
&Madame Marco'. The business lines consist of wholesale bakery, retail bakery, fast food & catering and
export.
1. Wholesale Bakery
The Company manufactures and distributes bakery products under the trademark &Farmhouse' in
wholesale to various channels and shops. The main customers are modern trade shops and traditional retail
shops, which are: Hypermarts (e.g. Tesco Lotus, Big C, Makro, etc.); Departmentstores (e.g. Tanghuaseng,
Tokyu,etc), Supermarkets (e.g. The Mall, Tops, Foodland, Max value, etc.); Convenience stores (e.g. 7 -
eleven, Tesco Lotus Express, Central Familymart, Lawson 108, Mini Big C, CJ Express, Supercheap etc.);
Shops in gasoline stations (e.g. Jiffy, PTB Mart , etc.); and Traditional retail shops (e.g. small retail shops in
schools, factories, welfare shop in official places, etc.). Products distributed in wholesale bakery business
are sliced bread, burger buns and hot dog buns, snack bread, snack cake and confectionery.
2. Retail Bakery
The Company distributes products through retail stores of the Company and directly sell to customers
under the CompanyCs trademarks such as Deliya, Madame Marco, Good Morning Farmhouse, and vending
machines.
3. Fast food & Catering
These products are made to order and sold to fast food chains such as McDonald, KFC, Pizza Hut,
Chester Grill, A&W, Santafe Steak, Jeffer Steak, MosBurger (from Japan), and Minor Food Group (Burger
King, Sizzler, Diary Queen, and The Pizza Company, etc.), as well as restaurant and coffee businesses such
as Chocolate Ville and The Coffee Club, which are well-known restaurants with the high sales volume
throughout the world including Thailand.
4. Export Business
The Company has developed products to be distributed to coffee shop chain and pizza shop
customers in Japan, which are well-known. The company sells its product through domestic agents that
export such products to customers in Japan.
As of 30 June 2018, PB has investment in other entities of which PB owns at least 10.00 percent
shares, as follows:
Page 4
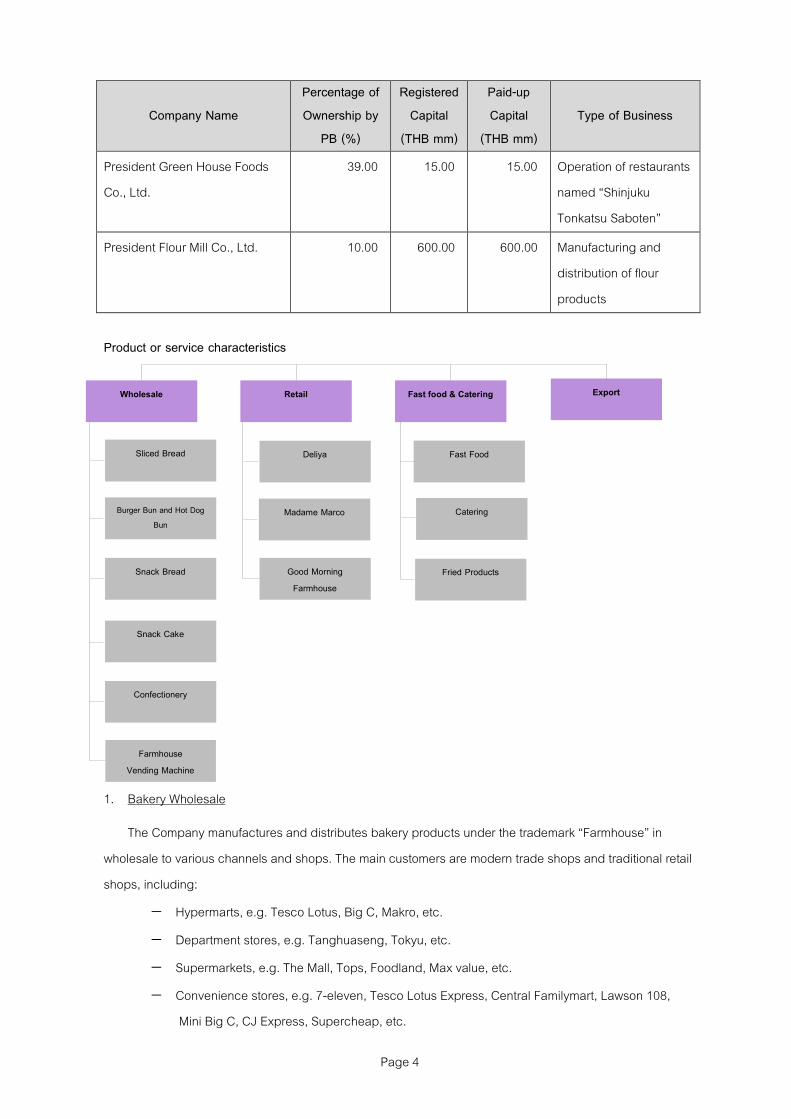
Product or service characteristics
1. Bakery Wholesale
The Company manufactures and distributes bakery products under the trademark &Farmhouse' in
wholesale to various channels and shops. The main customers are modern trade shops and traditional retail
shops, including:
− Hypermarts, e.g. Tesco Lotus, Big C, Makro, etc.
− Department stores, e.g. Tanghuaseng, Tokyu, etc.
− Supermarkets, e.g. The Mall, Tops, Foodland, Max value, etc.
− Convenience stores, e.g. 7-eleven, Tesco Lotus Express, Central Familymart, Lawson 108,
Mini Big C, CJ Express, Supercheap, etc.
Company Name
Percentage of
Ownership by
PB (%)
Registered
Capital
(THB mm)
Paid-up
Capital
(THB mm)
Type of Business
President Green House Foods
Co., Ltd.
39.00 15.00 15.00 Operation of restaurants
named &Shinjuku
Tonkatsu Saboten'
President Flour Mill Co., Ltd. 10.00 600.00 600.00 Manufacturing and
distribution of flour
products
Wholesale Retail Fast food & Catering
Burger Bun and Hot Dog
Bun
Snack Bread
Snack Cake
Confectionery
Deliya
Madame Marco
Good Morning
Farmhouse
Fast Food
Catering
Fried Products
Sliced Bread
Farmhouse Vending Machine
Export
Page 5
− Shops in gasoline stations, e.g. Jiffy, PTB Mart, etc.
− Traditional retail shops, e.g. small retail shops in schools, factories, welfare shop in official
places, etc.
Product Distribute in Wholesale Bakery Business are
1.1 Sliced Bread
Sliced Bread is the first product that is manufactured, distributed and considered as the product that
create the most awareness of consumers on Farmhouse Brand from the past to the present. Sliced bread is
the core product in generating revenue for the Company, with the nature of the product that allow
consumers to consume it in various ways and are suitable for all age, gender and every family members.
Originally, the Company only offered plain sliced bread, however, due to product development, varieties of
products that comes in different sizes are offered, which are:
(1) White Bread
White bread is in the sliced bread group with the texture of white loaf bread. The product is suitable
with all age and gender. White bread can be used at all time and used as ingredients for several kind of
food. Type of goods in this group are 480 grams Sliced bread, 240 grams Sliced bread, 220 grams
Crustless sliced bread, and 275 grams Royal bread, 240 grams Hokkaido Milk Flavored bread.
(2) Grain Bread
Sliced bread with a large amount of varieties of grains as the ingredients to increases nutrition
value, which is inline with ThaiCs lifestyle that concerned more about health, especially consuming healthier
food. Product in this group available for distribution consisted of 500 g. Whole wheat bread, 250 g. Whole
wheat bread, and 250 g. Fine whole wheat bread, which is easier to consume and suitable for children
including health conscious customer group who dislikes the original whole wheat texture. Moreover, Royal
whole wheat, a 285 grams soft and thick sliced whole wheat bread and Royal 12 grains, a 285 grams rich,
soft and thick sliced bread with 12 kinds of nutritious grains.
1.2 Burger Bun and Hot Dog Bun
The Company distributes Burger bun with sesame seed and Hotdog roll which are the product that can
be used in various menus such as Burgers and Hotdogs with various fillings etc.
1.3 Snack Bread
Snack bread is ready-to-eat bakery product packed in an individual package; just right for one serving,
which is suitable with the lifestyle of urban consumers with time-driven, seeking for something fast,
convenience, portable and can be consumes at anytime and anywhere. The products which come in
different types, varieies of tastes and suitable for all target group, students, pupils, working people and
everyone. Products in the group are Triangle sandwiches Butter roll, Mini loaf raisin bread, Daily Sandwich,
Sweet Sandwich, Filled bun with sweet fillings and meat fillings, spread bread, Pae bread, Raisin bread, Hotdog
cream bun and Trio bread. In 2017, new products were launched which are Tuna corn salad whole wheat sandwich,
Durian custard filled bun, Hokkaido milk flavour cream filled hotdog bread 50 grams, Durian almond flavour cream
Page 6
filled hotdog bread, Mini pack taro flavoured sliced bread, Mini pack coconut cream pandan flavoured sliced bread,
Pae bread with butter coconut flavour.
1.4 Snack Cake
The company foresee the present market gap that no snack cake with acceptable standard were
offered and due to the companyCs readiness as well as being an expertise in manufacturing cake by
specialist, snack cakes were then developed to be distribute. Snack cake group products that the company
manufactures and distributes consisted of banana cake, 4 flavors of cake roll which consisted of coffee
flavoured cake roll, pandan flavoured cake roll, orange flavoured cake roll, vanilla flavoured cake roll. The
company also offer 4 flavors of Dorayaki which are Dorayaki with custard cream filling, Dorayaki with
chocolate filling, Dorayaki with almond cream filling, Dorayaki with chocolate chip filling. Sandwich Cake 3
flavors; Sandwich cake coffee flavoured cake, Sandwich cake vanila flavoured cake, Sandwich cake
pandan flavoured cake. Moreover, 5 flavors of Donut cake that we offer are vanilla custard, chocolate
custard, pandan, Hokkaido melon and Choco Banana. In 2017, new products was launched which is
Hokkaido flavoured cake roll.
1.5 Other Bakery Products
Confectionery Products of the Company consists of &Butter Toast', &Mini Butter Toast'( only sold at
small shops(traditional retail shops), four-flavour cookies including &Butter Cookies', &Mixed Fruit Cookies',
&Raisin Cookies', &Cookies with Chocolate Chip', three-flavour pie including &Pineapple Pie', &Strawberry
Fruit Pie', &Blueberry Fruit Pie'. The Company has launched new products in 2017, such as &Butter Cookies
Vanilla', &Butter Cookies Chocolate', &Butter Cookies Hokkaido milk', and &Raisin Butter Toast'.
The Company also introduced new &Pastry' products in 2017; such as Pineapple Pie, Taro Pie.
1.6 Farmhouse Vending Machine
In order to provide convenience for the customers, the Company expended new distribution channel
via automatic vending machine to be installed at many places, such as offices, hospitals, factories,
commercial banks. The Company has launched total of 43 vending machine in 2017.
2. RETAIL BUSINESS
Company distribute products through CompanyCs retail shops and sale directly to customers under the
CompanyCs trademark through these outlets.
2.1 Deliya by Farmhouse
Due to the policy in expanding into bread and bakery retail business, which has the tendency to grow
in the future along with the experiences and credibility in bread and bakery business, the company then
decided to open Deliya by Farmhouse shop. Deliya by Farmhouse baked and distributed fresh homemade
bread and bakery product, offering different kind of bread as well as offer bakery snack box that deliver
throughout Bangkok and Perimeter. As of the end of the year 2017, there are 7 branches; Chitrada School,
Lotus-Lumlukka Klong 2 branch, R.S. Tower Building Ratchada, Government Complex Chaeng Wattana,
The Mall 2 Ramkamhaeng, Paradise Park and The Mall Bangkapi.
Page 7
In addition, Deliya has received made-to-order manufacturing, such as sandwich bread, cake, and
bakery for Lawson Shops.
2.2 Madame Marco
Homemade soft texture cake, an original European style recipes that are deliciously baked in every
steps. Starting from selecting quality raw materials both from domestic and international, which are baked
through clean and punctilious production process combine with made to order system is the uniqueness of
Madame Marco cake. As a result, Madame Marco cakes will always be delicious and freshly bake with a
taste of true European every order, along with free delivery service within Bangkok and perimeter. This allow
Madame Marco to be &The European Delight'
At present, Madame Marco has increased the distribution channels by opening 23 branches of
Madame Marco shops which are located at Siam Paragon, The Mall-Ngam Wongwan, The Mall - Bang Kae,
The Mall - Bangkapi, The Mall 2 - Ramkamhaeng, Tesco Lotus Sri Nakarin, The Mall Thapra, Mega Bangna,
Paradise Park, Fashion Island, Central Salaya, The Emporium Crystal Rajapruek, The Emquartier, Robinson
Srisaman, Future Park Rangsit, Tops Central Pinkloa, Tops Central Westgate, Tops Central Bang Na, Tops
Central Rama 3, Terminal 21, Tops Central Eastville and Tops Central Ladprao.
Madame Marco cakes offer free delivery both in Bangkok and Perimeter. For more information please
contact our call center at 0-2326-0200-3.
2.3 Good Morning Farmhouse
Good Morning Farmhouse is the channel to distribute our products to sandwich selling
representatives in the business pattern predetermined by the Company. The Company aims at promoting
popularity of bread consumption among general consumers and supporting general people to have career
and extra income. Such selling representative will purchase the products of the Company to be the
ingredients for making sandwiches according to the consumersC choice. The Company shall select the
representatives located in marketable location and being ready to provide quality services, as well as
support training of selling knowledge. As of the end of 2017, the Company has 47 Good Morning Farmhouse
selling representatives, decreasing representatives due to the governmental measure to restrict street
vendors.
3. FAST FOOD & CATERING
This products are manufactured and distributed base on the order placed by the customers which are
fast food stores such as McDonald, KFC, Pizza Hut, Chester Grill, A&W, Santafe Steak, Jeffer Steak,
MosBurger (from Japan). For Minor Food Group Chain consist of Burger King, Sizzler, Dairy Queen, and The
Pizza Company etc, as well as restaurant businesses and coffee shops such as Chocolate Ville, and The
Coffee Club, S&P, which are the well-known restaurant with the highest sales volume worldwide including
Thailand.

Page 8
3.1 Fastfood & Catering
(1) Fastfood
Burger and Hotdog buns come in various sizes as well as with and without sesames. The
Company uses full automatic manufacturing process to manufacture burger and hotdog buns with the
capacity of 36,000 pieces/hr. including other products such as french bread, croissant, crispy toast bread
and products that were developed to satisfy the customers. By which in the year 2017, the Company
manufactured Sweet Cornmeal Bun for McDonald. At present, the company is considered as the largest
bread supplier in the country.
Additionally, frozen dough is another product that the company produces & distributes, which
comes in different sizes based on the order placed by fast food stores. The Company has continuously
researches and develops to continue expanding the market of such products.
(2) Catering
Apart from fast food, the Company also expanded the distribution channels into restaurants
and coffee shop businesses that required bakery in their menus. Our distribution consists of existing
products and newly developed products to serve each particular group of customers.
3.2 Fried Products
Product group that are use as ingredients in fried food dishes and are well-liked by Thai
consumers such as bread crumbs, which are made from special recipe of freshly baked bread resulting in
the standard size of crumbs. The creamy white flakes are not too finely ground and perfectly coated the
food, making the fried dish golden and appetizing as well as delicious, crispier and does not absorb oil.
Farmhouse bread crumbs are suitable for frying both meat and vegetable.
4. EXPORT BUSINESS
The Company has develop products to be distribute to Coffee Shop Chain and Pizza Shop customers in
Japan, which are well-known. The Company distributes its product through domestic agent to import such
products to customer in Japan.
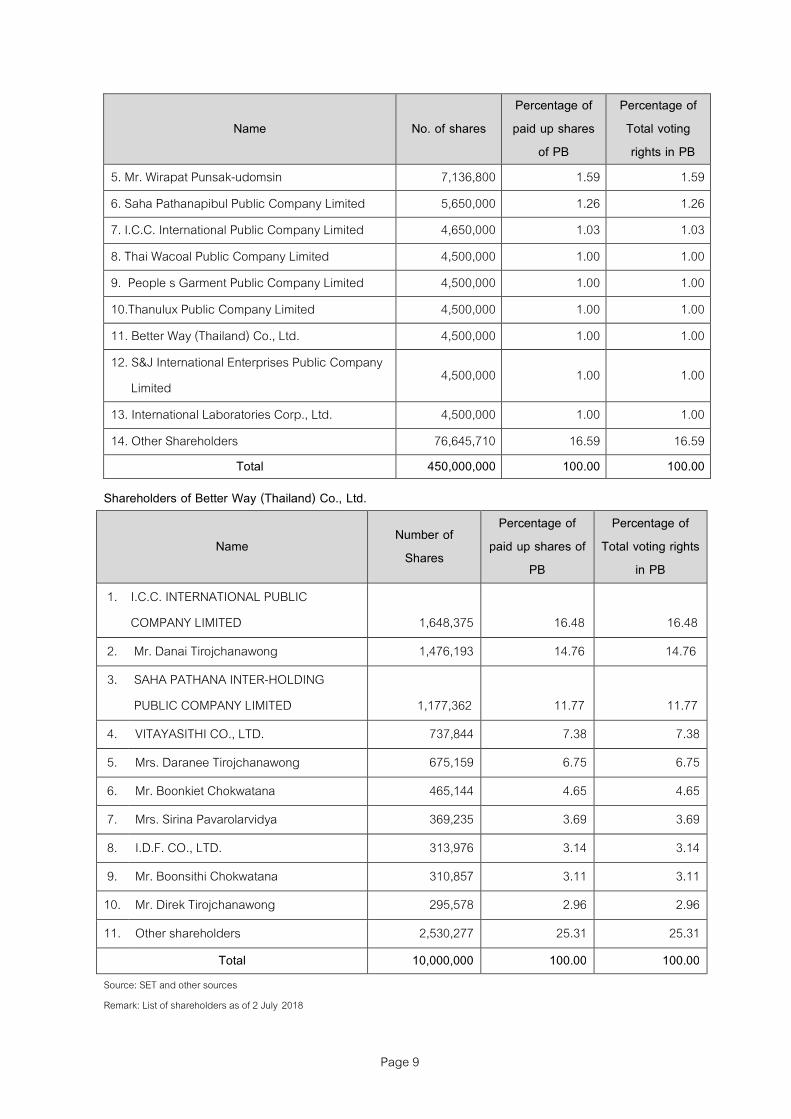
1.2 The shareholding structure of the Business
The list of top 13 shareholders on the latest shareholder registry of the Business as of 29 August 2018
(which is the book closing date for the right to receive dividend), is as follows:
Name No. of shares
Percentage of
paid up shares
of PB
Percentage of
Total voting
rights in PB
1. Thai President Foods Public Company Limited 211,062,800 46.90 46.90
2. Saha Pathana Inter- holding Public Company
Limited 97,127,400 21.58 21.58
3. Mr. Pipat Paniangvait 14,202,750 3.16 3.16
4. Miss Apiradee Thammanomai 8,524,540 1.89 1.89
Page 9
Name No. of shares
Percentage of
paid up shares
of PB
Percentage of
Total voting
rights in PB
5. Mr. Wirapat Punsak-udomsin 7,136,800 1.59 1.59
6. Saha Pathanapibul Public Company Limited 5,650,000 1.26 1.26
7. I.C.C. International Public Company Limited 4,650,000 1.03 1.03
8. Thai Wacoal Public Company Limited 4,500,000 1.00 1.00
9. People s Garment Public Company Limited 4,500,000 1.00 1.00
10.Thanulux Public Company Limited 4,500,000 1.00 1.00
11. Better Way (Thailand) Co., Ltd. 4,500,000 1.00 1.00
12. S&J International Enterprises Public Company
Limited 4,500,000 1.00 1.00
13. International Laboratories Corp., Ltd. 4,500,000 1.00 1.00
14. Other Shareholders 76,645,710 16.59 16.59
Total 450,000,000 100.00 100.00
Shareholders of Better Way (Thailand) Co., Ltd.
Name Number of
Shares
Percentage of
paid up shares of
PB
Percentage of
Total voting rights
in PB
1. I.C.C. INTERNATIONAL PUBLIC
COMPANY LIMITED
1,648,375
16.48
16.48
2. Mr. Danai Tirojchanawong 1,476,193 14.76 14.76
3. SAHA PATHANA INTER-HOLDING
PUBLIC COMPANY LIMITED
1,177,362
11.77
11.77
4. VITAYASITHI CO., LTD. 737,844 7.38 7.38
5. Mrs. Daranee Tirojchanawong 675,159 6.75 6.75
6. Mr. Boonkiet Chokwatana 465,144 4.65 4.65
7. Mrs. Sirina Pavarolarvidya 369,235 3.69 3.69
8. I.D.F. CO., LTD. 313,976 3.14 3.14
9. Mr. Boonsithi Chokwatana 310,857 3.11 3.11
10. Mr. Direk Tirojchanawong 295,578 2.96 2.96
11. Other shareholders 2,530,277 25.31 25.31
Total 10,000,000 100.00 100.00
Source: SET and other sources
Remark: List of shareholders as of 2 July 2018
Page 10
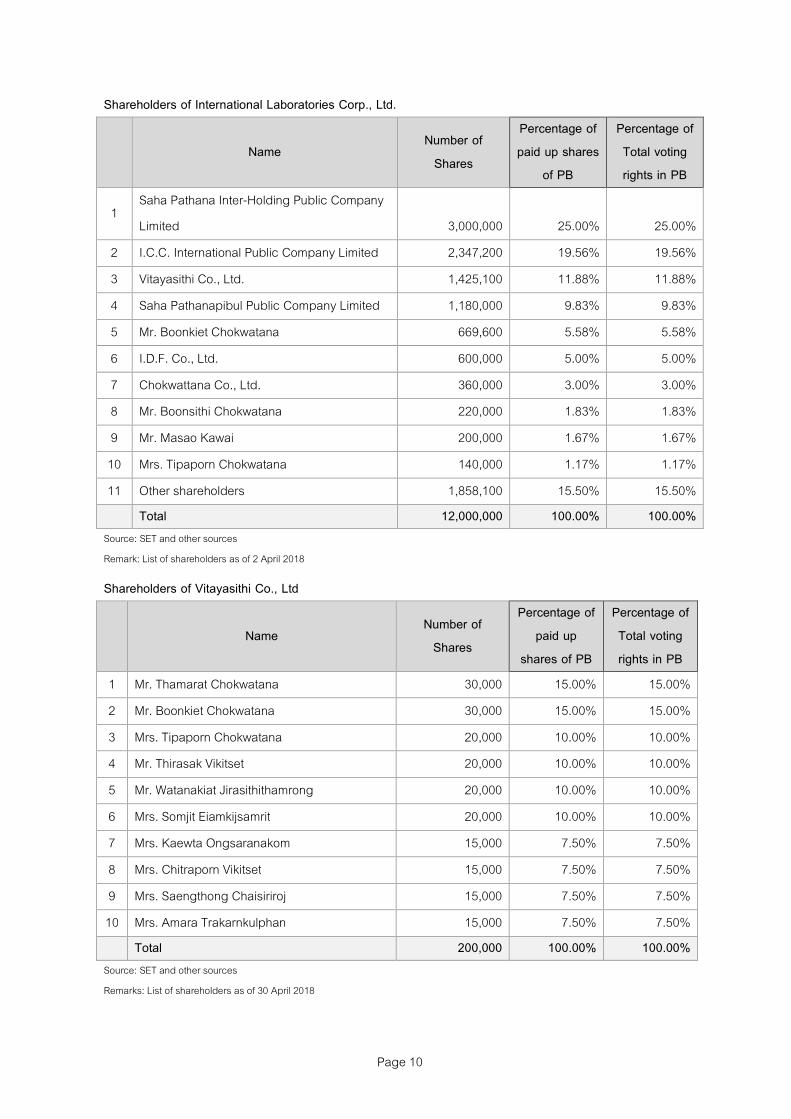
Shareholders of International Laboratories Corp., Ltd.
Name Number of
Shares
Percentage of
paid up shares
of PB
Percentage of
Total voting
rights in PB
1 Saha Pathana Inter-Holding Public Company
Limited 3,000,000 25.00% 25.00%
2 I.C.C. International Public Company Limited 2,347,200 19.56% 19.56%
3 Vitayasithi Co., Ltd. 1,425,100 11.88% 11.88%
4 Saha Pathanapibul Public Company Limited 1,180,000 9.83% 9.83%
5 Mr. Boonkiet Chokwatana 669,600 5.58% 5.58%
6 I.D.F. Co., Ltd. 600,000 5.00% 5.00%
7 Chokwattana Co., Ltd. 360,000 3.00% 3.00%
8 Mr. Boonsithi Chokwatana 220,000 1.83% 1.83%
9 Mr. Masao Kawai 200,000 1.67% 1.67%
10 Mrs. Tipaporn Chokwatana 140,000 1.17% 1.17%
11 Other shareholders 1,858,100 15.50% 15.50%
Total 12,000,000 100.00% 100.00%
Source: SET and other sources
Remark: List of shareholders as of 2 April 2018
Shareholders of Vitayasithi Co., Ltd
Name
Number of
Shares
Percentage of
paid up
shares of PB
Percentage of
Total voting
rights in PB
1 Mr. Thamarat Chokwatana 30,000 15.00% 15.00%
2 Mr. Boonkiet Chokwatana 30,000 15.00% 15.00%
3 Mrs. Tipaporn Chokwatana 20,000 10.00% 10.00%
4 Mr. Thirasak Vikitset 20,000 10.00% 10.00%
5 Mr. Watanakiat Jirasithithamrong 20,000 10.00% 10.00%
6 Mrs. Somjit Eiamkijsamrit 20,000 10.00% 10.00%
7 Mrs. Kaewta Ongsaranakom 15,000 7.50% 7.50%
8 Mrs. Chitraporn Vikitset 15,000 7.50% 7.50%
9 Mrs. Saengthong Chaisiriroj 15,000 7.50% 7.50%
10 Mrs. Amara Trakarnkulphan 15,000 7.50% 7.50%
Total 200,000 100.00% 100.00%
Source: SET and other sources
Remarks: List of shareholders as of 30 April 2018
Page 11
Because Saha Pathanapibul Public Company Limited, I.C.C. International Public Company Limited,
Pracha Aporn Public Company Limited, Thai Wacoal Public Company Limited, Thanulux Public Company
Limited and S&J International Enterprises Public Company Limited are public company, the list of
shareholder can be found in SET website.
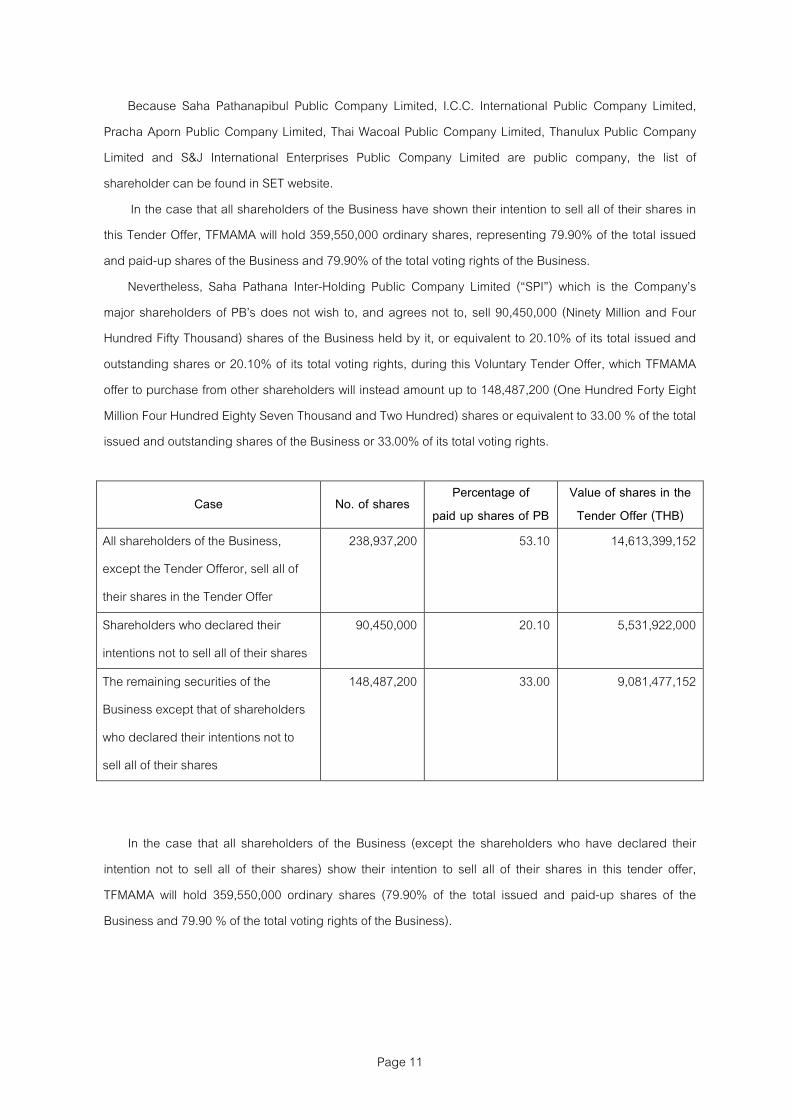
In the case that all shareholders of the Business have shown their intention to sell all of their shares in
this Tender Offer, TFMAMA will hold 359,550,000 ordinary shares, representing 79.90% of the total issued
and paid-up shares of the Business and 79.90% of the total voting rights of the Business.
Nevertheless, Saha Pathana Inter-Holding Public Company Limited (&SPI') which is the CompanyCs
major shareholders of PBCs does not wish to, and agrees not to, sell 90,450,000 (Ninety Million and Four
Hundred Fifty Thousand) shares of the Business held by it, or equivalent to 20.10% of its total issued and
outstanding shares or 20.10% of its total voting rights, during this Voluntary Tender Offer, which TFMAMA
offer to purchase from other shareholders will instead amount up to 148,487,200 (One Hundred Forty Eight
Million Four Hundred Eighty Seven Thousand and Two Hundred) shares or equivalent to 33.00 % of the total
issued and outstanding shares of the Business or 33.00% of its total voting rights.
Case No. of shares Percentage of
paid up shares of PB
Value of shares in the
Tender Offer (THB)
All shareholders of the Business,
except the Tender Offeror, sell all of
their shares in the Tender Offer
238,937,200 53.10 14,613,399,152
Shareholders who declared their
intentions not to sell all of their shares
90,450,000 20.10 5,531,922,000
The remaining securities of the
Business except that of shareholders
who declared their intentions not to
sell all of their shares
148,487,200 33.00 9,081,477,152
In the case that all shareholders of the Business (except the shareholders who have declared their
intention not to sell all of their shares) show their intention to sell all of their shares in this tender offer,
TFMAMA will hold 359,550,000 ordinary shares (79.90% of the total issued and paid-up shares of the
Business and 79.90 % of the total voting rights of the Business).

Page 12
Name
No. of
shares
Percentage of
paid up
shares of PB
Percentage of
Total voting
rights of PB
1 The Tender Offeror : Thai President Foods Public
Company Limited 359,550,000 79.90 79.90
2 Shareholders who declare their intentions not to sell
all of their shares in this Tender Offer /1 90,450,000 20.10 20.10
รวม 450,000,000 100 100
Remark: /1 SPI agrees to temporarily deposit the share certificates evidencing of 90,450,000 shares from 97,127,400 shares in a safe box in respect of which the Offeror
has entered into a rental agreement with Bangkok Bank Public Company Limited, for the lock-up term covering the entire Tender Offer Period;
1.3 The Board of Directors
The Board of Directors as of 15 August 2018 (before the Tender Offeror has acquired the shares of the
Business)
Name of Directors Position
1. Mr. Pipat Paniangvait Chairman of the Board
2. Mr. Apichart Thammanomai Managing Director
3. Mr. Apisate Thammanomai Deputy Managing Director
4. Mr. Vichai Kulsomphob Director
5. Dr. Pojjanee Paniangvait Director
6. Mr. Pun Paniangvait Director
7. Mrs. Malee Tangjaisanong Director
8. Miss Petcharat Anantawichai Director
9. Mr. Thavach Keawpitag Director
10. Miss Panida Prayottaweekij Director
11. Prof. Dr. Teravuti Boonyasopon Chairman of Audit Committee and Independent
12. Mr. Boonsak Chiempricha Independent Director
13. Prof. Dr. Suwimon Keeratipibul Audit Committee and Independent Director
14. Dr. Yupa Soontrapa Audit Committee and Independent Director
15. Mrs. Aim-On Pathumaruk Audit Committee and Independent Director
Note: Currently, the Tender Offerors have no intention to change the Board of Directors within 12 months from the end of
Offer Period. However, after the Tender Offer, the Tender Offerors may change the Board of Directors for the
appropriateness by considering various factors for the interest of PB i.e. business plan and strategy to adjust to the
changes of the market and consumer needs and, competitiveness and future growth; if there are any changes
aforementioned, the Tender Offerors will comply with the relevant laws and regulations that are effective at that time.
Page 13
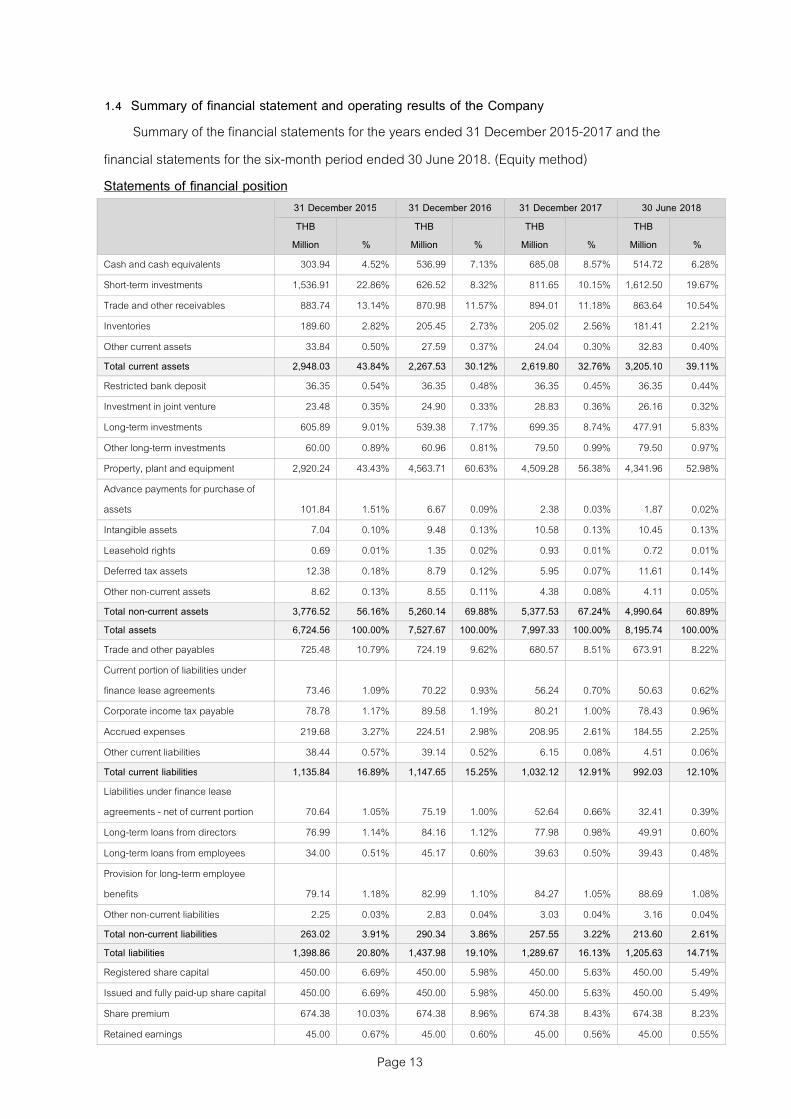
1.4 Summary of financial statement and operating results of the Company
Summary of the financial statements for the years ended 31 December 2015-2017 and the
financial statements for the six-month period ended 30 June 2018. (Equity method)
Statements of financial position
31 December 2015 31 December 2016 31 December 2017 30 June 2018
THB
Million %
THB
Million %
THB
Million %
THB
Million %
Cash and cash equivalents 303.94 4.52% 536.99 7.13% 685.08 8.57% 514.72 6.28%
Short-term investments 1,536.91 22.86% 626.52 8.32% 811.65 10.15% 1,612.50 19.67%
Trade and other receivables 883.74 13.14% 870.98 11.57% 894.01 11.18% 863.64 10.54%
Inventories 189.60 2.82% 205.45 2.73% 205.02 2.56% 181.41 2.21%
Other current assets 33.84 0.50% 27.59 0.37% 24.04 0.30% 32.83 0.40%
Total current assets 2,948.03 43.84% 2,267.53 30.12% 2,619.80 32.76% 3,205.10 39.11%
Restricted bank deposit 36.35 0.54% 36.35 0.48% 36.35 0.45% 36.35 0.44%
Investment in joint venture 23.48 0.35% 24.90 0.33% 28.83 0.36% 26.16 0.32%
Long-term investments 605.89 9.01% 539.38 7.17% 699.35 8.74% 477.91 5.83%
Other long-term investments 60.00 0.89% 60.96 0.81% 79.50 0.99% 79.50 0.97%
Property, plant and equipment 2,920.24 43.43% 4,563.71 60.63% 4,509.28 56.38% 4,341.96 52.98%
Advance payments for purchase of
assets 101.84 1.51% 6.67 0.09% 2.38 0.03% 1.87 0.02%
Intangible assets 7.04 0.10% 9.48 0.13% 10.58 0.13% 10.45 0.13%
Leasehold rights 0.69 0.01% 1.35 0.02% 0.93 0.01% 0.72 0.01%
Deferred tax assets 12.38 0.18% 8.79 0.12% 5.95 0.07% 11.61 0.14%
Other non-current assets 8.62 0.13% 8.55 0.11% 4.38 0.08% 4.11 0.05%
Total non-current assets 3,776.52 56.16% 5,260.14 69.88% 5,377.53 67.24% 4,990.64 60.89%
Total assets 6,724.56 100.00% 7,527.67 100.00% 7,997.33 100.00% 8,195.74 100.00%
Trade and other payables 725.48 10.79% 724.19 9.62% 680.57 8.51% 673.91 8.22%
Current portion of liabilities under
finance lease agreements 73.46 1.09% 70.22 0.93% 56.24 0.70% 50.63 0.62%
Corporate income tax payable 78.78 1.17% 89.58 1.19% 80.21 1.00% 78.43 0.96%
Accrued expenses 219.68 3.27% 224.51 2.98% 208.95 2.61% 184.55 2.25%
Other current liabilities 38.44 0.57% 39.14 0.52% 6.15 0.08% 4.51 0.06%
Total current liabilities 1,135.84 16.89% 1,147.65 15.25% 1,032.12 12.91% 992.03 12.10%
Liabilities under finance lease
agreements - net of current portion 70.64 1.05% 75.19 1.00% 52.64 0.66% 32.41 0.39%
Long-term loans from directors 76.99 1.14% 84.16 1.12% 77.98 0.98% 49.91 0.60%
Long-term loans from employees 34.00 0.51% 45.17 0.60% 39.63 0.50% 39.43 0.48%
Provision for long-term employee
benefits 79.14 1.18% 82.99 1.10% 84.27 1.05% 88.69 1.08%
Other non-current liabilities 2.25 0.03% 2.83 0.04% 3.03 0.04% 3.16 0.04%
Total non-current liabilities 263.02 3.91% 290.34 3.86% 257.55 3.22% 213.60 2.61%
Total liabilities 1,398.86 20.80% 1,437.98 19.10% 1,289.67 16.13% 1,205.63 14.71%
Registered share capital 450.00 6.69% 450.00 5.98% 450.00 5.63% 450.00 5.49%
Issued and fully paid-up share capital 450.00 6.69% 450.00 5.98% 450.00 5.63% 450.00 5.49%
Share premium 674.38 10.03% 674.38 8.96% 674.38 8.43% 674.38 8.23%
Retained earnings 45.00 0.67% 45.00 0.60% 45.00 0.56% 45.00 0.55%
Page 14
31 December 2015 31 December 2016 31 December 2017 30 June 2018
THB
Million %
THB
Million %
THB
Million %
THB
Million %
- Appropriated - statutory reserve
- Unappropriated 4,161.08 61.88% 4,913.36 65.27% 5,518.00 69.00% 5,821.03 71.03%
Other components of shareholders'
equity (4.76) -0.07% 6.95 0.09% 20.28 0.25% (0.30) 0.00%
Total shareholders' equity 5,325.70 79.20% 6,089.69 80.90% 6,707.66 83.87% 6,990.11 85.29%
Total liabilities and shareholders'
equity 6,724.56 100.00% 7,527.67 100.00% 7,997.33 100.00% 8,195.74 100.00%
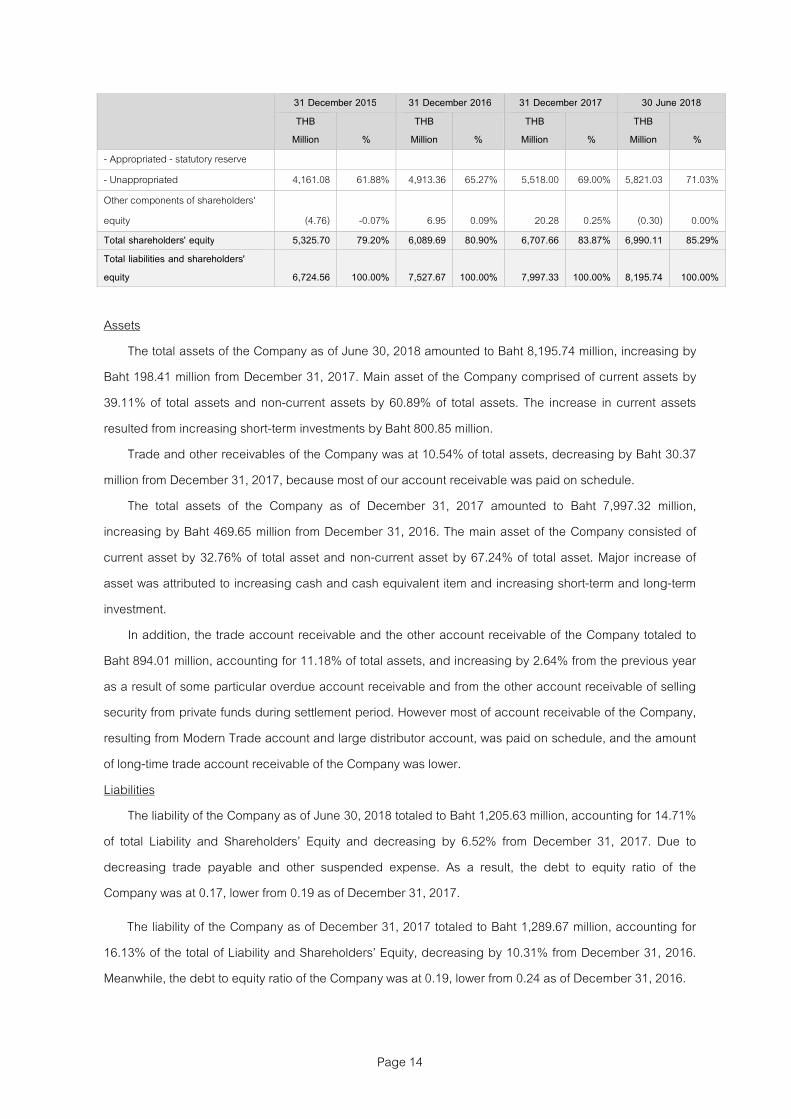
Assets
The total assets of the Company as of June 30, 2018 amounted to Baht 8,195.74 million, increasing by
Baht 198.41 million from December 31, 2017. Main asset of the Company comprised of current assets by
39.11% of total assets and non-current assets by 60.89% of total assets. The increase in current assets
resulted from increasing short-term investments by Baht 800.85 million.
Trade and other receivables of the Company was at 10.54% of total assets, decreasing by Baht 30.37
million from December 31, 2017, because most of our account receivable was paid on schedule.
The total assets of the Company as of December 31, 2017 amounted to Baht 7,997.32 million,
increasing by Baht 469.65 million from December 31, 2016. The main asset of the Company consisted of
current asset by 32.76% of total asset and non-current asset by 67.24% of total asset. Major increase of
asset was attributed to increasing cash and cash equivalent item and increasing short-term and long-term
investment.
In addition, the trade account receivable and the other account receivable of the Company totaled to
Baht 894.01 million, accounting for 11.18% of total assets, and increasing by 2.64% from the previous year
as a result of some particular overdue account receivable and from the other account receivable of selling
security from private funds during settlement period. However most of account receivable of the Company,
resulting from Modern Trade account and large distributor account, was paid on schedule, and the amount
of long-time trade account receivable of the Company was lower.
Liabilities
The liability of the Company as of June 30, 2018 totaled to Baht 1,205.63 million, accounting for 14.71%
of total Liability and ShareholdersC Equity and decreasing by 6.52% from December 31, 2017. Due to
decreasing trade payable and other suspended expense. As a result, the debt to equity ratio of the
Company was at 0.17, lower from 0.19 as of December 31, 2017.
The liability of the Company as of December 31, 2017 totaled to Baht 1,289.67 million, accounting for
16.13% of the total of Liability and ShareholdersC Equity, decreasing by 10.31% from December 31, 2016.
Meanwhile, the debt to equity ratio of the Company was at 0.19, lower from 0.24 as of December 31, 2016.
Page 15
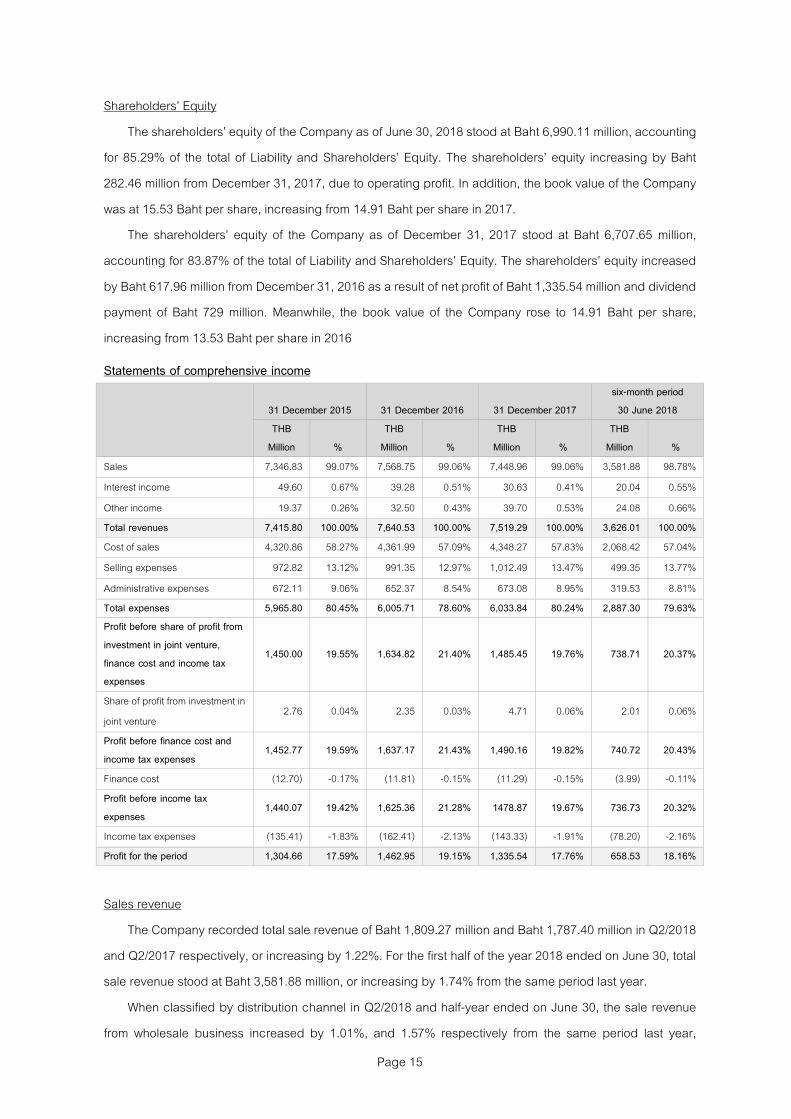
ShareholdersC Equity
The shareholdersC equity of the Company as of June 30, 2018 stood at Baht 6,990.11 million, accounting
for 85.29% of the total of Liability and ShareholdersC Equity. The shareholdersC equity increasing by Baht
282.46 million from December 31, 2017, due to operating profit. In addition, the book value of the Company
was at 15.53 Baht per share, increasing from 14.91 Baht per share in 2017.
The shareholdersC equity of the Company as of December 31, 2017 stood at Baht 6,707.65 million,
accounting for 83.87% of the total of Liability and ShareholdersC Equity. The shareholdersC equity increased
by Baht 617.96 million from December 31, 2016 as a result of net profit of Baht 1,335.54 million and dividend
payment of Baht 729 million. Meanwhile, the book value of the Company rose to 14.91 Baht per share,
increasing from 13.53 Baht per share in 2016
Statements of comprehensive income
31 December 2015 31 December 2016 31 December 2017
six-month period
30 June 2018
THB
Million %
THB
Million %
THB
Million %
THB
Million %
Sales 7,346.83 99.07% 7,568.75 99.06% 7,448.96 99.06% 3,581.88 98.78%
Interest income 49.60 0.67% 39.28 0.51% 30.63 0.41% 20.04 0.55%
Other income 19.37 0.26% 32.50 0.43% 39.70 0.53% 24.08 0.66%
Total revenues 7,415.80 100.00% 7,640.53 100.00% 7,519.29 100.00% 3,626.01 100.00%
Cost of sales 4,320.86 58.27% 4,361.99 57.09% 4,348.27 57.83% 2,068.42 57.04%
Selling expenses 972.82 13.12% 991.35 12.97% 1,012.49 13.47% 499.35 13.77%
Administrative expenses 672.11 9.06% 652.37 8.54% 673.08 8.95% 319.53 8.81%
Total expenses 5,965.80 80.45% 6,005.71 78.60% 6,033.84 80.24% 2,887.30 79.63%
Profit before share of profit from
investment in joint venture,
finance cost and income tax
expenses
1,450.00 19.55% 1,634.82 21.40% 1,485.45 19.76% 738.71 20.37%
Share of profit from investment in
joint venture 2.76 0.04% 2.35 0.03% 4.71 0.06% 2.01 0.06%
Profit before finance cost and
income tax expenses 1,452.77 19.59% 1,637.17 21.43% 1,490.16 19.82% 740.72 20.43%
Finance cost (12.70) -0.17% (11.81) -0.15% (11.29) -0.15% (3.99) -0.11%
Profit before income tax
expenses 1,440.07 19.42% 1,625.36 21.28% 1478.87 19.67% 736.73 20.32%
Income tax expenses (135.41) -1.83% (162.41) -2.13% (143.33) -1.91% (78.20) -2.16%
Profit for the period 1,304.66 17.59% 1,462.95 19.15% 1,335.54 17.76% 658.53 18.16%
Sales revenue
The Company recorded total sale revenue of Baht 1,809.27 million and Baht 1,787.40 million in Q2/2018
and Q2/2017 respectively, or increasing by 1.22%. For the first half of the year 2018 ended on June 30, total
sale revenue stood at Baht 3,581.88 million, or increasing by 1.74% from the same period last year.
When classified by distribution channel in Q2/2018 and half-year ended on June 30, the sale revenue
from wholesale business increased by 1.01%, and 1.57% respectively from the same period last year,
Page 16
because the sales volume of Sliced Bread grew by 1.68% and 1.55% respectively as well as the sales
volume of Snack Bread grew by 1.11% and 3.09% respectively as a result of offering discount price and
new products. The sales revenue from retail business decreased by 17.16% and 13.94% respectively due to
lower-than-expected sales volume in some branch of Deliya Shop. Meanwhile, the sales revenue from Fast
food and Restaurant business increased by 8.52% and 8.60% respectively due to rising purchase order
from customers..
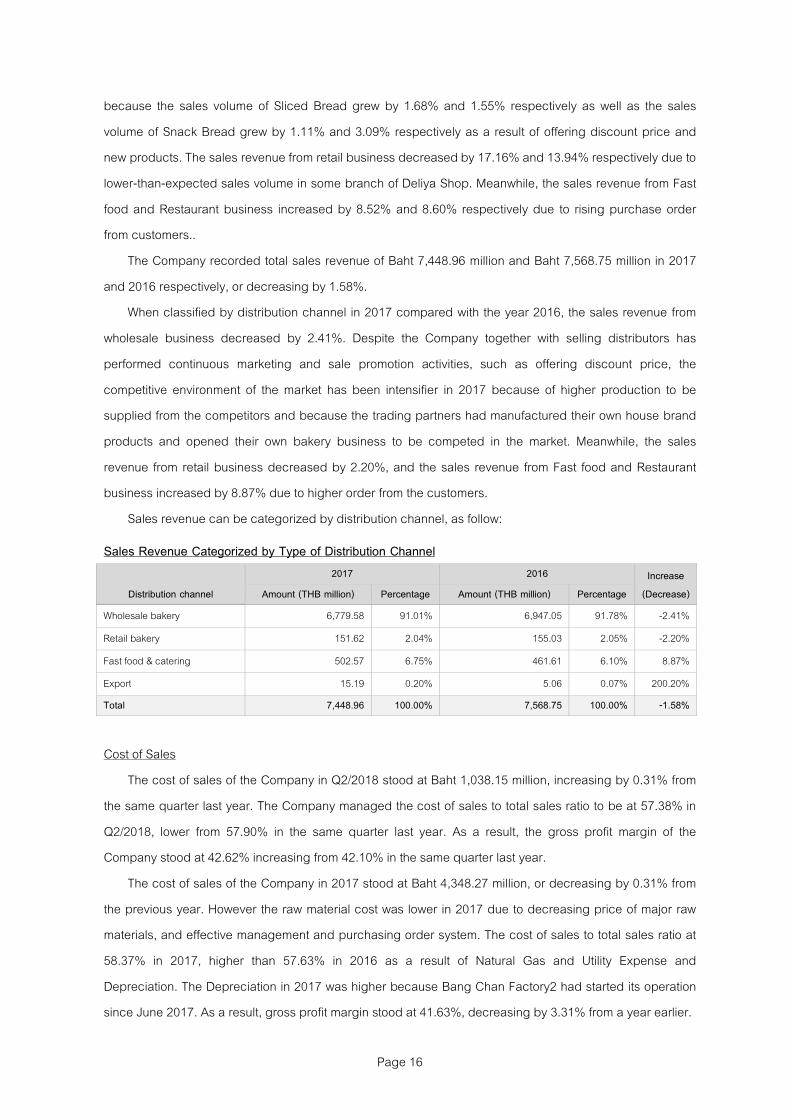
The Company recorded total sales revenue of Baht 7,448.96 million and Baht 7,568.75 million in 2017
and 2016 respectively, or decreasing by 1.58%.
When classified by distribution channel in 2017 compared with the year 2016, the sales revenue from
wholesale business decreased by 2.41%. Despite the Company together with selling distributors has
performed continuous marketing and sale promotion activities, such as offering discount price, the
competitive environment of the market has been intensifier in 2017 because of higher production to be
supplied from the competitors and because the trading partners had manufactured their own house brand
products and opened their own bakery business to be competed in the market. Meanwhile, the sales
revenue from retail business decreased by 2.20%, and the sales revenue from Fast food and Restaurant
business increased by 8.87% due to higher order from the customers.
Sales revenue can be categorized by distribution channel, as follow:
Sales Revenue Categorized by Type of Distribution Channel
Distribution channel
2017 2016 Increase
(Decrease) Amount (THB million) Percentage Amount (THB million) Percentage
Wholesale bakery 6,779.58 91.01% 6,947.05 91.78% -2.41%
Retail bakery 151.62 2.04% 155.03 2.05% -2.20%
Fast food & catering 502.57 6.75% 461.61 6.10% 8.87%
Export 15.19 0.20% 5.06 0.07% 200.20%
Total 7,448.96 100.00% 7,568.75 100.00% -1.58%
Cost of Sales
The cost of sales of the Company in Q2/2018 stood at Baht 1,038.15 million, increasing by 0.31% from
the same quarter last year. The Company managed the cost of sales to total sales ratio to be at 57.38% in
Q2/2018, lower from 57.90% in the same quarter last year. As a result, the gross profit margin of the
Company stood at 42.62% increasing from 42.10% in the same quarter last year.
The cost of sales of the Company in 2017 stood at Baht 4,348.27 million, or decreasing by 0.31% from
the previous year. However the raw material cost was lower in 2017 due to decreasing price of major raw
materials, and effective management and purchasing order system. The cost of sales to total sales ratio at
58.37% in 2017, higher than 57.63% in 2016 as a result of Natural Gas and Utility Expense and
Depreciation. The Depreciation in 2017 was higher because Bang Chan Factory2 had started its operation
since June 2017. As a result, gross profit margin stood at 41.63%, decreasing by 3.31% from a year earlier.

Page 17
Selling and Administrative Expense
The selling and administrative expenses in Q2/2018 amounted to Baht 412.33 million, accounting for
22.51% of total income, decreasing by 2.86% from the same quarter last year and half-year ended on June
30, 2018 and 2017 the selling and administrative expenses were accounted for 22.58% and 23.12%
respectively. In a meantime, The Company has performed effective management to control the expenditure
of transportation, product distribution, and information system.
The selling and administrative expenses, including salary, wage, fuel cost, advertising and sales
promotion expense, and so on, in 2017 amounted to Baht 1,685.57 million, accounting for 22.42% of total
income and increasing by 2.55% from the previous year. The selling and administrative expense was
increasing due to higher fuel cost for transportation and from continuous advertising and sales promotion
activities. In a meantime, the Company still maintained effective cost control.
Income Tax
The Company paid income tax in Q2/2018 by Baht 41.08 million, increasing by Baht 9.29 million or
29.22% from the same period last year, according to increased amount of operating profit. In a meantime,
the ratio of income tax to total income of the Company stood at 2.24% and 1.76% in Q2/2018 and Q2/2017
respectively, and was at 2.17%, and 1.77% in half-year 2018 and 2017 respectively.
The Company paid income tax in 2017 by Baht 143.27 million, decreasing by 11.14% from previous
year as a result of lower profit from Non-BOI-promoted business. In a meantime, the ratio of income tax to
total income of the Company stood at 1.91% and 2.11% in 2017 and 2016 respectively.
Profit for the period
As of June 30, 2018, the Company recorded quarterly profit of Baht 339.18 million, or increasing by
7.56% from the previous year, and recorded net profit of Baht 658.53 million in the first half of 2018, or
increasing by 3.91% from the previous year. Resulted from increase sales volume. In addition, the Company
gained the profit sharing of Baht 2 million from joint-venture business in half-year.
The Company recorded the net profit of Baht 1,335.54 million, or decreasing by 8.71% from the
previous year as a result of lower sales revenue. The Company maintained the net profit ratio at 17.76% of
total income. However the Company still maintained effective cost control. Share of income from investment
in joint venture at amount of Baht 4.71 million in 2017
Summary of statement of cash flow
THB million Year ended 31 December
six-month
period ended
30 June
2015 2016 2017 2018
Net cash flow from operating activities 1,716.49 1,869.95 1,781.54 933.53
Net cash flow from (used in) investing activities (880.89) (874.97) (822.24) (694.27)
Net cash flow from (used in) financing activities (656.30) (761.94) (811.21) (409.62)
Net increase (decrease) in cash and cash equivalents 179.30 233.04 148.10 (170.36)
Page 18
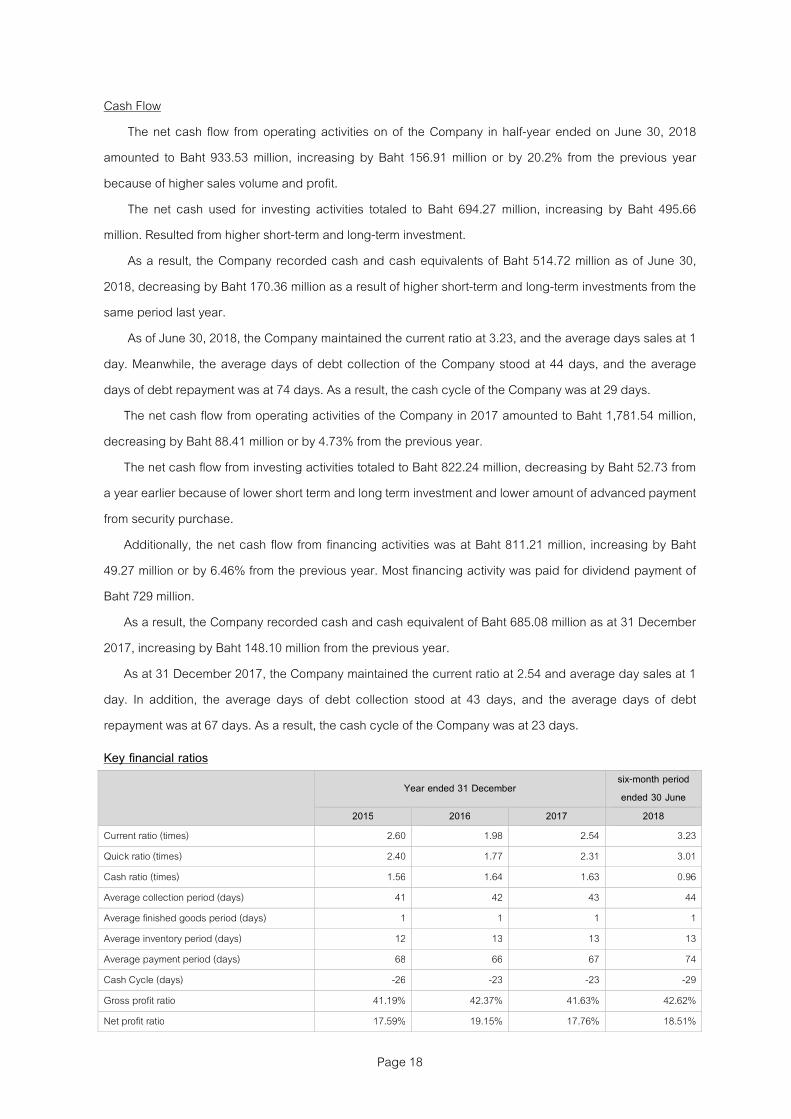
Cash Flow
The net cash flow from operating activities on of the Company in half-year ended on June 30, 2018
amounted to Baht 933.53 million, increasing by Baht 156.91 million or by 20.2% from the previous year
because of higher sales volume and profit.
The net cash used for investing activities totaled to Baht 694.27 million, increasing by Baht 495.66
million. Resulted from higher short-term and long-term investment.
As a result, the Company recorded cash and cash equivalents of Baht 514.72 million as of June 30,
2018, decreasing by Baht 170.36 million as a result of higher short-term and long-term investments from the
same period last year.
As of June 30, 2018, the Company maintained the current ratio at 3.23, and the average days sales at 1
day. Meanwhile, the average days of debt collection of the Company stood at 44 days, and the average
days of debt repayment was at 74 days. As a result, the cash cycle of the Company was at 29 days.
The net cash flow from operating activities of the Company in 2017 amounted to Baht 1,781.54 million,
decreasing by Baht 88.41 million or by 4.73% from the previous year.
The net cash flow from investing activities totaled to Baht 822.24 million, decreasing by Baht 52.73 from
a year earlier because of lower short term and long term investment and lower amount of advanced payment
from security purchase.
Additionally, the net cash flow from financing activities was at Baht 811.21 million, increasing by Baht
49.27 million or by 6.46% from the previous year. Most financing activity was paid for dividend payment of
Baht 729 million.
As a result, the Company recorded cash and cash equivalent of Baht 685.08 million as at 31 December
2017, increasing by Baht 148.10 million from the previous year.
As at 31 December 2017, the Company maintained the current ratio at 2.54 and average day sales at 1
day. In addition, the average days of debt collection stood at 43 days, and the average days of debt
repayment was at 67 days. As a result, the cash cycle of the Company was at 23 days.
Key financial ratios
Year ended 31 December
six-month period
ended 30 June
2015 2016 2017 2018
Current ratio (times) 2.60 1.98 2.54 3.23
Quick ratio (times) 2.40 1.77 2.31 3.01
Cash ratio (times) 1.56 1.64 1.63 0.96
Average collection period (days) 41 42 43 44
Average finished goods period (days) 1 1 1 1
Average inventory period (days) 12 13 13 13
Average payment period (days) 68 66 67 74
Cash Cycle (days) -26 -23 -23 -29
Gross profit ratio 41.19% 42.37% 41.63% 42.62%
Net profit ratio 17.59% 19.15% 17.76% 18.51%

Page 19
Year ended 31 December
six-month period
ended 30 June
2015 2016 2017 2018
Return on equity 26.26% 25.63% 20.87% 20.45%
Return on assets 20.59% 20.53% 17.20% 19.36%
Debt to equity ratio (times) 0.26 0.24 0.19 0.17
Dividend payout ratio (times) 50.07% 50.80% 50.69% N/A
1.5 Forecast operating results
With regard to new factory at Bangchan Industrial Estate which had been officially started
since June 2017 with 3 production lines including 2 lines of Sliced Bread which is our main product
and 1 line of ready-to-eat bread, thus raising our production capacity to serve future customers* need
and In 2018, the company will increase another 1 line of ready-to-eat bread, the Machinery which will
be implemented for new factory will use smart technology system to control Production process to be
more efficiency and increase production capacity to support additional growth in production and
consumer demand in present and future. In addition, the computer system is continuously improved
to be modern and capable of fast management for both sale and delivery system to maintain
freshness of the products.
For Marketing aspect, the Company has ongoing advertising and sales promotion campaign
to make the products well-known and accessible to the consumers in all distribution channels, as
well as driving sales growth.
2. Opinion on the correctness of the Company’s information stated in the Tender Offer
The Board of Directors of the Company is of the opinion that the information relating to PB stated in
the Tender Offer (Form 247-4) dated 29 August 2018 is correct in material aspect.
3. Any relationship or agreement between the Company’s directors and the Tender Offeror (either on
behalf of oneself, as a director of the Company or as a representative of the Tender Offeror), shareholding
in the Tender Offeror by the Company’s directors, and existing or prospective contract/agreement between
each other in various areas (e.g. management, etc.)

Page 20
3.1 Relationship between the Company’s directors and the Tender Offeror
Name of director Position in
the Company
Position in
TFMAMA
Person
under
section 258
Position in
TFMAMA
1. Mr. Pipat Paniangvait Chairman of the
Board
- Vice Chairman
- Chief Executive
Officer
- Nomination and
Remuneration
Committee
Spouse -
2. Mr. Apichart Thammanomai Managing
Director
Director Spouse -
3. Dr. Pojjanee Paniangvait Director Vice President - -
4. Mr. Pun Paniangvait Director Presidents Office,
Manager
Spouse -
Note - Mr. Pipat Paniangvait is the father of Dr. Pojjanee Paniangvait and Mr. Pun Paniangvait who are the directors of PB
- As a representative of the Tender Offerors MNone-
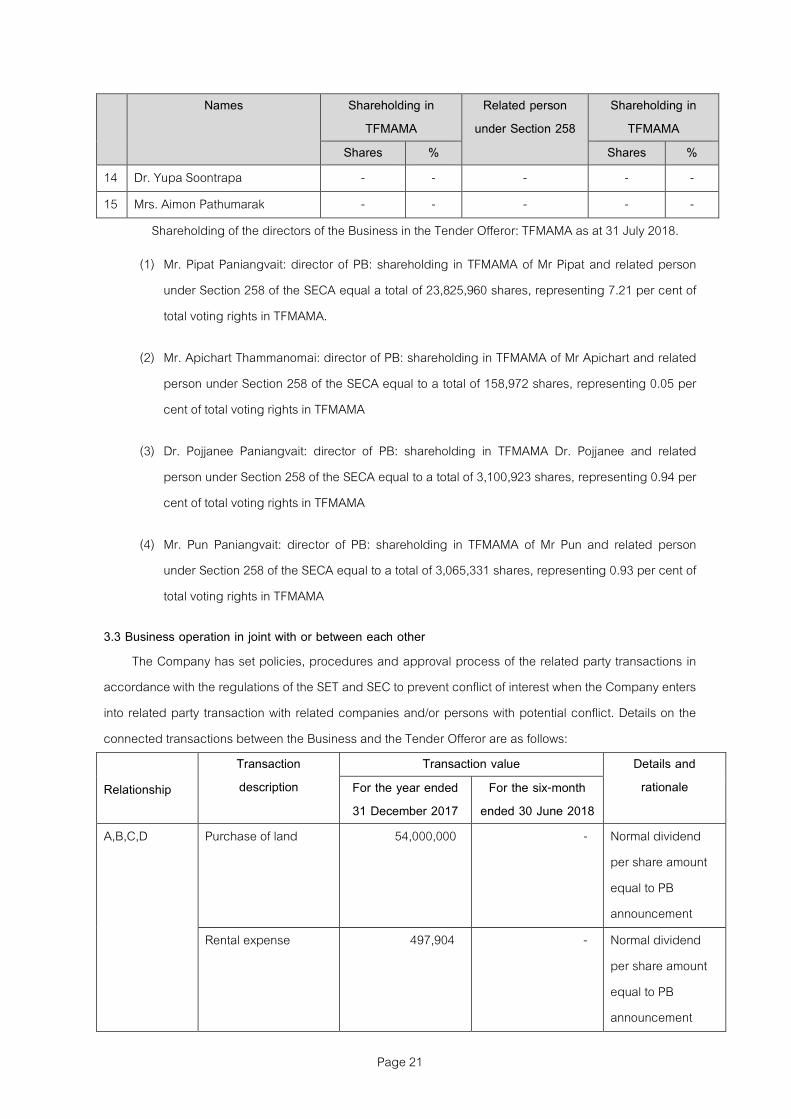
3.2 Shareholding in the Tender Offeror by of the Company’s directors
Names Shareholding in
TFMAMA
Related person
under Section 258
Shareholding in
TFMAMA
Shares % Shares %
1 Mr. Pipat Paniangvait 22,167,005 6.71 Spouse 1,658,955 0.50
2 Mr. Apichart Thammanomai 158,972 0.05 - - -
3 Mr. Apisate Thammanomai - - - - -
4 Mr. Vichai Kulsomphob - - - - -
5 Dr. Pojjanee Paniangvait 3,100,923 0.94 - - -
6 Mr. Pun Paniangvait 3,065,331 0.93 - - -
7 Mrs. Malee Tangjaisanong - - - - -
8 Miss Petcharat Anantawichai - - - - -
9 Mr. Thavach Keawpitag - - - - -
10 Miss Panida Prayottaweekij - - - - -
11 Prof. Dr. Teravuti Boonyasopon - - - - -
12 Mr. Boonsak Chiempricha - - - - -
13 Prof. Dr. Suwimon Keeratipibul - - - - -
Page 21
Names Shareholding in
TFMAMA
Related person
under Section 258
Shareholding in
TFMAMA
Shares % Shares %
14 Dr. Yupa Soontrapa - - - - -
15 Mrs. Aimon Pathumarak - - - - -
Shareholding of the directors of the Business in the Tender Offeror: TFMAMA as at 31 July 2018.
(1) Mr. Pipat Paniangvait: director of PB: shareholding in TFMAMA of Mr Pipat and related person
under Section 258 of the SECA equal a total of 23,825,960 shares, representing 7.21 per cent of
total voting rights in TFMAMA.
(2) Mr. Apichart Thammanomai: director of PB: shareholding in TFMAMA of Mr Apichart and related
person under Section 258 of the SECA equal to a total of 158,972 shares, representing 0.05 per
cent of total voting rights in TFMAMA
(3) Dr. Pojjanee Paniangvait: director of PB: shareholding in TFMAMA Dr. Pojjanee and related
person under Section 258 of the SECA equal to a total of 3,100,923 shares, representing 0.94 per
cent of total voting rights in TFMAMA
(4) Mr. Pun Paniangvait: director of PB: shareholding in TFMAMA of Mr Pun and related person
under Section 258 of the SECA equal to a total of 3,065,331 shares, representing 0.93 per cent of
total voting rights in TFMAMA
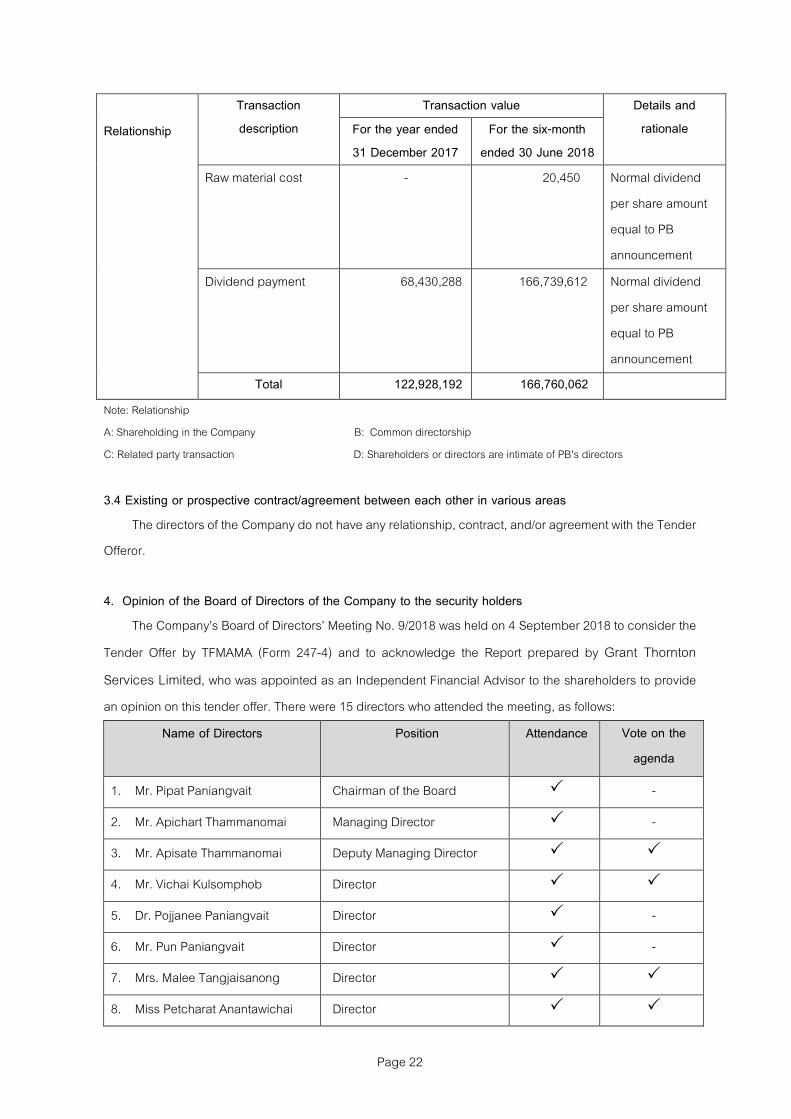
3.3 Business operation in joint with or between each other
The Company has set policies, procedures and approval process of the related party transactions in
accordance with the regulations of the SET and SEC to prevent conflict of interest when the Company enters
into related party transaction with related companies and/or persons with potential conflict. Details on the
connected transactions between the Business and the Tender Offeror are as follows:
Relationship
Transaction
description
Transaction value Details and
rationale For the year ended
31 December 2017
For the six-month
ended 30 June 2018
A,B,C,D Purchase of land 54,000,000 - Normal dividend
per share amount
equal to PB
announcement
Rental expense 497,904 - Normal dividend
per share amount
equal to PB
announcement
Page 22
Relationship
Transaction
description
Transaction value Details and
rationale For the year ended
31 December 2017
For the six-month
ended 30 June 2018
Raw material cost - 20,450 Normal dividend
per share amount
equal to PB
announcement
Dividend payment 68,430,288 166,739,612 Normal dividend
per share amount
equal to PB
announcement
Total 122,928,192 166,760,062
Note: Relationship
A: Shareholding in the Company B: Common directorship
C: Related party transaction D: Shareholders or directors are intimate of PB's directors
3.4 Existing or prospective contract/agreement between each other in various areas
The directors of the Company do not have any relationship, contract, and/or agreement with the Tender
Offeror.
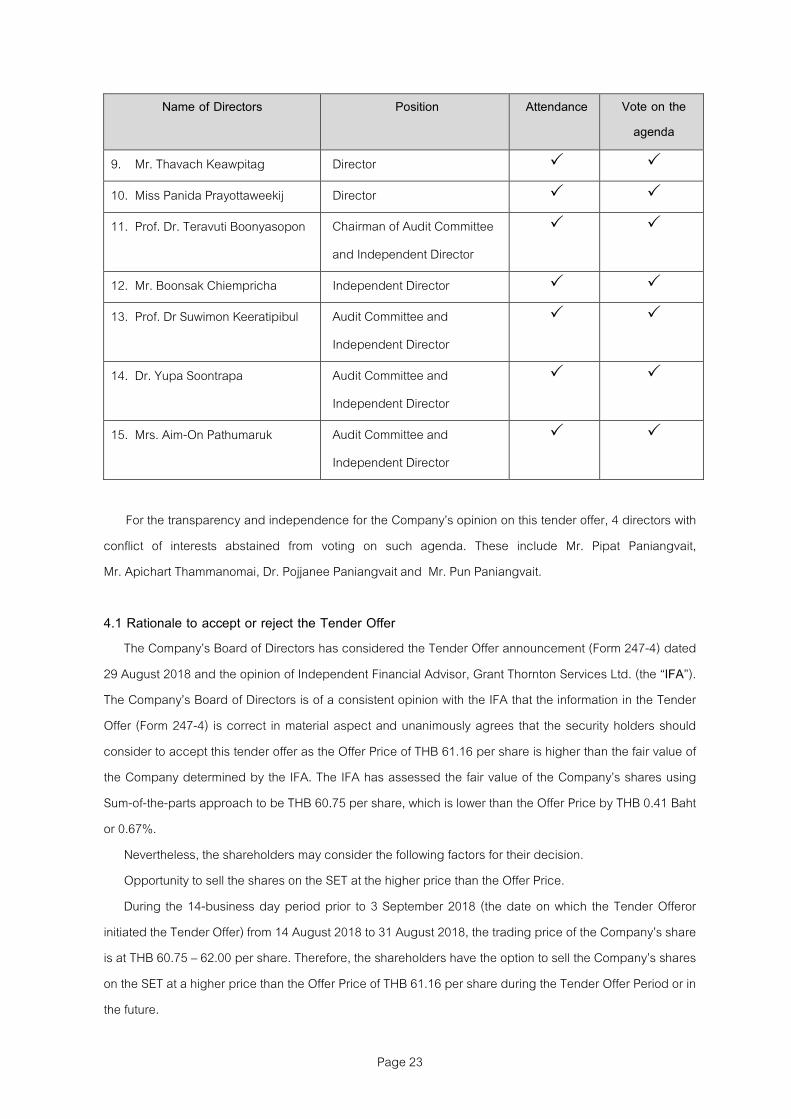
4. Opinion of the Board of Directors of the Company to the security holders
The CompanyCs Board of DirectorsC Meeting No. 9/2018 was held on 4 September 2018 to consider the
Tender Offer by TFMAMA (Form 247-4) and to acknowledge the Report prepared by Grant Thornton
Services Limited, who was appointed as an Independent Financial Advisor to the shareholders to provide
an opinion on this tender offer. There were 15 directors who attended the meeting, as follows:
Name of Directors Position Attendance
Vote on the
agenda
1. Mr. Pipat Paniangvait Chairman of the Board � -
2. Mr. Apichart Thammanomai Managing Director � -
3. Mr. Apisate Thammanomai Deputy Managing Director � �
4. Mr. Vichai Kulsomphob Director � �
5. Dr. Pojjanee Paniangvait Director � -
6. Mr. Pun Paniangvait Director � -
7. Mrs. Malee Tangjaisanong Director � �
8. Miss Petcharat Anantawichai Director � �
Page 23
Name of Directors Position Attendance
Vote on the
agenda
9. Mr. Thavach Keawpitag Director � �
10. Miss Panida Prayottaweekij Director � �
11. Prof. Dr. Teravuti Boonyasopon Chairman of Audit Committee
and Independent Director
� �
12. Mr. Boonsak Chiempricha Independent Director � �
13. Prof. Dr Suwimon Keeratipibul Audit Committee and
Independent Director
� �
14. Dr. Yupa Soontrapa Audit Committee and
Independent Director
� �
15. Mrs. Aim-On Pathumaruk Audit Committee and
Independent Director
� �
For the transparency and independence for the CompanyCs opinion on this tender offer, 4 directors with
conflict of interests abstained from voting on such agenda. These include Mr. Pipat Paniangvait,
Mr. Apichart Thammanomai, Dr. Pojjanee Paniangvait and Mr. Pun Paniangvait.
4.1 Rationale to accept or reject the Tender Offer
The CompanyCs Board of Directors has considered the Tender Offer announcement (Form 247-4) dated
29 August 2018 and the opinion of Independent Financial Advisor, Grant Thornton Services Ltd. (the &IFA').
The CompanyCs Board of Directors is of a consistent opinion with the IFA that the information in the Tender
Offer (Form 247-4) is correct in material aspect and unanimously agrees that the security holders should
consider to accept this tender offer as the Offer Price of THB 61.16 per share is higher than the fair value of
the Company determined by the IFA. The IFA has assessed the fair value of the CompanyCs shares using
Sum-of-the-parts approach to be THB 60.75 per share, which is lower than the Offer Price by THB 0.41 Baht
or 0.67%.
Nevertheless, the shareholders may consider the following factors for their decision.
Opportunity to sell the shares on the SET at the higher price than the Offer Price.
During the 14-business day period prior to 3 September 2018 (the date on which the Tender Offeror
initiated the Tender Offer) from 14 August 2018 to 31 August 2018, the trading price of the CompanyCs share
is at THB 60.75 M 62.00 per share. Therefore, the shareholders have the option to sell the CompanyCs shares
on the SET at a higher price than the Offer Price of THB 61.16 per share during the Tender Offer Period or in
the future.
Page 24
The trading price reflects both internal and external factors of the Company that may impact the
operation of the Company. Several of these factors are not under the control of the Company at that point in
time. On this basis, the opinion of the CompanyCs Board of Directors should only form a part, and not all
inclusive, of the shareholdersC consideration to accept or reject this tender offer. The shareholders should
analyze relevant information, the Opinion of the IFA, and information from other relevant sources, together
with the shareholdersC investment time frame, investment objective, tolerance to risks and volatility of
operating results, and investment view on the shares of the Company. Moreover, shareholders should
consider the trading price on the SET, business potential, and business expansion policy as part of the
decision.
Nonetheless, the decision whether to accept or reject the Tender Offer shall rest solely at the
shareholdersC discretion.
4.2 Opinion and rationale of each director of the Company and the number of shares held by each
director (only in the case where the opinion of the directors of the Company in 4.1 is not
unanimous)
-None-
4.3 Benefits and impacts from the business plan and policies stated in the Tender Offer, including
the feasibility of said plan and policies
Business status of PB
The Tender Offeror has no intention to delist the BusinessCs securities from the SET during the 12
months after the end of the Offer Period, except that the Tender Offeror has duties and responsibilities
pursuant to the relevant laws, regulations, and rules that are enforced at the time.
The Board of Directors of the Company is of the opinion that
As the Tender Offeror has no intention to delist PB security from the SET, PB will maintain its status as a
listed company on the SET. However, after the tender offer, the CompanyCs ability to maintain its listing
status on the SET may be affected by the number of shareholders that accept the Tender Offer.
In order to maintain a listing status on the SET, PB must have at least 150 minority shareholders, whom
in aggregate own at least 15% of the total paid-up capital of the Company.
If the shareholders do not have the intention to sell the security, the shareholders will not have to take
any action and will maintain the status as a shareholder.
Policies and plans of business operations
The Offeror has no intention to substantially change the objectives, plans or policies of the Business or
change its dividend policy during the 12-month period from the end of Tender Offer period.
Page 25
However, if necessary, the Offeror may consider changing its business operation plan, management,
organization structure and personnel as well as its financial structure in the future in order to be suitable for
its normal business operation and financial conditions as well as for the efficiency and flexibility of the
business operation, the increase of competitiveness and better operation and management of the Business
for the utmost benefits of the Business and its shareholders.
However, if the Offeror wishes to implement any changes which significantly differ from those
specified in this Tender Offer during the 12-month period from the end of the Tender Offer period, the
Offeror shall obtain approval from the Board of Directors and/or shareholders of the Business in accordance
with its Articles of Association and relevant laws and regulations, including notifying the SEC.
Board of Directors of the Company is of the opinion that
Within the period of 12 months after the end of the Offer Period, the Offeror do not have policy to make any
material changes to PBCs business objectives or management. As a result, the management of the company
can continue to operate as usual. The Board of Directors is of the opinion that the Company will not be
affected from the business or dividend policies.
Related Party Transaction
Within the period of 1 2 months after the end of the Offer Period, the Tender Offeror, or any person
connected with the Tender Offeror pursuant to Section 258 of the SECA, have no intention to materially
change the BusinessCs current policy regarding connected transactions. PB hereby certifies that the above
information is true, complete and accurate, there is no information that may be misleading to other parties in
material aspect, and there is no absence of material information that should be disclosed.
Board of Directors of the Company have the opinion that
At present, the Company has set policies, procedures and approval process of the related party
transactions in accordance with the regulations of the SET and SEC to prevent conflict of interest when the
Company enters into related party transaction with subsidiaries, associated companies, related companies
and/or persons potential conflict.
Page 26
4.4 Additional opinion of the Board of Directors of the Company (only in the case where the Tender
Offer is a tender offer to delist the security from the SET)
None. The Tender Offer is not a tender offer to delist the security from the SET. Nevertheless, PB
does not have any plan to delist the Company from being a listed security on the SET.
5. Opinion of the advisor to the shareholders who is a financial advisor in the list approved by the
Office of the SEC
Please refer to the attachment (Independent Financial AdvisorCs Opinion on the Tender Offer of
President Bakery Public Company Limited).
PB hereby certifies that the above information is true, complete and accurate, there is no information
that may be misleading to other parties in material aspect, and there is no absence of material information
that should be disclosed.
(Mr. Apichart Thammanomai)
Authorized director
(Miss Petcharat Anantawichai)
Authorized director
President Bakery Public Company Limited
Opinion of the Independent Financial Advisor on the Tender Offer
of President Bakery Public Company Limited
By Thai President Foods Public Company Limited
19 September 2018
Independent financial advisor’s opinion on the Tender Offer [Translation]
© 2018 Grant Thornton Services Ltd. All rights reserved. ii
Table of Contents
Page
1. Executive Summary 1
2. Practice and Information Used in the Preparation of the IFA’s Opinion 3
3. Background 4
3.1 Transaction Overview 4
4. Information of the Tender Offeror and PB 8
4.1 Details of the Tender Offeror – Thai President Foods PLC 8
4.2 Information of the Company 25
4.3 Overview of industry 43
5. Fairness of the Tender Offer Price 45
5.1 Practice and information used in the preparation of the IFA’s opinion 45
5.2 Valuation Methodologies 45
6. Rationale to Accept and/or Reject the Tender Offer 57
6.1 Rationale for Accepting the Tender Offer 57
6.2 Rationale for Rejecting the Tender Offer 59
7. Benefits or Impacts from Policies and Business Directions Disclosed in the Tender Offer 61
7.1 Status of the Company 61
7.2 Sources of the Tender Offeror’s Funding 61
7.3 Policies and Plans of Business Operations 62
8. Opinion of the Independent Financial Advisor 66
Independent financial advisor’s opinion on the Tender Offer [Translation]
© 2018 Grant Thornton Services Ltd. All rights reserved. iii
List of Tables
Table 4-1: Major change and development of TFMAMA ...................................................................................... 8
Table 4-2: Sale structure by business of TFMAMA ............................................................................................ 12
Table 4-3: Sale structure in domestic and foreign market of TFMAMA ............................................................. 12
Table 4-4: Comparison of the production capacity and the actual production in 2016-2017 of TFMAMA ....... 13
Table 4-5: Major shareholders of TFMAMA ........................................................................................................ 13
Table 4-6: Major shareholders of Saha Pathana Inter-Holding Public Company Limited ................................. 14
Table 4-7: Major shareholders of Nissin Foods Holdings Co., Ltd. .................................................................... 14
Table 4-8: Major shareholders of Mitsubishi Corp. ............................................................................................. 14
Table 4-9: Major shareholders of Itochu Corp. ................................................................................................... 15
Table 4-10: Major shareholders of The Master Trust Bank of Japan, Ltd. ........................................................ 15
Table 4-11: Major shareholders of Unicentral ..................................................................................................... 15
Table 4-12: Major shareholders of Universe Beauty Co., Ltd ............................................................................ 15
Table 4-13: Major shareholders of Unichamp Co., Ltd. ...................................................................................... 16
Table 4-14: Major shareholders of Chokwattana Co., Ltd. ................................................................................. 16
Table 4-15: Major shareholders of Uniwealth Co., Ltd. ...................................................................................... 16
Table 4-16: Major shareholders of First United Industry Co., Ltd. ..................................................................... 16
Table 4-17: Major shareholders of I.D.F. Co. Ltd. .............................................................................................. 17
Table 4-18: Board of Directors of TFMAMA ........................................................................................................ 17
Table 4-19: Management Team of TFMAMA ...................................................................................................... 17
Table 4-20: Consolidated statement of financial position of TFMAMA .............................................................. 18
Table 4-21: Consolidated statement of income of TFMAMA .............................................................................. 20
Table 4-22: Consolidated statement of cash flow summary of TFMAMA .......................................................... 23
Table 4-23: Key financial ratios of TFMAMA ...................................................................................................... 23
Table 4-24: Major change and development of PB ............................................................................................ 25
Table 4-25: Shareholding structure of PB ........................................................................................................... 27
Table 4-26: Revenue structure of the Company ................................................................................................. 28
Table 4-27: Major shareholders of PB before making Tender Offer .................................................................. 33
Table 4-28: Shareholders of Better Way (Thailand) Co., Ltd. ............................................................................ 34
Table 4-29: Shareholders of International Laboratories Corp., Ltd. ................................................................... 34
Table 4-30: Shareholders of Vitayasithi Co., Ltd ................................................................................................ 34
Independent financial advisor’s opinion on the Tender Offer [Translation]
© 2018 Grant Thornton Services Ltd. All rights reserved. iv
Table 4-31: Potential shareholding structure after making Tender Offer, in case all shareholders of the Company
have shown their intention to sell all their own shares in this Tender Offer (except those who have shown their
intention not to sell their own shares).................................................................................................................. 35
Table 4-32: Potential shareholding structure after making Tender Offer, in case all shareholders of the Company
have shown their intetion not to sell their own shares in this Tender Offer ....................................................... 35
Table 4-33: Potential shareholding structure after making Tender Offer, in case SPI is the only one who have
shown their intention to sell their own shares in this Tender Offer (except those who have shown their intention
not to sell their own shares) ................................................................................................................................ 35
Table 4-34: Potential shareholding structure after making Tender Offer, in case all shareholders except SPI
have shown their intention to sell their own shares in this Tender Offer ........................................................... 35
Table 4-35: The Board of Directors of PB prior to the purchase of the Business shares by the Tender Offerors
.............................................................................................................................................................................. 36
Table 4-36: The Board of Directors of PB (pursuant to the purchase of the Business shares by the Tender
Offerors) ................................................................................................................................................................ 36
Table 4-37: Management Team of PB ................................................................................................................ 37
Table 4-38: Statement of financial position of PB ............................................................................................... 37
Table 4-39: Statement of income of PB .............................................................................................................. 39
Table 4-40: Details of revenue structure of PB ................................................................................................... 40
Table 4-41: Statement of cash flow summary of PB .......................................................................................... 41
Table 4-42: Key financial ratios of PB ................................................................................................................. 42
Table 5-1: Book value approach of PB ............................................................................................................... 45
Table 5-2: Weighted Average Market Value Approach of PB ............................................................................ 46
Table 5-3: Turnover ratio of PB’s shares ............................................................................................................ 46
Table 5-4: Information on comparable companies of PB ................................................................................... 47
Table 5-5: Price-to-Earnings Approach (P/E) of PB and its comparable companies ........................................ 48
Table 5-6: Price-to-Book Value Approach (P/BV) of PB and its comparable companies.................................. 49
Table 5-7: Summary of the valuation methods used for share valuation ........................................................... 49
Table 5-8: Revenue assumptions of PB .............................................................................................................. 50
Table 5-9: Expense assumption of PB ................................................................................................................ 50
Table 5-10: Financial forecast of PB ................................................................................................................... 51
Table 5-11: Forecast free cash flow to firm of PB .............................................................................................. 52
Table 5-11: Enterprise value of PB using the Discounted Cash Flow Method .................................................. 52
Table 5-12: Restaurant industry average ............................................................................................................ 53
Table 5-13: Flour mill manufacturing and related service industry average ...................................................... 53
Independent financial advisor’s opinion on the Tender Offer [Translation]
© 2018 Grant Thornton Services Ltd. All rights reserved. v
Table 5-14: PB’s Investment valuation under market comparable method (EV/EBITDA) ................................. 54
Table 5-15: Share valuation of PB using the sum-of-the-parts approach .......................................................... 54
Table 5-16: Sensitivity analysis of PB’s share valuation .................................................................................... 55
Table: 5-17: Valuation results and comparison of pros and cons for each valuation approach ....................... 56
Table 6-1: Summary of PB share valuation under each approach .................................................................... 57
Table 6-2: Trade volume/value of the Company’s share and SET .................................................................... 58
Table 6-3: Shareholding in PB by the Tender Offeror under various scenarios ................................................ 59
Table 6-4: Historical PB’s dividend payment ....................................................................................................... 60
Table 7-1: Source of funding of TFMAMA .......................................................................................................... 62
Table 7-2: Board of Directors of PB .................................................................................................................... 63
Table 7-3: Historical PB’s dividend payment ....................................................................................................... 64

Independent financial advisor’s opinion on the Tender Offer [Translation]
© 2018 Grant Thornton Services Ltd. All rights reserved. vi
List of Figures
Figure 3-1: Sharehloding structure before and after Tender Offer of TFMAMA .................................................. 4
Figure 4-1: Shareholding structure of TFMAMA ................................................................................................... 9
Figure 4-2: Business of TFMAMA group ............................................................................................................. 11
Figure 4-3: Revenue structure during the year 2013-2017 ................................................................................. 28
Figure 4-4: Business information of the Company .............................................................................................. 29
Figure 5-1: Property, plant and equipment of PB as of 31 December 2017 ..................................................... 46
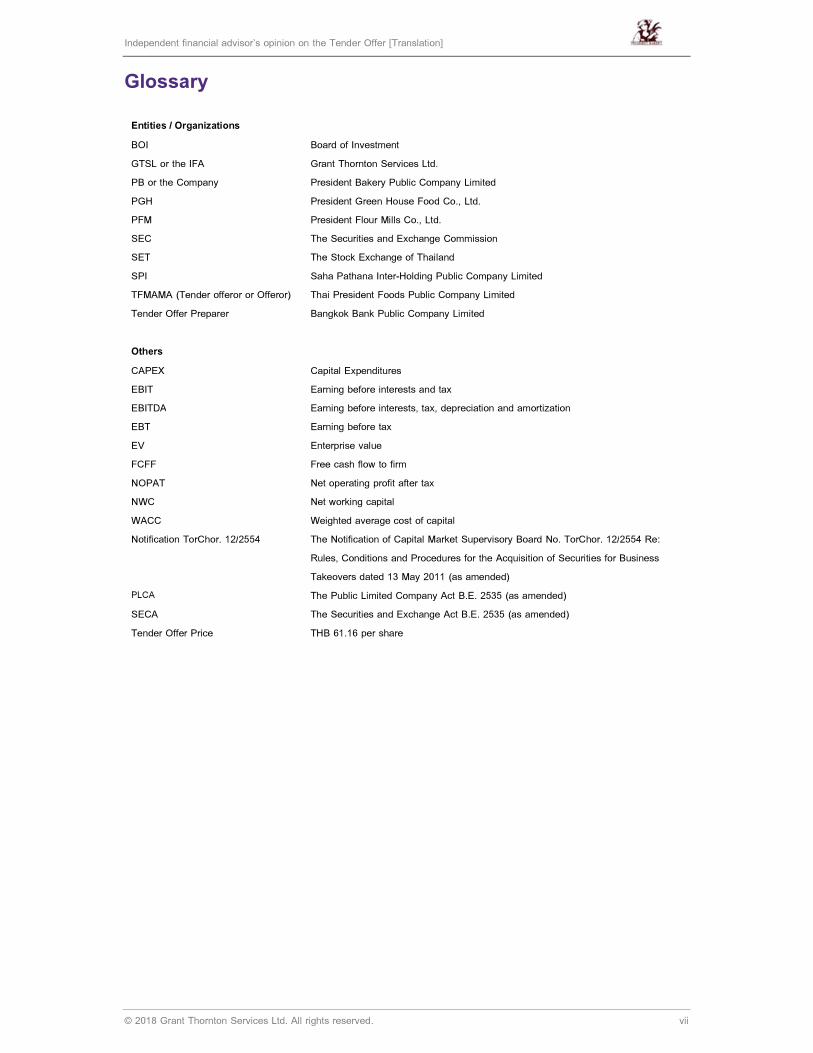
Independent financial advisor’s opinion on the Tender Offer [Translation]
© 2018 Grant Thornton Services Ltd. All rights reserved. vii
Glossary
Entities / Organizations
BOI Board of Investment
GTSL or the IFA Grant Thornton Services Ltd.
PB or the Company President Bakery Public Company Limited
PGH President Green House Food Co., Ltd.
PFM President Flour Mills Co., Ltd.
SEC The Securities and Exchange Commission
SET The Stock Exchange of Thailand
SPI Saha Pathana Inter-Holding Public Company Limited
TFMAMA (Tender offeror or Offeror) Thai President Foods Public Company Limited
Tender Offer Preparer Bangkok Bank Public Company Limited
Others
CAPEX Capital Expenditures
EBIT Earning before interests and tax
EBITDA Earning before interests, tax, depreciation and amortization
EBT
EV
Earning before tax
Enterprise value
FCFF Free cash flow to firm
NOPAT Net operating profit after tax
NWC Net working capital
WACC Weighted average cost of capital
Notification TorChor. 12/2554 The Notification of Capital Market Supervisory Board No. TorChor. 12/2554 Re:
Rules, Conditions and Procedures for the Acquisition of Securities for Business
Takeovers dated 13 May 2011 (as amended)
PLCA The Public Limited Company Act B.E. 2535 (as amended)
SECA The Securities and Exchange Act B.E. 2535 (as amended)
Tender Offer Price THB 61.16 per share
Grant Thornton Services Limited is a limited company registered in Thailand No: 0105534098855.
Registered office: 18th Floor Capital Tower, All Seasons Place, 87/1 Wireless Road, Bangkok 10330 Thailand
Grant Thornton Services Limited is the financial advisor approved by the Securities and Exchange Commission, Thailand.
[Translation]
This document is translated solely for convenience purpose. In the event of any
inconsistency, the Thai version should be relied upon as official and definitive.
19 September 2018
Subject: Independent Financial Advisor’s Opinion on the Tender Offer for the President
Bakery Public Company Limited by Thai President Foods Public Company Limited
To: Shareholders of President Bakery Public Company Limited
In 2017, Saha Pathana Inter-holding PLC (“SPI”) proceeded with a restructuring of its
shareholding in the food businesses of the Saha Group through the acquisition of all the
securities of President Holding Co., Ltd. and the merger of Thai President Foods PLC (or TF
at the time) and President Rice Products PLC (“PR”) into a new corporation under the name
of TF as “Thai President Foods PLC” and changing the symbol used in trading on the Stock
Exchange of Thailand (“SET”) from “TF” to “TFMAMA”. As a result of the restructuring, SPI is
responsible for proposing the Tender Offer to acquire all the shares of PR and President
Bakery Public Company Limited (“Company”, “Business” or “PB”) in accordance with
Notification of the Capital Market Supervisory Board No. TorChor. 12/2554. In this matter, TF
has joined with SPI in proposing the Tender Offer to acquire all the shares of PB.
Following the aforesaid restructuring, TFMAMA, the new company resulting from the
restructuring, becomes an ordinary shareholder in PB, which currently has direct holding of a
total of 211,062,800 shares in PB or equivalent to 46.90 percent of the total issued and paid-
up shares of the Business, representing the same number of total voting rights.
TFMAMA wishes to make additional investment in PB to increase its equity to more than
50 percent of the total issued and paid-up shares of the company, rendering PB a subsidiary
of TFMAMA and demonstrating efficient management of excess cash with return on investment
in the form of regular dividend payment from one of Thailand’s strongest business leaders in
the bakery industry, capable of continually generating profit and posing a low risk of volatility
compared to other industries.
Thus, the Company has appointed Grant Thornton Services Limited (“GTSL” or “IFA”) as
the Company’s Independent Financial Advisor to render opinion to the Company’s
shareholders regarding this Tender Offer for Securities. To render the opinion, the IFA has
based its information on the Company’s data and information as detailed in Section 2 Practice
and information used in the preparation of the IFA’s opinion. The IFA has no reasons to doubt
that the received information has lacked accuracy and completeness which may affect
Grant Thornton Services Limited is a limited company registered in Thailand No: 0105534098855.
Registered office: 18th Floor Capital Tower, All Seasons Place, 87/1 Wireless Road, Bangkok 10330 Thailand
Grant Thornton Services Limited is the financial advisor approved by the Securities and Exchange Commission, Thailand.
significantly the opinion rendered. In addition, this report has been based on the current
economy, the current market condition and other factors as well as the information and
documents received at the preparation of this IFA’s opinion. In the event of significant changes
to such information in the future, which may affect the opinion of the IFA, the IFA has no
obligations to update, review or affirm the IFA’s opinion.
The Company’s shareholders should study all relevant details in the IFA’s Opinion and all
other supplementary documents attached with the Form 250-2 delivered to the Company’s
shareholders before making any decision.

Independent financial advisor’s opinion on the Tender Offer [Translation]
© 2018 Grant Thornton Services Ltd. All rights reserved. 1
1. Executive Summary
In 2017, Saha Pathana Inter-holding PLC (“SPI”) proceeded with a restructuring of its shareholding in the
food businesses of the Saha Group through the acquisition of all the securities of President Holding Co., Ltd.
and the merger of Thai President Foods PLC (or TF at the time) and President Rice Products PLC (“PR”) into
a new corporation under the name of TF as “Thai President Foods PLC” and changing the symbol used in
trading on the Stock Exchange of Thailand (“SET”) from “TF” to “TFMAMA”. As a result of the restructuring,
SPI is responsible for proposing the Tender Offer to acquire all the shares of PR and PB in accordance with
Notification of the Capital Market Supervisory Board No. TorChor. 12/2554. In this matter, TF has joined with
SPI in proposing the Tender Offer to acquire all the shares of PB. Following the aforesaid restructuring,
TFMAMA, the new company resulting from the restructuring, becomes an ordinary shareholder in PB, which
currently has direct holding of a total of 211,062,800 shares in PB or equivalent to 46.90 percent of the total
issued and paid-up shares of the Business, representing the same number of total voting rights.
TFMAMA wishes to make additional investment in PB to increase its equity to more than 50 percent of the
total issued and paid-up shares of the company, rendering PB a subsidiary of TFMAMA and demonstrating
efficient management of excess cash with return on investment in the form of regular dividend payment from
one of Thailand’s strongest business leaders in the bakery industry, capable of continually generating profit
and posing a low risk of volatility compared to other industries.
In the TFMAMA Board of Directors’ Meeting No. 8/2018 on 15 August 2018, a resolution was passed to
approve the Voluntary Tender Offer in accordance with Notification of the Capital Market Supervisory Board
No. TorChor. 12/2011 on Conditions and Procedures for the Acquisition of Securities for Business Takeovers
dated 13 May 2011 (“Notification TorChor.12/2011”) with offering price of THB 61.16 per share. TFMAMA
submitted the Statement of Intention to Make a Tender Offer (Form 247-3) and the Tender Offer (Form 247-4)
to the Securities and Exchange Commission of Thailand on 29 August 2018. The details are as follows:
Type of the Offered Securities President Bakery Public Company Limited
Offer Price The net price to be received will be THB 60.996397
This is a tender offer price of THB 61.16 per share, less the fee for the payment of a brokerage
fee of 0.25% of the offer price and a value added tax 7.00% of the brokerage fee
Offer period On every business day from 3 September 2018 and 6 November 2018. Such Offer Period is
the final period which will be not extended (Final Period)
Tender Offer Revocation Period On any business day from 3 September 2018 and 5 October 2018 inclusive (totaling 25
business days)
Payment Date Within 2 business days from the last day of the Offer Period, which is 8 November 2018
The Company has appointed Grant Thornton Services Limited as the Independent Financial Advisor to
render opinion to the Company’s shareholders regarding this Tender Offer for Securities. The IFA has
summarised the reasons and other relevant information for the shareholders to consider accepting and/or
rejecting the Tender Offer as follows:
Reasons to accept the Tender Offer
1) Appropriateness of the Offering Price
The IFA has calculated the value of PB shares employing 5 financial valuation approaches as follows:
1. Book Value Approach 2. Adjusted Book Value Approach 3. Weighted Average Market Value
Approach 4. Market Comparable Approach and 5. Sum-of-the-Parts Approach. The IFA views that the
Independent financial advisor’s opinion on the Tender Offer [Translation]
© 2018 Grant Thornton Services Ltd. All rights reserved. 2
appropriate method to value PB shares is Sum-of-the-Parts Approach. Thus, the appropriate share
price of PB is in range of THB 57.89 - 63.98 and at THB 60.75 per share as based case. Therefore,
the IFA views that the offering price at THB 61.16 per share is appropriate as it is higher than the
rang of appropriated price.
2) Liquidity in trading of the Company’s securities will significantly decline after the Tender Offer should
a large number of shareholders accept the Tender Offer whereby shareholders who do not accept the
Tender Offer may not be able to sell their shares for the desired price and within the desired timeframe.
3) Reduction of risks or impacts that may occur in the future after the Tender Offer that allows the Tender
Offeror to increase its control voting on the Company’s important agenda at shareholders’ meeting.
The offeror may modify such plans or policy after exceeding 12 months from the end of Tender period.
Rationale for Rejecting the Tender Offer
1) After completion of this Tender Offer, TFMAMA will hold more thant 50 percent equity in PB. TFMAMA
will be able to control majority vote, thus, resulting in inability to counter any block vote in shareholders’
meeting when approval of important matter.
2) The Tender Offer Price of THB 61.16 per share is less than the average price in the 30 day preceding
days of THB 61.44 per share. As such, the price offered by the Offeror may cause the shareholders
who accept the tender offer gaining less profit from this share sale than expected.
3) Shareholder who accept the Tender Offer will loss the opportunity to receive dividend income. Since
PB is a stable company which paid average 3 years dividend at THB 1.53 per share or 50.43 percent.
Other benefits or impacts from Policies and Business Directions Disclosed in the Tender Offer
(1) The Offeror does not have an intention to delist the Company from the SET and does not have any
plan or policy to materially change the Company’s business operation
(2) The Tender Offer Preparer (Bangkok Bank Public Company Limited) has verified that the sources of
funds of the Tender Offeror for the tender offer for all securities of PB are sufficient to conduct the
tender offer for all securities of PB
(3) The Offeror has no intention to either sell or transfer a significant amount of the issued share capital
of PB both currently hold and to be acquired from this Tender Offer to any person
(4) The Offeror has no intention to materially change the Business’s current policy regarding organization
structure, business management, recruitment and connected transactions.
Based on the information and rationale mentioned above, the IFA has the opinion that the shareholders
should accept the Tender Offer.
In addition, the IFA has considered the Tender Offeror’s policies and business plan mentioned in the Tender
Offer and analyzed the benefits and effects including its possibilities. The shareholders should take into
consideration the information and the IFA’s opinion in all aspects provided herein as a basis to accept or reject
this Tender Offer.
Nevertheless, the shareholders should study information on the Tender Offer (Form 247-4), an opinion of the
Company on the Tender Offer (Form 250-2) and the IFA’s opinion to make a decision whether to accept or
reject this Tender Offer. Nevertheless, the decision to accept or reject rests solely upon the shareholders’
discretion.
Independent financial advisor’s opinion on the Tender Offer [Translation]
© 2018 Grant Thornton Services Ltd. All rights reserved. 3
2. Practice and Information Used in the Preparation of the IFA’s Opinion
Grant Thornton Services Ltd. as an Independent Financial Advisor approved by the Securities and Exchange
Commission, acting independently from the Company, has considered and studied the information regarding
this Voluntary Tender Offer for all securities of the business including the Company’s data and other relevant
information, whether information provided by the Company or information generally disclosed publicly, as per
the following:
• Tender Offer documentation (Form 247-4) and related information memorandum
• Annual registration statement (Form 56-1) of the Company and other related companies
• Auditor’s reports and financial statements
• Financial projection and underlying assumptions
• Interviews with the management and related officers of the Company and related companies
• Statistical data regarding the SET, economic conditions, and relevant industries
The IFA’s opinion is based on the assumption that information, documents as well as interviews with the
management and officers of the Company and related companies are true and correct. The IFA has
considered, studied and analyzed, as well as conducted due diligence with regard to the information obtained
from such interviews with prudence and reasonableness according to professional standards. In addition, the
IFA assumes that the documents and draft documents are enforceable and legally binding without any
information, incidents or conditions that may affect the tender offer. However, the IFA has no reason to doubt
that the aforementioned information is materially inaccurate or incomplete that would adversely affect the
analysis of the information.
The IFA’s opinion is based on industry and economic conditions as well as other external factors at the time
of the study only, including the existing information received, which may be subject to change rendering
subsequent material effect and impact on the opinion of the IFA. The IFA assumes no obligation to update,
revise or reaffirm the opinion stated herein.
The IFA’s opinion is prepared for the use and benefit of the shareholders of the Company. The decision to
accept or reject the Tender Offer is subject to shareholders’ discretion. The shareholders should study the
information attached to this meeting invitation letter in order to exercise their judgment in deciding the
appropriate resolution.

Independent financial advisor’s opinion on the Tender Offer [Translation]
© 2018 Grant Thornton Services Ltd. All rights reserved. 4
3. Background
3.1 Transaction Overview
In 2017, Saha Pathana Inter-holding PLC (SPI) proceeded with a restructuring of its shareholding in the
food businesses of the Saha Group through the acquisition of all the securities of President Holding Co., Ltd.
and the merger of Thai President Foods PLC (or TF at the time) and President Rice Products PLC (“PR”) into
a new corporation under the name of TF as “Thai President Foods PLC” and changing the symbol used in
trading on the Stock Exchange of Thailand (“SET”) from “TF” to “TFMAMA”. As a result of the restructuring,
SPI is responsible for proposing the Tender Offer to acquire all the shares of PR and President Bakery Public
Company Limited (“PB”) in accordance with Notification of the Capital Market Supervisory Board No. TorChor.
12/2554. In this matter, TF has joined with SPI in proposing the Tender Offer to acquire all the shares of PB.
Following the aforesaid restructuring, TFMAMA, the new company resulting from the restructuring, becomes
an ordinary shareholder in PB, which currently has direct holding of a total of 211,062,800 shares in PB or
equivalent to 46.90 percent of the total issued and paid-up shares of the Business, representing the same
number of total voting rights. TFMAMA wishes to make additional investment in PB to increase its equity to
more than 50 percent of the total issued and paid-up shares of the company, rendering PB a subsidiary of
TFMAMA and demonstrating efficient management of excess cash with return on investment in the form of
regular dividend payment from one of Thailand’s strongest business leaders in the bakery industry, capable of
continually generating profit and posing a low risk of volatility compared to other industries.
In the TFMAMA Board of Directors’ Meeting No. 8/2561 on 15 August 2018, a resolution was passed to
approve the Voluntary Tender Offer in accordance with Notification of the Capital Market Supervisory Board
No. TorChor. 12/2554 on Conditions and Procedures for the Acquisition of Securities for Business Takeovers
dated 13 May 2011 (“Notification TorChor.12/2554”) with offering price of THB 61.16 per share. TFMAMA
submitted the Statement of Intention to Make a Tender Offer (Form 247-3) and the Tender Offer (Form 247-4)
to the Securities and Exchange Commission of Thailand on 29 August 2018.
Significant elements of the Tender Offer are as follows:
Figure 3-1: Sharehloding structure before and after Tender Offer of TFMAMA
Note: (1) In case all shareholders of the Company have shown their intention not to sell all their shares in this Tender Offer
(2) In case all shareholders of the Company (except shareholders who declare its intentions not to sell all of its shares) have shown their intention to sell all
their shares in this Tender Offer.
(3) In case only SPI have shown their intention to sell their share in this Tender Offer.
Independent financial advisor’s opinion on the Tender Offer [Translation]
© 2018 Grant Thornton Services Ltd. All rights reserved. 5
3.1.1 Name of the Tender Offeror
• Thai President Foods PLC
3.1.2 Type and class of securities offered to be purchased
• The Tender Offeror offers to buy ordinary shares of the Business as it has only one type of
securities. There are a total of 450,000,000 issued and paid-up ordinary shares at par value of
THB 1 per share, with each ordinary share equivalent to 1 voting right of the business.
• On the date of the Tender Offer, the Tender Offeror holds a total of 211,062,800 ordinary shares
in the Business, representing 46.90 percent of the total of issued and paid-up shares and the
same proportion of voting rights. Therefore, the highest number of shares the Tender Offeror
may offer to buy from other shareholders would not exceed 238,937,200 shares or equivalent to
53.10 percent of the total issued and paid-up shares and 53.10 percent of the total voting rights
of the Business.
• SPI, one of the major shareholders of PB, expressed its intention to confirm it did not wish to sell,
and in fact agreed not to sell the ordinary shares it holds which amounted to a total of 90,450,000
shares or equivalent to 20.10 percent of the total number of issued and paid-up shares and the
same proportion of voting rights of the Business in this Voluntary Tender Offer. It furthermore
agrees to proceed not to allow any trading or transfer ownership of such ordinary shares during
the Offer Period.
• The Tender Offeror must offer to buy ordinary shares from other shareholders of the Business
(once the number of ordinary shares held by SPI is deducted following its decision not to sell) of
which the total number would now not exceed 148,487,200 shares or equivalent to 33.00 percent
of the total number of issued and paid-up shares and the same proportion of voting rights of the
Business.
3.1.3 Tender Offer Price
• The Tender Offer Price for the ordinary shares of PB is THB 61.61 per share which excludes the
right to receive interim dividend for the first 6 months from 1 January 2018 to 30 June 2018 at
the rate of THB 0.75 per share as per the resolution of the Board of Directors of the Business on
14 August 2018. The record date for the right to receive the dividend is August 29, 2018 and the
dividend will be paid on September 13, 2018. Shareholders who accept the Tender Offer (each
an “Offeree”) are subject to a brokerage fee of 0.25 of the Offer Price and 7-percent value added
tax on the brokerage fee. Therefore, the net price to be received by the Offeree is THB 60.996397
per share. Such Offer Price is the final offer price, not subject to any further change (unless
otherwise complying with the conditions in 3.1.5 “Conditions of Changes to the Tender Offer”).
3.1.4 Offer Period
• The Tender Offeror will purchase the Business’ shares over a total period of 45 business days
from 3 September 2018 to 6 November 2018 inclusive (the “Offer Period”) during the office hours
of the Tender Offer Agent from 9.00 a.m. to 4.00 p.m. Such Tender Period is the final period
which shall not be further extended
Independent financial advisor’s opinion on the Tender Offer [Translation]
© 2018 Grant Thornton Services Ltd. All rights reserved. 6
3.1.5 Conditions of Changes to the Tender Offer
The Tender Offeror may change conditions of the Tender Offer as follows:
• The Tender Offeror may reduce the Offer Price or extend the Offer Period should there be any
event that materially affects the financial status or assets of the Business during the Offer
Period.
• The Tender Offeror may amend the offer terms or extend the Offer Period for the purpose of
competing with another offeror who may submit a tender offer for the same securities during the
Offer Period.
3.1.6 Conditions for Revoking the Tender Offer
The Tender Offeror may revoke the Tender Offer in any of the following cases:
• In case there is any event or action after The Tender Offeror submits the Tender Offer to the
Office of the Securities and Exchange Commission (the “SEC”) but still within the Offer Period
that causes or may cause significant damage to the Business’ financial status or assets where
such event or action does not result from The Tender Offeror’s action or it is not an action for
which The Tender Offeror shall be responsible; or
• Any action conducted by the Business after the submission of the Tender Offer Form to the
SEC but within the Offer Period which causes or may cause a significant decrease in the value
of the Business’ shares; or
• Any action conducted by the Business as defined in the Notification of the Capital Markets
Supervisory Board No. TorChor. 14/2554 Re: Actions or Omission of Actions That May Affect
the Result of Tender Offer of 25 July 2011 (including any amendments thereof).
3.1.7 Period during which securities holders may revoke their intent to accept the Tender Offer
• The Offeree may revoke its intention to accept the Tender Offer at the office of the Tender Offer
Agent on any business day from 3 September 2018 to 5 October 2018 from 9:00 a.m. to 4:00
p.m. (a total of 25 business days) (the “Tender Offer Revocation Period”).
3.1.8 Conditions of Payment
• The Tender Offeror will pay the Offeree within the second business day from the end of the
Offer Period (which will be 8 November 2018) subject, however, to the accuracy, completion
and validity of the Tender Offer Acceptance Form submitted by the Offeree and upon the
completion and validity of the securities transfer.
3.1.9 Source of Funding to Finance the Tender Offer
• In cases where other shareholders (who are not the Tender Offeror) express the intention to sell
all ordinary shares of the Business under this Tender Offer, TFMAMA as the Tender Offeror must
offer to buy a total of 238,937,200 ordinary shares, equivalent to 53.10 percent of the issued and
paid-up shares of the Business. The funds required for TFMAMA to acquire the remaining
securities of the Business under this Tender Offer amounts to a total of THB 14,613,399,152 at
the Tender Price of THB 61.16 per share.
Independent financial advisor’s opinion on the Tender Offer [Translation]
© 2018 Grant Thornton Services Ltd. All rights reserved. 7
• SPI, which is one of the major shareholders of PB, has expressed its intention in writing stating
its unwillingness to sell and agreement not to sell the 90,450,000 ordinary shares held in the
Business, equivalent to 20.10 percent of the issued and paid-up shares of the Business and
representing 20.10 percent of the voting rights. SPI has additionally undertaken to disallow the
sale or ownership transfer of such shares during the Offer Period.
• The total number of ordinary shares of PB which the Tender Offeror must acquire, after deducting
the number of ordinary shares held by SPI which it agreed not sell, amounts to 148,487,200
shares or 33.00 percent of the issued and paid-up ordinary shares of the Business, and
representing 33.00 percent of the total voting rights of the Business, at a total value of THB
9,081,477,152 at the Offer Price of THB 61.16 per share.
• TFMAMA, as the Tender Offeror, has funding of THB 10,565,183,854 to cover the amount required
to be utilized as payment of the Tender Offer to acquire all the Business shares held by other
shareholders, after deduction of the number of ordinary shares held by SPI which it has agreed
to be excluded from the shares tendered. Funding sources are as follows:
1. Cash deposits with Bangkok Bank Public Company Limited, Bank of Ayudhya Public
Company Limited, Kasikorn Bank Public Company Limited, Kiatnakin Bank Public Company
Limited, Citibank, Tisco Bank Public Company Limited, Thanachart Bank Public Company
Limited, Land and Houses Bank Public Company Limited, Government Housing Bank
amounting to a total of THB 6,065,183,854.
2. Credit Facilities with Kasikorn Bank Public Company Limited which issued a letter on 24 July
2018 confirming financial support to the Offeror in the Tender Offer within the limit of THB
4,500,000,000 for the period from 1 August 2018 to 30 November 2018.

Independent financial advisor’s opinion on the Tender Offer [Translation]
© 2018 Grant Thornton Services Ltd. All rights reserved. 8
4. Information of the Tender Offeror and PB
4.1 Details of the Tender Offeror – Thai President Foods PLC
4.1.1 General Information of Business Operations and Key Developments of the Tender Offeror
Thai President Foods PLC (“TFMAMA”) is a listed company incorporated under Thai law from the
amalgamation of Thai President Foods PLC (TF) and President Rice Products PLC (PR) on 16 October 2017
and domiciled in Thailand, with Saha Pathana Inter-holding PLC, a listed company in Thailand, as a major
shareholder The principal business of the Company is production and distribution of semi-instant noodles and
foods, crackers, with registered address and head office of the Company located at 304 TF Group Building,
Sri Nakharin Road, Huamark Sub-district, Bang Kapi, Bangkok. The Company has 5 plants located in Chonburi
Province, Lamphun Province, Rayong Province and another 2 in Ratchaburi Province.
TFMAMA is a listed company in the SET with current registered and paid up capital of THB 329,704,014
divided into 329,704,014 ordinary shares at par value of THB 1 per share.
Table 4-1: Major change and development of TFMAMA
Period Description
1976 TF increased registered capital to THB 10 million. Production capacity was boosted with the construction of the new
2nd factory in Sri Racha, Chonburi produced new varieties of instant noodles for the market.
1978 – Registered capital was further increase to THB 20 million. TF constructed biscuit factory in the Sri Racha
instant noodle factory, aided by technological transfer from Nissin Confectionery Co., Ltd. of Japan. The
expanded facility produced biscuits under the “Nissin” trademark.
- TF’s shares gained listing on the Stock Exchange of Thailand (SET).
1984 Join investment was made in Myojo Foods Co., Ltd. To produce premium quality instant noodle brand “MYOJO”.
1985 Joint investment in President Bakery Co., Ltd. to produce fresh breads.
1988 – Joint investments in Sanko Machinery (Thailand) Co., Ltd. to assemble automatic powder packing machines.
– Joint investments in Thai Mee Co., Ltd. to manufacture instant noodle catering to export.
1990 TF increased registered capital to THB 80 million, joined hands with the Danish Fancy Foods Group Co., Ltd. of
Denmark to establish President Danish Foods Co., Ltd, and produce “Kjeldsen” cookies.
1991 increased registered capital to THB 120 million, T.F. Interfoods (USA) Inc. was founded to oversee TF’s business
and act as its distribution representative in the U.S. and Canada.
1992 – Joint investments were made in Taisun Foods Co., Ltd. with the objective of manufacturing fruit.
– Joint investments were made in Kunming Tai Tongyi Foods Co., Ltd to produce instant noodles for sale in
China.
– TF made join investments to create Dai-Ichi Packaging Co., Ltd. to manufacture packaging, materials which in
turn supplied the Group’s business.
1994 – The firm unveiled its new status as a Public Company on May 16, 1994.
– Joint investments were made in 2 new businesses: C.P. Enterprise Foods Co., Ltd. In Hong Kong and Nissin
Foods (Thailand) Co., Ltd.
1998 Joint investments in Mekong Delta Success Venture Co., Ltd. to manufacture instant noodles in Vietnam.
1999 TF has launched the biscuit products under Brand “BISSIN” in August 1999.
2001 For foreign investment, TF invested 30% in President Foods (Cambodia) for manufacturing instant noodles in
Cambodia.
2002 – For the investment, TF has increased investment proportion in Lifook (Gingdao) Foods Co., Ltd. totaling THB
26.22 million resulting in the increase in TF’s portion of investment in Lifook (Gingdao) Foods Co., Ltd. from
19% to 49%
– TF has joined in the investment with 4 People Foods Co., Ltd. for 13% of its registered capital.
2004 Joint investment was made in Thai Anbao Paper Products Company Limited.
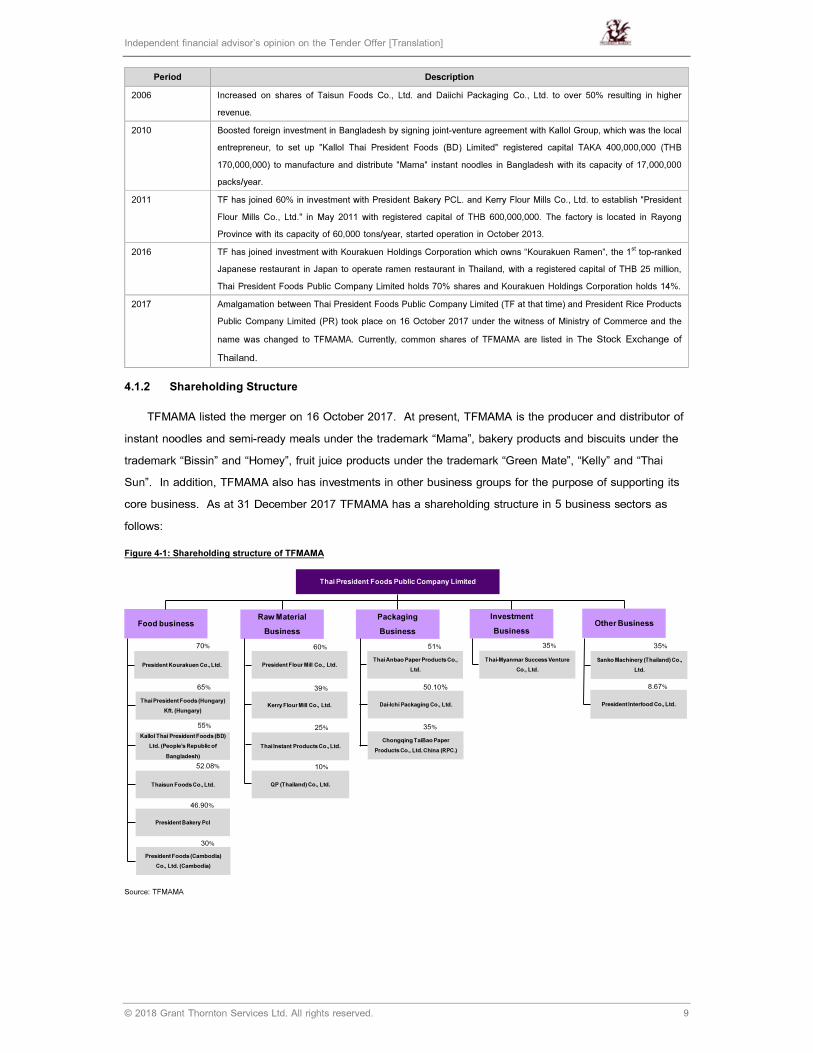
Independent financial advisor’s opinion on the Tender Offer [Translation]
© 2018 Grant Thornton Services Ltd. All rights reserved. 9
Period Description
2006 Increased on shares of Taisun Foods Co., Ltd. and Daiichi Packaging Co., Ltd. to over 50% resulting in higher
revenue.
2010 Boosted foreign investment in Bangladesh by signing joint-venture agreement with Kallol Group, which was the local
entrepreneur, to set up "Kallol Thai President Foods (BD) Limited" registered capital TAKA 400,000,000 (THB
170,000,000) to manufacture and distribute "Mama" instant noodles in Bangladesh with its capacity of 17,000,000
packs/year.
2011 TF has joined 60% in investment with President Bakery PCL. and Kerry Flour Mills Co., Ltd. to establish "President
Flour Mills Co., Ltd." in May 2011 with registered capital of THB 600,000,000. The factory is located in Rayong
Province with its capacity of 60,000 tons/year, started operation in October 2013.
2016 TF has joined investment with Kourakuen Holdings Corporation which owns “Kourakuen Ramen”, the 1st top-ranked
Japanese restaurant in Japan to operate ramen restaurant in Thailand, with a registered capital of THB 25 million,
Thai President Foods Public Company Limited holds 70% shares and Kourakuen Holdings Corporation holds 14%.
2017 Amalgamation between Thai President Foods Public Company Limited (TF at that time) and President Rice Products
Public Company Limited (PR) took place on 16 October 2017 under the witness of Ministry of Commerce and the
name was changed to TFMAMA. Currently, common shares of TFMAMA are listed in The Stock Exchange of
Thailand.
4.1.2 Shareholding Structure
TFMAMA listed the merger on 16 October 2017. At present, TFMAMA is the producer and distributor of
instant noodles and semi-ready meals under the trademark “Mama”, bakery products and biscuits under the
trademark “Bissin” and “Homey”, fruit juice products under the trademark “Green Mate”, “Kelly” and “Thai
Sun”. In addition, TFMAMA also has investments in other business groups for the purpose of supporting its
core business. As at 31 December 2017 TFMAMA has a shareholding structure in 5 business sectors as
follows:
Figure 4-1: Shareholding structure of TFMAMA
Source: TFMAMA
Sanko Machinery (Thailand) Co.,
Ltd.
President Interfood Co., Ltd.
Thai President Foods Public Company Limited
Food businessInvestment
Business
Packaging
Business
Raw Material
BusinessOther Business
President Kourakuen Co., Ltd.
Thai President Foods (Hungary)
Kft. (Hungary)
Kallol Thai President Foods (BD)
Ltd. (People’s Republic of
Bangladesh)
President Bakery Pcl
Thaisun Foods Co., Ltd.
President Flour Mill Co., Ltd.
Kerry Flour Mill Co., Ltd.
Thai Instant Products Co., Ltd.
Thai Anbao Paper Products Co.,
Ltd.
Dai-Ichi Packaging Co., Ltd.
Chongqing TaiBao Paper
Products Co., Ltd. China (RPC.)
QP (Thailand) Co., Ltd.
Thai-Myanmar Success Venture
Co., Ltd.
70%
65%
55%
52.08%
46.90%
President Foods (Cambodia)
Co., Ltd. (Cambodia)
30%
60%
39%
25%
10%
51%
50.10%
35%
35% 35%
8.67%
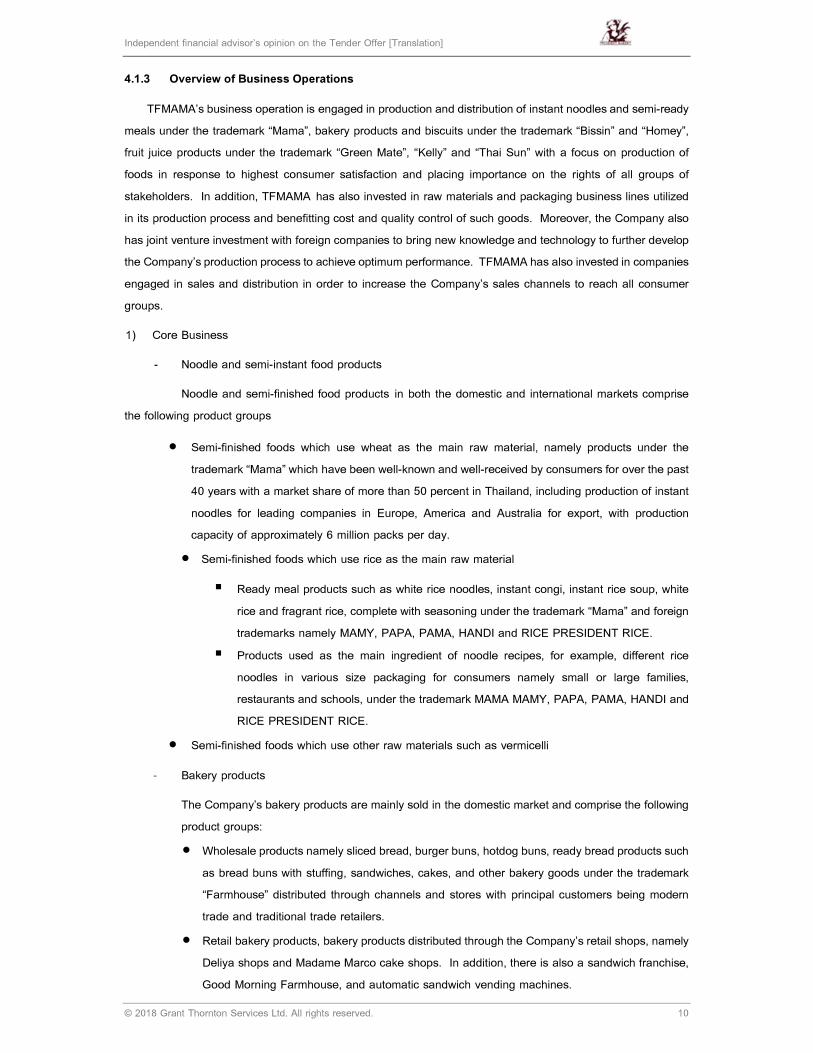
Independent financial advisor’s opinion on the Tender Offer [Translation]
© 2018 Grant Thornton Services Ltd. All rights reserved. 10
4.1.3 Overview of Business Operations
TFMAMA’s business operation is engaged in production and distribution of instant noodles and semi-ready
meals under the trademark “Mama”, bakery products and biscuits under the trademark “Bissin” and “Homey”,
fruit juice products under the trademark “Green Mate”, “Kelly” and “Thai Sun” with a focus on production of
foods in response to highest consumer satisfaction and placing importance on the rights of all groups of
stakeholders. In addition, TFMAMA has also invested in raw materials and packaging business lines utilized
in its production process and benefitting cost and quality control of such goods. Moreover, the Company also
has joint venture investment with foreign companies to bring new knowledge and technology to further develop
the Company’s production process to achieve optimum performance. TFMAMA has also invested in companies
engaged in sales and distribution in order to increase the Company’s sales channels to reach all consumer
groups.
1) Core Business
- Noodle and semi-instant food products
Noodle and semi-finished food products in both the domestic and international markets comprise
the following product groups
• Semi-finished foods which use wheat as the main raw material, namely products under the
trademark “Mama” which have been well-known and well-received by consumers for over the past
40 years with a market share of more than 50 percent in Thailand, including production of instant
noodles for leading companies in Europe, America and Australia for export, with production
capacity of approximately 6 million packs per day.
• Semi-finished foods which use rice as the main raw material
� Ready meal products such as white rice noodles, instant congi, instant rice soup, white
rice and fragrant rice, complete with seasoning under the trademark “Mama” and foreign
trademarks namely MAMY, PAPA, PAMA, HANDI and RICE PRESIDENT RICE.
� Products used as the main ingredient of noodle recipes, for example, different rice
noodles in various size packaging for consumers namely small or large families,
restaurants and schools, under the trademark MAMA MAMY, PAPA, PAMA, HANDI and
RICE PRESIDENT RICE.
• Semi-finished foods which use other raw materials such as vermicelli
- Bakery products
The Company’s bakery products are mainly sold in the domestic market and comprise the following
product groups:
• Wholesale products namely sliced bread, burger buns, hotdog buns, ready bread products such
as bread buns with stuffing, sandwiches, cakes, and other bakery goods under the trademark
“Farmhouse” distributed through channels and stores with principal customers being modern
trade and traditional trade retailers.
• Retail bakery products, bakery products distributed through the Company’s retail shops, namely
Deliya shops and Madame Marco cake shops. In addition, there is also a sandwich franchise,
Good Morning Farmhouse, and automatic sandwich vending machines.
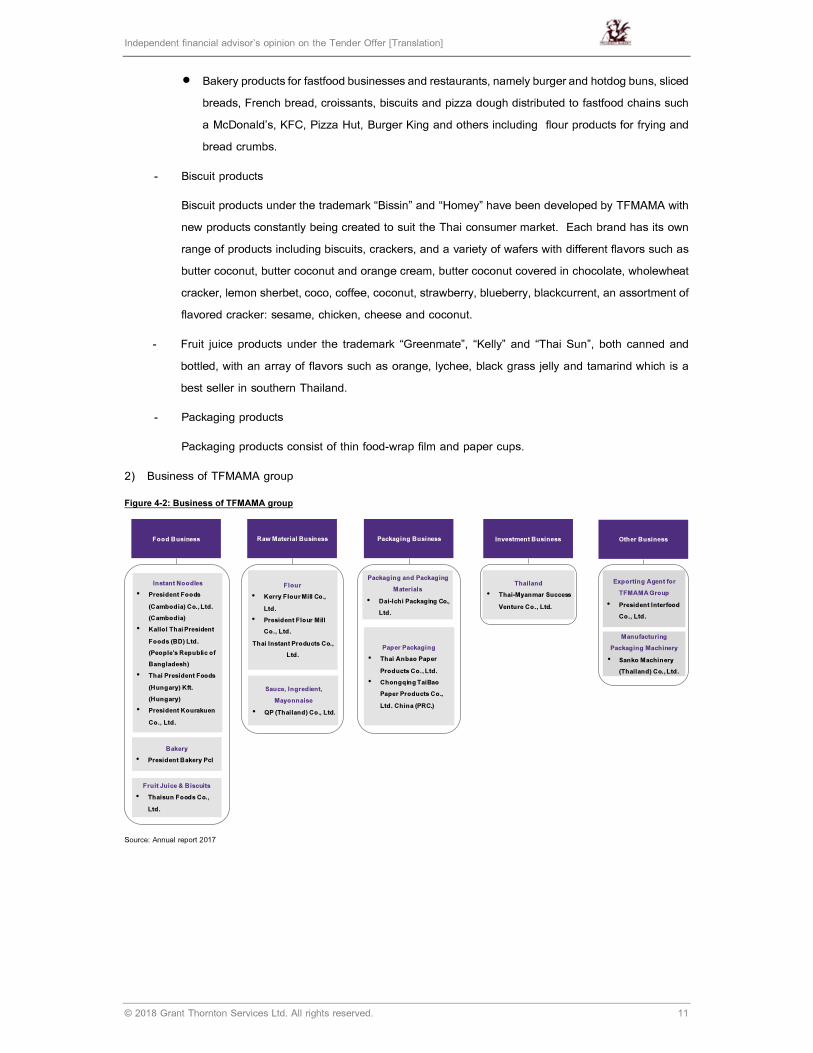
Independent financial advisor’s opinion on the Tender Offer [Translation]
© 2018 Grant Thornton Services Ltd. All rights reserved. 11
• Bakery products for fastfood businesses and restaurants, namely burger and hotdog buns, sliced
breads, French bread, croissants, biscuits and pizza dough distributed to fastfood chains such
a McDonald’s, KFC, Pizza Hut, Burger King and others including flour products for frying and
bread crumbs.
- Biscuit products
Biscuit products under the trademark “Bissin” and “Homey” have been developed by TFMAMA with
new products constantly being created to suit the Thai consumer market. Each brand has its own
range of products including biscuits, crackers, and a variety of wafers with different flavors such as
butter coconut, butter coconut and orange cream, butter coconut covered in chocolate, wholewheat
cracker, lemon sherbet, coco, coffee, coconut, strawberry, blueberry, blackcurrent, an assortment of
flavored cracker: sesame, chicken, cheese and coconut.
- Fruit juice products under the trademark “Greenmate”, “Kelly” and “Thai Sun”, both canned and
bottled, with an array of flavors such as orange, lychee, black grass jelly and tamarind which is a
best seller in southern Thailand.
- Packaging products
Packaging products consist of thin food-wrap film and paper cups.
2) Business of TFMAMA group
Figure 4-2: Business of TFMAMA group
Source: Annual report 2017
Food Business Raw Material Business Packaging Business Investment Business Other Business
Fruit Juice & Biscuits
• Thaisun Foods Co.,
Ltd.
Instant Noodles
• President Foods
(Cambodia) Co., Ltd.
(Cambodia)
• Kallol Thai President
Foods (BD) Ltd.
(People's Republic of
Bangladesh)
• Thai President Foods
(Hungary) Kft.
(Hungary)
• President Kourakuen
Co., Ltd.
Flour
• Kerry Flour Mill Co.,
Ltd.
• President Flour Mill
Co., Ltd.
Thai Instant Products Co.,
Ltd.
Sauce, Ingredient,
Mayonnaise
• QP (Thailand) Co., Ltd.
Packaging and Packaging
Materials
• Dai-Ichi Packaging Co.,
Ltd.
Paper Packaging
• Thai Anbao Paper
Products Co., Ltd.
• Chongqing TaiBao
Paper Products Co.,
Ltd. China (PRC.)
Thailand
• Thai-Myanmar Success
Venture Co., Ltd.
Exporting Agent for
TFMAMA Group
• President Interfood
Co., Ltd.
Manufacturing
Packaging Machinery
• Sanko Machinery
(Thailand) Co., Ltd.
Bakery
• President Bakery Pcl
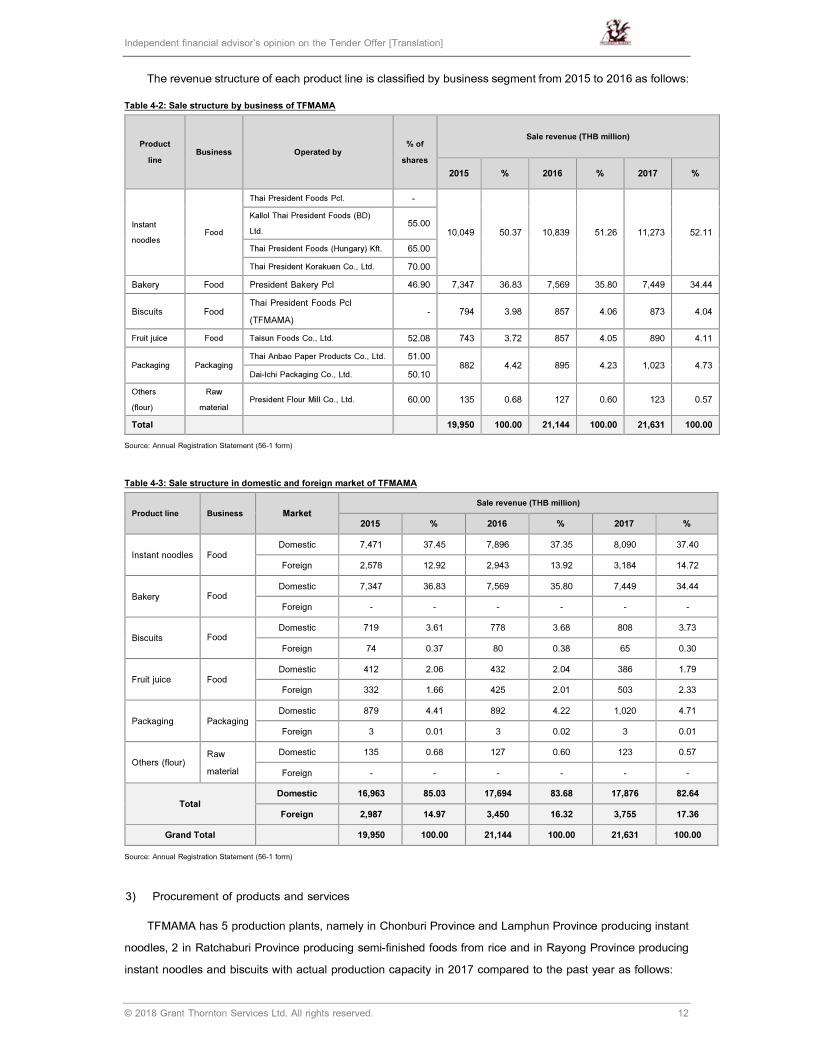
Independent financial advisor’s opinion on the Tender Offer [Translation]
© 2018 Grant Thornton Services Ltd. All rights reserved. 12
The revenue structure of each product line is classified by business segment from 2015 to 2016 as follows:
Table 4-2: Sale structure by business of TFMAMA
Product
line Business Operated by
% of
shares
Sale revenue (THB million)
2015 % 2016 % 2017 %
Instant
noodles Food
Thai President Foods Pcl. -
10,049 50.37 10,839 51.26 11,273 52.11
Kallol Thai President Foods (BD)
Ltd. 55.00
Thai President Foods (Hungary) Kft. 65.00
Thai President Korakuen Co., Ltd. 70.00
Bakery Food President Bakery Pcl 46.90 7,347 36.83 7,569 35.80 7,449 34.44
Biscuits Food Thai President Foods Pcl
(TFMAMA) - 794 3.98 857 4.06 873 4.04
Fruit juice Food Taisun Foods Co., Ltd. 52.08 743 3.72 857 4.05 890 4.11
Packaging Packaging Thai Anbao Paper Products Co., Ltd. 51.00
882 4.42 895 4.23 1,023 4.73 Dai-Ichi Packaging Co., Ltd. 50.10
Others
(flour)
Raw
material President Flour Mill Co., Ltd. 60.00 135 0.68 127 0.60 123 0.57
Total 19,950 100.00 21,144 100.00 21,631 100.00
Source: Annual Registration Statement (56-1 form)
Table 4-3: Sale structure in domestic and foreign market of TFMAMA
Product line Business Market
Sale revenue (THB million)
2015 % 2016 % 2017 %
Instant noodles Food Domestic 7,471 37.45 7,896 37.35 8,090 37.40
Foreign 2,578 12.92 2,943 13.92 3,184 14.72
Bakery
Food Domestic 7,347 36.83 7,569 35.80 7,449 34.44
Foreign - - - - - -
Biscuits
Food Domestic 719 3.61 778 3.68 808 3.73
Foreign 74 0.37 80 0.38 65 0.30
Fruit juice Food Domestic 412 2.06 432 2.04 386 1.79
Foreign 332 1.66 425 2.01 503 2.33
Packaging Packaging Domestic 879 4.41 892 4.22 1,020 4.71
Foreign 3 0.01 3 0.02 3 0.01
Others (flour) Raw
material
Domestic 135 0.68 127 0.60 123 0.57
Foreign - - - - - -
Total Domestic 16,963 85.03 17,694 83.68 17,876 82.64
Foreign 2,987 14.97 3,450 16.32 3,755 17.36
Grand Total 19,950 100.00 21,144 100.00 21,631 100.00
Source: Annual Registration Statement (56-1 form)
3) Procurement of products and services
TFMAMA has 5 production plants, namely in Chonburi Province and Lamphun Province producing instant
noodles, 2 in Ratchaburi Province producing semi-finished foods from rice and in Rayong Province producing
instant noodles and biscuits with actual production capacity in 2017 compared to the past year as follows:

Independent financial advisor’s opinion on the Tender Offer [Translation]
© 2018 Grant Thornton Services Ltd. All rights reserved. 13
Table 4-4: Comparison of the production capacity and the actual production in 2016-2017 of TFMAMA
Factory Instant noodles (tons/day) Biscuits (tons/day)
Production capacity 1
Actual2
% Production capacity1
Actual %
Chon Buri
2017 230.25 248.69 108.01 - - -
2016 230.25 256.07 111.21 - - -
Lumpoon
2017 84.24 74.79 88.78 - - -
2016 81.88 80.17 97.91 - - -
Rayong3
2017 63.00 64.00 101.59 45.00 32.33 71.84
2016 49.20 46.52 94.55 44.30 32.21 72.71
Ratchaburi 1 and Ratchaburi 2
2017 48.67 43.96 90.32 - - -
2016 48.67 40.83 83.89
Total
2017 361.33 382.76 105.93 44.30 32.21 72.71
2016 363.18 359.84 99.08 44.30 29.52 66.64
Source: Annual Registration Statement (56-1 form)
Remarks: 1 Two shift production capacity less 10% machine maintenance period. There were 300 production days.
2 The actual production for year 2017 was calculated from the actual production from January to December.
3/ . Rayong factory stopped replacing 2 old machines for 6 months. One machine started production in September 2016 and the second machine has started
production in January 2017, the production capacity decreased by an average of 8.78 tons/day in 2016.
In terms of sourcing raw materials, since these are mainly agricultural raw materials which can be procured
domestically and internationally from such countries as Australia, Malaysia, Japan, etc. so there is no problem regarding
shortage of raw materials to feed the factories. Additionally, TFMAMA has a number of suppliers which mitigates the
risk of sourcing raw materials if any one of the suppliers dropped out. Moreover, this also increases the Company’s
leverage in negotiating prices and selection of quality goods. None of the Company’s suppliers provide more than 30
percent of the total of raw materials used in production. For some raw materials with higher proportion of utilization in
the production process, the Company would conclude advance purchase agreements with some suppliers to lessen
risks pertaining to pricing and delivery volume. The contracts normally specify the volume, price and delivery date,
usually on a quarterly and annual basis. However, when considering the raw materials cost structure, it was found that
none of the raw materials had a proportion of utilization of more than 50 percent.
4.1.4 Shareholding Structure
As at 31 July 2018, TFMAMA had registered and paid-up capital of THB 329,704,014 and divided into
329,704,014 ordinary shares at par value of THB 1 per share, with the following shareholding structure:
Table 4-5: Major shareholders of TFMAMA
No. Name No. of shares %
1 Saha Pathana Inter-Holding Public Company Limited 82,994,102 25.17%
2 Nissin Foods Holdings Co., Ltd. 55,534,253 16.84%
3 Mr. Pipat Paniangvait 22,167,005 6.72%
4 Mr. Weerapat Punsak-Udomsin 21,751,334 6.60%
5 Nomura Securities Co Ltd-Client A/C 10,470,274 3.18%
6 Unicentral Co., Ltd. 7,602,387 2.31%
7 Sahapatanapibul Public Company Limited 6,431,151 1.95%
8 Mr. Kamthorn Tatiyakavee 5,792,527 1.76%
9 Universe Beauty Co., Ltd. 5,521,076 1.67%
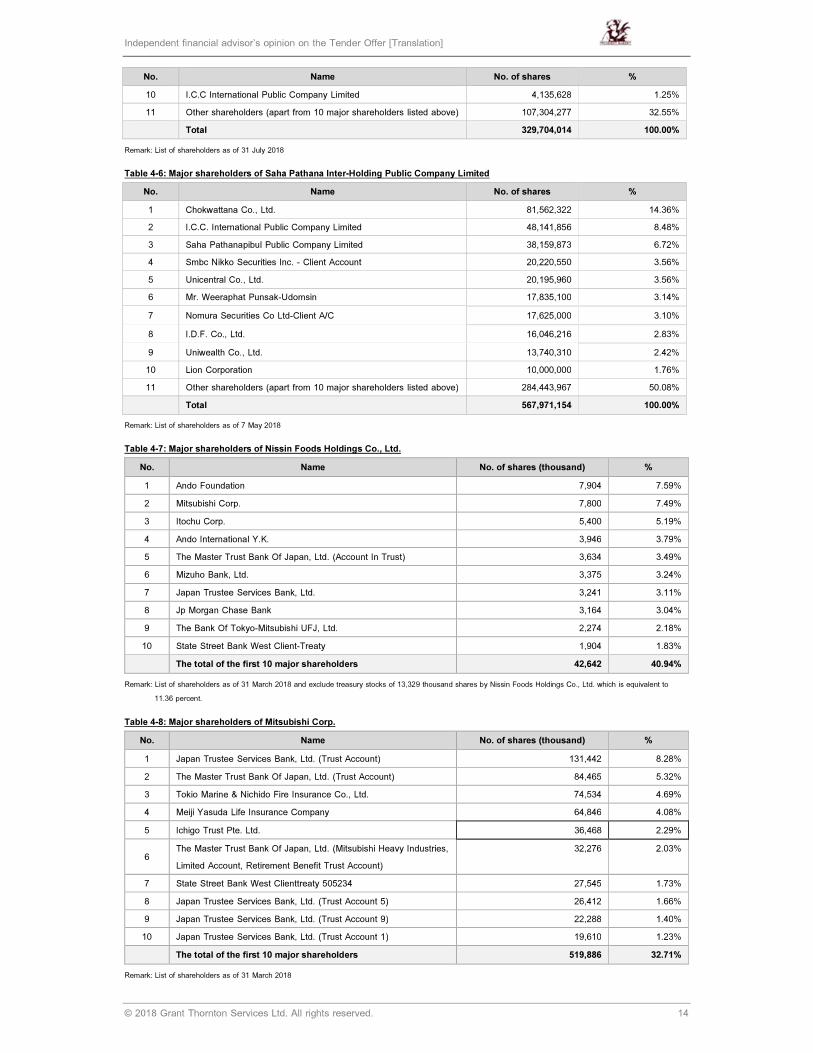
Independent financial advisor’s opinion on the Tender Offer [Translation]
© 2018 Grant Thornton Services Ltd. All rights reserved. 14
No. Name No. of shares %
10 I.C.C International Public Company Limited 4,135,628 1.25%
11 Other shareholders (apart from 10 major shareholders listed above) 107,304,277 32.55%
Total 329,704,014 100.00%
Remark: List of shareholders as of 31 July 2018
Table 4-6: Major shareholders of Saha Pathana Inter-Holding Public Company Limited
No. Name No. of shares %
1 Chokwattana Co., Ltd. 81,562,322 14.36%
2 I.C.C. International Public Company Limited 48,141,856 8.48%
3 Saha Pathanapibul Public Company Limited 38,159,873 6.72%
4 Smbc Nikko Securities Inc. - Client Account 20,220,550 3.56%
5 Unicentral Co., Ltd. 20,195,960 3.56%
6 Mr. Weeraphat Punsak-Udomsin 17,835,100 3.14%
7 Nomura Securities Co Ltd-Client A/C 17,625,000 3.10%
8 I.D.F. Co., Ltd. 16,046,216 2.83%
9 Uniwealth Co., Ltd. 13,740,310 2.42%
10 Lion Corporation 10,000,000 1.76%
11 Other shareholders (apart from 10 major shareholders listed above) 284,443,967 50.08%
Total 567,971,154 100.00%
Remark: List of shareholders as of 7 May 2018
Table 4-7: Major shareholders of Nissin Foods Holdings Co., Ltd.
No. Name No. of shares (thousand) %
1 Ando Foundation 7,904 7.59%
2 Mitsubishi Corp. 7,800 7.49%
3 Itochu Corp. 5,400 5.19%
4 Ando International Y.K. 3,946 3.79%
5 The Master Trust Bank Of Japan, Ltd. (Account In Trust) 3,634 3.49%
6 Mizuho Bank, Ltd. 3,375 3.24%
7 Japan Trustee Services Bank, Ltd. 3,241 3.11%
8 Jp Morgan Chase Bank 3,164 3.04%
9 The Bank Of Tokyo-Mitsubishi UFJ, Ltd. 2,274 2.18%
10 State Street Bank West Client-Treaty 1,904 1.83%
The total of the first 10 major shareholders 42,642 40.94%
Remark: List of shareholders as of 31 March 2018 and exclude treasury stocks of 13,329 thousand shares by Nissin Foods Holdings Co., Ltd. which is equivalent to
11.36 percent.
Table 4-8: Major shareholders of Mitsubishi Corp.
No. Name No. of shares (thousand) %
1 Japan Trustee Services Bank, Ltd. (Trust Account) 131,442 8.28%
2 The Master Trust Bank Of Japan, Ltd. (Trust Account) 84,465 5.32%
3 Tokio Marine & Nichido Fire Insurance Co., Ltd. 74,534 4.69%
4 Meiji Yasuda Life Insurance Company 64,846 4.08%
5 Ichigo Trust Pte. Ltd. 36,468 2.29%
6 The Master Trust Bank Of Japan, Ltd. (Mitsubishi Heavy Industries,
Limited Account, Retirement Benefit Trust Account)
32,276 2.03%
7 State Street Bank West Clienttreaty 505234 27,545 1.73%
8 Japan Trustee Services Bank, Ltd. (Trust Account 5) 26,412 1.66%
9 Japan Trustee Services Bank, Ltd. (Trust Account 9) 22,288 1.40%
10 Japan Trustee Services Bank, Ltd. (Trust Account 1) 19,610 1.23%
The total of the first 10 major shareholders 519,886 32.71%
Remark: List of shareholders as of 31 March 2018
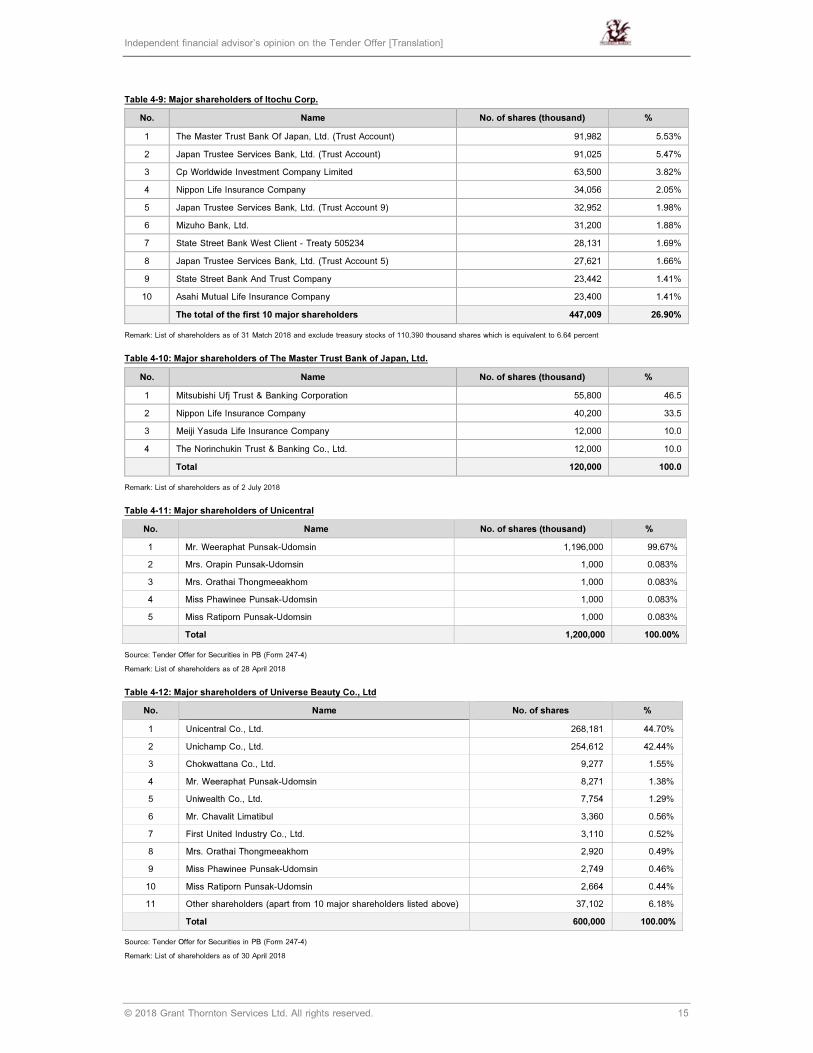
Independent financial advisor’s opinion on the Tender Offer [Translation]
© 2018 Grant Thornton Services Ltd. All rights reserved. 15
Table 4-9: Major shareholders of Itochu Corp.
No. Name No. of shares (thousand) %
1 The Master Trust Bank Of Japan, Ltd. (Trust Account) 91,982 5.53%
2 Japan Trustee Services Bank, Ltd. (Trust Account) 91,025 5.47%
3 Cp Worldwide Investment Company Limited 63,500 3.82%
4 Nippon Life Insurance Company 34,056 2.05%
5 Japan Trustee Services Bank, Ltd. (Trust Account 9) 32,952 1.98%
6 Mizuho Bank, Ltd. 31,200 1.88%
7 State Street Bank West Client - Treaty 505234 28,131 1.69%
8 Japan Trustee Services Bank, Ltd. (Trust Account 5) 27,621 1.66%
9 State Street Bank And Trust Company 23,442 1.41%
10 Asahi Mutual Life Insurance Company 23,400 1.41%
The total of the first 10 major shareholders 447,009 26.90%
Remark: List of shareholders as of 31 Match 2018 and exclude treasury stocks of 110,390 thousand shares which is equivalent to 6.64 percent
Table 4-10: Major shareholders of The Master Trust Bank of Japan, Ltd.
No. Name No. of shares (thousand) %
1 Mitsubishi Ufj Trust & Banking Corporation 55,800 46.5
2 Nippon Life Insurance Company 40,200 33.5
3 Meiji Yasuda Life Insurance Company 12,000 10.0
4 The Norinchukin Trust & Banking Co., Ltd. 12,000 10.0
Total 120,000 100.0
Remark: List of shareholders as of 2 July 2018
Table 4-11: Major shareholders of Unicentral
No. Name No. of shares (thousand) %
1 Mr. Weeraphat Punsak-Udomsin 1,196,000 99.67%
2 Mrs. Orapin Punsak-Udomsin 1,000 0.083%
3 Mrs. Orathai Thongmeeakhom 1,000 0.083%
4 Miss Phawinee Punsak-Udomsin 1,000 0.083%
5 Miss Ratiporn Punsak-Udomsin 1,000 0.083%
Total 1,200,000 100.00%
Source: Tender Offer for Securities in PB (Form 247-4)
Remark: List of shareholders as of 28 April 2018
Table 4-12: Major shareholders of Universe Beauty Co., Ltd
No. Name No. of shares %
1 Unicentral Co., Ltd. 268,181 44.70%
2 Unichamp Co., Ltd. 254,612 42.44%
3 Chokwattana Co., Ltd. 9,277 1.55%
4 Mr. Weeraphat Punsak-Udomsin 8,271 1.38%
5 Uniwealth Co., Ltd. 7,754 1.29%
6 Mr. Chavalit Limatibul 3,360 0.56%
7 First United Industry Co., Ltd. 3,110 0.52%
8 Mrs. Orathai Thongmeeakhom 2,920 0.49%
9 Miss Phawinee Punsak-Udomsin 2,749 0.46%
10 Miss Ratiporn Punsak-Udomsin 2,664 0.44%
11 Other shareholders (apart from 10 major shareholders listed above) 37,102 6.18%
Total 600,000 100.00%
Source: Tender Offer for Securities in PB (Form 247-4)
Remark: List of shareholders as of 30 April 2018
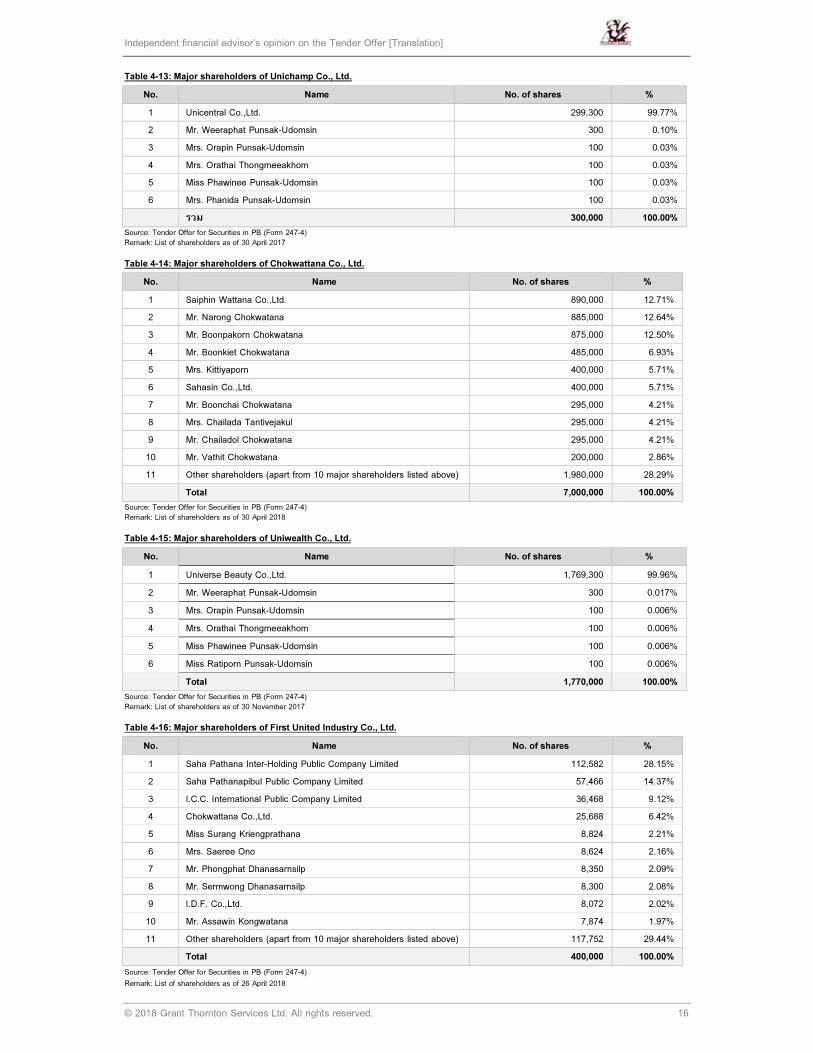
Independent financial advisor’s opinion on the Tender Offer [Translation]
© 2018 Grant Thornton Services Ltd. All rights reserved. 16
Table 4-13: Major shareholders of Unichamp Co., Ltd.
No. Name No. of shares %
1 Unicentral Co.,Ltd. 299,300 99.77%
2 Mr. Weeraphat Punsak-Udomsin 300 0.10%
3 Mrs. Orapin Punsak-Udomsin 100 0.03%
4 Mrs. Orathai Thongmeeakhom 100 0.03%
5 Miss Phawinee Punsak-Udomsin 100 0.03%
6 Mrs. Phanida Punsak-Udomsin 100 0.03%
รวม 300,000 100.00%
Source: Tender Offer for Securities in PB (Form 247-4)
Remark: List of shareholders as of 30 April 2017
Table 4-14: Major shareholders of Chokwattana Co., Ltd.
No. Name No. of shares %
1 Saiphin Wattana Co.,Ltd. 890,000 12.71%
2 Mr. Narong Chokwatana 885,000 12.64%
3 Mr. Boonpakorn Chokwatana 875,000 12.50%
4 Mr. Boonkiet Chokwatana 485,000 6.93%
5 Mrs. Kittiyaporn 400,000 5.71%
6 Sahasin Co.,Ltd. 400,000 5.71%
7 Mr. Boonchai Chokwatana 295,000 4.21%
8 Mrs. Chailada Tantivejakul 295,000 4.21%
9 Mr. Chailadol Chokwatana 295,000 4.21%
10 Mr. Vathit Chokwatana 200,000 2.86%
11 Other shareholders (apart from 10 major shareholders listed above) 1,980,000 28.29%
Total 7,000,000 100.00%
Source: Tender Offer for Securities in PB (Form 247-4)
Remark: List of shareholders as of 30 April 2018
Table 4-15: Major shareholders of Uniwealth Co., Ltd.
No. Name No. of shares %
1 Universe Beauty Co.,Ltd. 1,769,300 99.96%
2 Mr. Weeraphat Punsak-Udomsin 300 0.017%
3 Mrs. Orapin Punsak-Udomsin 100 0.006%
4 Mrs. Orathai Thongmeeakhom 100 0.006%
5 Miss Phawinee Punsak-Udomsin 100 0.006%
6 Miss Ratiporn Punsak-Udomsin 100 0.006%
Total 1,770,000 100.00%
Source: Tender Offer for Securities in PB (Form 247-4)
Remark: List of shareholders as of 30 November 2017
Table 4-16: Major shareholders of First United Industry Co., Ltd.
No. Name No. of shares %
1 Saha Pathana Inter-Holding Public Company Limited 112,582 28.15%
2 Saha Pathanapibul Public Company Limited 57,466 14.37%
3 I.C.C. International Public Company Limited 36,468 9.12%
4 Chokwattana Co.,Ltd. 25,688 6.42%
5 Miss Surang Kriengprathana 8,824 2.21%
6 Mrs. Saeree Ono 8,624 2.16%
7 Mr. Phongphat Dhanasarnsilp 8,350 2.09%
8 Mr. Sermwong Dhanasarnsilp 8,300 2.08%
9 I.D.F. Co.,Ltd. 8,072 2.02%
10 Mr. Assawin Kongwatana 7,874 1.97%
11 Other shareholders (apart from 10 major shareholders listed above) 117,752 29.44%
Total 400,000 100.00%
Source: Tender Offer for Securities in PB (Form 247-4)
Remark: List of shareholders as of 26 April 2018

Independent financial advisor’s opinion on the Tender Offer [Translation]
© 2018 Grant Thornton Services Ltd. All rights reserved. 17
Table 4-17: Major shareholders of I.D.F. Co. Ltd.
No. Name No. of shares %
1 Sinparadorn Co.,Ltd. 43,150 47.94%
2 Saha Pathanapibul Public Company Limited 17,644 19.60%
3 Watsadoramai Co.,Ltd. 11,250 12.50%
4 I.C.C. International Public Company Limited 8,100 9.00%
5 Mr. Boonsithi Chokwatana 3,006 3.34%
6 Sahapat Real Estate Co.,Ltd. 3,000 3.33%
7 First United Industry Co.,Ltd. 1,800 2.00%
8 Mr. Thamarat Chokwatana 1,000 1.11%
9 B S T R 408 Co.,Ltd. 750 0.83%
10 Mr. Boonkiet Chokwatana 150 0.17%
11 Other shareholders (apart from 10 major shareholders listed above) 150 0.17%
รวม 90,000 100.00%
Source: Tender Offer for Securities in PB (Form 247-4)
Remarks: List of shareholders as of 27 April 2018
Shareholders’ information of Saha Pathanapibul Public Company Limited and I.C.C. International Public Company Limited are based on SET website since both
are listed in SET.
4.1.5 Board of Directors and Executive Board
TFMAMA’s Board of Directors as at 31 July 2018 comprises a total of 15 directors as follows:
Table 4-18: Board of Directors of TFMAMA
No. Name Position
1 Mr. Boonsithi Chokwatana1 Chairman
2 Mr. Pipat Paniangvait1 Chief Executive Officer/ Vice Chairman
3 Mr. Karmthon Punsak-Udomsin1 Vice Chairman
4 Mr. Suchai Ratanajiajaroen1 Vice Chairman
5 Dr. Poj Paniangvait1 President
6 Mr. Kamthorn Tatiyakavee1 Director
7 Mr. Apichart Thammanomai1 Director
8 Mr. Boonchai Chokwatana1 Director
9 Mr. Vathit Chokwatana1 Director
10 Miss Pojjana Paniangvait1 Director
11 Dr. Kulpatra Sirodom1 Independent Director / Chairman of the Audit Committee
12 Thanpuying Angkab Punyashthiti Independent Director / Audit Committee
13 Mr. Chaiwat Maraprygsavan Independent Director / Audit Committee
14 Prof. Dr. Visith Chavasit Independent Director
15 Mr. Saroj Chayavivatkul Independent Director
Source: SETSMART
Remark: 1Autorized signatory directors
Table 4-19: Management Team of TFMAMA
No. Name Position
1 Mr. Pipat Paniangvait Chief Executive Officer
2 Mr. Suchai Ratanajiajaroen Vice Chairman
3 Dr. Poj Paniangvait President
4 Dr. Pojjanee Paniangvait Vice President
5 Miss Pojjana Paniangvait Assistant Vice President
6 Ms. Hatairat Kwangchit-Aree Assistant Vice President
7 Mrs. Sodsai Hanchana Assistant Vice President
8 Mr. Petch Paniangvait Manager, Foreign Investments Office
9 Mr. Pun Paniangvait Manager, Presidents Office
10 Miss Sararath Tangsirimongkol Manager, Accounting Department & Company Secretary

Independent financial advisor’s opinion on the Tender Offer [Translation]
© 2018 Grant Thornton Services Ltd. All rights reserved. 18
No. Name Position
11 Mr. Wasan Boonsampankit Manager, Finance & Investment Department (CFO)
12 Mr. Ittiphon Khouharat Manager, Business Development Department
13 Miss Prapin Lawanprasert Manager, Sourcing Department
14 Mr. Sorayut Raksasri Manager, Human Resource & Administration Department
15 Miss Ariya Tangcheevinsirikul Manager, Internal Audit Department
16 Mr. Chumpol Temiyasathit Manager, Research Development Department
17 Miss Sawita Sakulthanasombat Manager, Quality Assurance Dept
18 Miss Nimol Kijkhan Manager, Sriracha Factory
19 Mrs. Suchada Paniangvait Manager, Lamphun Factory
20 Mr. Nirun Poothong Manager, Rayong Factory
Source: Annual Report 2017
4.1.6 Financial Status and Operating Results
Table 4-20: Consolidated statement of financial position of TFMAMA
31 December 2015 31 December 2016 31 December 2017 30 June 2018
THB
million %
THB
million %
THB
million %
THB
million %
Cash and cash equivalents 1,583.58 6.41% 2,444.96 8.96% 2,777.38 9.44% 3,653.19 11.96%
Current investments 5,228.02 21.18% 4,529.23 16.60% 5,515.71 18.75% 6,504.55 21.29%
Trade and other receivables 3,076.81 12.46% 3,249.87 11.91% 3,625.82 12.32% 3,442.99 11.27%
Advances and short-term loans from
other parties 1.00 0.00% 1.00 0.00% 1.00 0.00% 50.44 0.17%
Advances and short-term loans from
related parties - 0.00% - 0.00% - 0.00% 250.00 0.82%
Inventories 1,226.18 4.97% 1,222.80 4.48% 1,352.54 4.60% 1,352.42 4.43%
Other current assets 72.67 0.29% 68.20 0.25% 61.12 0.21% 53.47 0.18%
Total current asset 11,188.27 45.32% 11,516.07 42.20% 13,333.57 45.32% 15,307.06 50.11%
Cash restricted or pledged 36.35 0.15% 36.35 0.13% 36.35 0.12% 36.35 0.12%
Investment in associates 1,322.20 5.36% 1,428.24 5.23% 1,562.33 5.31% 1,565.83 5.13%
Investment in joint venture - 0.00% - 0.00% - 0.00% 26.16 0.09%
Investment in other companies 147.12 0.60% 144.77 0.53% 266.78 0.91% 186.62 0.61%
Other long-term investments 3,761.26 15.23% 4,412.90 16.17% 5,133.56 17.45% 4,559.83 14.93%
Advance share payments 90.56 0.37% 100.88 0.37% 77.36 0.26% - 0.00%
Investment properties 80.57 0.33% 100.21 0.37% 98.26 0.33% 98.26 0.32%
Property, plant and equipment 7,788.06 31.54% 9,388.57 34.41% 8,790.56 29.88% 8,537.88 27.95%
Down payment for purchase of machinery 108.94 0.44% 15.53 0.06% 16.80 0.06% 48.53 0.16%
Other intangible assets 47.09 0.19% 46.05 0.17% 40.31 0.14% 38.42 0.13%
Leasehold right - net 0.69 0.00% 1.35 0.00% 0.93 0.00% 0.72 0.00%
Goodwill 10.07 0.04% 10.07 0.04% 5.54 0.02% 46.81 0.15%
Deferred tax assets 83.07 0.34% 65.99 0.24% 31.20 0.11% 60.06 0.20%
Other non-current assets 25.32 0.10% 19.31 0.07% 29.63 0.10% 35.24 0.12%
Total non-current assets 13,501.29 54.68% 15,770.22 57.80% 16,089.60 54.68% 15,240.71 49.89%
Total assets 24,689.56 100.00% 27,286.29 100.00% 29,423.17 100.00% 30,547.77 100.00%
Short-term loans from financial institution 30.00 0.12% - 0.00% - 0.00% - 0.00%
Trade and other payables 1,788.88 7.25% 1,870.20 6.85% 1,787.56 6.08% 1,840.85 6.03%
Current portion of liabilities under finance
lease agreements
108.60
0.44%
104.10
0.38%
82.66
0.28%
75.82
0.25%
Income tax payable 196.16 0.79% 235.98 0.86% 242.66 0.82% 282.79 0.93%
Accrued bonus 139.72 0.57% 157.81 0.58% 159.25 0.54% 212.19 0.69%
Dividend payable 1.82 0.01% 1.97 0.01% - 0.00% - 0.00%
Advance receipt from non-controlling
interests for investment in a subsidiary 21.12 0.09% 20.32 0.07% 0.00 0.00% 0.04 0.00%
Other accrued expenses 363.90 1.47% 374.82 1.37% 285.02 0.97% 323.85 1.06%
Other current liabilities 86.66 0.35% 84.49 0.31% 70.38 0.24% 35.87 0.12%
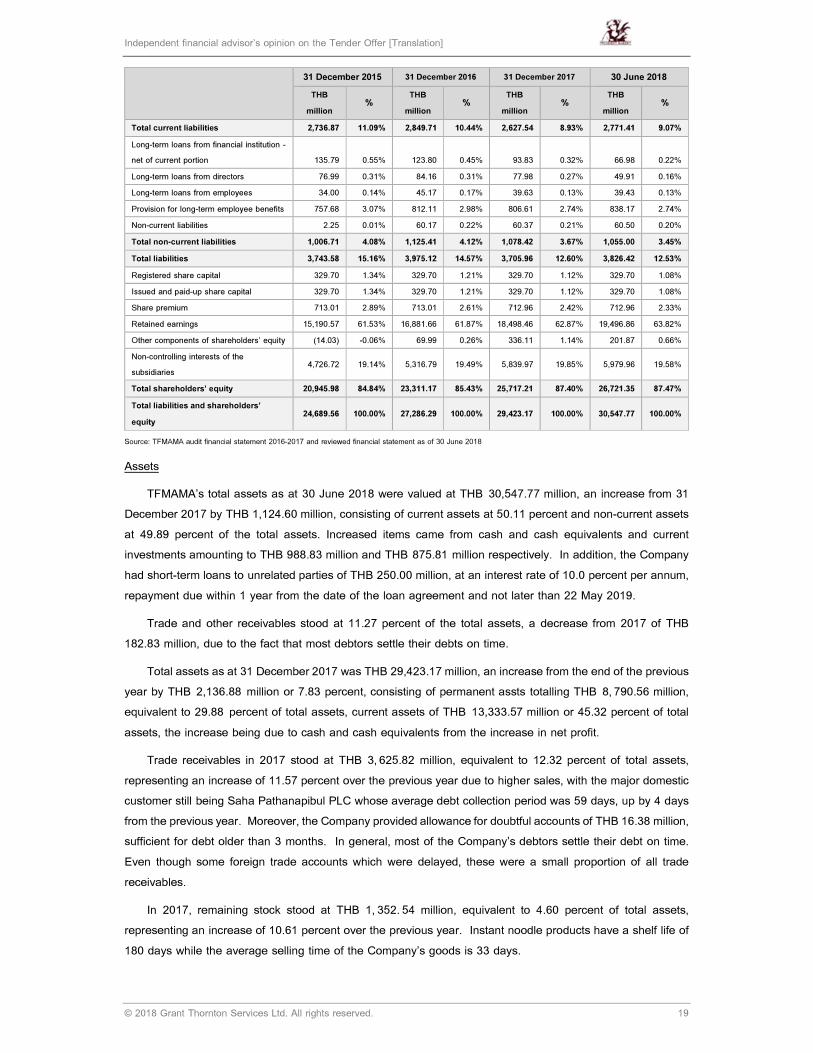
Independent financial advisor’s opinion on the Tender Offer [Translation]
© 2018 Grant Thornton Services Ltd. All rights reserved. 19
31 December 2015 31 December 2016 31 December 2017 30 June 2018
THB
million %
THB
million %
THB
million %
THB
million %
Total current liabilities 2,736.87 11.09% 2,849.71 10.44% 2,627.54 8.93% 2,771.41 9.07%
Long-term loans from financial institution -
net of current portion
135.79
0.55%
123.80
0.45%
93.83
0.32%
66.98
0.22%
Long-term loans from directors 76.99 0.31% 84.16 0.31% 77.98 0.27% 49.91 0.16%
Long-term loans from employees 34.00 0.14% 45.17 0.17% 39.63 0.13% 39.43 0.13%
Provision for long-term employee benefits 757.68 3.07% 812.11 2.98% 806.61 2.74% 838.17 2.74%
Non-current liabilities 2.25 0.01% 60.17 0.22% 60.37 0.21% 60.50 0.20%
Total non-current liabilities 1,006.71 4.08% 1,125.41 4.12% 1,078.42 3.67% 1,055.00 3.45%
Total liabilities 3,743.58 15.16% 3,975.12 14.57% 3,705.96 12.60% 3,826.42 12.53%
Registered share capital 329.70 1.34% 329.70 1.21% 329.70 1.12% 329.70 1.08%
Issued and paid-up share capital 329.70 1.34% 329.70 1.21% 329.70 1.12% 329.70 1.08%
Share premium 713.01 2.89% 713.01 2.61% 712.96 2.42% 712.96 2.33%
Retained earnings 15,190.57 61.53% 16,881.66 61.87% 18,498.46 62.87% 19,496.86 63.82%
Other components of shareholders’ equity (14.03) -0.06% 69.99 0.26% 336.11 1.14% 201.87 0.66%
Non-controlling interests of the
subsidiaries 4,726.72 19.14% 5,316.79 19.49% 5,839.97 19.85% 5,979.96 19.58%
Total shareholders’ equity 20,945.98 84.84% 23,311.17 85.43% 25,717.21 87.40% 26,721.35 87.47%
Total liabilities and shareholders’
equity 24,689.56 100.00% 27,286.29 100.00% 29,423.17 100.00% 30,547.77 100.00%
Source: TFMAMA audit financial statement 2016-2017 and reviewed financial statement as of 30 June 2018
Assets
TFMAMA’s total assets as at 30 June 2018 were valued at THB 30,547.77 million, an increase from 31
December 2017 by THB 1,124.60 million, consisting of current assets at 50.11 percent and non-current assets
at 49.89 percent of the total assets. Increased items came from cash and cash equivalents and current
investments amounting to THB 988.83 million and THB 875.81 million respectively. In addition, the Company
had short-term loans to unrelated parties of THB 250.00 million, at an interest rate of 10.0 percent per annum,
repayment due within 1 year from the date of the loan agreement and not later than 22 May 2019.
Trade and other receivables stood at 11.27 percent of the total assets, a decrease from 2017 of THB
182.83 million, due to the fact that most debtors settle their debts on time.
Total assets as at 31 December 2017 was THB 29,423.17 million, an increase from the end of the previous
year by THB 2,136.88 million or 7.83 percent, consisting of permanent assts totalling THB 8, 790.56 million,
equivalent to 29.88 percent of total assets, current assets of THB 13,333.57 million or 45.32 percent of total
assets, the increase being due to cash and cash equivalents from the increase in net profit.
Trade receivables in 2017 stood at THB 3, 625.82 million, equivalent to 12.32 percent of total assets,
representing an increase of 11.57 percent over the previous year due to higher sales, with the major domestic
customer still being Saha Pathanapibul PLC whose average debt collection period was 59 days, up by 4 days
from the previous year. Moreover, the Company provided allowance for doubtful accounts of THB 16.38 million,
sufficient for debt older than 3 months. In general, most of the Company’s debtors settle their debt on time.
Even though some foreign trade accounts which were delayed, these were a small proportion of all trade
receivables.
In 2017, remaining stock stood at THB 1, 352. 54 million, equivalent to 4.60 percent of total assets,
representing an increase of 10.61 percent over the previous year. Instant noodle products have a shelf life of
180 days while the average selling time of the Company’s goods is 33 days.
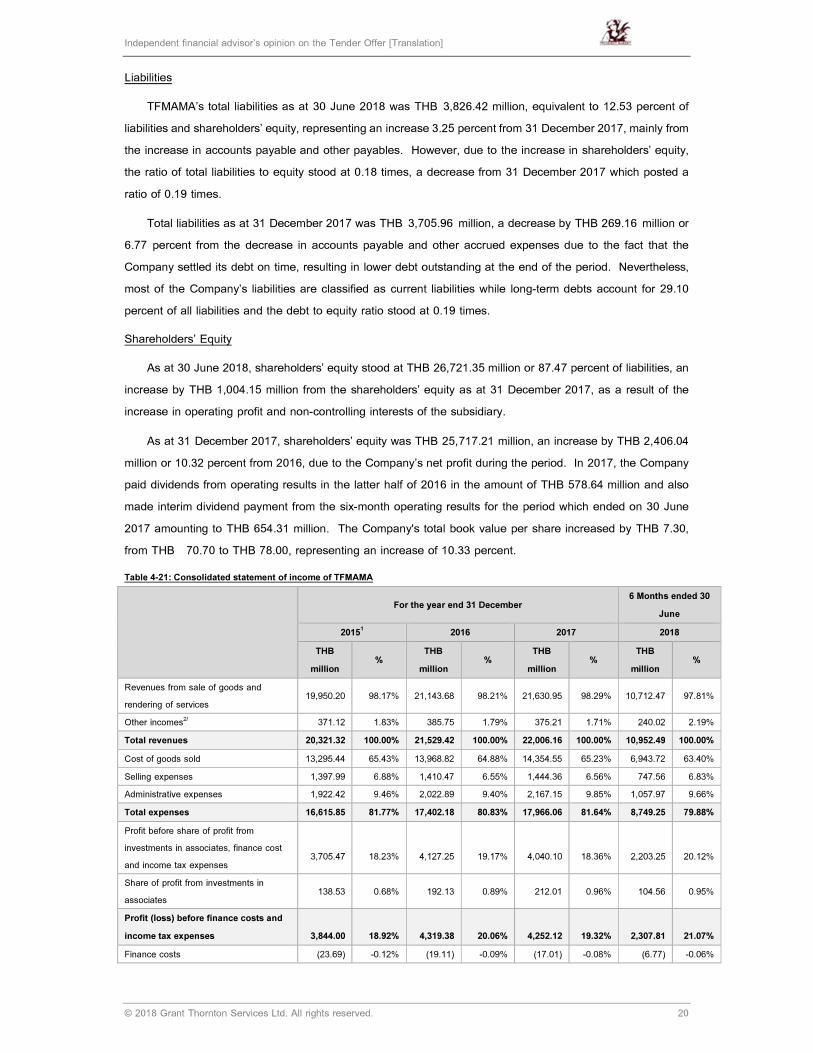
Independent financial advisor’s opinion on the Tender Offer [Translation]
© 2018 Grant Thornton Services Ltd. All rights reserved. 20
Liabilities
TFMAMA’s total liabilities as at 30 June 2018 was THB 3,826.42 million, equivalent to 12.53 percent of
liabilities and shareholders’ equity, representing an increase 3.25 percent from 31 December 2017, mainly from
the increase in accounts payable and other payables. However, due to the increase in shareholders’ equity,
the ratio of total liabilities to equity stood at 0.18 times, a decrease from 31 December 2017 which posted a
ratio of 0.19 times.
Total liabilities as at 31 December 2017 was THB 3,705.96 million, a decrease by THB 269.16 million or
6.77 percent from the decrease in accounts payable and other accrued expenses due to the fact that the
Company settled its debt on time, resulting in lower debt outstanding at the end of the period. Nevertheless,
most of the Company’s liabilities are classified as current liabilities while long-term debts account for 29.10
percent of all liabilities and the debt to equity ratio stood at 0.19 times.
Shareholders’ Equity
As at 30 June 2018, shareholders’ equity stood at THB 26,721.35 million or 87.47 percent of liabilities, an
increase by THB 1,004.15 million from the shareholders’ equity as at 31 December 2017, as a result of the
increase in operating profit and non-controlling interests of the subsidiary.
As at 31 December 2017, shareholders’ equity was THB 25,717.21 million, an increase by THB 2,406.04
million or 10.32 percent from 2016, due to the Company’s net profit during the period. In 2017, the Company
paid dividends from operating results in the latter half of 2016 in the amount of THB 578.64 million and also
made interim dividend payment from the six-month operating results for the period which ended on 30 June
2017 amounting to THB 654.31 million. The Company's total book value per share increased by THB 7.30,
from THB 70.70 to THB 78.00, representing an increase of 10.33 percent.
Table 4-21: Consolidated statement of income of TFMAMA
For the year end 31 December 6 Months ended 30
June
20151
2016 2017 2018
THB
million %
THB
million %
THB
million %
THB
million %
Revenues from sale of goods and
rendering of services 19,950.20 98.17% 21,143.68 98.21% 21,630.95 98.29% 10,712.47 97.81%
Other incomes2/ 371.12 1.83% 385.75 1.79% 375.21 1.71% 240.02 2.19%
Total revenues 20,321.32 100.00% 21,529.42 100.00% 22,006.16 100.00% 10,952.49 100.00%
Cost of goods sold 13,295.44 65.43% 13,968.82 64.88% 14,354.55 65.23% 6,943.72 63.40%
Selling expenses 1,397.99 6.88% 1,410.47 6.55% 1,444.36 6.56% 747.56 6.83%
Administrative expenses 1,922.42 9.46% 2,022.89 9.40% 2,167.15 9.85% 1,057.97 9.66%
Total expenses 16,615.85 81.77% 17,402.18 80.83% 17,966.06 81.64% 8,749.25 79.88%
Profit before share of profit from
investments in associates, finance cost
and income tax expenses
3,705.47
18.23%
4,127.25
19.17%
4,040.10
18.36%
2,203.25
20.12%
Share of profit from investments in
associates 138.53 0.68% 192.13 0.89% 212.01 0.96% 104.56 0.95%
Profit (loss) before finance costs and
income tax expenses
3,844.00
18.92%
4,319.38
20.06%
4,252.12
19.32%
2,307.81
21.07%
Finance costs (23.69) -0.12% (19.11) -0.09% (17.01) -0.08% (6.77) -0.06%
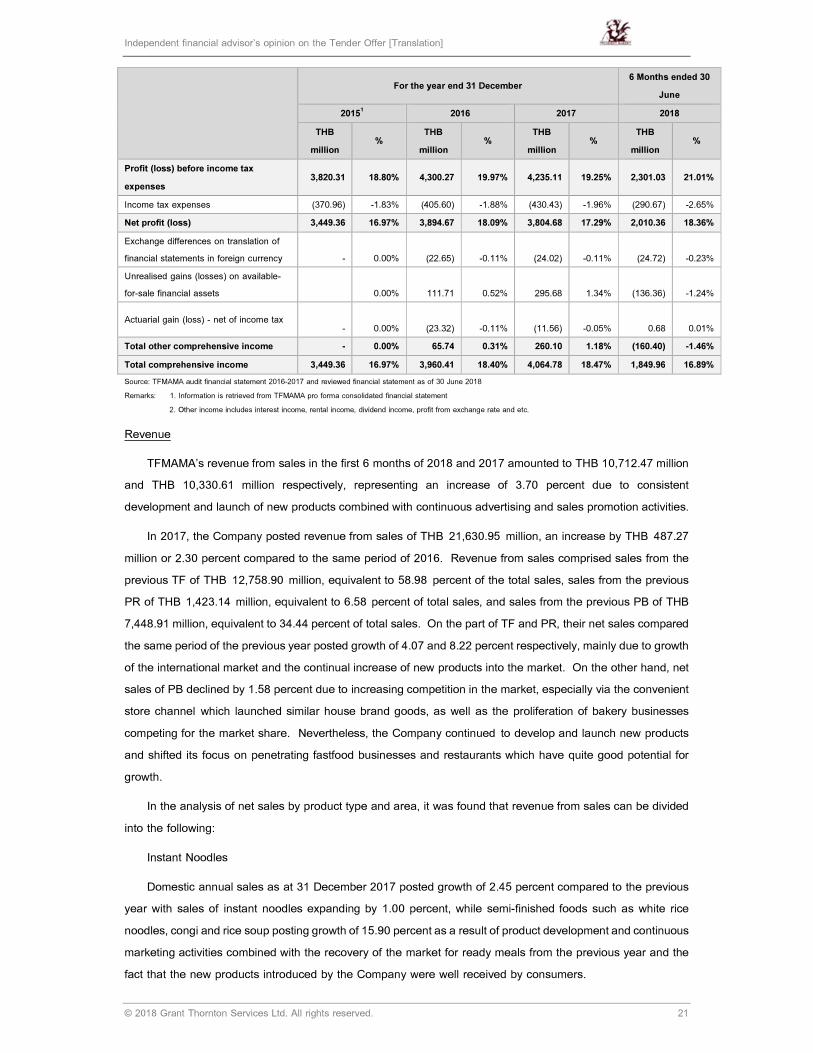
Independent financial advisor’s opinion on the Tender Offer [Translation]
© 2018 Grant Thornton Services Ltd. All rights reserved. 21
For the year end 31 December 6 Months ended 30
June
20151
2016 2017 2018
THB
million %
THB
million %
THB
million %
THB
million %
Profit (loss) before income tax
expenses 3,820.31 18.80% 4,300.27 19.97% 4,235.11 19.25% 2,301.03 21.01%
Income tax expenses (370.96) -1.83% (405.60) -1.88% (430.43) -1.96% (290.67) -2.65%
Net profit (loss) 3,449.36 16.97% 3,894.67 18.09% 3,804.68 17.29% 2,010.36 18.36%
Exchange differences on translation of
financial statements in foreign currency
-
0.00%
(22.65)
-0.11%
(24.02)
-0.11%
(24.72)
-0.23%
Unrealised gains (losses) on available-
for-sale financial assets
0.00%
111.71
0.52%
295.68
1.34%
(136.36)
-1.24%
Actuarial gain (loss) - net of income tax
-
0.00%
(23.32)
-0.11%
(11.56)
-0.05%
0.68
0.01%
Total other comprehensive income - 0.00% 65.74 0.31% 260.10 1.18% (160.40) -1.46%
Total comprehensive income 3,449.36 16.97% 3,960.41 18.40% 4,064.78 18.47% 1,849.96 16.89%
Source: TFMAMA audit financial statement 2016-2017 and reviewed financial statement as of 30 June 2018
Remarks: 1. Information is retrieved from TFMAMA pro forma consolidated financial statement
2. Other income includes interest income, rental income, dividend income, profit from exchange rate and etc.
Revenue
TFMAMA’s revenue from sales in the first 6 months of 2018 and 2017 amounted to THB 10,712.47 million
and THB 10,330.61 million respectively, representing an increase of 3.70 percent due to consistent
development and launch of new products combined with continuous advertising and sales promotion activities.
In 2017, the Company posted revenue from sales of THB 21,630.95 million, an increase by THB 487.27
million or 2.30 percent compared to the same period of 2016. Revenue from sales comprised sales from the
previous TF of THB 12,758.90 million, equivalent to 58.98 percent of the total sales, sales from the previous
PR of THB 1,423.14 million, equivalent to 6.58 percent of total sales, and sales from the previous PB of THB
7,448.91 million, equivalent to 34.44 percent of total sales. On the part of TF and PR, their net sales compared
the same period of the previous year posted growth of 4.07 and 8.22 percent respectively, mainly due to growth
of the international market and the continual increase of new products into the market. On the other hand, net
sales of PB declined by 1.58 percent due to increasing competition in the market, especially via the convenient
store channel which launched similar house brand goods, as well as the proliferation of bakery businesses
competing for the market share. Nevertheless, the Company continued to develop and launch new products
and shifted its focus on penetrating fastfood businesses and restaurants which have quite good potential for
growth.
In the analysis of net sales by product type and area, it was found that revenue from sales can be divided
into the following:
Instant Noodles
Domestic annual sales as at 31 December 2017 posted growth of 2.45 percent compared to the previous
year with sales of instant noodles expanding by 1.00 percent, while semi-finished foods such as white rice
noodles, congi and rice soup posting growth of 15.90 percent as a result of product development and continuous
marketing activities combined with the recovery of the market for ready meals from the previous year and the
fact that the new products introduced by the Company were well received by consumers.
Independent financial advisor’s opinion on the Tender Offer [Translation]
© 2018 Grant Thornton Services Ltd. All rights reserved. 22
International annual sales as at 31 December 2017 posted growth of 8.19 percent compared to the previous
year with sales of instant noodlers growing by 10.64 percent while semi-finished foods such as white rice
noodles, congi and rice soup declining by 2.48 percent. The highest proportion of sales was in Asia which
also posted the highest growth while the Australian market also showing good potential for growth as a result
of marketing and sales promotion activities in collaboration with foreign distributors, rendering the Company’s
products becoming more recognized and well accepted in the world market.
Bakery Products
Sales of bakery products for the annual period ended 31 December 2017 declined by 1.58 percent
compared to the previous year due to higher competition in the market and the increasing number of new
players; however, the Company continued to focus on introducing new products, as well as advertising and
organizing sales promotion activities in order to increase sales and ensure that distribution of products allow
consumers greater access to the products.
Other products
Total sales of other products consisting of biscuits, packaging, fruit juice and others in the annual period
at the end of 31 December 2017 posted growth of 6.31 percent, with packaging growing rather well while the
international market for fruit juice continued to expand.
Selling Cost
Selling cost in the first 6 months of 2018 was THB 6,943.72 million, an increase of 0.78 percent compared
to the same period of the previous year, while the cost to sales ratio stood at 64.82 percent, lower that the
previous year (at 66.70 percent), due to efficient production management and procurement control, resulting in
gross profit of 35.18 percent, an increase over the same period of the previous year when the gross profit was
33.30 percent.
Selling cost for the annual period of 2017 was THB 14,354.55 million, increasing by THB 385.73 million or
2.76 percent over the previous year, due to the increase in the use of raw materials and packaging for
production in line with increasing sales, combined with the increasing depreciation of the bakery plant since
the Bangchan 2 Plant began operation and the cost to sales ratio stood at 66.36 percent, which is 0.29 percent
higher than the previous year.
Sales and Administrative Expenses
Sales and administrative expenses in the first 6 months of 2018 was THB 1,805.53 million, equivalent to
16.49 percent of total revenue. The proportion of such expenses to total revenue declined slightly compared
to the corresponding period of the previous year due to the Company’s more efficient management and control
of expenses.
Sales and administrative expenses in the annual period of 2017 was THB 3,611.50 million, increasing by
THB 178.15 million or 5.19 percent, due to the increase of staff costs, namely salary, overtime, allowances in
line with the increasing number of employees and higher salary base; as well as expenses from the merger
and acquisition. Nevertheless, sales and administrative expenses to sales revenue stood at 16.70 percent,
which is a slight increase from the previous year.
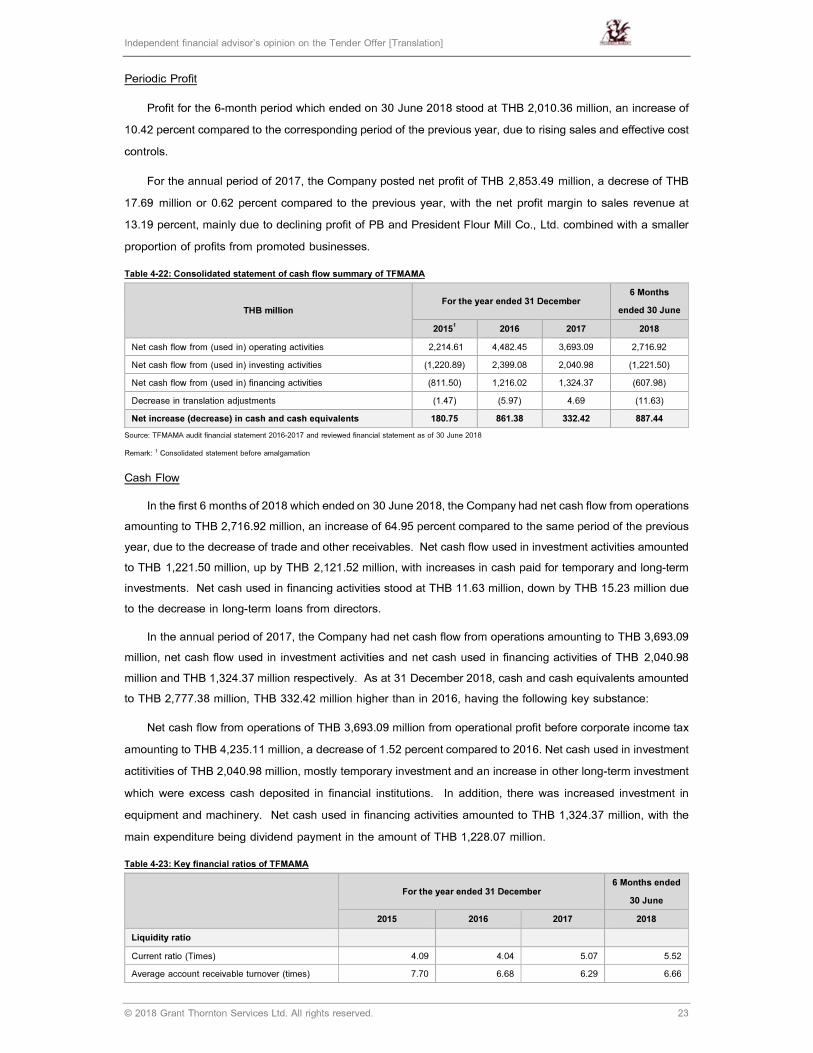
Independent financial advisor’s opinion on the Tender Offer [Translation]
© 2018 Grant Thornton Services Ltd. All rights reserved. 23
Periodic Profit
Profit for the 6-month period which ended on 30 June 2018 stood at THB 2,010.36 million, an increase of
10.42 percent compared to the corresponding period of the previous year, due to rising sales and effective cost
controls.
For the annual period of 2017, the Company posted net profit of THB 2,853.49 million, a decrese of THB
17.69 million or 0.62 percent compared to the previous year, with the net profit margin to sales revenue at
13.19 percent, mainly due to declining profit of PB and President Flour Mill Co., Ltd. combined with a smaller
proportion of profits from promoted businesses.
Table 4-22: Consolidated statement of cash flow summary of TFMAMA
THB million For the year ended 31 December
6 Months
ended 30 June
20151
2016 2017 2018
Net cash flow from (used in) operating activities 2,214.61 4,482.45 3,693.09 2,716.92
Net cash flow from (used in) investing activities (1,220.89) 2,399.08 2,040.98 (1,221.50)
Net cash flow from (used in) financing activities (811.50) 1,216.02 1,324.37 (607.98)
Decrease in translation adjustments (1.47) (5.97) 4.69 (11.63)
Net increase (decrease) in cash and cash equivalents 180.75 861.38 332.42 887.44
Source: TFMAMA audit financial statement 2016-2017 and reviewed financial statement as of 30 June 2018
Remark: 1 Consolidated statement before amalgamation
Cash Flow
In the first 6 months of 2018 which ended on 30 June 2018, the Company had net cash flow from operations
amounting to THB 2,716.92 million, an increase of 64.95 percent compared to the same period of the previous
year, due to the decrease of trade and other receivables. Net cash flow used in investment activities amounted
to THB 1,221.50 million, up by THB 2,121.52 million, with increases in cash paid for temporary and long-term
investments. Net cash used in financing activities stood at THB 11.63 million, down by THB 15.23 million due
to the decrease in long-term loans from directors.
In the annual period of 2017, the Company had net cash flow from operations amounting to THB 3,693.09
million, net cash flow used in investment activities and net cash used in financing activities of THB 2,040.98
million and THB 1,324.37 million respectively. As at 31 December 2018, cash and cash equivalents amounted
to THB 2,777.38 million, THB 332.42 million higher than in 2016, having the following key substance:
Net cash flow from operations of THB 3,693.09 million from operational profit before corporate income tax
amounting to THB 4,235.11 million, a decrease of 1.52 percent compared to 2016. Net cash used in investment
actitivities of THB 2,040.98 million, mostly temporary investment and an increase in other long-term investment
which were excess cash deposited in financial institutions. In addition, there was increased investment in
equipment and machinery. Net cash used in financing activities amounted to THB 1,324.37 million, with the
main expenditure being dividend payment in the amount of THB 1,228.07 million.
Table 4-23: Key financial ratios of TFMAMA
For the year ended 31 December
6 Months ended
30 June
2015 2016 2017 2018
Liquidity ratio
Current ratio (Times) 4.09 4.04 5.07 5.52
Average account receivable turnover (times) 7.70 6.68 6.29 6.66
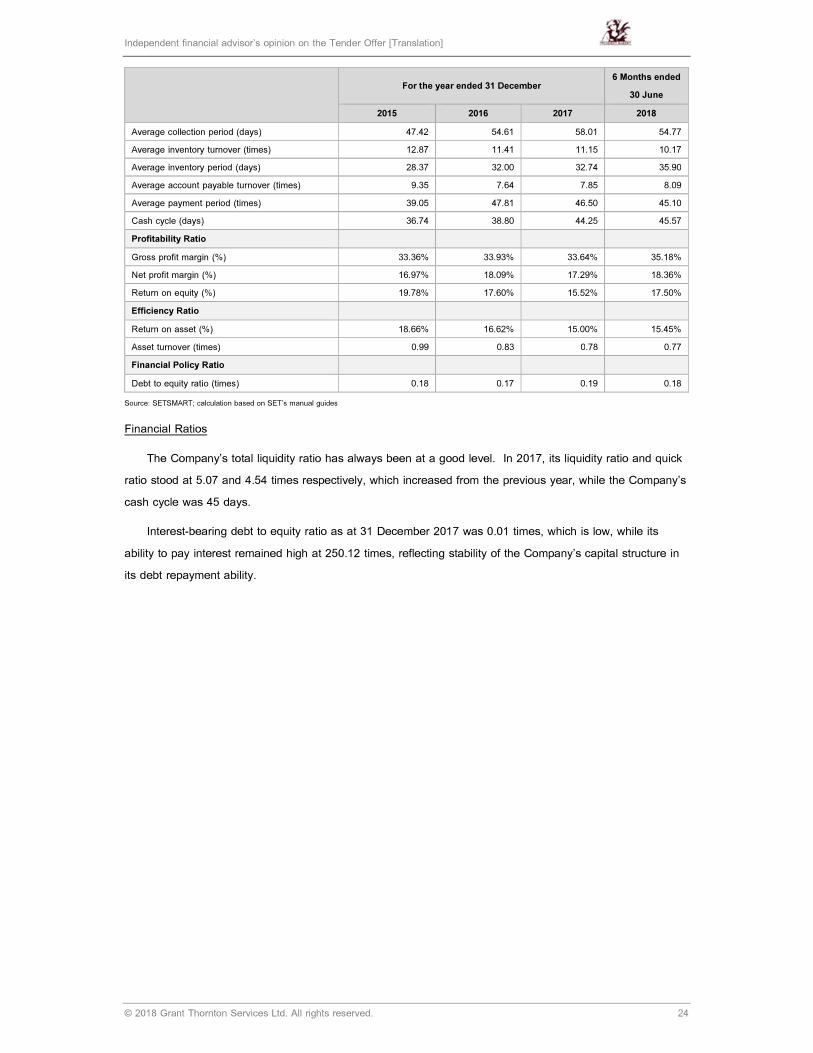
Independent financial advisor’s opinion on the Tender Offer [Translation]
© 2018 Grant Thornton Services Ltd. All rights reserved. 24
For the year ended 31 December
6 Months ended
30 June
2015 2016 2017 2018
Average collection period (days) 47.42 54.61 58.01 54.77
Average inventory turnover (times) 12.87 11.41 11.15 10.17
Average inventory period (days) 28.37 32.00 32.74 35.90
Average account payable turnover (times) 9.35 7.64 7.85 8.09
Average payment period (times) 39.05 47.81 46.50 45.10
Cash cycle (days) 36.74 38.80 44.25 45.57
Profitability Ratio
Gross profit margin (%) 33.36% 33.93% 33.64% 35.18%
Net profit margin (%) 16.97% 18.09% 17.29% 18.36%
Return on equity (%) 19.78% 17.60% 15.52% 17.50%
Efficiency Ratio
Return on asset (%) 18.66% 16.62% 15.00% 15.45%
Asset turnover (times) 0.99 0.83 0.78 0.77
Financial Policy Ratio
Debt to equity ratio (times) 0.18 0.17 0.19 0.18
Source: SETSMART; calculation based on SET’s manual guides
Financial Ratios
The Company’s total liquidity ratio has always been at a good level. In 2017, its liquidity ratio and quick
ratio stood at 5.07 and 4.54 times respectively, which increased from the previous year, while the Company’s
cash cycle was 45 days.
Interest-bearing debt to equity ratio as at 31 December 2017 was 0.01 times, which is low, while its
ability to pay interest remained high at 250.12 times, reflecting stability of the Company’s capital structure in
its debt repayment ability.
Independent financial advisor’s opinion on the Tender Offer [Translation]
© 2018 Grant Thornton Services Ltd. All rights reserved. 25
4.2 Information of the Company
4.2.1 General Information and Key Developments of the Company
President Bakery PLC (“PB”) was registered as a limited company on 29 October 1980 and transformed
as listed company on the SET on 19 July 2002 with registered paid up capital of THB 300 million. In 2006,
the Company increased its registered capital from THB 300 million to THB 450 million by resolution of the 27th
Shareholders’ Meeting on 25 April 2006, with the capital increase being registered on 15 June 2006. Then on
28 April 2011 at the 32nd Annual General Sharesholders’ Meeting, a resolution was passed to change the par
value of its ordinary shares from THB 10 per share previously to par value of THB 1 per share. The number
of ordinary shares after the share swap increased from 45 million shares to 450 million shares. The Company
registered the change in par value with the Ministry of Commerce on 12 May 2011.
The Company currently has 3 production plants: 2 situated at the Lad Krabang Industrial Estate, with a
total area of 18 rais 3 ngan and operational space of 36,680 sq.meters; and another plant at the Bangchan
Industrial Estate with an area of 12 rais 2 ngan 57 sq.was, 1 building and operational space of more than
38,000 sq.meters which officially started operation on 14 December 2009. A new factory building at the
Bangchan Industrial Estate was subsequently built and began operation on 1 June 2017. The Company’s main
business is production and distribution of bread and bakery products under the Company’s trademark to
traditional and modern trade retailers in the form of sales, with the Company agreeing to replace unsold
products in order to effectively manage stock and ensure freshness of the products. In addition, the Company
has a retail business whereby products under its trademarks are sold in its retail stores and direct sale to
consumers’ orders. Moreover, the Company also produces made-to-order products as required by such
customers as fastfood restaurants and convenience stores.
PB currently has registered paid-up capital of THB 450,000,000 divided into 450,000,000 ordinary shares,
at par value of THB 1 per share.
Table 4-24: Major change and development of PB
Year Description
2014 In the year 2014, the Company has invested in purchasing 2 additional plot of land, for the purpose of building
the distribution centers (DC), which is located at Prachacheun Road and Chonburi Province; in order to support more
products that will be distributed to consumers. The Company also invested in purchasing a new machine with the purpose
of increasing the capacity in manufacturing ready to eat products at Bang-Chan plant.
In order to promote and continuously stimulate sales, the Company had made a movie advertisement and activities
and in 20 14 , the Company also emphasized on public relation through social media by organizing more Join the Fun
activities; answering questions to win the prize through Company’s Facebook. This is considered as building relationship
and proximity to the consumers as well as a channel to listen to consumer’s opinions and satisfaction.
2015 The Company has constructed new plant at Bang Chan Industrial Estate to extend manufacturing capacity, which will
be completed in the 4th quarter of 2016 and has purchased 3 land to construct distribution center (DC), as a replacement
for the old one which was too small and not enough space as well as to have more space to support more products in
order to distribute more to the consumers. In the beginning of 2016, the Company has moved Chonburi distribution center
to the new places.
In 2015, the Company invested in Software related to finance and added more hardware for data storage to become
more stable, modern and efficient; with the purpose to support the increased of data due the business growth in the future.
The Company as well develop computer programs in sales aspect to help the processing of data to correct, accurate,
able to use in analyzing and planning sales quickly and timely. Moreover, the company has added more IP Camera for
safety system of the plant and branches.
2016 The Company purchased 3 pieces of land to construct distribution center and the construction of buildings in BangChan
factory 2, which was the project that continues from the year 2015, had been completed at the end of 2016. At present, it
Independent financial advisor’s opinion on the Tender Offer [Translation]
© 2018 Grant Thornton Services Ltd. All rights reserved. 26
Year Description
is in the process of installing and testing the machines. Once the installation of the machines is completed and ready, the
Company will have high manufacturing capacity that will satisfy consumer demand and will as well support the
expansion of the market in the future. The Company has procured robots to be used in the last procedure of production
line, which is arranging products. The procurement occurred during the end of 2016, which in the process of designing
and installing. It is expected to be completed by the middle of 2017, which will enhance both the efficiency and the speed
in delivering products
In 2016, the Company had invested in both hardware and software. For Hardware, the Company has improved information
security system by using firewall to secure the Company’s data and uses tablet in the field work as a replacement of
handheld, which have a higher price and higher maintenance cost. In terms of software, the Company has applied
manufacturing program to manage and process data of various system; from procurement, manufacturing to stock. Using
Manufacturing Program to calculate cost will allow connection to the Finance Program that the Company used in
accounting and finance area. This will allow the transmission and data processing to be integrated and be able to receive
complete, correct and much faster information.
The Company collaborates with Organic Community Enterprise Naan Networks in encouraging farmers to participate in the
organic growing project. By developing the project of growing organic azuki beans without using chemical substances. The
Company bought these organic products and used as raw material in producing filed bun and other products; in order for
consumers to be confidence in consuming quality products and free of chemical. This also helps decreased risk from
shortage of raw material and help farmers to have continuous stable income
2017 In 2017, Saha Pathana Inter-holding PLC (SPI) proceeded with a restructuring of its shareholding in the food businesses of
the Saha Group through the acquisition of all the securities of President Holding Co., Ltd. and the merger of Thai President
Foods PLC (or TF at the time) and President Rice Products PLC (“PR”) into a new corporation under the name of TF as
“Thai President Foods PLC” and changing the symbol used in trading on the Stock Exchange of Thailand (“SET”) from “TF”
to “TFMAMA”. As a result of the restructuring, SPI is responsible for proposing the Tender Offer to acquire all the shares
of PR and PB in accordance with Notification of the Capital Market Supervisory Board No. TorChor. 12/2554. In this matter,
TF has joined with SPI in proposing the Tender Offer to acquire all the shares of PB. Following the aforesaid restructuring,
TFMAMA, the new company resulting from the restructuring, becomes an ordinary shareholder in PB, which currently has
direct holding of a total of 211,062,800 shares in PB or equivalent to 46.90 percent of the total issued and paid-up shares
of the Business.
New plant in Bangchan industrial estate was installed with machine which increases the production capacity. Moreover, the
Company has acquired 5 lands both in Bangkok and other provinces to be built as distribution centers replacing the old
ones to increase efficiecncy of distribution in term of speed and punctuality. The new distribution center will also be used as
truck parking for the Company’s branch in Bangkok. In addition, the Company has aimed to adopt technology to improve
production process. As technology will increase accuracy, reduce replicational process and adding more automation which
will support the business expension and provide information to the management promptly aligning with the change of a
market.The Company has developed software on tablet to accommodate a sale of the Company’s sale representative.
Software will send back the sale data from sale representative around the country on daily basis as the information will be
analysised by business analytic software and send back to the Company. As a result, marketing department is be able to
set a target in daily sale more accurate. Purchase Requisition and Purchase Order is changed to International Software to
support internation standard which increase the accuracy and tracability. Furthermore, the process between sale department
and accounting and finance department has been improved to be more automatic. Respectively, the Company has reduced
workforce, paper form and other insignificant form saving time and expense. Addition, the investment in new software and
solid-stage storage supporting the increasing in amount of data will enchance an efficiency in the speed of data analysis
and support New Technology Software and Equipment.
Independent financial advisor’s opinion on the Tender Offer [Translation]
© 2018 Grant Thornton Services Ltd. All rights reserved. 27
4.2.2 Shareholding Structure
As at 30 June 2018, the Company has investment in other corporate entities of not less than 10 percent
as follows:
Table 4-25: Shareholding structure of PB
Company name
Portion of
holding by PB
(%)
Registered
captial
(THB
million)
Paid-up
capital
(THB
million)
Type of business
Associates
President green house foods Co., Ltd 39 15 15
Operate restaurant named “ Shinjuku
Tonkatsu Saboten”
President flour mill Co., Ltd. 10 600 600 Produce and distribute wheat product.
4.2.3 Business Overview
PB is a member of the food business group of Saha Pathanapibul PLC founded by Dr. Tiam Chokwatana.
Another member of this business group within the Saha Group is Thai President Foods PLC, whose products
have been widely accepted and highly successful, such as Mama instant noodles and Bissin biscuits, both of
which are products that use wheat as the main raw material. This prompted the idea of expanding into bread
and bakery business lines as these would also use wheat as the main raw material. At the time, most of the
entrepreneurs in the bakery business were small players operating a family business. Products in the market
were not of consistent and standard quality, and lacking development in terms of the products themselves and
their distribution and management systems. In addition, consumers had limited understanding of product quality
and standards and the market size as well as popularity of bakery products was relatively small.
Nevertheless, the government during that period supported manufacturing industries to replace imports,
especially primary industries based on agriculture. This, combined with changing lifestyles of Thais with
increasing migration from rural to urban societies, smaller families, more women having to enter the workforce
rendering less time for them to prepare meals for family members, including expansion of international trade
and business resulting in more migration of expatriates into Thailand. All these factors contributed to a greater
opportunity for bakery products to better accommodate the changing lifestyle of Thais.
The Company’s core business in production and distribution of bread and other bakery products involve
the following business lines:
1. Wholesale has a proportion of sales of 90.16% of total revenue of the Company.
2. Retail has a proportion of sales of 2.02% of total revenue of the Company.
3. Fastfood and catering has a proportion of sales of 6.68% of total revenue of the Company.
4. Export has a proportion of sales of 0.20% of total revenue of the Company.
Independent financial advisor’s opinion on the Tender Offer [Translation]
© 2018 Grant Thornton Services Ltd. All rights reserved. 28
Revenue Structure
Details of the Company’s revenue structure during the period of 2015-2017 are as follows:
Table 4-26: Revenue structure of the Company
Product / Service
2015 2016 2017
THB Thousand % THB Thousand % THB Thousand %
1 Wholesale Bakery Business 6,626,742.37 89.36 6,947,053.33 90.92 6,779,579.20 90.16
1.1 Sliced bread 2,916,092.48 39.32 3,101,949.00 40.60 3,056,003.49 40.64
1.2 Burger buns and hot dog buns 49,297.03 0.66 53,022.25 0.69 52,576.30 0.70
1.3 Snack bread 2,416,897.57 32.59 2,477,557.39 32.43 2,460,915.67 32.73
1.4 Snack cake 1,047,586.46 14.13 1,114,430.89 14.59 945,263.26 12.57
1.5 Confectionery 196,868.83 2.65 200,093.80 2.62 264,820.48 3.52
2 Retail Business 172,530.81 2.33 155,030.15 2.03 151,623.58 2.02
2.1 Deliya by Farmhouse 72,611.60 0.98 56,924.66 0.75 47,362.81 0.63
2.2 Madame Marco 84,817.08 1.14 85,703.78 1.12 95,053.98 1.26
2.3 Good Morning Farmhouse 15,102.13 0.20 12,401.71 0.16 9,206.79 0.12
3 Fast food & Catering 541,783.43 7.31 461,605.56 6.04 502,569.91 6.68
3.1 Fast food & Catering 488,087.29 6.58 407,903.38 5.34 450,140.15 5.99
3.2 Fried products 53,696.14 0.72 53,702.18 0.70 52,429.76 0.70
4 Export business 5,773.01 0.08 5,062.68 0.07 15,188.04 0.20
Sales 7,346,829.62 99.07 7,568,751.72 99.06 7,448,960.73 99.06
5 Other income 68,974.55 0.93 71,775.40 0.94 70,329.83 0.94
Total revenue 7,415,804.17 100.00 7,640,527.1 100.00 7,519,290.56 100.00%
Source: Annual Registration Statement 2017 (56-1 form)
Figure 4-3: Revenue structure during the year 2013-2017
Source: Annual Registration Statement 2017 (56-1 form)
6,440.15 6,914.17
7,415.80 7,640.53 7,519.29
0
1,000
2,000
3,000
4,000
5,000
6,000
7,000
8,000
9,000
2013 2014 2015 2016 2017
Million
Year
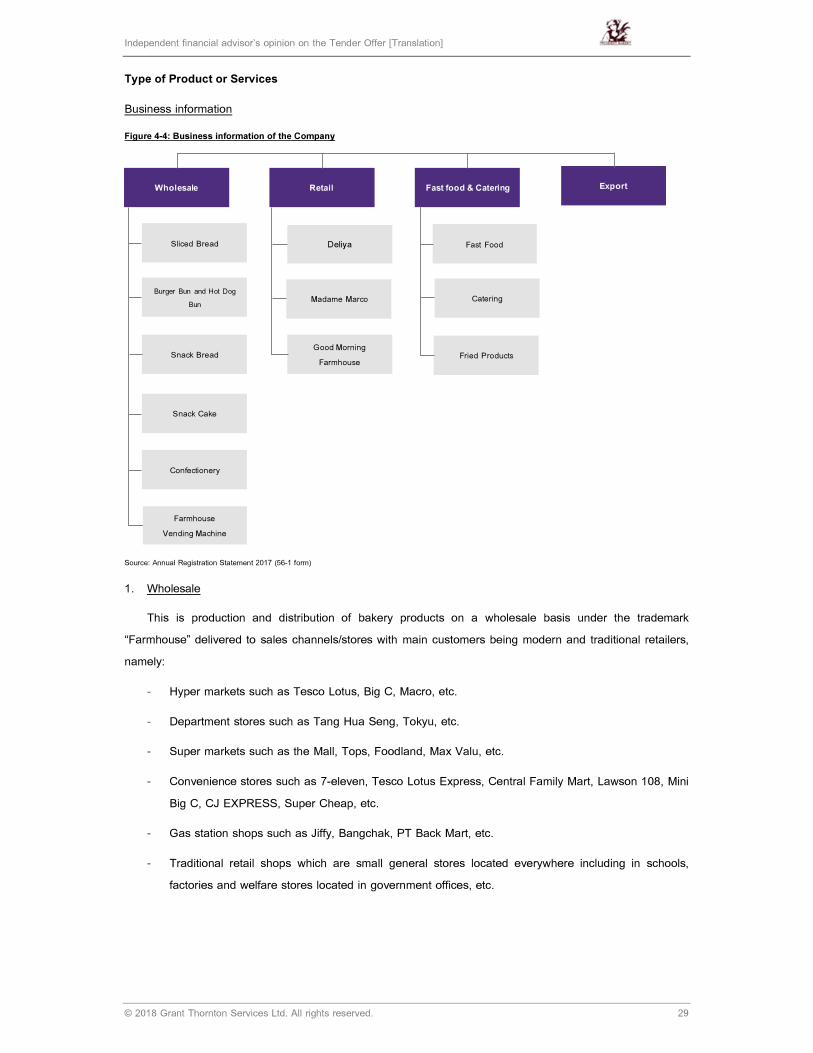
Independent financial advisor’s opinion on the Tender Offer [Translation]
© 2018 Grant Thornton Services Ltd. All rights reserved. 29
Type of Product or Services
Business information
Figure 4-4: Business information of the Company
Source: Annual Registration Statement 2017 (56-1 form)
1. Wholesale
This is production and distribution of bakery products on a wholesale basis under the trademark
“Farmhouse” delivered to sales channels/stores with main customers being modern and traditional retailers,
namely:
- Hyper markets such as Tesco Lotus, Big C, Macro, etc.
- Department stores such as Tang Hua Seng, Tokyu, etc.
- Super markets such as the Mall, Tops, Foodland, Max Valu, etc.
- Convenience stores such as 7-eleven, Tesco Lotus Express, Central Family Mart, Lawson 108, Mini
Big C, CJ EXPRESS, Super Cheap, etc.
- Gas station shops such as Jiffy, Bangchak, PT Back Mart, etc.
- Traditional retail shops which are small general stores located everywhere including in schools,
factories and welfare stores located in government offices, etc.
Wholesale Retail Fast food & Catering
Burger Bun and Hot Dog
Bun
Snack Bread
Snack Cake
Confectionery
Deliya
Madame Marco
Good Morning
Farmhouse
Fast Food
Catering
Fried Products
Sliced Bread
Farmhouse
Vending Machine
Export

Independent financial advisor’s opinion on the Tender Offer [Translation]
© 2018 Grant Thornton Services Ltd. All rights reserved. 30
Products sold in the wholesale business line are:
1.1 Sliced Bread
Sliced bread was the first product that the Company produced and sold and is considered the product that
created the most recognition of the brand “Farmhouse” from the past to the present. As well as being the main
product generating revenue for the Company, the product characteristic is also very versatile, suitable for
consumers of all ages and for every member of the family. From the original product of regular white sliced
bread, the Company has developed and increased product variety as follows:
(1) White Bread
Is the category of sliced bread which has white texture, suitable for consumers of all ages and can be
used as an ingredient in a large variety of foods, at any time of day. Products in this group are sliced
bread of 480 grams, sliced bread of 240 grams, sliced bread with the edges removed of 220 grams,
Royal Bread of 275 grams and Hokkaido milk bread.
(2) Grain Bread
Is the category of sliced bread with whole grains as a large ingredient to increase nutritious value to
suit the lifestyle of Thais who have become more interested in healthy choices, expecially with regard
to food products. Products in this group are wholewheat bread of 500 grams, wholewheat bread of
250 grams, fine-textured wholewheat bread of 250 grams suitable for children and consumers who
are careful about being healthy but do not like the texture of regular wholewheat bread. In addition,
there is also Royal Wholewheat bread with soft and thick slices of 285 grams, and Royal 12 Grain
which has 12 different kinds of grain in its soft, thick slices of 285 grams, delicious and nutritious.
1.2 Burger and Hot Dog Buns
This category of products consists of bread buns for burgers and hotdogs which can be used in diverse
menus for different kinds of burgers and hotdogs.
1.3 Snack Bread
These are ready meal bakery products in individual packets for a single serving suitable for the lifestyle of
consumers living in busy urban centers who prefer quick and convenient choices. These are portable and can
be eaten anytime, anywhere. The products are very diverse in content and flavor, suitable for all target groups,
from school and university students, working professionals, etc. This category of products consists of milk
butter sandwich rolls, mini raisin loafs, daily sandwiches, sweet sandwiches, bread with sweet or meat filling,
open-face bread with spread, raisin bread, hotdog bun with sweet filling, and trio bread. In 2017, new products
were launched: wholewheat tuna and corn salad sandwich, bread bun with durian custard filling, Hokkaido milk
cream hotdog of 50 grams, durian almond hotdog, mini pack taro bun, mini pack coconut milk and pandanas
bun, butter coconut bread, cocoraisin chocolate chip mini loaf.
1.4 Snack Cake
The Company recognized the current market gap in which no brand of snack cakes has been accepted
for its quality and standard. From the Company’s readiness combined with expertise in manufacturing, a snack
cake line of products has been developed comprising banana cake, 4 flavors of cake rolls, namely coffee,
pandanas, orange and vanilla, 4 flavors of Dorayaki filling namely custard cream, chocolate, almond cream
Independent financial advisor’s opinion on the Tender Offer [Translation]
© 2018 Grant Thornton Services Ltd. All rights reserved. 31
and chocolate chip cream, 3 flavors of sandwich cakes namely vanilla, pandanas leaf and coffee. In addition,
there’s also donut cake with 5 different flavored fillilings: vanilla custard, chocolate custard, Thai custard,
Hokkaido melon custard, and banana donut cake with chocolate filling. In 2017, a new product was launched:
a Hokkaido milk flavored cake roll.
1.5 Confectionery
Products in this category comprise butter biscuits, mini butter pain (only sold in small shops (traditional
retail stores)), cookies in 4 different flavors namely butter cookies, assorted fruit cookies, raisin cookies and
chocolate chip cookies; fruit pie in 3 different flavored filling namely pineapple, strawberry, and blueberry. New
products launched in 2017 were vanilla butter cookies, chocolate butter cookies, Hokkaido milk butter cookies,
baked butter raisin cookies.
Products in the pastry category were a new line launched in 2017 comprising pastry with pineapple filling
and pastry with taro filling.
1.6 Farmhouse Automatic Vending Machines
In focusing on providing convenience to consumers, the Company increased an additional channel of sales
by introducing automatic vending machines to provide vending services in various places such as offices,
hospitals, factories and banks. As at the end of 2017, there were 43 such machines.
2. Retail
This is a business line that deals with sales of products through the Company’s own retail stores and direct
sales to customers under the following trademarks:
2.1 Deliya by Farmhouse
From the Company’s policy to expand into retail sale of bread and bakery products, which has a trend of
much growth in the future, combined with the companies experience and credibility in the bread and bakery
business, the Company launched Deliya by Farmhouse shops to produce and sell a wide range of homemade
bread and bakery products which are freshly baked, including bakery snack box products for distribution in the
Bangkok Metropolitan Area and its perimeter. As at end of 2017, there were a total of 7 branches located at
Chitralada School, Tesco Lotus Lamlooka Klong 2, RS Tower Ratchada, Chaengwattana Government Center,
the Mall 2 Ramkhamhaeng, Paradise Park and the Mall Bangkapi.
In addition to the above, Deliya also produces goods on a made-to-order basis, namely sandwich breads,
cakes and other bakery products for Lawson shops.
2.2 Madame Marco
Homemade soft cakes of original European recipes, especially made with care every step of the way to
ensure the best tasting products, starting from the selection of quality raw materials from both domestic and
foreign sources, through a production process which is clean and meticulous, with a unique made-to-order
system that is distinctively Madam Marco all contribute to making Madame Marco cakes fresh and delicious
with every order. Free delivery is provided in Bangkok and nearby provinces. With its authentic European
taste, Madame Marco is recognized as “the European Delight”.
Independent financial advisor’s opinion on the Tender Offer [Translation]
© 2018 Grant Thornton Services Ltd. All rights reserved. 32
At present, Madame Marco has increased its sales channels to 23 Madame Marco shops located at Siam
Paragon, the Mall Ngamwongwan, the Mall Bangkhae, the Mall Bangkapi, the Mall 2 Ramkhamhaeng, Tesco
Lotus Sri Nakharindhra Road, the Mall Thaphra, Mega Bangna, Paradise Park, Fashion Island, Central Salaya,
the Emporium, the Crystal Ratchapruek, the EmQuartier, Robinson Srisamarn, Future Park Rangsit, Tops
Central Pinklao, Tops Central Westgate, Tops Central Bangna, Tops Central Rama 3, Terminal 21, Tops
Central Eastville, Tops Central Lardprao and Madame Marco Cakes Free Delivery in Bangkok and surrounding
provinces.
2.3 Good Morning Farmhouse
This is another line of business to sell products to sandwich vendors under a company model, with the
objective to promote popularity (of the products) among general consumers, as well as to enable people to
have a livelihood and supplementary income. The sales representatives will buy the Company’s products in
order to make sandwiches tailored to consumers’ demands. The Company bases its selection criteria on
location and the representative’s readiness to provide the service with the Company providing training to the
selected vendors. As at the end of 2017, Good Morning Farmhouse had 47 sales representatives due to
measures introduced to control vending on footpaths, resulting in the reduced number of sales representatives.
3. Fast food & Catering
This is a category of products produced and distributed according to customers’ orders. Main customers
include McDonald’s, KFC, Pizza Hut, Chester Grill, A&W, Sante Fe Steak, Jeffer Steak, MOS Burger (from
Japan), Minor Food Group namely Burger King, Sizzler, Dairy Queen, the Pizza Company, etc. as well as
restaurants and cafés such as Chocolate Ville, the Coffee Club most of which are famous franchises with the
highest sales throughout the world including in Thailand.
3.1 Fastfoods & Catering
1) Fastfoods
The category of products produced and distributed comprises burger and hotdog buns in different
sizes, both with and without sesame seeds which come from an automated production process with a
capacity of 36,000 units per hour. Other products include French bread, croissants, crispy bread and
specific products developed to customer specification. In 2017, the Company introduced a new
product, sweet bun with cornmeal topping, for McDonald’s. The Company is currently the largest
supplier of bread products in the country.
In addition, another product is frozen dough which comes in different varieties and sizes as specified
by the fastfood clients. The Company has focused on continual research and development of these
products to further expand this market in the future.
2) Catering
In addition to fastfood franchises, the Company also expanded distribution to restaurant and café
businesses which require bakery products on their menu. The products in this category, in addition
to products the Company already currently being produced, also include products it developed in
response to specific requirements of the customer.
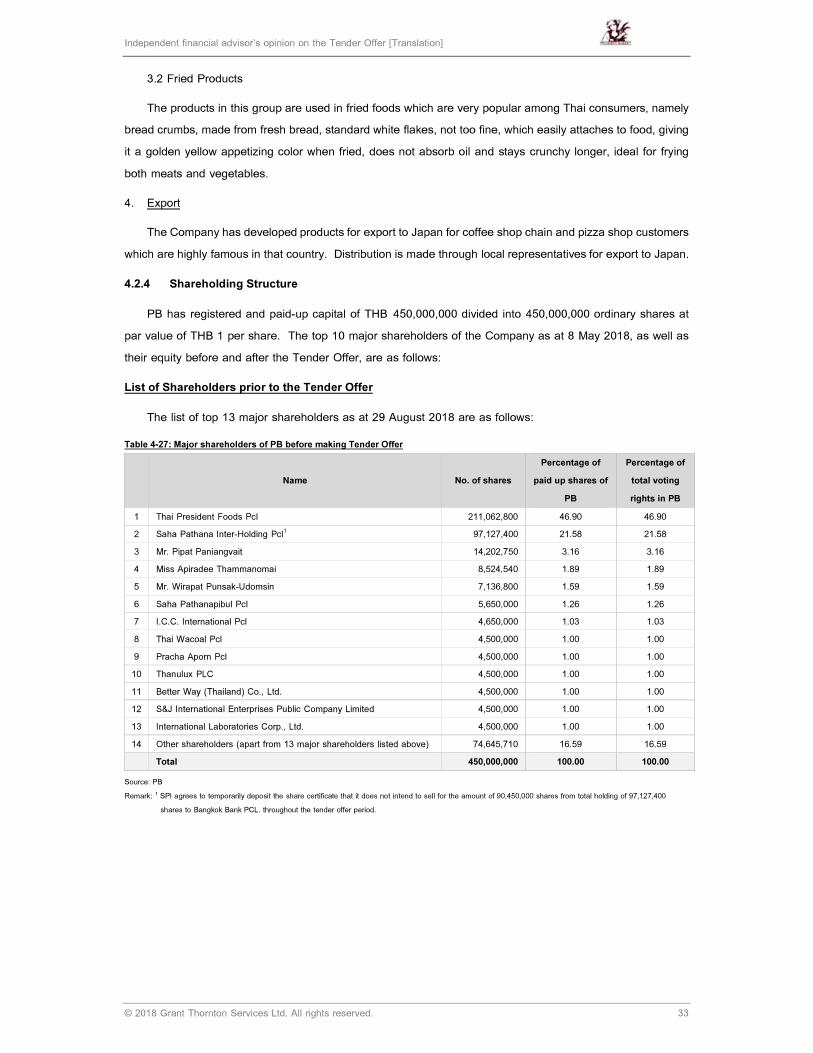
Independent financial advisor’s opinion on the Tender Offer [Translation]
© 2018 Grant Thornton Services Ltd. All rights reserved. 33
3.2 Fried Products
The products in this group are used in fried foods which are very popular among Thai consumers, namely
bread crumbs, made from fresh bread, standard white flakes, not too fine, which easily attaches to food, giving
it a golden yellow appetizing color when fried, does not absorb oil and stays crunchy longer, ideal for frying
both meats and vegetables.
4. Export
The Company has developed products for export to Japan for coffee shop chain and pizza shop customers
which are highly famous in that country. Distribution is made through local representatives for export to Japan.
4.2.4 Shareholding Structure
PB has registered and paid-up capital of THB 450,000,000 divided into 450,000,000 ordinary shares at
par value of THB 1 per share. The top 10 major shareholders of the Company as at 8 May 2018, as well as
their equity before and after the Tender Offer, are as follows:
List of Shareholders prior to the Tender Offer
The list of top 13 major shareholders as at 29 August 2018 are as follows:
Table 4-27: Major shareholders of PB before making Tender Offer
Name No. of shares
Percentage of
paid up shares of
PB
Percentage of
total voting
rights in PB
1 Thai President Foods Pcl 211,062,800 46.90 46.90
2 Saha Pathana Inter-Holding Pcl1 97,127,400 21.58 21.58
3 Mr. Pipat Paniangvait 14,202,750 3.16 3.16
4 Miss Apiradee Thammanomai 8,524,540 1.89 1.89
5 Mr. Wirapat Punsak-Udomsin 7,136,800 1.59 1.59
6 Saha Pathanapibul Pcl 5,650,000 1.26 1.26
7 I.C.C. International Pcl 4,650,000 1.03 1.03
8 Thai Wacoal Pcl 4,500,000 1.00 1.00
9 Pracha Aporn Pcl 4,500,000 1.00 1.00
10 Thanulux PLC 4,500,000 1.00 1.00
11 Better Way (Thailand) Co., Ltd. 4,500,000 1.00 1.00
12 S&J International Enterprises Public Company Limited 4,500,000 1.00 1.00
13 International Laboratories Corp., Ltd. 4,500,000 1.00 1.00
14 Other shareholders (apart from 13 major shareholders listed above) 74,645,710 16.59 16.59
Total 450,000,000 100.00 100.00
Source: PB
Remark: 1 SPI agrees to temporarily deposit the share certificate that it does not intend to sell for the amount of 90,450,000 shares from total holding of 97,127,400
shares to Bangkok Bank PCL. throughout the tender offer period.

Independent financial advisor’s opinion on the Tender Offer [Translation]
© 2018 Grant Thornton Services Ltd. All rights reserved. 34
Table 4-28: Shareholders of Better Way (Thailand) Co., Ltd.
No. Name No. of shares %
1 I.C.C. International Public Company Limited 1,648,375 16.48
2 Mr. Danai Tirojchanawong 1,476,193 14.76
3 Saha Pathana Inter-Holding Public Company Limited 1,177,362 11.77
4 Vitayasithi Co.,Ltd. 737,844 7.38
5 Mrs. Daranee Tirojchanawong 675,159 6.75
6 Mr. Boonkiet Chokwatana 465,144 4.65
7 Mrs. Sirina Sirina 369,235 3.69
8 I.D.F. Co.,Ltd. 313,976 3.14
9 Mr. Boonsithi Chokwatana 310,857 3.11
10 Mr. Direk Tirojchanawong 295,578 2.96
11 Other shareholders (apart from 10 major shareholders listed above) 2,530,277 25.31
Total 10,000,000 100
Source: SET and other sources
Remark: List of shareholders as of 2 July 2018
Table 4-29: Shareholders of International Laboratories Corp., Ltd.
No. Name No. of shares %
1 Saha Pathana Inter-Holding Public Company Limited 3,000,000 25.00
2 I.C.C. International Public Company Limited 2,347,200 19.56
3 Vitayasithi Co.,Ltd. 1,425,100 11.88
4 Saha Pathanapibul Public Company Limited 1,180,000 9.83
5 Mr. Boonkiet Chokwatana 669,600 5.58
6 I.D.F. Co.,Ltd. 600,000 5.00
7 Chokwattana Co.,Ltd. 360,000 3.00
8 Mr. Boonsithi Chokwatana 220,000 1.83
9 Mr. Masao Kawai 200,000 1.67
10 Mrs. Tipaporn Chokwatana 140,000 1.17
11 Other shareholders (apart from 10 major shareholders listed above) 1,858,100 15.50
Total 12,000,000 100.00
Source: SET and other sources
Remark: List of shareholders as of 2 April 2018
Table 4-30: Shareholders of Vitayasithi Co., Ltd
No. Name No. of shares %
1 Mr. Thamarat Chokwatana 30,000 15.00
2 Mr. Boonkiet Chokwatana 30,000 15.00
3 Mrs. Tipaporn Chokwatana 20,000 10.00
4 Mr. Thirasak Vikitset 20,000 10.00
5 Mr. Watanakiat Jirasithithamrong 20,000 10.00
6 Mrs. Somjit Eiamkijsamrit 20,000 10.00
7 Mrs. Kaewta Ongsaranakom 15,000 7.50
8 Mrs. Chitraporn Vikitset 15,000 7.50
9 Mrs. Saengthong Chaisiriroj 15,000 7.50
10 Mrs. Amara Trakarnkulphan 15,000 7.50
Total 200,000 100.00
Source: SET and other sources
Remarks: List of shareholders as of 30 April 2018
Because Saha Pathanapibul Public Company Limited, I.C.C. International Public Company Limited, Pracha
Aporn Pcl, Thai Wacoal Pcl, Thanulux PLC and S&J International Enterprises Public Company Limited are
public company, the list of shareholder can be found in SET website.

Independent financial advisor’s opinion on the Tender Offer [Translation]
© 2018 Grant Thornton Services Ltd. All rights reserved. 35
Anticipated Shareholding following the Tender Offer
In the event that all the securities of the Business that the Tender Offeror intends to purchase are
tendered, the expected shareholding structure of the Business after the will be as follows:
Table 4-31: Potential shareholding structure after making Tender Offer, in case all shareholders of the Company have shown their
intention to sell all their own shares in this Tender Offer (except those who have shown their intention not to sell their own shares)
Name No. of shares
Percentage of
paid up shares of
PB
Percentage of
Total voting
rights in PB
1 The Tender Offeror: Thai President Foods Public Company
Limited 359,550,000 79.90 79.90
2 Saha Pathana Inter-Holding Public Company Limited 90,450,000 20.10 20.10
Total 450,000,000 100.00 100.00
The shareholding structure in the event that all the securities of the Business that the Offeror intends to
purchase are not tendered, including SPI which has express the intention and agreed to not sell the
90,450,000 shares it holds, equivalent to 20.10 percent of the total number of issued and paid up ordinary
shares of the Business under this Voluntary Tender Offer.
Table 4-32: Potential shareholding structure after making Tender Offer, in case all shareholders of the Company have shown their
intetion not to sell their own shares in this Tender Offer
Name No. of shares
Percentage of
paid up shares
of PB
Percentage of
Total voting
rights in PB
1 The Tender Offeror: Thai President Foods Public Company
Limited 211,062,800 46.90 46.90
2 Saha Pathana Inter-Holding Public Company Limited 97,127,400 21.58 21.58
3 All the shareholders who decided not to sell the securities 141,809,800 31.51 31.51
Total 450,000,000 100.00 100.00
Table 4-33: Potential shareholding structure after making Tender Offer, in case SPI is the only one who have shown their intention
to sell their own shares in this Tender Offer (except those who have shown their intention not to sell their own shares)
Name No. of shares
Percentage of
paid up shares
of PB
Percentage of
Total voting
rights in PB
1 The Tender Offeror: Thai President Foods Public Company
Limited 217,740,200 48.39 48.39
2 Saha Pathana Inter-Holding Public Company Limited 90,450,000 20.10 20.10
3 All the shareholders who decided not to sell the securities 141,809,800 31.51 31.51
Total 450,000,000 100.00 100.00
Table 4-34: Potential shareholding structure after making Tender Offer, in case all shareholders except SPI have shown their
intention to sell their own shares in this Tender Offer
Name No. of shares
Percentage of
paid up shares
of PB
Percentage of
Total voting
rights in PB
1 The Tender Offeror: Thai President Foods Public Company
Limited 352,872,600 78.42 78.42
2 Saha Pathana Inter-Holding Public Company Limited 97,127,400 21.58 21.58
Total 450,000,000 100.00 100.00

Independent financial advisor’s opinion on the Tender Offer [Translation]
© 2018 Grant Thornton Services Ltd. All rights reserved. 36
4.2.5 The Board of Director
As at 15 August 2018 (before the Tender Offer), the PB’s Board of Directors consists of 15 members as
follows:
Table 4-35: The Board of Directors of PB prior to the purchase of the Business shares by the Tender Offerors
No. Name Position
1 Mr. Pipat Paniangvait Chief Executive Officer
2 Mr. Apichart Thammanomai Managing Director
3 Mr. Apisate Thammanomai Vice Managing Director
4 Mr. Vichai Kulsomphob Director
5 Miss Pojjanee Paniangvait Director
6 Mr. Pun Paniangvait Director
7 Mrs. Malee Tangjaisanong Director
8 Miss Petcharat Anantawichai Director
9 Mr.Thavach Keawpitag Director
10 Miss Panida Prayottaweekij Director
11 Mr. Teravuti Boonyasopon Chairman of Independent Director and Audit Committee
12 Miss Suwimon Keeratipibul Independent Director and Audit Committee
13 Mrs. Yupa Soontrapa Independent Director and Audit Committee
14 Mr. Boonsak Chiempricha Independent Director
15 Mrs. Aim-On Pathumarak Independent Director and Audit Committee
Source: PB
Within the period of 12 months after the end of the Offer Period, the Tender Offeror has no intention to
materially change the Board of Directors, unless there are reasonable grounds.
Anticipated PB’s Board of Directors following the Tender Offer consists of 15 members as follows:
Table 4-36: The Board of Directors of PB (pursuant to the purchase of the Business shares by the Tender Offerors)
No. Name Position
1 Mr. Pipat Paniangvait Chief Executive Officer
2 Mr. Apichart Thammanomai Managing Director
3 Mr. Apisate Thammanomai Vice Managing Director
4 Mr. Vichai Kulsomphob Director
5 Miss Pojjanee Paniangvait Director
6 Mr. Pun Paniangvait Director
7 Mrs. Malee Tangjaisanong Director
8 Miss Petcharat Anantawichai Director
9 Mr.Thavach Keawpitag Director
10 Miss Panida Prayottaweekij Director
11 Mr. Teravuti Boonyasopon Chairman of Independent Director and Audit Committee
12 Miss Suwimon Keeratipibul Independent Director and Audit Committee
13 Mrs. Yupa Soontrapa Independent Director and Audit Committee
14 Mr. Boonsak Chiempricha Independent Director
15 Mrs. Aim-On Pathumarak Independent Director and Audit Committee
Remark: After the Tender Offer, the Tender Offeror may change the Board of Directors for the appropriateness; if there are any changes aforementioned, the Tender
Offeror will comply with the relevant laws and regulations that are effective at that time.
Every director has the authority to sign to bind the company. Two directors co-signed and affix the company
seal except Independent director.
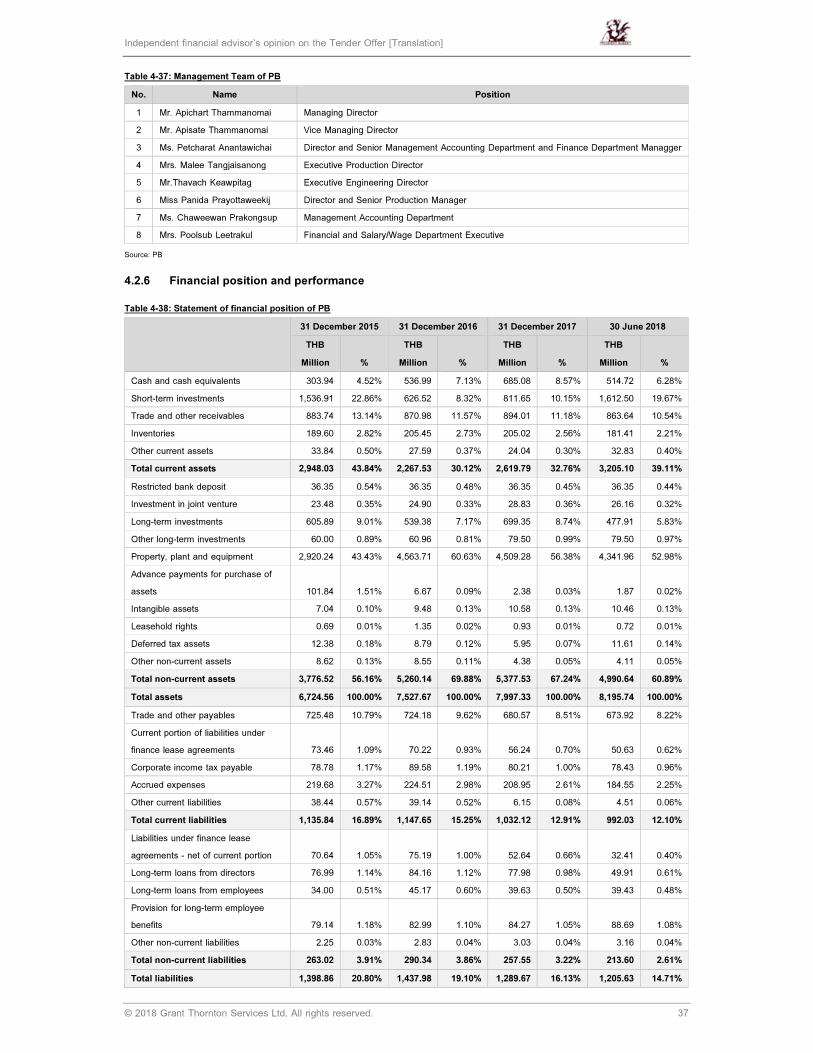
Independent financial advisor’s opinion on the Tender Offer [Translation]
© 2018 Grant Thornton Services Ltd. All rights reserved. 37
Table 4-37: Management Team of PB
No. Name Position
1 Mr. Apichart Thammanomai Managing Director
2 Mr. Apisate Thammanomai Vice Managing Director
3 Ms. Petcharat Anantawichai Director and Senior Management Accounting Department and Finance Department Managger
4 Mrs. Malee Tangjaisanong Executive Production Director
5 Mr.Thavach Keawpitag Executive Engineering Director
6 Miss Panida Prayottaweekij Director and Senior Production Manager
7 Ms. Chaweewan Prakongsup Management Accounting Department
8 Mrs. Poolsub Leetrakul Financial and Salary/Wage Department Executive
Source: PB
4.2.6 Financial position and performance
Table 4-38: Statement of financial position of PB
31 December 2015
31 December 2016 31 December 2017 30 June 2018
THB
Million %
THB
Million %
THB
Million %
THB
Million %
Cash and cash equivalents 303.94 4.52% 536.99 7.13% 685.08 8.57% 514.72 6.28%
Short-term investments 1,536.91 22.86% 626.52 8.32% 811.65 10.15% 1,612.50 19.67%
Trade and other receivables 883.74 13.14% 870.98 11.57% 894.01 11.18% 863.64 10.54%
Inventories 189.60 2.82% 205.45 2.73% 205.02 2.56% 181.41 2.21%
Other current assets 33.84 0.50% 27.59 0.37% 24.04 0.30% 32.83 0.40%
Total current assets 2,948.03 43.84% 2,267.53 30.12% 2,619.79 32.76% 3,205.10 39.11%
Restricted bank deposit 36.35 0.54% 36.35 0.48% 36.35 0.45% 36.35 0.44%
Investment in joint venture 23.48 0.35% 24.90 0.33% 28.83 0.36% 26.16 0.32%
Long-term investments 605.89 9.01% 539.38 7.17% 699.35 8.74% 477.91 5.83%
Other long-term investments 60.00 0.89% 60.96 0.81% 79.50 0.99% 79.50 0.97%
Property, plant and equipment 2,920.24 43.43% 4,563.71 60.63% 4,509.28 56.38% 4,341.96 52.98%
Advance payments for purchase of
assets
101.84
1.51%
6.67
0.09%
2.38
0.03%
1.87
0.02%
Intangible assets 7.04 0.10% 9.48 0.13% 10.58 0.13% 10.46 0.13%
Leasehold rights 0.69 0.01% 1.35 0.02% 0.93 0.01% 0.72 0.01%
Deferred tax assets 12.38 0.18% 8.79 0.12% 5.95 0.07% 11.61 0.14%
Other non-current assets 8.62 0.13% 8.55 0.11% 4.38 0.05% 4.11 0.05%
Total non-current assets 3,776.52 56.16% 5,260.14 69.88% 5,377.53 67.24% 4,990.64 60.89%
Total assets 6,724.56 100.00% 7,527.67 100.00% 7,997.33 100.00% 8,195.74 100.00%
Trade and other payables 725.48 10.79% 724.18 9.62% 680.57 8.51% 673.92 8.22%
Current portion of liabilities under
finance lease agreements
73.46
1.09%
70.22
0.93%
56.24
0.70%
50.63
0.62%
Corporate income tax payable 78.78 1.17% 89.58 1.19% 80.21 1.00% 78.43 0.96%
Accrued expenses 219.68 3.27% 224.51 2.98% 208.95 2.61% 184.55 2.25%
Other current liabilities 38.44 0.57% 39.14 0.52% 6.15 0.08% 4.51 0.06%
Total current liabilities 1,135.84 16.89% 1,147.65 15.25% 1,032.12 12.91% 992.03 12.10%
Liabilities under finance lease
agreements - net of current portion
70.64
1.05%
75.19
1.00%
52.64
0.66%
32.41
0.40%
Long-term loans from directors 76.99 1.14% 84.16 1.12% 77.98 0.98% 49.91 0.61%
Long-term loans from employees 34.00 0.51% 45.17 0.60% 39.63 0.50% 39.43 0.48%
Provision for long-term employee
benefits
79.14
1.18%
82.99
1.10%
84.27
1.05%
88.69
1.08%
Other non-current liabilities 2.25 0.03% 2.83 0.04% 3.03 0.04% 3.16 0.04%
Total non-current liabilities 263.02 3.91% 290.34 3.86% 257.55 3.22% 213.60 2.61%
Total liabilities 1,398.86 20.80% 1,437.98 19.10% 1,289.67 16.13% 1,205.63 14.71%
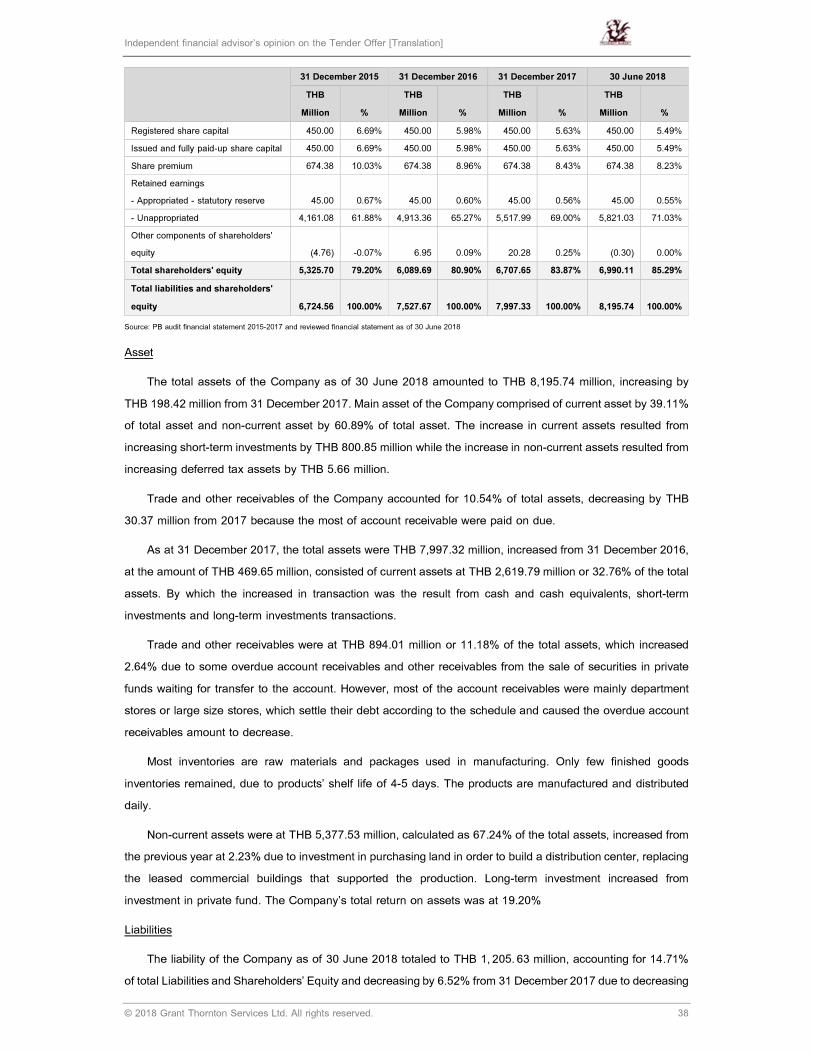
Independent financial advisor’s opinion on the Tender Offer [Translation]
© 2018 Grant Thornton Services Ltd. All rights reserved. 38
31 December 2015
31 December 2016 31 December 2017 30 June 2018
THB
Million %
THB
Million %
THB
Million %
THB
Million %
Registered share capital 450.00 6.69% 450.00 5.98% 450.00 5.63% 450.00 5.49%
Issued and fully paid-up share capital 450.00 6.69% 450.00 5.98% 450.00 5.63% 450.00 5.49%
Share premium 674.38 10.03% 674.38 8.96% 674.38 8.43% 674.38 8.23%
Retained earnings
- Appropriated - statutory reserve
45.00
0.67%
45.00
0.60%
45.00
0.56%
45.00
0.55%
- Unappropriated 4,161.08 61.88% 4,913.36 65.27% 5,517.99 69.00% 5,821.03 71.03%
Other components of shareholders'
equity
(4.76)
-0.07%
6.95
0.09%
20.28
0.25%
(0.30)
0.00%
Total shareholders' equity 5,325.70 79.20% 6,089.69 80.90% 6,707.65 83.87% 6,990.11 85.29%
Total liabilities and shareholders'
equity
6,724.56
100.00%
7,527.67
100.00%
7,997.33
100.00%
8,195.74
100.00%
Source: PB audit financial statement 2015-2017 and reviewed financial statement as of 30 June 2018
Asset
The total assets of the Company as of 30 June 2018 amounted to THB 8,195.74 million, increasing by
THB 198.42 million from 31 December 2017. Main asset of the Company comprised of current asset by 39.11%
of total asset and non-current asset by 60.89% of total asset. The increase in current assets resulted from
increasing short-term investments by THB 800.85 million while the increase in non-current assets resulted from
increasing deferred tax assets by THB 5.66 million.
Trade and other receivables of the Company accounted for 10.54% of total assets, decreasing by THB
30.37 million from 2017 because the most of account receivable were paid on due.
As at 31 December 2017, the total assets were THB 7,997.32 million, increased from 31 December 2016,
at the amount of THB 469.65 million, consisted of current assets at THB 2,619.79 million or 32.76% of the total
assets. By which the increased in transaction was the result from cash and cash equivalents, short-term
investments and long-term investments transactions.
Trade and other receivables were at THB 894.01 million or 11.18% of the total assets, which increased
2.64% due to some overdue account receivables and other receivables from the sale of securities in private
funds waiting for transfer to the account. However, most of the account receivables were mainly department
stores or large size stores, which settle their debt according to the schedule and caused the overdue account
receivables amount to decrease.
Most inventories are raw materials and packages used in manufacturing. Only few finished goods
inventories remained, due to products’ shelf life of 4-5 days. The products are manufactured and distributed
daily.
Non-current assets were at THB 5,377.53 million, calculated as 67.24% of the total assets, increased from
the previous year at 2.23% due to investment in purchasing land in order to build a distribution center, replacing
the leased commercial buildings that supported the production. Long-term investment increased from
investment in private fund. The Company’s total return on assets was at 19.20%
Liabilities
The liability of the Company as of 30 June 2018 totaled to THB 1, 205. 63 million, accounting for 14.71%
of total Liabilities and Shareholders’ Equity and decreasing by 6.52% from 31 December 2017 due to decreasing
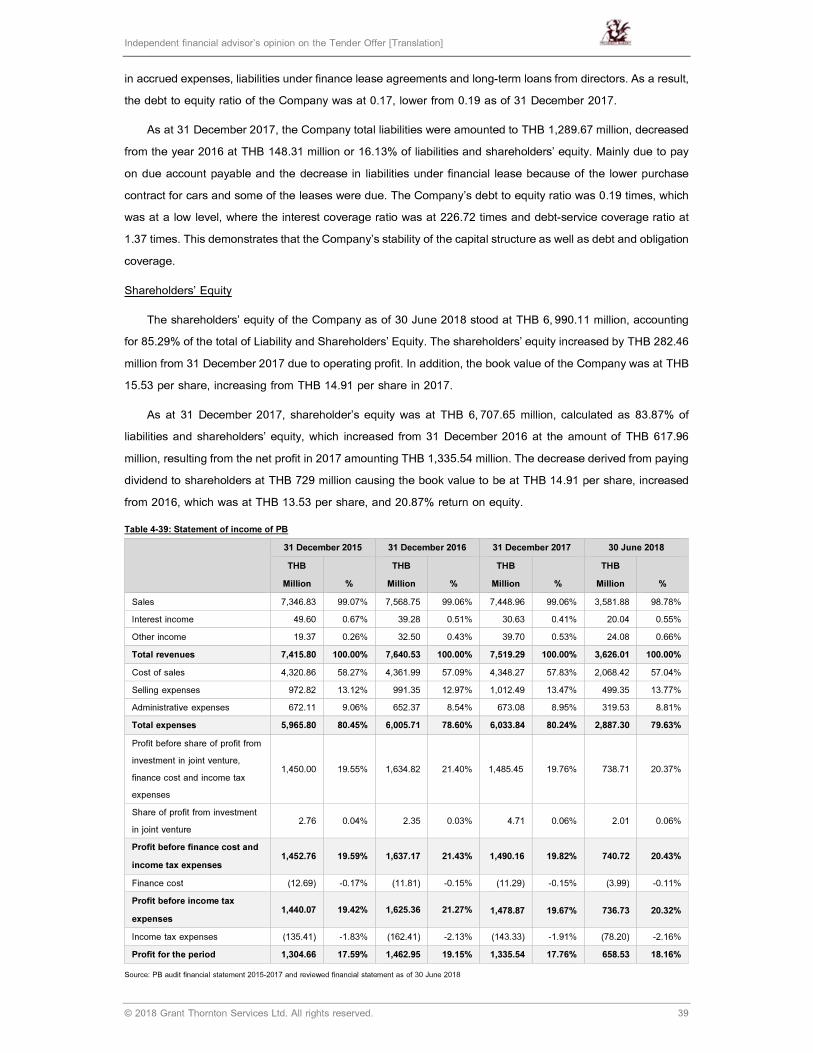
Independent financial advisor’s opinion on the Tender Offer [Translation]
© 2018 Grant Thornton Services Ltd. All rights reserved. 39
in accrued expenses, liabilities under finance lease agreements and long-term loans from directors. As a result,
the debt to equity ratio of the Company was at 0.17, lower from 0.19 as of 31 December 2017.
As at 31 December 2017, the Company total liabilities were amounted to THB 1,289.67 million, decreased
from the year 2016 at THB 148.31 million or 16.13% of liabilities and shareholders’ equity. Mainly due to pay
on due account payable and the decrease in liabilities under financial lease because of the lower purchase
contract for cars and some of the leases were due. The Company’s debt to equity ratio was 0.19 times, which
was at a low level, where the interest coverage ratio was at 226.72 times and debt-service coverage ratio at
1.37 times. This demonstrates that the Company’s stability of the capital structure as well as debt and obligation
coverage.
Shareholders’ Equity
The shareholders’ equity of the Company as of 30 June 2018 stood at THB 6, 990.11 million, accounting
for 85.29% of the total of Liability and Shareholders’ Equity. The shareholders’ equity increased by THB 282.46
million from 31 December 2017 due to operating profit. In addition, the book value of the Company was at THB
15.53 per share, increasing from THB 14.91 per share in 2017.
As at 31 December 2017, shareholder’s equity was at THB 6, 707.65 million, calculated as 83.87% of
liabilities and shareholders’ equity, which increased from 31 December 2016 at the amount of THB 617.96
million, resulting from the net profit in 2017 amounting THB 1,335.54 million. The decrease derived from paying
dividend to shareholders at THB 729 million causing the book value to be at THB 14.91 per share, increased
from 2016, which was at THB 13.53 per share, and 20.87% return on equity.
Table 4-39: Statement of income of PB
31 December 2015
31 December 2016 31 December 2017 30 June 2018
THB
Million %
THB
Million %
THB
Million %
THB
Million %
Sales 7,346.83 99.07% 7,568.75 99.06% 7,448.96 99.06% 3,581.88 98.78%
Interest income 49.60 0.67% 39.28 0.51% 30.63 0.41% 20.04 0.55%
Other income 19.37 0.26% 32.50 0.43% 39.70 0.53% 24.08 0.66%
Total revenues 7,415.80 100.00% 7,640.53 100.00% 7,519.29 100.00% 3,626.01 100.00%
Cost of sales 4,320.86 58.27% 4,361.99 57.09% 4,348.27 57.83% 2,068.42 57.04%
Selling expenses 972.82 13.12% 991.35 12.97% 1,012.49 13.47% 499.35 13.77%
Administrative expenses 672.11 9.06% 652.37 8.54% 673.08 8.95% 319.53 8.81%
Total expenses 5,965.80 80.45% 6,005.71 78.60% 6,033.84 80.24% 2,887.30 79.63%
Profit before share of profit from
investment in joint venture,
finance cost and income tax
expenses
1,450.00 19.55% 1,634.82 21.40% 1,485.45 19.76% 738.71 20.37%
Share of profit from investment
in joint venture 2.76 0.04% 2.35 0.03% 4.71 0.06% 2.01 0.06%
Profit before finance cost and
income tax expenses 1,452.76 19.59% 1,637.17 21.43% 1,490.16 19.82% 740.72 20.43%
Finance cost (12.69) -0.17% (11.81) -0.15% (11.29) -0.15% (3.99) -0.11%
Profit before income tax
expenses 1,440.07 19.42% 1,625.36 21.27%
1,478.87
19.67%
736.73
20.32%
Income tax expenses (135.41) -1.83% (162.41) -2.13% (143.33) -1.91% (78.20) -2.16%
Profit for the period 1,304.66 17.59% 1,462.95 19.15% 1,335.54 17.76% 658.53 18.16%
Source: PB audit financial statement 2015-2017 and reviewed financial statement as of 30 June 2018
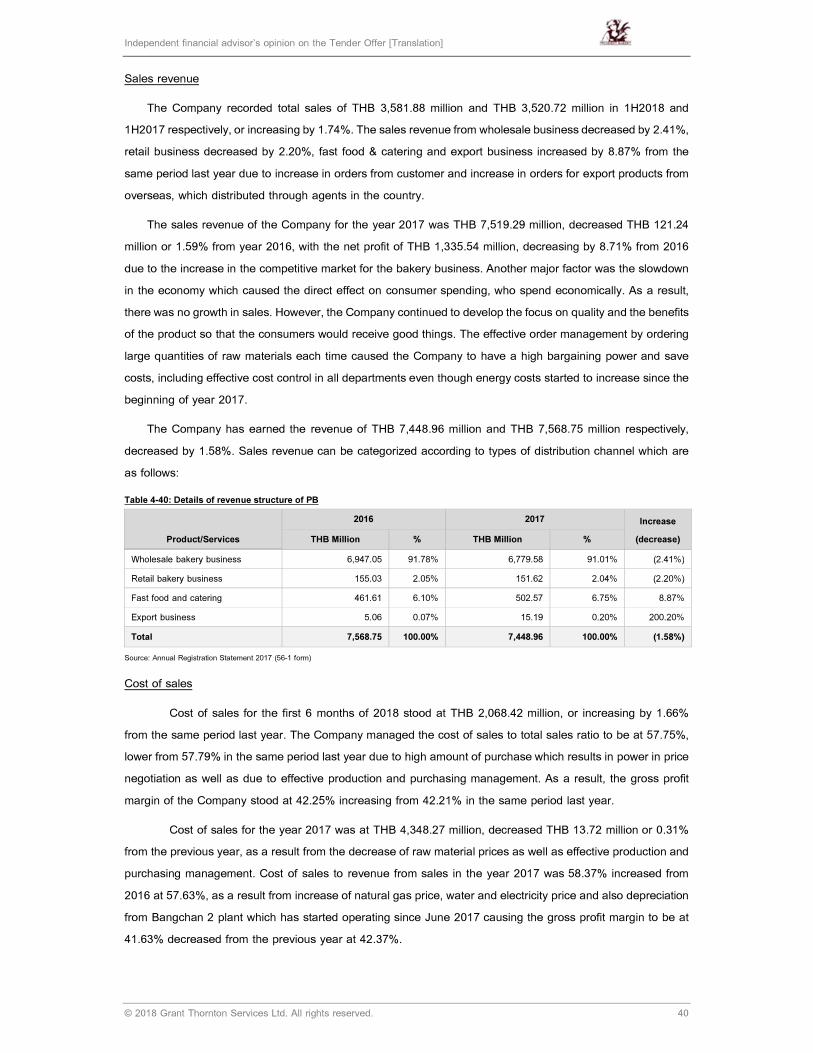
Independent financial advisor’s opinion on the Tender Offer [Translation]
© 2018 Grant Thornton Services Ltd. All rights reserved. 40
Sales revenue
The Company recorded total sales of THB 3,581.88 million and THB 3,520.72 million in 1H2018 and
1H2017 respectively, or increasing by 1.74%. The sales revenue from wholesale business decreased by 2.41%,
retail business decreased by 2.20%, fast food & catering and export business increased by 8.87% from the
same period last year due to increase in orders from customer and increase in orders for export products from
overseas, which distributed through agents in the country.
The sales revenue of the Company for the year 2017 was THB 7,519.29 million, decreased THB 121.24
million or 1.59% from year 2016, with the net profit of THB 1,335.54 million, decreasing by 8.71% from 2016
due to the increase in the competitive market for the bakery business. Another major factor was the slowdown
in the economy which caused the direct effect on consumer spending, who spend economically. As a result,
there was no growth in sales. However, the Company continued to develop the focus on quality and the benefits
of the product so that the consumers would receive good things. The effective order management by ordering
large quantities of raw materials each time caused the Company to have a high bargaining power and save
costs, including effective cost control in all departments even though energy costs started to increase since the
beginning of year 2017.
The Company has earned the revenue of THB 7,448.96 million and THB 7,568.75 million respectively,
decreased by 1.58%. Sales revenue can be categorized according to types of distribution channel which are
as follows:
Table 4-40: Details of revenue structure of PB
Product/Services
2016 2017 Increase
(decrease) THB Million % THB Million %
Wholesale bakery business 6,947.05 91.78% 6,779.58 91.01% (2.41%)
Retail bakery business 155.03 2.05% 151.62 2.04% (2.20%)
Fast food and catering 461.61 6.10% 502.57 6.75% 8.87%
Export business 5.06 0.07% 15.19 0.20% 200.20%
Total 7,568.75 100.00% 7,448.96 100.00% (1.58%)
Source: Annual Registration Statement 2017 (56-1 form)
Cost of sales
Cost of sales for the first 6 months of 2018 stood at THB 2,068.42 million, or increasing by 1.66%
from the same period last year. The Company managed the cost of sales to total sales ratio to be at 57.75%,
lower from 57.79% in the same period last year due to high amount of purchase which results in power in price
negotiation as well as due to effective production and purchasing management. As a result, the gross profit
margin of the Company stood at 42.25% increasing from 42.21% in the same period last year.
Cost of sales for the year 2017 was at THB 4,348.27 million, decreased THB 13.72 million or 0.31%
from the previous year, as a result from the decrease of raw material prices as well as effective production and
purchasing management. Cost of sales to revenue from sales in the year 2017 was 58.37% increased from
2016 at 57.63%, as a result from increase of natural gas price, water and electricity price and also depreciation
from Bangchan 2 plant which has started operating since June 2017 causing the gross profit margin to be at
41.63% decreased from the previous year at 42.37%.

Independent financial advisor’s opinion on the Tender Offer [Translation]
© 2018 Grant Thornton Services Ltd. All rights reserved. 41
Selling and Administrative Expense
The selling and administrative expenses in the first 6 months of 2018 amounted to THB 818.88 million,
accounting for 22.58% of total income. The ratio of selling and administrative expenses to total income slightly
decreased from a year earlier. In a meantime, The Company has performed effective management to control
the expenditure of transportation, product distribution, and information system.
Sales and administrative expenses consisted of salary, wages, fuel expenses, advertising fees and
sales promotion expenses, etc. For the year 2017, the expenses were THB 1,685.57 million or 22.42% of the
total revenue, increased by 2.55% compared to previous year; as a result of increase in fuel price that was
used in delivering products and the continuous advertisement in the media to reach the customers. Furthermore,
the Company has managed expense efficiently.
Income Tax
The income tax in the first 6 months of 2018 was THB 78.20 million, increased by THB 15.52 million or
24.77% from the same period last year since the Company has earned more total revenue and profit.
Meanwhile, the ratio of income tax to total revenue in the first 6 months of 2018 and 2017 was 2.16% and 1.76
respectively.
Share of profit from investment in joint venture
Share of profit from investment in joint venture in the first 6 months of 2018 accounted for THB 2.01 million,
decreased by 11.85% from the same period last year. While in 2017, share of profit from investment in joint
venture was THB 4.71 million, increased by 99.93% from previous year.
Finance cost
Finance cost for the first 6 months period of 2018 stood at THB 3.99 million, decreased by 28.49% from
the same period last year. While in 2017, finance cost accounted for THB 11.29 million, decreased by 4.44%
from previous year due to less amount of interest paid in finance lease as a result of lowered interest rate and
the amount of leasing agreement.
Profit for the period
The Company has earned the profit for the 6 months period ended 30 June 2018 of THB 658.53 million
or increased by 3.91% compared to the same period last year owing to the increase in sales and also share
of profit from investment in joint venture for the first 6 months period of 2018 at THB 2.01 million
In 2017, the Company has net profit of THB 1,335.54 million, decreased by 8.71% compared to previous
year and net profit margin of 17.76 from total revenue due to the decrease in revenues. However, the Company
has controlled costs and expenses efficiently allowing EPS to be THB 2.97 per share.
Table 4-41: Statement of cash flow summary of PB
THB Million period ended 31 December 6 months
2015 2016 2017 2018
Net cash from operating activities 1,716.49 1,869.95 1,781.54 933.53
Net cash used in investing activities (880.89) (874.97) (822.24) (694.27)
Net cash used in financing activities (656.30) (761.94) (811.21) (409.62)
Net increase (decrease) in cash and cash equivalents 179.30 233.04 148.09 (170.36)
Source: PB audit financial statement 2015-2017 and reviewed financial statement as of 30 June 2018
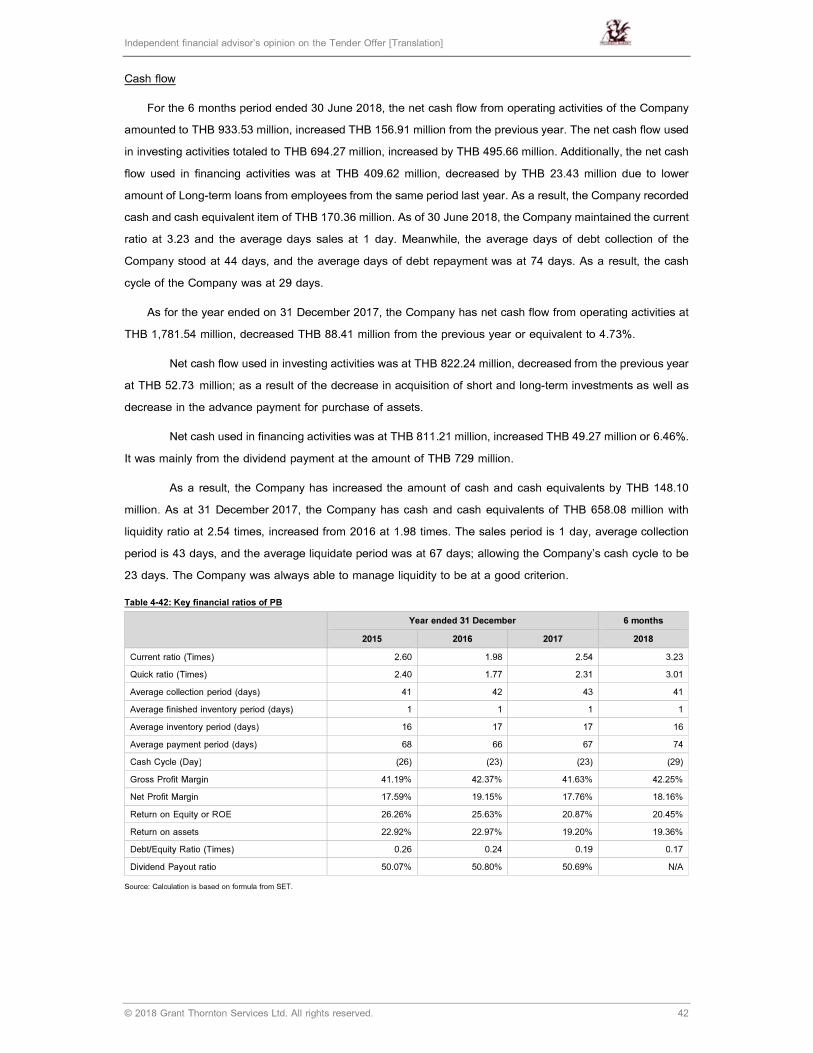
Independent financial advisor’s opinion on the Tender Offer [Translation]
© 2018 Grant Thornton Services Ltd. All rights reserved. 42
Cash flow
For the 6 months period ended 30 June 2018, the net cash flow from operating activities of the Company
amounted to THB 933.53 million, increased THB 156.91 million from the previous year. The net cash flow used
in investing activities totaled to THB 694.27 million, increased by THB 495.66 million. Additionally, the net cash
flow used in financing activities was at THB 409.62 million, decreased by THB 23.43 million due to lower
amount of Long-term loans from employees from the same period last year. As a result, the Company recorded
cash and cash equivalent item of THB 170.36 million. As of 30 June 2018, the Company maintained the current
ratio at 3.23 and the average days sales at 1 day. Meanwhile, the average days of debt collection of the
Company stood at 44 days, and the average days of debt repayment was at 74 days. As a result, the cash
cycle of the Company was at 29 days.
As for the year ended on 31 December 2017, the Company has net cash flow from operating activities at
THB 1,781.54 million, decreased THB 88.41 million from the previous year or equivalent to 4.73%.
Net cash flow used in investing activities was at THB 822.24 million, decreased from the previous year
at THB 52.73 million; as a result of the decrease in acquisition of short and long-term investments as well as
decrease in the advance payment for purchase of assets.
Net cash used in financing activities was at THB 811.21 million, increased THB 49.27 million or 6.46%.
It was mainly from the dividend payment at the amount of THB 729 million.
As a result, the Company has increased the amount of cash and cash equivalents by THB 148.10
million. As at 31 December 2017, the Company has cash and cash equivalents of THB 658.08 million with
liquidity ratio at 2.54 times, increased from 2016 at 1.98 times. The sales period is 1 day, average collection
period is 43 days, and the average liquidate period was at 67 days; allowing the Company’s cash cycle to be
23 days. The Company was always able to manage liquidity to be at a good criterion.
Table 4-42: Key financial ratios of PB
Year ended 31 December 6 months
2015 2016 2017 2018
Current ratio (Times) 2.60 1.98 2.54 3.23
Quick ratio (Times) 2.40 1.77 2.31 3.01
Average collection period (days) 41 42 43 41
Average finished inventory period (days) 1 1 1 1
Average inventory period (days) 16 17 17 16
Average payment period (days) 68 66 67 74
Cash Cycle (Day) (26) (23) (23) (29)
Gross Profit Margin 41.19% 42.37% 41.63% 42.25%
Net Profit Margin 17.59% 19.15% 17.76% 18.16%
Return on Equity or ROE 26.26% 25.63% 20.87% 20.45%
Return on assets 22.92% 22.97% 19.20% 19.36%
Debt/Equity Ratio (Times) 0.26 0.24 0.19 0.17
Dividend Payout ratio 50.07% 50.80% 50.69% N/A
Source: Calculation is based on formula from SET.

Independent financial advisor’s opinion on the Tender Offer [Translation]
© 2018 Grant Thornton Services Ltd. All rights reserved. 43
4.3 Overview of industry
The company, at present, is considered to be the top leader in bread and bakery markets in both most
advanced manufacturing technology in Southeast Asia and the highest manufacturing capacity in the country.
Besides, the company still maintains the quality and standard of the product and is able to distribute the
products nationwide on a daily basis.
The marketing factors affecting the company are caused from higher competition in pricing, sales
promotions, and store expansion among modern and traditional trade stores including fast food chains. Such
expansion is beneficial to the company in terms of higher sales and to the consumers in terms of better quality
products with reasonable price. This can cover more and wider areas under the philosophy.
Attention is paid in every process to insure consumers that the bakery products are always fresh with high
quality and consistently high standard; for example, the company maintains standard of the quality products
until they are in the customers’ hands with attractive packaging on which expiry dates are clearly given for the
first time as well as nutrition facts and ingredients mixed to informed consumers. In distribution management,
effective information technology has been used which guarantees freshness of the products.
The Company has emphasized on the quality and safety of food, in compliance with the government’s
policies in pushing Thailand to be the world’s kitchen by focusing on food safety. The Company has been
certified with Good Manufacturing Practice (GMP Codex) certificate and with Hazard Analysis and Critical
Control Point (HACCP Codex) certificate from the Thailand Institute of Scientific and Technological Research,
and from Office of Certification Body (TISTR-OCB). In addition, the Company has established ontrolling and
testing procedure at the operating place of suppliers, as well as distributed the knowledge of quality control
and safety products to SMEs trading partners. Furthermore, the Company has opened for our customers, no
matter being Wholesale, Retail, or fast Food business, to verify our production process in order to comply with
the standard of “Global Food Safety Initiative (GFSI)”, and to ensure our quality assurance in the aspect of
quality and safety for consumers along the whole operating process.
The Company invested more than 35 million baht to construct Laboratory Center in compliance with
International Standard ISO/IEC 17025 and the modern Research and Development (R&D) and Laboratory
Center on the 5th floor of Bang Chan factory.
The laboratory consisted of chemical analysis lab and microbiology analysis lab, which have modern
equipment as well as has the process of testing and analyzing in accordance with the international standard.
The laboratory is spacious and is divided into separate Sections, including Clean Room for testing and analyzing
the microbiology to prevent the operator from contamination of the microbe test sample, fully-equipped
Research and Development Room, and International Standard Sensory Room to encourage product
development and technology to invent new products to meet the demand of consumers of all age and gender.
Moreover, on the 5th floor there are meeting room, office zone, and reception area to welcome the visitors with
full-service facilities; for the confidence in the quality control system and the assurance in the Company’s quality
as well as to meet the consumers demand.
The Company received FDA Quality Award on food product under the slogan of “Quality, Safety and
Consideration of Society” for the sixth year in 2017 as the manufacturer of health products with good operation,

Independent financial advisor’s opinion on the Tender Offer [Translation]
© 2018 Grant Thornton Services Ltd. All rights reserved. 44
maintaining high production standard, and performing ethics and social responsibility in compliance with the
relevant law in 2010 – 2012 and 2015 – 2017.
The Company renewed the certificate of International Standard ISO/IEC 17025 for laboratory on Dec 16,
2016, and increased the scope of certified Testing Capability for Rapid Test of Microbiology, as well as received
the certificate of International Standard ISO/IEC 17025 for the laboratory at new Bang Chan Factory and also
moved the laboratory of waste water testing from LadKrabang Factory to Bang Chan Factory on June 23, 2017,
and submitted the application to register private waste water testing lab with Department of Industrial Works
and was granted as Good Laboratory Practice Department of Industrial Works (GLP/DIW). The Sensory
Laboratory of the Company arranged the training by Expert Panel Leader from France in 2017 for Expert Panel
Leader and Expert Panelists of the Company to improve skill and expertise.
According to the notification of the Ministry of Public Health No. 388, BE 2561, which will enforce on
January 9, 2019, a partially hydrogenated oils, refined petroleum oils and a food which adds some hydrogen
as an ingredient. Those ingredients producing trans fatty acids are prevented from produced, imported or sold
because of the significant effects of cardiovascular disease.
The company has planned to cope with this issue since 2017. All manufacturers of raw materials were
requested to abstain from using some hydrogenated fuel as an ingredient in raw materials and to issue a
certificate to the Company, confirming the raw materials were hydrogenated oil-free.
Thus, the Company is able to confirm that all products under “Farmhouse” trademark are trans fat-free.
Customers and the public have been informed through TV commercials, newspapers, social media platform
such as Facebook and official letter which were directly sent to customers. Therefore, business partners and
customers are confident in the quality of the Company’s products.

Independent financial advisor’s opinion on the Tender Offer [Translation]
© 2018 Grant Thornton Services Ltd. All rights reserved. 45
5. Fairness of the Tender Offer Price
5.1 Practice and information used in the preparation of the IFA’s opinion
The IFA’s opinion is based on the assumption that information, documents, and draft agreements, as well
as interview with the management and officers of the Company and related companies are true and correct.
The IFA has considered and studied the information with prudence and exercise reasonable care according to
professional conduct. In additions, the IFA assumes that the agreements and business arrangements are
enforceable and legally binding without any information, incident, or conditions that may affect the Tender Offer.
Nonetheless, there is no probable cause for the IFA to believe that such information is materially incomplete
to the extent that the validity of the information received may be significantly affected.
The IFA’s opinion is expressed based on the current economic condition and other factors at the time of
the preparation. Such information may materially change in the future and affect the IFA’s opinion. Nevertheless,
the IFA has no obligations to update, review or confirm the IFA’s opinion herein.
5.2 Valuation Methodologies
The IFA evaluated the value of PB shares using 5 methods of calculation as follows.
5.2.1 Book Value Approach
This valuation approach reflects the value shown on the accounting book at a specific point in time. In this
case the valuation is based on the book value of PB from financial statements for the period of six months as
of 30 June 2018, which were audited by Ms. Siriwan Nitdumrong: Certified Public Account (Thailand) No.5906
EY Office Limited.
Table 5-1: Book value approach of PB
As of 30 June 2018 (THB Million)
Issued and paid-up share capital 450.00
Premium on ordinary shares 674.38
Retained earnings 5,866.03
Other components of shareholders’ equity (0.30)
Total shareholders’ equity 6,990.11
Number of issued and paid-up shares (Million shares) 450.00
Book value per share (THB per share) 15.53
Based on the Book Value Approach, the share value of PB is THB 15.53 per share
5.2.2 Adjusted Book Value Approach
This valuation approach determines the fair value of PB by adjusting the book value of fixed asset as of
30 June 2018 per financial statements with various items to better reflect the intrinsic value of the current
financial position.
Property, plant and equipment from the balance sheet as of 30 June 2018 have the value of THB 4,341.96
million however, the quarter financial statements do not show the detail of each sub-item. According to the
annual financial statements ended 31 December 2017, the book values of property, plant and equipment are
shown as follows:
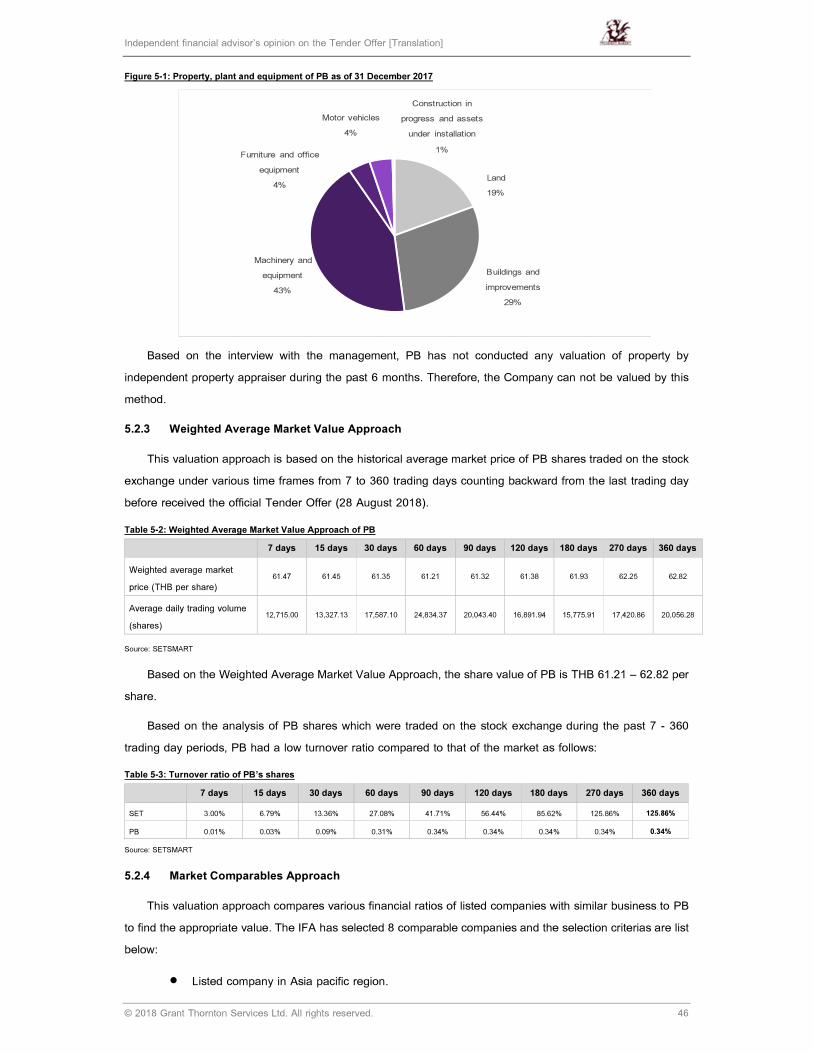
Independent financial advisor’s opinion on the Tender Offer [Translation]
© 2018 Grant Thornton Services Ltd. All rights reserved. 46
Figure 5-1: Property, plant and equipment of PB as of 31 December 2017
ที�ดินอาคารและส่วน
ปรับปรุง
เครื�องจักรและ
อุปกรณ์
เครื�องตกแต่ง
และอุปกรณ์
สํานักงาน
ยานพาหนะ
งานระหวา่ง
ก่อสร้างและ
สินทรัพย์
ระหวา่งติดตั �ง
849,267 1,323,692 1,931,151 193,231 190,655 21,285 Land19%
Buildings and improvements
29%
Machinery and equipment
43%
Furniture and office equipment
4%
Motor vehicles4%
Construction in progress and assets
under installation
1%
Based on the interview with the management, PB has not conducted any valuation of property by
independent property appraiser during the past 6 months. Therefore, the Company can not be valued by this
method.
5.2.3 Weighted Average Market Value Approach
This valuation approach is based on the historical average market price of PB shares traded on the stock
exchange under various time frames from 7 to 360 trading days counting backward from the last trading day
before received the official Tender Offer (28 August 2018).
Table 5-2: Weighted Average Market Value Approach of PB
7 days 15 days 30 days 60 days 90 days 120 days 180 days 270 days 360 days
Weighted average market
price (THB per share)
61.47 61.45 61.35 61.21 61.32 61.38 61.93 62.25 62.82
Average daily trading volume
(shares)
12,715.00 13,327.13 17,587.10 24,834.37 20,043.40 16,891.94 15,775.91 17,420.86 20,056.28
Source: SETSMART
Based on the Weighted Average Market Value Approach, the share value of PB is THB 61.21 – 62.82 per
share.
Based on the analysis of PB shares which were traded on the stock exchange during the past 7 - 360
trading day periods, PB had a low turnover ratio compared to that of the market as follows:
Table 5-3: Turnover ratio of PB’s shares
7 days 15 days 30 days 60 days 90 days 120 days 180 days 270 days 360 days
SET 3.00% 6.79% 13.36% 27.08% 41.71% 56.44% 85.62% 125.86% 125.86%
PB 0.01% 0.03% 0.09% 0.31% 0.34% 0.34% 0.34% 0.34% 0.34%
Source: SETSMART
5.2.4 Market Comparables Approach
This valuation approach compares various financial ratios of listed companies with similar business to PB
to find the appropriate value. The IFA has selected 8 comparable companies and the selection criterias are list
below:
• Listed company in Asia pacific region.

Independent financial advisor’s opinion on the Tender Offer [Translation]
© 2018 Grant Thornton Services Ltd. All rights reserved. 47
• Company operating in business related to flour product especially bread and baked product which
are similar to PB.
• Revenue and market capitalization must exceed THB 1,000 million
• Net profit and Price-to-Earnings ratio are close to PB and industry.
Table 5-4: Information on comparable companies of PB
Company name Market Trademark
Market
capitalizationas
of 28 Aug 18
(THB milion)
Trailing 12
months
revenue
(THB million)
Business description
Kido Group Corp Ho Chi Minh
Stock Index
Various 8,597.886 11,206.57 produces baked goods and
candy, cookies, crackers, pies,
cakes, and bread, along with
chocolate and other candy.
Nichiryo Baking Co.,
Ltd.
Sapporo Stock
Exchange
Nichiryo 1,273.670 5,097.61 Makes, sells bread and pastries,
and operates restaurants and
manages real estate.
Kotobuki Spirits Co.,
Ltd.
Tokyo Stock
Exchange
Tokyo Milk
Cheese
Factory,
Hokkaido’s
LeTAO, Akai
Fusen
44,021.009 11,195.04 produces confections, including
cookies, rice cakes, steamed
cakes, jellies, sweet bean jellies,
chocolates, and other sweets.
Yamazaki Baking Co.,
Ltd.
Tokyo Stock
Exchange
yamazaki 144,072.852 311,606.68 produces baking foods including
bread, pastry, and cake. The
Company operates nationwide
sales network and franchised
supermarkets and convenience
stores.
PT Nippon Indosari
Corpindo, Tbk
Jakarta Stock
Exchange
SARI ROTI 13,365.236 6,166.40 produces baked goods, bread,
cakes, bread pudding, lasagna,
and other foods.
BreadTalk Group Ltd. Singapore
Exchange
BreadTalk 13,601.069 14,551.65 an investment holding company
that engages in the provision of
management services in the
bakery, food, and restaurant
businesses. The Company,
through its subsidiaries,
manufactures and retails a
variety of food, bakery, and
confectionery products. It also
offers franchising opportunities
and operates internationally
Toly Bread Co Ltd. Shanghai
Stock
Exchange
Various 127,678.461 21,806.44 manufactures and distributes
baked food products. The
Company produces breads,
moon cakes, and other products.
Toly Bread markets its products
throughout China.
QAF Ltd.
Singapore
Exchange
Various 10,913.77 19,869.91 manufactures and distributes
bread, bakery, and confectionery
products. The Company also

Independent financial advisor’s opinion on the Tender Offer [Translation]
© 2018 Grant Thornton Services Ltd. All rights reserved. 48
Company name Market Trademark
Market
capitalizationas
of 28 Aug 18
(THB milion)
Trailing 12
months
revenue
(THB million)
Business description
operates supermarkets and cold
storage warehousing. QAF
trades and distributes food,
beverages, food related
ingredients and commodities.
Source: Bloomberg
Note: Table shown in THB for comparison.
In the process of choosing the comparable companies, IFA has considered that there is no comparable
company that is listed in the stock exchange therefore IFA has expanded the scope of searching to cover all
the Asia pacific region.
5.2.4.1 Price-to-Earnings Multiple Approach or P/E ratio
This valuation approach is based on the 12-month trailing earnings per share (August 2017 – August
2018) multiplied by the average price-to-earnings ratio (P/E) of comparable listed companies with similar
business under various time frames from 7 to 360 trading days counting backward from 28 August 2018, which
is the last trading day before receieved the official Tender Offer. Details are summarized as follows:
Table 5-5: Price-to-Earnings Approach (P/E) of PB and its comparable companies
Comparable companies
P/E ratio by historical number of days
7
days
15
days
30
days
60
days
90
days
120
days
180
days
270
days
360
days
Kido Group Corporation 23.08 23.08 23.08 23.08 23.08 23.37 24.06 23.70 20.74
Nichiryo Baking Co., Ltd. 43.37 43.59 43.99 43.70 43.63 43.66 43.16 40.73 36.86
Kotobuki Spirits Co., Ltd. 42.66 42.15 44.04 45.64 47.79 47.90 48.17 51.05 49.28
Yamazaki Baking Co., Ltd. 20.58 20.44 21.40 23.89 24.13 23.30 22.13 21.71 22.24
Nippon Indosari Corpindo 39.34 39.21 39.27 39.46 39.58 40.39 42.23 42.40 40.72
BreadTalk Group Ltd. 45.18 45.02 46.52 49.24 49.66 48.59 45.02 37.57 33.69
Toly Bread Co Ltd. 42.75 41.70 41.60 42.86 45.33 46.44 45.08 42.60 42.41
QAF Ltd. 33.76 33.66 34.58 35.75 32.86 31.27 28.63 24.28 20.11
Average P/E 36.34 36.11 36.81 37.95 38.26 38.11 37.31 35.51 33.26
Earnings per share
(THB/share)/1
3.02 3.02 3.02 3.02 3.02 3.02 3.02 3.02 3.02
Share price (THB per share) 109.75 109.04 111.16 114.62 115.54 115.11 112.68 107.23 100.43
Remark: 1 Calculated from 12-month trailing earnings per share as of June 2018, excluding the minority interest.
Based on the Price-to-earnings multiple approach, the share value of PB is THB 100.43 - 115.54 per
share.
5.2.4.2 Price-to-Book Value Approach or P/BV ratio
This valuation approach is based on the book value per share as of 30 June 2018 multiplied by the average
price-to-book value ratio (P/BV) of comparable companies with similar business under various time frames from
7 to 360 trading days counting backward from 28 August 2018, which is the last trading day before received
the official Tender Offer. Details are summarized as follows:
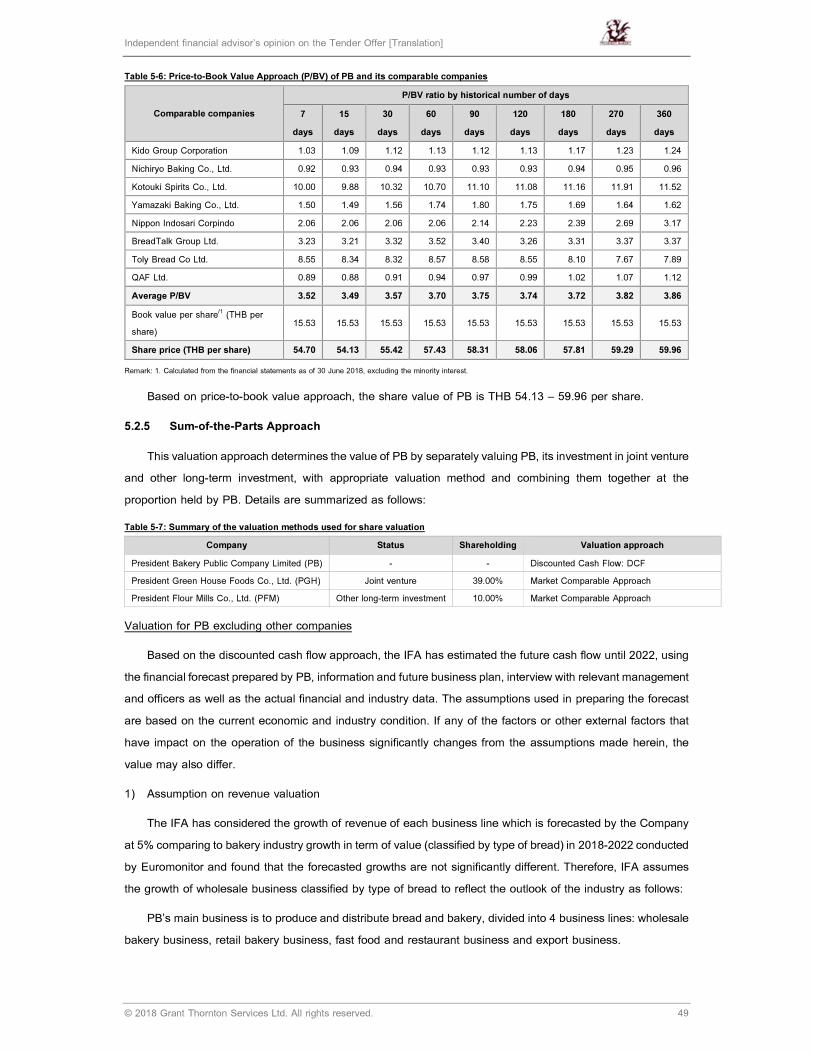
Independent financial advisor’s opinion on the Tender Offer [Translation]
© 2018 Grant Thornton Services Ltd. All rights reserved. 49
Table 5-6: Price-to-Book Value Approach (P/BV) of PB and its comparable companies
Comparable companies
P/BV ratio by historical number of days
7
days
15
days
30
days
60
days
90
days
120
days
180
days
270
days
360
days
Kido Group Corporation 1.03 1.09 1.12 1.13 1.12 1.13 1.17 1.23 1.24
Nichiryo Baking Co., Ltd. 0.92 0.93 0.94 0.93 0.93 0.93 0.94 0.95 0.96
Kotouki Spirits Co., Ltd. 10.00 9.88 10.32 10.70 11.10 11.08 11.16 11.91 11.52
Yamazaki Baking Co., Ltd. 1.50 1.49 1.56 1.74 1.80 1.75 1.69 1.64 1.62
Nippon Indosari Corpindo 2.06 2.06 2.06 2.06 2.14 2.23 2.39 2.69 3.17
BreadTalk Group Ltd. 3.23 3.21 3.32 3.52 3.40 3.26 3.31 3.37 3.37
Toly Bread Co Ltd. 8.55 8.34 8.32 8.57 8.58 8.55 8.10 7.67 7.89
QAF Ltd. 0.89 0.88 0.91 0.94 0.97 0.99 1.02 1.07 1.12
Average P/BV 3.52 3.49 3.57 3.70 3.75 3.74 3.72 3.82 3.86
Book value per share/1 (THB per
share) 15.53 15.53 15.53 15.53 15.53 15.53 15.53 15.53 15.53
Share price (THB per share) 54.70 54.13 55.42 57.43 58.31 58.06 57.81 59.29 59.96
Remark: 1. Calculated from the financial statements as of 30 June 2018, excluding the minority interest.
Based on price-to-book value approach, the share value of PB is THB 54.13 – 59.96 per share.
5.2.5 Sum-of-the-Parts Approach
This valuation approach determines the value of PB by separately valuing PB, its investment in joint venture
and other long-term investment, with appropriate valuation method and combining them together at the
proportion held by PB. Details are summarized as follows:
Table 5-7: Summary of the valuation methods used for share valuation
Company Status Shareholding Valuation approach
President Bakery Public Company Limited (PB) - - Discounted Cash Flow: DCF
President Green House Foods Co., Ltd. (PGH) Joint venture 39.00% Market Comparable Approach
President Flour Mills Co., Ltd. (PFM) Other long-term investment 10.00% Market Comparable Approach
Valuation for PB excluding other companies
Based on the discounted cash flow approach, the IFA has estimated the future cash flow until 2022, using
the financial forecast prepared by PB, information and future business plan, interview with relevant management
and officers as well as the actual financial and industry data. The assumptions used in preparing the forecast
are based on the current economic and industry condition. If any of the factors or other external factors that
have impact on the operation of the business significantly changes from the assumptions made herein, the
value may also differ.
1) Assumption on revenue valuation
The IFA has considered the growth of revenue of each business line which is forecasted by the Company
at 5% comparing to bakery industry growth in term of value (classified by type of bread) in 2018-2022 conducted
by Euromonitor and found that the forecasted growths are not significantly different. Therefore, IFA assumes
the growth of wholesale business classified by type of bread to reflect the outlook of the industry as follows:
PB’s main business is to produce and distribute bread and bakery, divided into 4 business lines: wholesale
bakery business, retail bakery business, fast food and restaurant business and export business.

Independent financial advisor’s opinion on the Tender Offer [Translation]
© 2018 Grant Thornton Services Ltd. All rights reserved. 50
Table 5-8: Revenue assumptions of PB
Assumption
1.Wholesale
Sliced bread Sales growth of sliced bread is assumed to grow by 5.60% per year during 2017-2022, which is in line with
the value growth of the bread industry during 2016-2022 (Source: Euro monitor).
Burger and hotdog buns
Sales growth of burger and hotdog buns are assumed to be constant during the forecast period, due to high
fluctuations in their growth rate during the past 5 years. Furthermore, the proportion of burger bun sale is
considered relatively small compared to other products. (Current portion of Burger and hotdog buns is 5% of
total sale
Snack bread Sales growth of 6.1% per year has been considered for snack bread during 2017-2022, which is in line with
the industry value growth for packaged pastries during 2016-2022 (Source: Euro monitor).
Snack cake
Sales growth of 6.2% per year has been considered for snack cake during 2017-2022, which is in line with
the value growth for the cake industry during 2016-2022. (Source: Euro monitor).
Confectionery
Sales growth of 4.0% has been considered for other confectionary products during 2017-2022, which is in
line with the value growth of the confectionary industry in 2017-2022 (Source: Euro monitor).
2.Retail Retail stores of PB comprise Deliya, Madame Marco, and Good Morning Farmhouse, whose growths have
been assumed constant during the forecast period due to contracted sales. PB will also give less emphasis
in the retail segment going forward.
3.Fast Food and
Catering
The client’s outlet growth of 6% per year has been considered, while the growth of sales per outlet is assumed
to be 2% per year based on inflation.
4.Export
Growth for export sales is assumed to be constant due to high fluctuation in the historical growth of export
sales during the past 4 years. Moreover, the proportion of export sales is considered relatively small compared
to other products.
Other income
Interest income Based on 5-year historical average proportion of interest income to cash and cash equivalent, banks deposit
as collaterals and long-term investment, amounting to 2.0% of cash and cash equivalent, bank deposits used
as collaterals and long-term investment.
Other income Based on 5-year historical average proportion of other income to the total sales, amounting to 0.4% of the
total sales.
2) Assumption on Expense
Table 5-9: Expense assumption of PB
Assumption
Expense
Selling expenses as a percentage to sales of 13.5% has been considered per year throughout the forecast
period based on the historical 5-year average. However, in the past 5 years, a selling expense was
approximately 13.10% -14.00% including salary, public utility and other expenses related to sale
department and sale campaign.
Cost of goods sold (not
include depreciation)
The proportion of cost of goods sold to sales of 52.8% has been considered per year throughout the
forecast period based on the historical 5-year average. Nonetheless, the cost of goods sold trend is
downward in in the future due to lower price of major raw material as well as due to effective production
and purchasing management. In 2017, ingredient and package was 67.79% of total cost of goods sold
including wheat flour 35.25%, fat 17.12%, sugar 8.14% and yeast 2.57% , agriculture and meat product
17.55% (Form 56-1)
Selling expenses Selling expenses as a percentage to sales of 13.5% has been considered per year throughout the forecast
period based on the historical 5-year average. However, in the past 5 years, a selling expense was
approximately 13.10% -14.00% including salary, public utility and other expenses related to sale
department and sale campaign.
Administrative expenses The administrative expense growth has been assumed equal to sale growth. At average 5 year was at
5.5% of total sale.
Other assumption

Independent financial advisor’s opinion on the Tender Offer [Translation]
© 2018 Grant Thornton Services Ltd. All rights reserved. 51
Assumption
Income tax rate The effective tax rate of 9.3% has been considered based on the historical 5-year average of the
Company.
CAPEX PB has investment plan estimation as follow:
2018 Additional investment of THB 151 million for building distribution center
2019 Additional investment of THB 160 million for building distribution center
Addition investment of THB 300 million for Variety B machine at Bangchan factory
2020 Addition investment of THB 1,100 million for building and machine for Ladkabang factory
2021-2022 Addition investment in maintenance a building and machine at THB 500 million
Net working capital The 5-year historical average for each relevant net working capital assumptions have been considered.
Financial forecast of PB
From the above assumptions regarding revenues, expenses, the financial forecast of PB from 2017 to
2022 is as follows:
Table 5-10: Financial forecast of PB
(THB Million) 2018 2019 2020 2021 2022
Sales 8,014.04 8,487.02 8,989.46 9,523.22 10,090.28
Other income 25.91 27.44 29.07 30.79 32.63
Total revenues 8,039.95 8,514.47 9,018.53 9,554.01 10,122.91
Cost of goods sold (4,263.32) (4,514.94) (4,782.23) (5,066.18) (5,367.84)
Gross profit 3,776.63 3,999.53 4,236.30 4,487.84 4,755.07
Selling and administrative expense (1,763.32) (1,867.38) (1,977.94) (2,095.38) (2,220.15)
EBITDA 2,013.32 2,132.14 2,258.37 2,392.46 2,534.92
Depreciation and Amortization (499.51) (552.37) (577.37) (625.40) (400.76)
EBIT 1,513.80 1,579.77 1,681.00 1,767.06 2,134.16
Income tax expenses (141.27) (147.43) (156.87) (164.90) (199.16)
NOPAT 1,372.53 1,432.35 1,524.13 1,602.16 1,935.00
Discount Rate of PB
The IFA has calculated the discount rate used in calculating the present value of cash flows of PB by using
the weighted average cost of Capital: WACC as follows:
WACC = (D/(D+E) x KD x (1 – T)) + (E/(D+E) x KE)
Where:
D Value of interest-bearing debt
E Value of shareholders’ equity
T Corporate income tax rate
KD Cost of debt
KE Cost of equity calculated using Capital Asset Pricing Model (“CAPM”)
KE is calculated under CAPM as follows:
KE = RF + β x (RM – RF)
Where:
RF Risk free rate based on the historical yield of the 10-year government bond at 2.71%
Beta Beta (β) is the average volatility between SET Market return and the comparable companies (Calculated from 2-years
historical data of the comparable companies) at 0.45 (Source: Bloomberg) ( As independent financial advisor has considered 2
years historical data (weekly) being appropriated data in term of amount and frequent of data. It was suitable for statistic
calculation which will reflect a business risk such competition and consumer behavior etc.)
RM Market return calculated from the total return from investing in SET during the past 10 years at 14.00% (Source: Bloomberg).
Remark: 1 except Seoul Food Industrial Co., Ltd. that calculated from 3-years historical data because it’s price fluctuated significantly in a previous month.
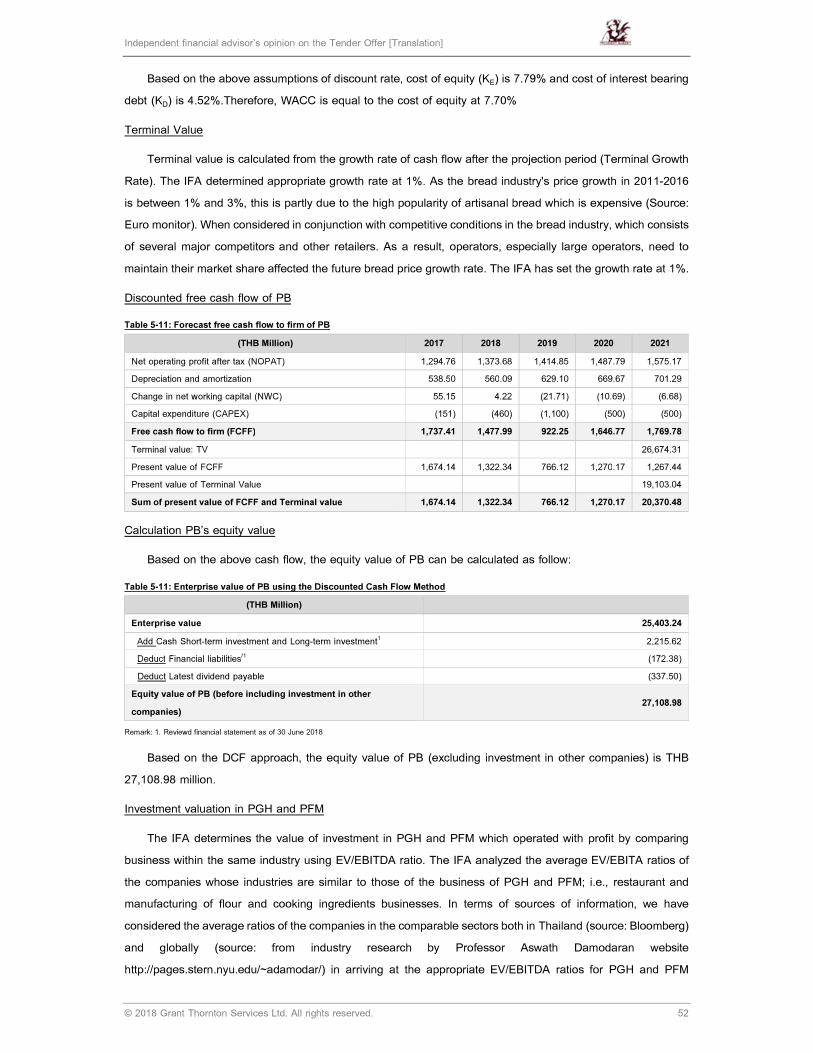
Independent financial advisor’s opinion on the Tender Offer [Translation]
© 2018 Grant Thornton Services Ltd. All rights reserved. 52
Based on the above assumptions of discount rate, cost of equity (KE) is 7.79% and cost of interest bearing
debt (KD) is 4.52%.Therefore, WACC is equal to the cost of equity at 7.70%
Terminal Value
Terminal value is calculated from the growth rate of cash flow after the projection period (Terminal Growth
Rate). The IFA determined appropriate growth rate at 1%. As the bread industry's price growth in 2011-2016
is between 1% and 3%, this is partly due to the high popularity of artisanal bread which is expensive (Source:
Euro monitor). When considered in conjunction with competitive conditions in the bread industry, which consists
of several major competitors and other retailers. As a result, operators, especially large operators, need to
maintain their market share affected the future bread price growth rate. The IFA has set the growth rate at 1%.
Discounted free cash flow of PB
Table 5-11: Forecast free cash flow to firm of PB
(THB Million) 2017 2018 2019 2020 2021
Net operating profit after tax (NOPAT) 1,294.76 1,373.68 1,414.85 1,487.79 1,575.17
Depreciation and amortization 538.50 560.09 629.10 669.67 701.29
Change in net working capital (NWC) 55.15 4.22 (21.71) (10.69) (6.68)
Capital expenditure (CAPEX) (151) (460) (1,100) (500) (500)
Free cash flow to firm (FCFF) 1,737.41 1,477.99 922.25 1,646.77 1,769.78
Terminal value: TV 26,674.31
Present value of FCFF 1,674.14 1,322.34 766.12 1,270.17 1,267.44
Present value of Terminal Value 19,103.04
Sum of present value of FCFF and Terminal value 1,674.14 1,322.34 766.12 1,270.17 20,370.48
Calculation PB’s equity value
Based on the above cash flow, the equity value of PB can be calculated as follow:
Table 5-11: Enterprise value of PB using the Discounted Cash Flow Method
(THB Million)
Enterprise value 25,403.24
Add Cash Short-term investment and Long-term investment1 2,215.62
Deduct Financial liabilities/1 (172.38)
Deduct Latest dividend payable (337.50)
Equity value of PB (before including investment in other
companies) 27,108.98
Remark: 1. Reviewd financial statement as of 30 June 2018
Based on the DCF approach, the equity value of PB (excluding investment in other companies) is THB
27,108.98 million.
Investment valuation in PGH and PFM
The IFA determines the value of investment in PGH and PFM which operated with profit by comparing
business within the same industry using EV/EBITDA ratio. The IFA analyzed the average EV/EBITA ratios of
the companies whose industries are similar to those of the business of PGH and PFM; i.e., restaurant and
manufacturing of flour and cooking ingredients businesses. In terms of sources of information, we have
considered the average ratios of the companies in the comparable sectors both in Thailand (source: Bloomberg)
and globally (source: from industry research by Professor Aswath Damodaran website
http://pages.stern.nyu.edu/~adamodar/) in arriving at the appropriate EV/EBITDA ratios for PGH and PFM
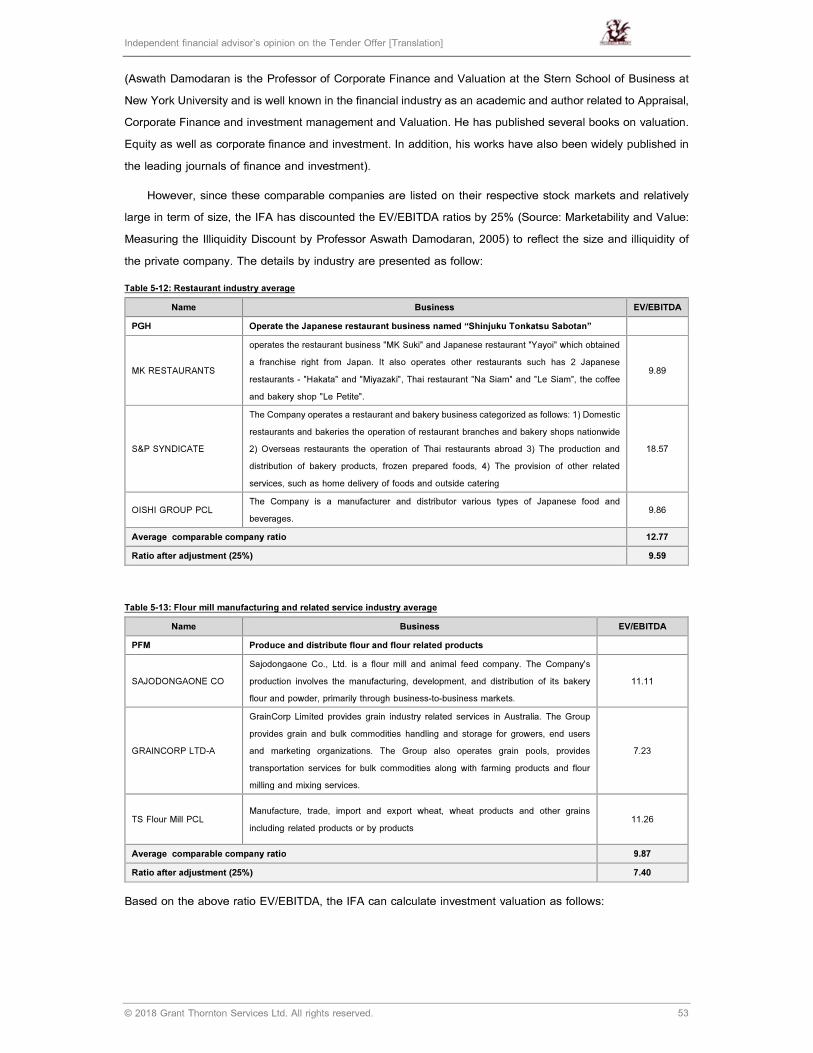
Independent financial advisor’s opinion on the Tender Offer [Translation]
© 2018 Grant Thornton Services Ltd. All rights reserved. 53
(Aswath Damodaran is the Professor of Corporate Finance and Valuation at the Stern School of Business at
New York University and is well known in the financial industry as an academic and author related to Appraisal,
Corporate Finance and investment management and Valuation. He has published several books on valuation.
Equity as well as corporate finance and investment. In addition, his works have also been widely published in
the leading journals of finance and investment).
However, since these comparable companies are listed on their respective stock markets and relatively
large in term of size, the IFA has discounted the EV/EBITDA ratios by 25% (Source: Marketability and Value:
Measuring the Illiquidity Discount by Professor Aswath Damodaran, 2005) to reflect the size and illiquidity of
the private company. The details by industry are presented as follow:
Table 5-12: Restaurant industry average
Name Business EV/EBITDA
PGH Operate the Japanese restaurant business named “Shinjuku Tonkatsu Sabotan”
MK RESTAURANTS
operates the restaurant business "MK Suki" and Japanese restaurant "Yayoi" which obtained
a franchise right from Japan. It also operates other restaurants such has 2 Japanese
restaurants - "Hakata" and "Miyazaki", Thai restaurant "Na Siam" and "Le Siam", the coffee
and bakery shop "Le Petite".
9.89
S&P SYNDICATE
The Company operates a restaurant and bakery business categorized as follows: 1) Domestic
restaurants and bakeries the operation of restaurant branches and bakery shops nationwide
2) Overseas restaurants the operation of Thai restaurants abroad 3) The production and
distribution of bakery products, frozen prepared foods, 4) The provision of other related
services, such as home delivery of foods and outside catering
18.57
OISHI GROUP PCL The Company is a manufacturer and distributor various types of Japanese food and
beverages. 9.86
Average comparable company ratio 12.77
Ratio after adjustment (25%) 9.59
Table 5-13: Flour mill manufacturing and related service industry average
Name Business EV/EBITDA
PFM Produce and distribute flour and flour related products
SAJODONGAONE CO
Sajodongaone Co., Ltd. is a flour mill and animal feed company. The Company's
production involves the manufacturing, development, and distribution of its bakery
flour and powder, primarily through business-to-business markets.
11.11
GRAINCORP LTD-A
GrainCorp Limited provides grain industry related services in Australia. The Group
provides grain and bulk commodities handling and storage for growers, end users
and marketing organizations. The Group also operates grain pools, provides
transportation services for bulk commodities along with farming products and flour
milling and mixing services.
7.23
TS Flour Mill PCL Manufacture, trade, import and export wheat, wheat products and other grains
including related products or by products 11.26
Average comparable company ratio 9.87
Ratio after adjustment (25%) 7.40
Based on the above ratio EV/EBITDA, the IFA can calculate investment valuation as follows:
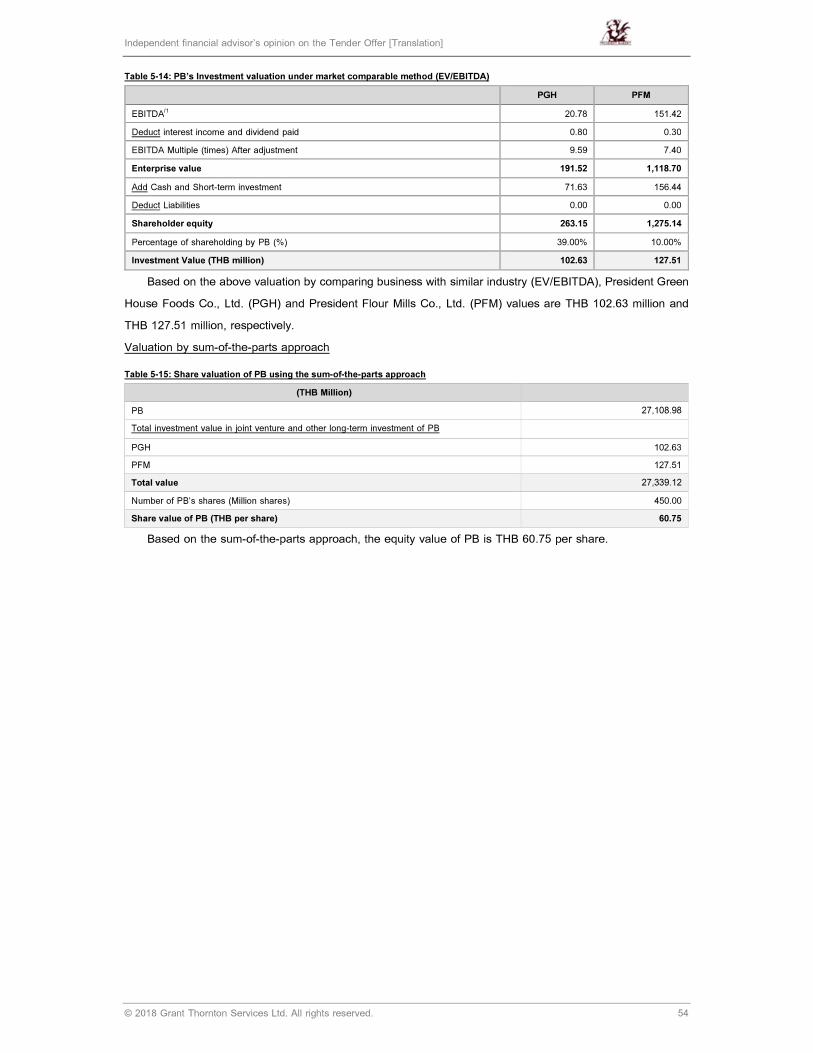
Independent financial advisor’s opinion on the Tender Offer [Translation]
© 2018 Grant Thornton Services Ltd. All rights reserved. 54
Table 5-14: PB’s Investment valuation under market comparable method (EV/EBITDA)
PGH PFM
EBITDA/1 20.78 151.42
Deduct interest income and dividend paid 0.80 0.30
EBITDA Multiple (times) After adjustment 9.59 7.40
Enterprise value 191.52 1,118.70
Add Cash and Short-term investment 71.63 156.44
Deduct Liabilities 0.00 0.00
Shareholder equity 263.15 1,275.14
Percentage of shareholding by PB (%) 39.00% 10.00%
Investment Value (THB million) 102.63 127.51
Based on the above valuation by comparing business with similar industry (EV/EBITDA), President Green
House Foods Co., Ltd. (PGH) and President Flour Mills Co., Ltd. (PFM) values are THB 102.63 million and
THB 127.51 million, respectively.
Valuation by sum-of-the-parts approach
Table 5-15: Share valuation of PB using the sum-of-the-parts approach
(THB Million)
PB 27,108.98
Total investment value in joint venture and other long-term investment of PB
PGH 102.63
PFM 127.51
Total value 27,339.12
Number of PB’s shares (Million shares) 450.00
Share value of PB (THB per share) 60.75
Based on the sum-of-the-parts approach, the equity value of PB is THB 60.75 per share.

Independent financial advisor’s opinion on the Tender Offer [Translation]
© 2018 Grant Thornton Services Ltd. All rights reserved. 55
Sensitivity analysis
The IFA performs the sensitivity analysis by varying key assumptions which have significant impact on the
share value of TICON, including weighted average cost of capital, terminal growth rate and growth of rental
rate.
• Terminal growth rate after forecasted period at ± 0.1%
• Discount Rate at ± 0.1%
IFA consider terminal growth rate after forecasted period and discount rate as significant factors affecting
share valuation. Therfore, IFA has performed sensivity analysis of PB share to terminal growth and discount
rate.
Table 5-16: Sensitivity analysis of PB’s share valuation
THB per share
Discount rate
7.50% 7.60% 7.70% 7.80% 7.90%
Terminal growth after
forecasted period
0.80% 61.09 60.25 59.44 58.65 57.89
0.90% 61.78 60.92 60.09 59.28 58.50
1.00% 62.49 61.61 60.75 59.92 59.12
1.10% 63.22 62.32 61.44 60.59 59.76
1.20% 63.98 63.05 62.15 61.27 60.42
Based on sensitivity analysis, the share value of PB is between THB 57.89 – 63.98 per share.
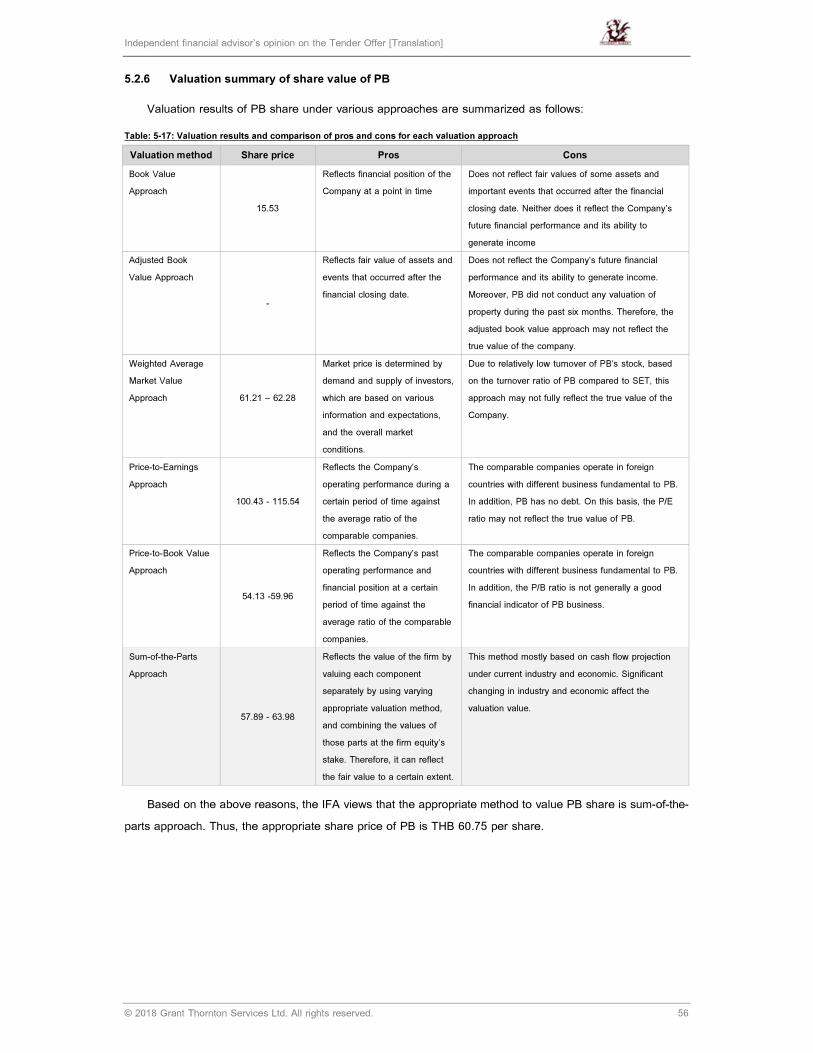
Independent financial advisor’s opinion on the Tender Offer [Translation]
© 2018 Grant Thornton Services Ltd. All rights reserved. 56
5.2.6 Valuation summary of share value of PB
Valuation results of PB share under various approaches are summarized as follows:
Table: 5-17: Valuation results and comparison of pros and cons for each valuation approach
Valuation method Share price Pros Cons
Book Value
Approach
15.53
Reflects financial position of the
Company at a point in time
Does not reflect fair values of some assets and
important events that occurred after the financial
closing date. Neither does it reflect the Company’s
future financial performance and its ability to
generate income
Adjusted Book
Value Approach
-
Reflects fair value of assets and
events that occurred after the
financial closing date.
Does not reflect the Company’s future financial
performance and its ability to generate income.
Moreover, PB did not conduct any valuation of
property during the past six months. Therefore, the
adjusted book value approach may not reflect the
true value of the company.
Weighted Average
Market Value
Approach 61.21 – 62.28
Market price is determined by
demand and supply of investors,
which are based on various
information and expectations,
and the overall market
conditions.
Due to relatively low turnover of PB’s stock, based
on the turnover ratio of PB compared to SET, this
approach may not fully reflect the true value of the
Company.
Price-to-Earnings
Approach
100.43 - 115.54
Reflects the Company’s
operating performance during a
certain period of time against
the average ratio of the
comparable companies.
The comparable companies operate in foreign
countries with different business fundamental to PB.
In addition, PB has no debt. On this basis, the P/E
ratio may not reflect the true value of PB.
Price-to-Book Value
Approach
54.13 -59.96
Reflects the Company’s past
operating performance and
financial position at a certain
period of time against the
average ratio of the comparable
companies.
The comparable companies operate in foreign
countries with different business fundamental to PB.
In addition, the P/B ratio is not generally a good
financial indicator of PB business.
Sum-of-the-Parts
Approach
57.89 - 63.98
Reflects the value of the firm by
valuing each component
separately by using varying
appropriate valuation method,
and combining the values of
those parts at the firm equity’s
stake. Therefore, it can reflect
the fair value to a certain extent.
This method mostly based on cash flow projection
under current industry and economic. Significant
changing in industry and economic affect the
valuation value.
Based on the above reasons, the IFA views that the appropriate method to value PB share is sum-of-the-
parts approach. Thus, the appropriate share price of PB is THB 60.75 per share.
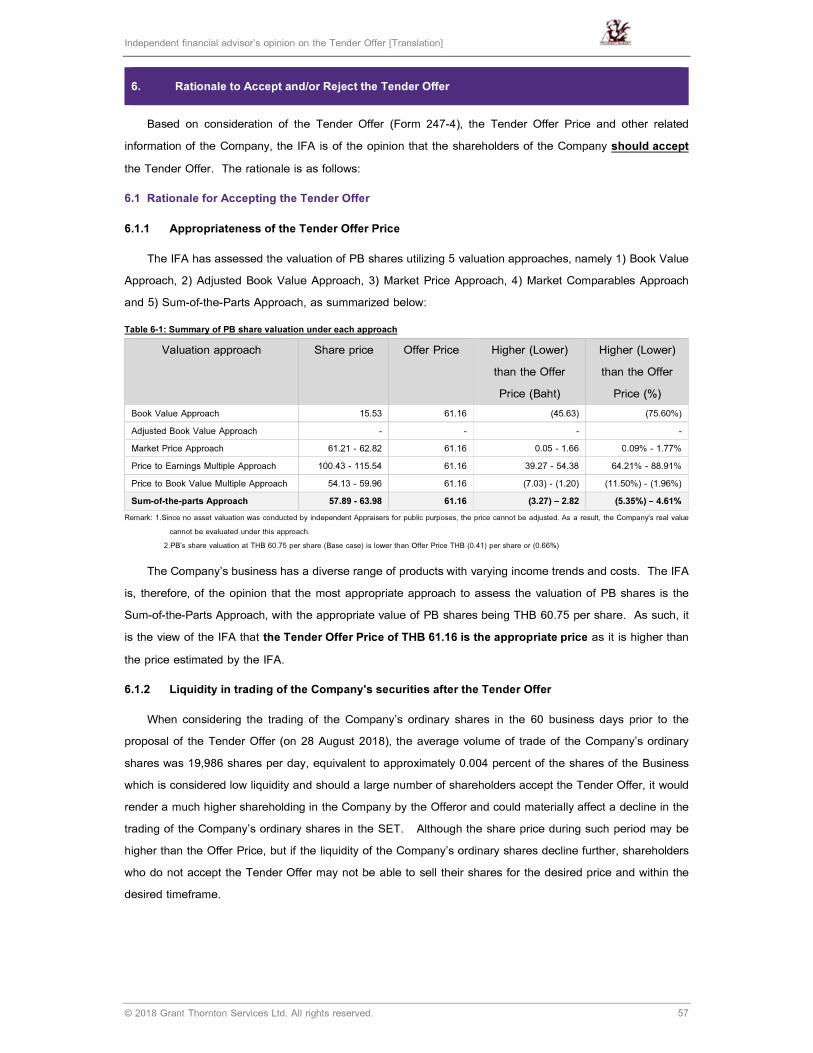
Independent financial advisor’s opinion on the Tender Offer [Translation]
© 2018 Grant Thornton Services Ltd. All rights reserved. 57
6. Rationale to Accept and/or Reject the Tender Offer
Based on consideration of the Tender Offer (Form 247-4), the Tender Offer Price and other related
information of the Company, the IFA is of the opinion that the shareholders of the Company should accept
the Tender Offer. The rationale is as follows:
6.1 Rationale for Accepting the Tender Offer
6.1.1 Appropriateness of the Tender Offer Price
The IFA has assessed the valuation of PB shares utilizing 5 valuation approaches, namely 1) Book Value
Approach, 2) Adjusted Book Value Approach, 3) Market Price Approach, 4) Market Comparables Approach
and 5) Sum-of-the-Parts Approach, as summarized below:
Table 6-1: Summary of PB share valuation under each approach
Valuation approach Share price Offer Price Higher (Lower)
than the Offer
Price (Baht)
Higher (Lower)
than the Offer
Price (%)
Book Value Approach 15.53 61.16 (45.63) (75.60%)
Adjusted Book Value Approach - - - -
Market Price Approach 61.21 - 62.82 61.16 0.05 - 1.66 0.09% - 1.77%
Price to Earnings Multiple Approach 100.43 - 115.54 61.16 39.27 - 54.38 64.21% - 88.91%
Price to Book Value Multiple Approach 54.13 - 59.96 61.16 (7.03) - (1.20) (11.50%) - (1.96%)
Sum-of-the-parts Approach 57.89 - 63.98 61.16 (3.27) – 2.82 (5.35%) – 4.61%
Remark: 1.Since no asset valuation was conducted by independent Appraisers for public purposes, the price cannot be adjusted. As a result, the Company's real value
cannot be evaluated under this approach.
2.PB’s share valuation at THB 60.75 per share (Base case) is lower than Offer Price THB (0.41) per share or (0.66%)
The Company’s business has a diverse range of products with varying income trends and costs. The IFA
is, therefore, of the opinion that the most appropriate approach to assess the valuation of PB shares is the
Sum-of-the-Parts Approach, with the appropriate value of PB shares being THB 60.75 per share. As such, it
is the view of the IFA that the Tender Offer Price of THB 61.16 is the appropriate price as it is higher than
the price estimated by the IFA.
6.1.2 Liquidity in trading of the Company's securities after the Tender Offer
When considering the trading of the Company’s ordinary shares in the 60 business days prior to the
proposal of the Tender Offer (on 28 August 2018), the average volume of trade of the Company’s ordinary
shares was 19,986 shares per day, equivalent to approximately 0.004 percent of the shares of the Business
which is considered low liquidity and should a large number of shareholders accept the Tender Offer, it would
render a much higher shareholding in the Company by the Offeror and could materially affect a decline in the
trading of the Company’s ordinary shares in the SET. Although the share price during such period may be
higher than the Offer Price, but if the liquidity of the Company’s ordinary shares decline further, shareholders
who do not accept the Tender Offer may not be able to sell their shares for the desired price and within the
desired timeframe.
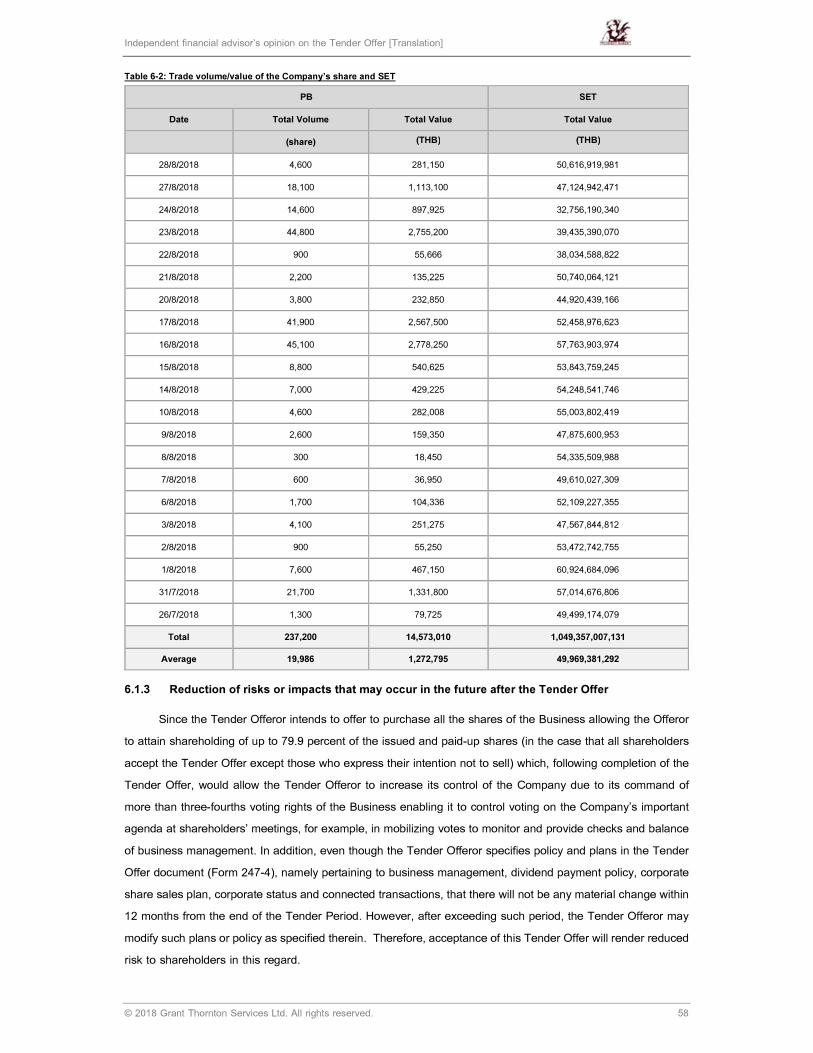
Independent financial advisor’s opinion on the Tender Offer [Translation]
© 2018 Grant Thornton Services Ltd. All rights reserved. 58
Table 6-2: Trade volume/value of the Company’s share and SET
PB SET
Date Total Volume Total Value Total Value
(share) (THB) (THB)
28/8/2018 4,600 281,150 50,616,919,981
27/8/2018 18,100 1,113,100 47,124,942,471
24/8/2018 14,600 897,925 32,756,190,340
23/8/2018 44,800 2,755,200 39,435,390,070
22/8/2018 900 55,666 38,034,588,822
21/8/2018 2,200 135,225 50,740,064,121
20/8/2018 3,800 232,850 44,920,439,166
17/8/2018 41,900 2,567,500 52,458,976,623
16/8/2018 45,100 2,778,250 57,763,903,974
15/8/2018 8,800 540,625 53,843,759,245
14/8/2018 7,000 429,225 54,248,541,746
10/8/2018 4,600 282,008 55,003,802,419
9/8/2018 2,600 159,350 47,875,600,953
8/8/2018 300 18,450 54,335,509,988
7/8/2018 600 36,950 49,610,027,309
6/8/2018 1,700 104,336 52,109,227,355
3/8/2018 4,100 251,275 47,567,844,812
2/8/2018 900 55,250 53,472,742,755
1/8/2018 7,600 467,150 60,924,684,096
31/7/2018 21,700 1,331,800 57,014,676,806
26/7/2018 1,300 79,725 49,499,174,079
Total 237,200 14,573,010 1,049,357,007,131
Average 19,986 1,272,795 49,969,381,292
6.1.3 Reduction of risks or impacts that may occur in the future after the Tender Offer
Since the Tender Offeror intends to offer to purchase all the shares of the Business allowing the Offeror
to attain shareholding of up to 79.9 percent of the issued and paid-up shares (in the case that all shareholders
accept the Tender Offer except those who express their intention not to sell) which, following completion of the
Tender Offer, would allow the Tender Offeror to increase its control of the Company due to its command of
more than three-fourths voting rights of the Business enabling it to control voting on the Company’s important
agenda at shareholders’ meetings, for example, in mobilizing votes to monitor and provide checks and balance
of business management. In addition, even though the Tender Offeror specifies policy and plans in the Tender
Offer document (Form 247-4), namely pertaining to business management, dividend payment policy, corporate
share sales plan, corporate status and connected transactions, that there will not be any material change within
12 months from the end of the Tender Period. However, after exceeding such period, the Tender Offeror may
modify such plans or policy as specified therein. Therefore, acceptance of this Tender Offer will render reduced
risk to shareholders in this regard.
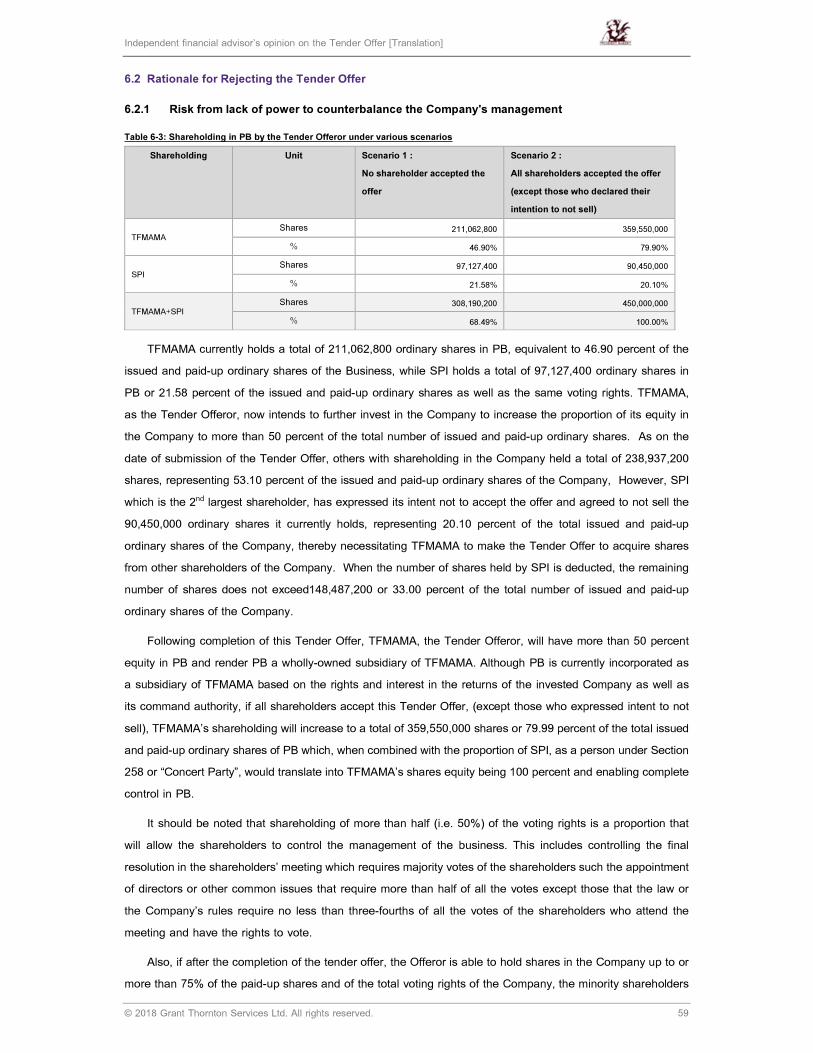
Independent financial advisor’s opinion on the Tender Offer [Translation]
© 2018 Grant Thornton Services Ltd. All rights reserved. 59
6.2 Rationale for Rejecting the Tender Offer
6.2.1 Risk from lack of power to counterbalance the Company's management
Table 6-3: Shareholding in PB by the Tender Offeror under various scenarios
Shareholding Unit Scenario 1 :
No shareholder accepted the
offer
Scenario 2 :
All shareholders accepted the offer
(except those who declared their
intention to not sell)
TFMAMA
Shares 211,062,800 359,550,000
% 46.90% 79.90%
SPI
Shares 97,127,400 90,450,000
% 21.58% 20.10%
TFMAMA+SPI
Shares 308,190,200 450,000,000
% 68.49% 100.00%
TFMAMA currently holds a total of 211,062,800 ordinary shares in PB, equivalent to 46.90 percent of the
issued and paid-up ordinary shares of the Business, while SPI holds a total of 97,127,400 ordinary shares in
PB or 21.58 percent of the issued and paid-up ordinary shares as well as the same voting rights. TFMAMA,
as the Tender Offeror, now intends to further invest in the Company to increase the proportion of its equity in
the Company to more than 50 percent of the total number of issued and paid-up ordinary shares. As on the
date of submission of the Tender Offer, others with shareholding in the Company held a total of 238,937,200
shares, representing 53.10 percent of the issued and paid-up ordinary shares of the Company, However, SPI
which is the 2nd largest shareholder, has expressed its intent not to accept the offer and agreed to not sell the
90,450,000 ordinary shares it currently holds, representing 20.10 percent of the total issued and paid-up
ordinary shares of the Company, thereby necessitating TFMAMA to make the Tender Offer to acquire shares
from other shareholders of the Company. When the number of shares held by SPI is deducted, the remaining
number of shares does not exceed148,487,200 or 33.00 percent of the total number of issued and paid-up
ordinary shares of the Company.
Following completion of this Tender Offer, TFMAMA, the Tender Offeror, will have more than 50 percent
equity in PB and render PB a wholly-owned subsidiary of TFMAMA. Although PB is currently incorporated as
a subsidiary of TFMAMA based on the rights and interest in the returns of the invested Company as well as
its command authority, if all shareholders accept this Tender Offer, (except those who expressed intent to not
sell), TFMAMA’s shareholding will increase to a total of 359,550,000 shares or 79.99 percent of the total issued
and paid-up ordinary shares of PB which, when combined with the proportion of SPI, as a person under Section
258 or “Concert Party”, would translate into TFMAMA’s shares equity being 100 percent and enabling complete
control in PB.
It should be noted that shareholding of more than half (i.e. 50%) of the voting rights is a proportion that
will allow the shareholders to control the management of the business. This includes controlling the final
resolution in the shareholders’ meeting which requires majority votes of the shareholders such the appointment
of directors or other common issues that require more than half of all the votes except those that the law or
the Company’s rules require no less than three-fourths of all the votes of the shareholders who attend the
meeting and have the rights to vote.
Also, if after the completion of the tender offer, the Offeror is able to hold shares in the Company up to or
more than 75% of the paid-up shares and of the total voting rights of the Company, the minority shareholders
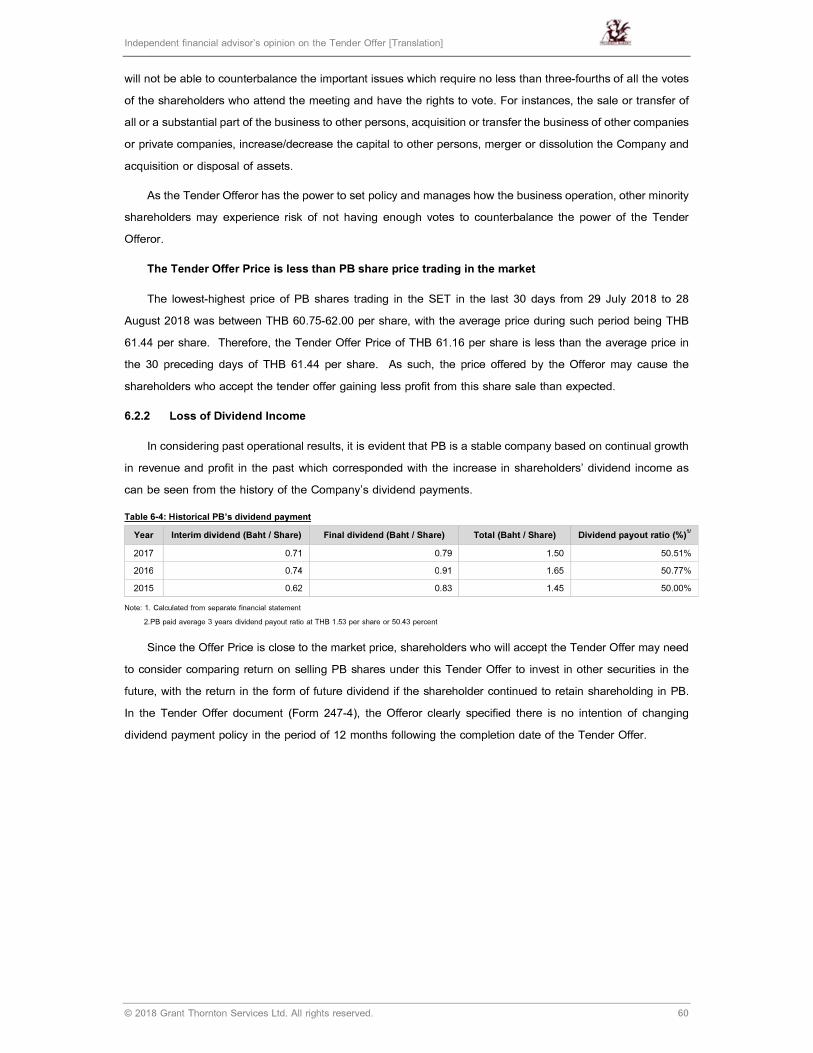
Independent financial advisor’s opinion on the Tender Offer [Translation]
© 2018 Grant Thornton Services Ltd. All rights reserved. 60
will not be able to counterbalance the important issues which require no less than three-fourths of all the votes
of the shareholders who attend the meeting and have the rights to vote. For instances, the sale or transfer of
all or a substantial part of the business to other persons, acquisition or transfer the business of other companies
or private companies, increase/decrease the capital to other persons, merger or dissolution the Company and
acquisition or disposal of assets.
As the Tender Offeror has the power to set policy and manages how the business operation, other minority
shareholders may experience risk of not having enough votes to counterbalance the power of the Tender
Offeror.
The Tender Offer Price is less than PB share price trading in the market
The lowest-highest price of PB shares trading in the SET in the last 30 days from 29 July 2018 to 28
August 2018 was between THB 60.75-62.00 per share, with the average price during such period being THB
61.44 per share. Therefore, the Tender Offer Price of THB 61.16 per share is less than the average price in
the 30 preceding days of THB 61.44 per share. As such, the price offered by the Offeror may cause the
shareholders who accept the tender offer gaining less profit from this share sale than expected.
6.2.2 Loss of Dividend Income
In considering past operational results, it is evident that PB is a stable company based on continual growth
in revenue and profit in the past which corresponded with the increase in shareholders’ dividend income as
can be seen from the history of the Company’s dividend payments.
Table 6-4: Historical PB’s dividend payment
Year Interim dividend (Baht / Share) Final dividend (Baht / Share) Total (Baht / Share) Dividend payout ratio (%)1/
2017 0.71 0.79 1.50 50.51%
2016 0.74 0.91 1.65 50.77%
2015 0.62 0.83 1.45 50.00%
Note: 1. Calculated from separate financial statement
2.PB paid average 3 years dividend payout ratio at THB 1.53 per share or 50.43 percent
Since the Offer Price is close to the market price, shareholders who will accept the Tender Offer may need
to consider comparing return on selling PB shares under this Tender Offer to invest in other securities in the
future, with the return in the form of future dividend if the shareholder continued to retain shareholding in PB.
In the Tender Offer document (Form 247-4), the Offeror clearly specified there is no intention of changing
dividend payment policy in the period of 12 months following the completion date of the Tender Offer.

Independent financial advisor’s opinion on the Tender Offer [Translation]
© 2018 Grant Thornton Services Ltd. All rights reserved. 61
7. Benefits or Impacts from Policies and Business Directions Disclosed in the Tender Offer
Having considered the Business Plans and Policies following the takeover of the Company as stated in
the Tender Offer (Form 274-4), as well as all supplementary information of the Company and other information
which the Tender Offeror disclosed to investors, the IFA has rendered the following opinion regarding benefits
to and impacts on the Company.
7.1 Status of the Company
The Tender Offeror has no intention to delist the Business’s securities from the SET during the 12 months
following the Tender Offer period except in cases where the Tender Offeror is required to comply with provisions
of relevant laws, criteria and regulations in effect at the time.
The Company may run the risk in maintaining its status of listed company in the SET and could be delisted
if so many shareholders accept the Tender Offer that less than 150 minority shareholders remain with aggregate
shareholding of less than 15 percent of the registered and paid-up capital of the Company. However, in the
case that the Company cannot comply with such qualification, the SET has set guidelines for listing companies
with incomplete free float, imposing additional fees once the Company fails to meet the free-float requirement
for 2 consecutive years or more, based on the size of the shortfall in the free float and the number of years
such situation has existed past the 1-year grace period.
Nevertheless, if the Tender Offeror intends to delist the Business securities from the SET, the Company
must obtain approval from shareholders or their proxy (if any) with voting rights in attendance at the
shareholders’ meeting with a vote of not less that 3 out of 4 the total number of issued and paid-up shares,
and with no more than 10 percent objection of the total issued and paid-up shares, along with notification of
the meeting’s resolution to the SET and the SEC as legally required.
Based on the aforementioned factors and other current information, the IFA finds no reason to doubt that
there will be any undertaking which would materially impact on the status of the Company in the period of 12
months following the end of the Tender Offer Period. Moreover, it is unlikely that the Tender Offeror would
gain any benefit if the Company’s status is changed.
7.2 Sources of the Tender Offeror’s Funding
As stated in the Tender Offer (Form 247-4) , if other shareholders express the intention to sell all the
remaining ordinary shares of the Company totaling 238,937,200 shares (two hundred and thirty-eight million,
nine hundred and thirty-seven thousand, two hundred shares) at the Offer Price of THB 61.16 (sixty-one Baht
and sixteen satangs) per share, the Tender Offeror needs total funding of THB 14,613,399,152 (fourteen billion,
six hundred and thirteen million, three hundred and ninety-nine thousand, one hundred and fifty-two Baht).
However, the Tender Offeror has received a letter of intent from SPI confirming its unwillingness to accept the
Tender Offer and its agreement not to sell the 90,450,000 shares (ninety million, four hundred and fifty thousand
shares) it holds in the Company, equivalent to 20.10 percent of the total number of issued and paid-up shares
of the Company. Therefore, the number of ordinary shares the Tender Offeror must offer to purchase from
other shareholders of the Company, after deducting the aforementioned number of ordinary shares held by SPI
which has been agreed are not to be tendered, amounts to a total of 148,487,200 shares (one hundred and
forty-eight million, four hundred and eighty-seven thousand, two hundred shares), or equivalent to 33.00 percent
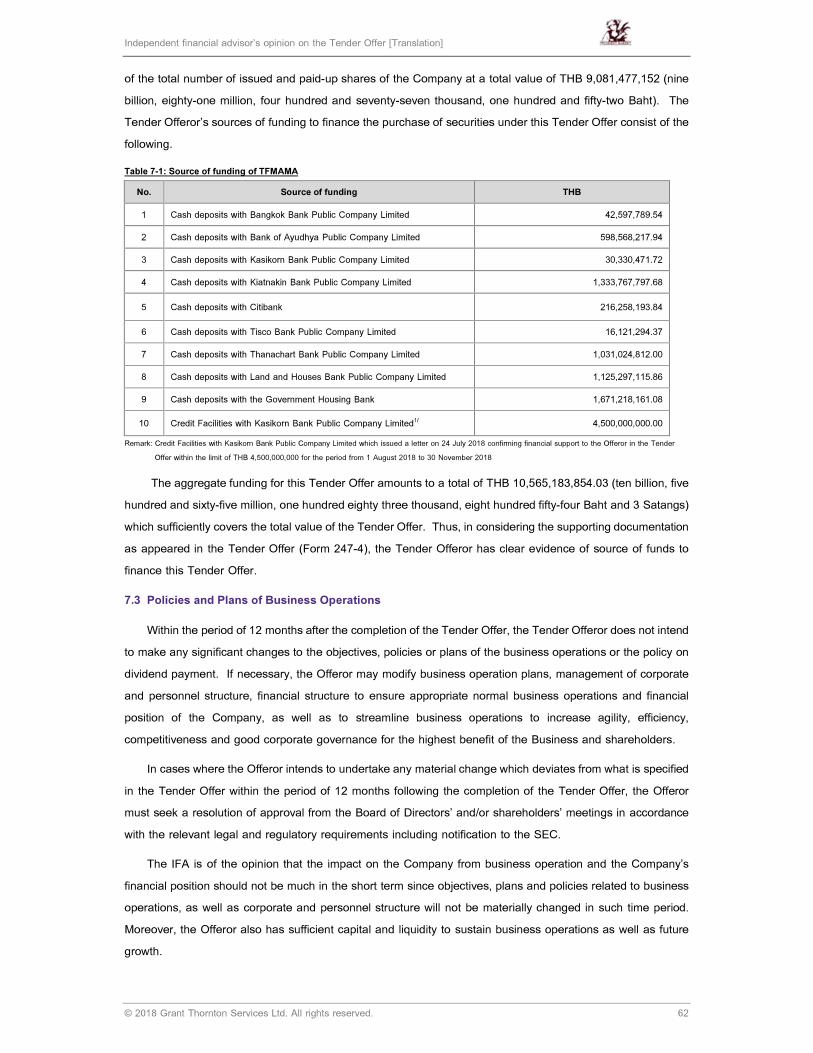
Independent financial advisor’s opinion on the Tender Offer [Translation]
© 2018 Grant Thornton Services Ltd. All rights reserved. 62
of the total number of issued and paid-up shares of the Company at a total value of THB 9,081,477,152 (nine
billion, eighty-one million, four hundred and seventy-seven thousand, one hundred and fifty-two Baht). The
Tender Offeror’s sources of funding to finance the purchase of securities under this Tender Offer consist of the
following.
Table 7-1: Source of funding of TFMAMA
No. Source of funding THB
1 Cash deposits with Bangkok Bank Public Company Limited 42,597,789.54
2 Cash deposits with Bank of Ayudhya Public Company Limited 598,568,217.94
3 Cash deposits with Kasikorn Bank Public Company Limited 30,330,471.72
4 Cash deposits with Kiatnakin Bank Public Company Limited 1,333,767,797.68
5 Cash deposits with Citibank 216,258,193.84
6 Cash deposits with Tisco Bank Public Company Limited 16,121,294.37
7 Cash deposits with Thanachart Bank Public Company Limited 1,031,024,812.00
8 Cash deposits with Land and Houses Bank Public Company Limited 1,125,297,115.86
9 Cash deposits with the Government Housing Bank 1,671,218,161.08
10 Credit Facilities with Kasikorn Bank Public Company Limited1/
4,500,000,000.00
Remark: Credit Facilities with Kasikorn Bank Public Company Limited which issued a letter on 24 July 2018 confirming financial support to the Offeror in the Tender
Offer within the limit of THB 4,500,000,000 for the period from 1 August 2018 to 30 November 2018
The aggregate funding for this Tender Offer amounts to a total of THB 10,565,183,854.03 (ten billion, five
hundred and sixty-five million, one hundred eighty three thousand, eight hundred fifty-four Baht and 3 Satangs)
which sufficiently covers the total value of the Tender Offer. Thus, in considering the supporting documentation
as appeared in the Tender Offer (Form 247-4), the Tender Offeror has clear evidence of source of funds to
finance this Tender Offer.
7.3 Policies and Plans of Business Operations
Within the period of 12 months after the completion of the Tender Offer, the Tender Offeror does not intend
to make any significant changes to the objectives, policies or plans of the business operations or the policy on
dividend payment. If necessary, the Offeror may modify business operation plans, management of corporate
and personnel structure, financial structure to ensure appropriate normal business operations and financial
position of the Company, as well as to streamline business operations to increase agility, efficiency,
competitiveness and good corporate governance for the highest benefit of the Business and shareholders.
In cases where the Offeror intends to undertake any material change which deviates from what is specified
in the Tender Offer within the period of 12 months following the completion of the Tender Offer, the Offeror
must seek a resolution of approval from the Board of Directors’ and/or shareholders’ meetings in accordance
with the relevant legal and regulatory requirements including notification to the SEC.
The IFA is of the opinion that the impact on the Company from business operation and the Company’s
financial position should not be much in the short term since objectives, plans and policies related to business
operations, as well as corporate and personnel structure will not be materially changed in such time period.
Moreover, the Offeror also has sufficient capital and liquidity to sustain business operations as well as future
growth.
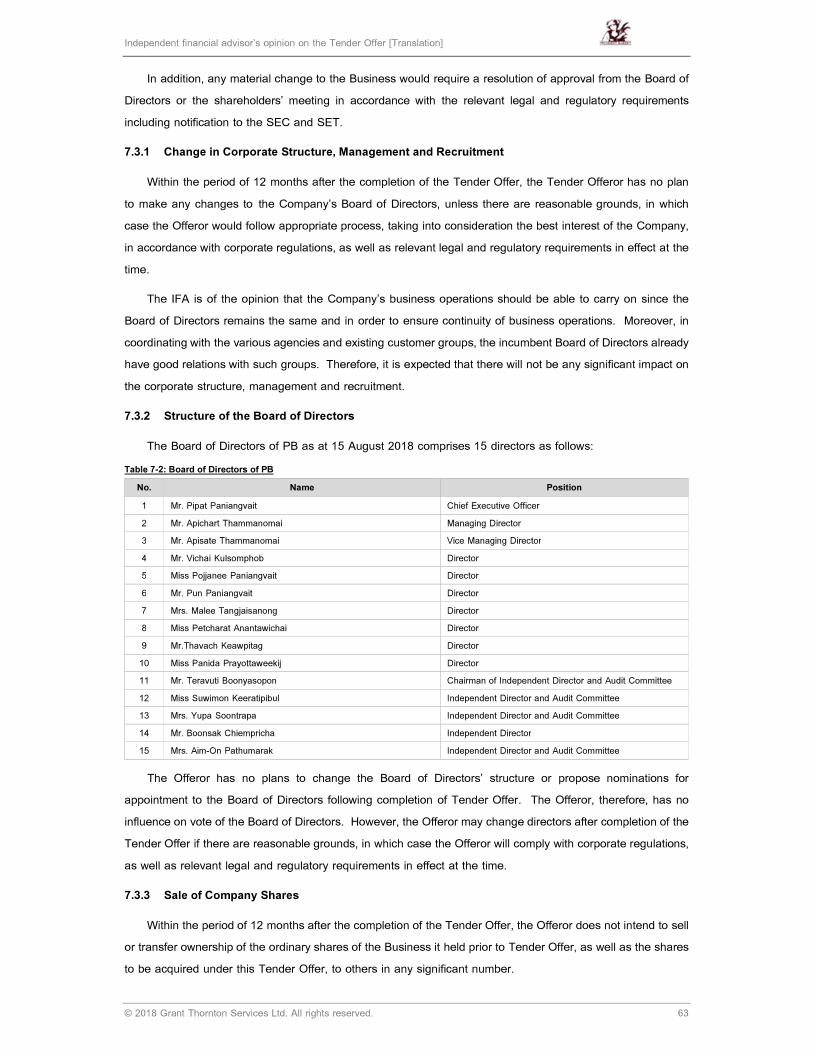
Independent financial advisor’s opinion on the Tender Offer [Translation]
© 2018 Grant Thornton Services Ltd. All rights reserved. 63
In addition, any material change to the Business would require a resolution of approval from the Board of
Directors or the shareholders’ meeting in accordance with the relevant legal and regulatory requirements
including notification to the SEC and SET.
7.3.1 Change in Corporate Structure, Management and Recruitment
Within the period of 12 months after the completion of the Tender Offer, the Tender Offeror has no plan
to make any changes to the Company’s Board of Directors, unless there are reasonable grounds, in which
case the Offeror would follow appropriate process, taking into consideration the best interest of the Company,
in accordance with corporate regulations, as well as relevant legal and regulatory requirements in effect at the
time.
The IFA is of the opinion that the Company’s business operations should be able to carry on since the
Board of Directors remains the same and in order to ensure continuity of business operations. Moreover, in
coordinating with the various agencies and existing customer groups, the incumbent Board of Directors already
have good relations with such groups. Therefore, it is expected that there will not be any significant impact on
the corporate structure, management and recruitment.
7.3.2 Structure of the Board of Directors
The Board of Directors of PB as at 15 August 2018 comprises 15 directors as follows:
Table 7-2: Board of Directors of PB
No. Name Position
1 Mr. Pipat Paniangvait Chief Executive Officer
2 Mr. Apichart Thammanomai Managing Director
3 Mr. Apisate Thammanomai Vice Managing Director
4 Mr. Vichai Kulsomphob Director
5 Miss Pojjanee Paniangvait Director
6 Mr. Pun Paniangvait Director
7 Mrs. Malee Tangjaisanong Director
8 Miss Petcharat Anantawichai Director
9 Mr.Thavach Keawpitag Director
10 Miss Panida Prayottaweekij Director
11 Mr. Teravuti Boonyasopon Chairman of Independent Director and Audit Committee
12 Miss Suwimon Keeratipibul Independent Director and Audit Committee
13 Mrs. Yupa Soontrapa Independent Director and Audit Committee
14 Mr. Boonsak Chiempricha Independent Director
15 Mrs. Aim-On Pathumarak Independent Director and Audit Committee
The Offeror has no plans to change the Board of Directors’ structure or propose nominations for
appointment to the Board of Directors following completion of Tender Offer. The Offeror, therefore, has no
influence on vote of the Board of Directors. However, the Offeror may change directors after completion of the
Tender Offer if there are reasonable grounds, in which case the Offeror will comply with corporate regulations,
as well as relevant legal and regulatory requirements in effect at the time.
7.3.3 Sale of Company Shares
Within the period of 12 months after the completion of the Tender Offer, the Offeror does not intend to sell
or transfer ownership of the ordinary shares of the Business it held prior to Tender Offer, as well as the shares
to be acquired under this Tender Offer, to others in any significant number.
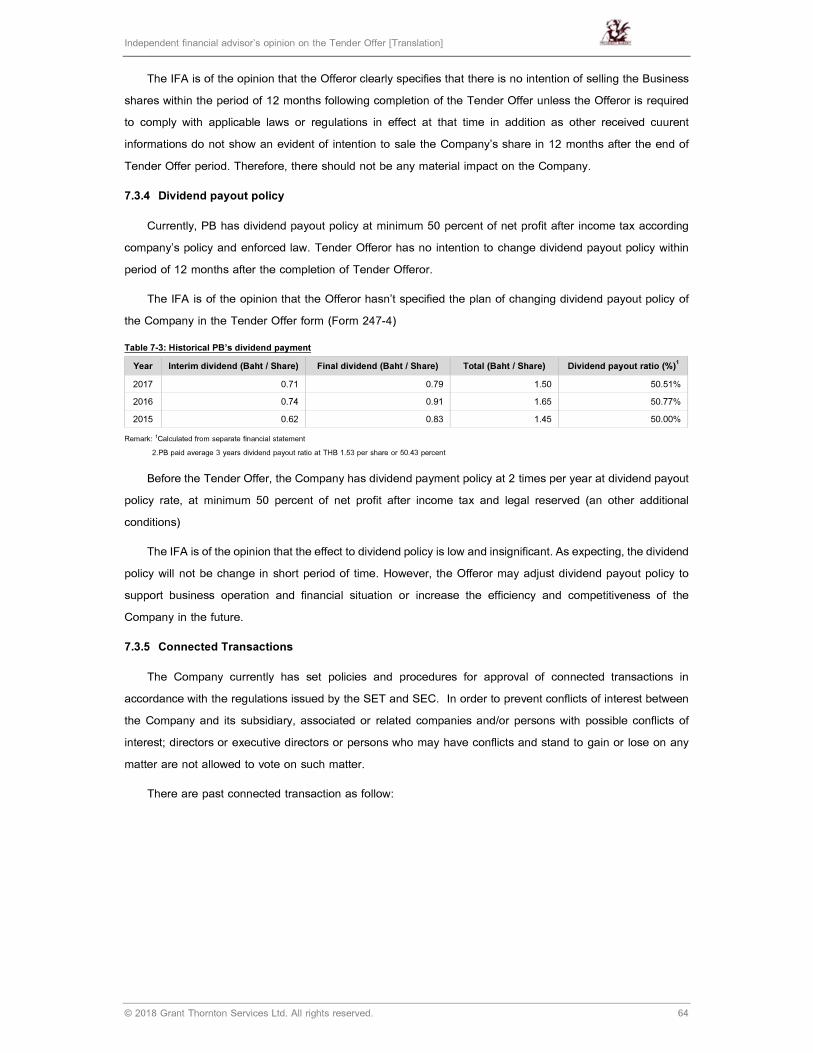
Independent financial advisor’s opinion on the Tender Offer [Translation]
© 2018 Grant Thornton Services Ltd. All rights reserved. 64
The IFA is of the opinion that the Offeror clearly specifies that there is no intention of selling the Business
shares within the period of 12 months following completion of the Tender Offer unless the Offeror is required
to comply with applicable laws or regulations in effect at that time in addition as other received cuurent
informations do not show an evident of intention to sale the Company’s share in 12 months after the end of
Tender Offer period. Therefore, there should not be any material impact on the Company.
7.3.4 Dividend payout policy
Currently, PB has dividend payout policy at minimum 50 percent of net profit after income tax according
company’s policy and enforced law. Tender Offeror has no intention to change dividend payout policy within
period of 12 months after the completion of Tender Offeror.
The IFA is of the opinion that the Offeror hasn’t specified the plan of changing dividend payout policy of
the Company in the Tender Offer form (Form 247-4)
Table 7-3: Historical PB’s dividend payment
Year Interim dividend (Baht / Share) Final dividend (Baht / Share) Total (Baht / Share) Dividend payout ratio (%)1
2017 0.71 0.79 1.50 50.51%
2016 0.74 0.91 1.65 50.77%
2015 0.62 0.83 1.45 50.00%
Remark: 1Calculated from separate financial statement
2.PB paid average 3 years dividend payout ratio at THB 1.53 per share or 50.43 percent
Before the Tender Offer, the Company has dividend payment policy at 2 times per year at dividend payout
policy rate, at minimum 50 percent of net profit after income tax and legal reserved (an other additional
conditions)
The IFA is of the opinion that the effect to dividend policy is low and insignificant. As expecting, the dividend
policy will not be change in short period of time. However, the Offeror may adjust dividend payout policy to
support business operation and financial situation or increase the efficiency and competitiveness of the
Company in the future.
7.3.5 Connected Transactions
The Company currently has set policies and procedures for approval of connected transactions in
accordance with the regulations issued by the SET and SEC. In order to prevent conflicts of interest between
the Company and its subsidiary, associated or related companies and/or persons with possible conflicts of
interest; directors or executive directors or persons who may have conflicts and stand to gain or lose on any
matter are not allowed to vote on such matter.
There are past connected transaction as follow:
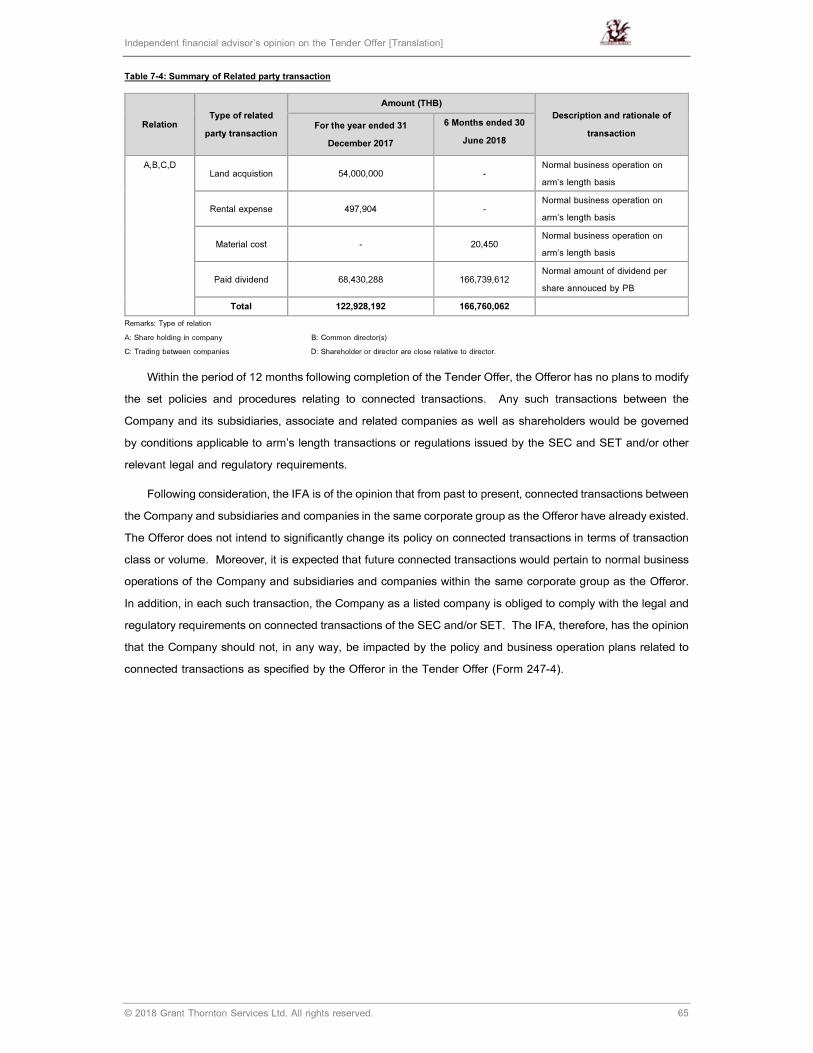
Independent financial advisor’s opinion on the Tender Offer [Translation]
© 2018 Grant Thornton Services Ltd. All rights reserved. 65
Table 7-4: Summary of Related party transaction
Relation Type of related
party transaction
Amount (THB)
Description and rationale of
transaction For the year ended 31
December 2017
6 Months ended 30
June 2018
A,B,C,D Land acquistion 54,000,000 -
Normal business operation on
arm’s length basis
Rental expense 497,904 - Normal business operation on
arm’s length basis
Material cost - 20,450 Normal business operation on
arm’s length basis
Paid dividend 68,430,288 166,739,612 Normal amount of dividend per
share annouced by PB
Total 122,928,192 166,760,062
Remarks: Type of relation
A: Share holding in company B: Common director(s)
C: Trading between companies D: Shareholder or director are close relative to director.
Within the period of 12 months following completion of the Tender Offer, the Offeror has no plans to modify
the set policies and procedures relating to connected transactions. Any such transactions between the
Company and its subsidiaries, associate and related companies as well as shareholders would be governed
by conditions applicable to arm’s length transactions or regulations issued by the SEC and SET and/or other
relevant legal and regulatory requirements.
Following consideration, the IFA is of the opinion that from past to present, connected transactions between
the Company and subsidiaries and companies in the same corporate group as the Offeror have already existed.
The Offeror does not intend to significantly change its policy on connected transactions in terms of transaction
class or volume. Moreover, it is expected that future connected transactions would pertain to normal business
operations of the Company and subsidiaries and companies within the same corporate group as the Offeror.
In addition, in each such transaction, the Company as a listed company is obliged to comply with the legal and
regulatory requirements on connected transactions of the SEC and/or SET. The IFA, therefore, has the opinion
that the Company should not, in any way, be impacted by the policy and business operation plans related to
connected transactions as specified by the Offeror in the Tender Offer (Form 247-4).
Independent financial advisor’s opinion on the Tender Offer [Translation]
© 2018 Grant Thornton Services Ltd. All rights reserved. 66
8. Opinion of the Independent Financial Advisor
The IFA has analyzed and evaluated information, under the scope, conditions and certain limitations as
discussed in the previous sections of this report. The IFA is of the opinion that the shareholders should
accept the Tender Offer because the appropriate share price of PB is in range of THB 57.89 - 63.98 per share
and at THB 60.75 per share as based case. Therefore, the IFA views that the offering price at THB 61.16 per
share is appropriate as it is in the range of appropriated price. Even though, the shareholders can choose to
sell their shares in the SET, with higher price than the Tender Offer Price but due to low liquidity of the
Company’s share, shareholders may not be able to sell their shares for the desired price and within the desired
timeframe.
However, in making decision to accept or reject the Tender Offer, the shareholders should consider
information, including the Tender Offer (Form 247-4), the Opinion of the Company on the Tender Offer (Form
250-2), and details of the IFA’s Opinion, particularly on the scope, methodologies, assumptions used in the
financial projection, information from management of the Company, and publicly available information. This
opinion will only be completed when considered as a whole. The IFA shall not be held responsible from the
disclosure, reference or dissemination of the Opinion in part without approval from the IFA.
The IFA hereby certifies that the Opinion has been rendered with due care in accordance with professional
standards, for the best interests of the shareholders.
Although the share price during such period may be higher than the Offer Price, but if the liquidity of the
Company’s ordinary shares decline further, shareholders who do not accept the Tender Offer may not be able
to sell their shares for the desired price and within the desired timeframe.
Yours faithfully,
Monvalai Rachatakul
Supervisor
Grant Thornton Services Ltd.
Oraprapai Sukumalchantr
Partner
Grant Thornton Services Ltd.

© 2018 Grant Thornton Services Ltd. All rights reserved.
“Grant Thornton” refers to the brand under which the Grant Thornton member firms provide assurance, tax and advisory services to their clients and/or refers to one or more member firms, as the context requires. Grant Thornton Services Ltd. is a member firm of Grant Thornton International Ltd (GTIL). GTIL and the member firms are not a worldwide partnership. GTIL and each member firm is a separate legal entity. Services are delivered by the member firms. GTIL does not provide services to clients. GTIL and its member firms are not agents of, and do not obligate, one another and are not liable for one another’s acts or omissions.