operations research fta revenue estimating conference new hampshire september 2000 washington state...
TRANSCRIPT

Operations ResearchOperations Research
FTA Revenue Estimating ConferenceFTA Revenue Estimating Conference
New HampshireNew Hampshire
September 2000September 2000
Washington State Department of RevenueWashington State Department of Revenue
Mary WelshMary WelshAssistant DirectorAssistant DirectorResearch DivisionResearch Division

Operations Research defined:Operations Research defined:
• Requires quantitative analysisRequires quantitative analysis
• Results in more efficient operationsResults in more efficient operations
• Uses inside experts rather than outside consultants to solve Uses inside experts rather than outside consultants to solve problemsproblems
• Serves the division manager or management team as the Serves the division manager or management team as the clientclient

About the OR ProgramAbout the OR ProgramThenThen Governor’s Efficiency Commission, 1988Governor’s Efficiency Commission, 1988 Survey of Management Team, 1989Survey of Management Team, 1989 Began Fall 1989 with hiring of OR managerBegan Fall 1989 with hiring of OR manager 17 major projects in the first year17 major projects in the first year
NowNow 1,000 quick turn-around requests a year1,000 quick turn-around requests a year Quarter of our time on OR Quarter of our time on OR Most of our time spent on quality teamsMost of our time spent on quality teams

The tools:The tools:
• On-site data manager & statistician, computer support, On-site data manager & statistician, computer support, operations research manager, survey specialist operations research manager, survey specialist
• Programming capability (SAS) Programming capability (SAS)
• Large storage capability (LAN and mainframe)Large storage capability (LAN and mainframe)
• Pentium 800 workstations Pentium 800 workstations

The tools: (cont.)The tools: (cont.)
• Return detail reported by taxpayers with SIC or Return detail reported by taxpayers with SIC or NAIC coded accountsNAIC coded accounts
• Transaction detail including transaction type, receipt Transaction detail including transaction type, receipt date and money recordsdate and money records
• Audit and compliance detailAudit and compliance detail
• External data sources (IRS, ESD)External data sources (IRS, ESD)

Measuring noncomplianceMeasuring noncompliance
Raising the reporting thresholdRaising the reporting threshold
Redefining tax discoveryRedefining tax discovery
Developing survey expertiseDeveloping survey expertise

Measuring NoncomplianceMeasuring Noncompliance

-2% 0% 2% 4% 6% 8% 10%
Construction
Manufacturing
Transport/Utility
Wholesale
Retail
Financial/Real
Service 7000
Service 8000
Other
1996 1999
Noncompliance by IndustryNoncompliance by Industry
2.8% 3.4%

Noncompliance by Tax TypeNoncompliance by Tax Type
1996 Only
-5% 0% 5% 10% 15% 20%
Sales
B&O
Use
Public Utility
Hazardous Substance
Other
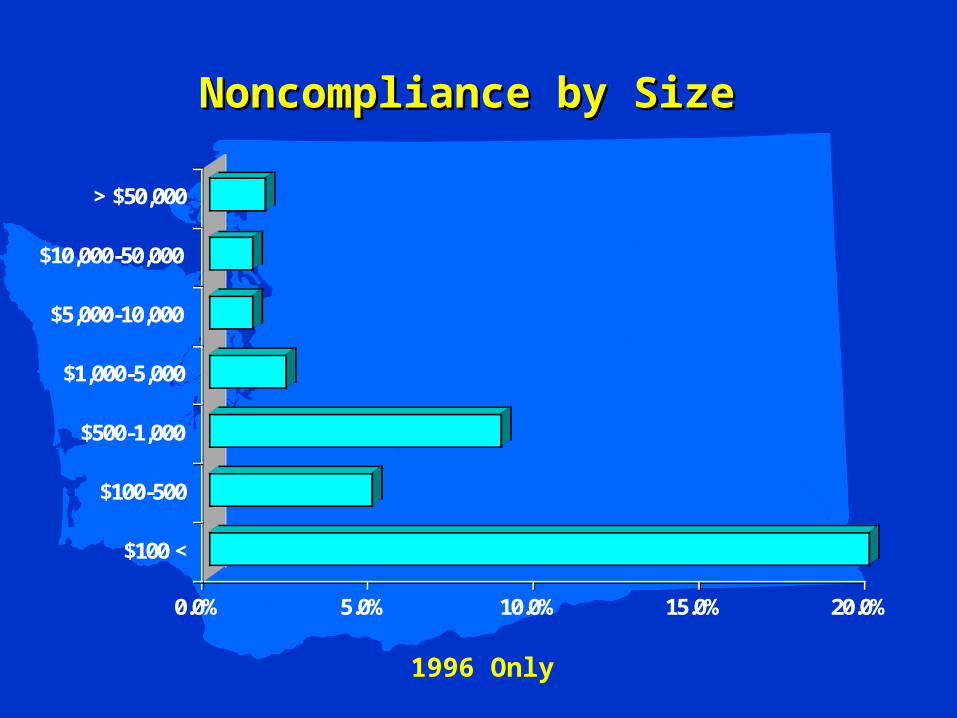
Noncompliance by SizeNoncompliance by Size
0.0% 5.0% 10.0% 15.0% 20.0%
$100 <
$100-500
$500-1,000
$1,000-5,000
$5,000-10,000
$10,000-50,000
> $50,000
1996 Only

Raising the Reporting ThresholdRaising the Reporting Threshold

Documents versus FTEsDocuments versus FTEs
0
500,000
1,000,000
1,500,000
2,000,000
1990 1991 1992 1993 1994 1995 1996 1997 1998
#Documents
0
200
400
600
800
1000
1200
#FTEs
#Documents #FTE
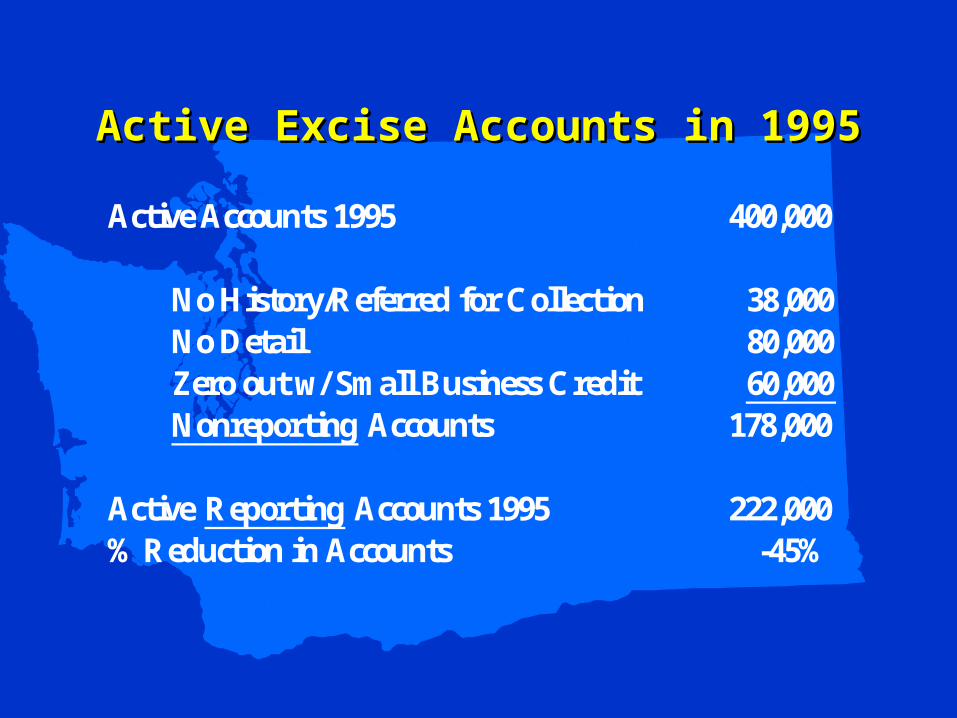
Active Excise Accounts in 1995Active Excise Accounts in 1995
Active Accounts 1995 400,000
No History/Referred for Collection 38,000No Detail 80,000Zero out w/ Small Business Credit 60,000Nonreporting Accounts 178,000
Active Reporting Accounts 1995 222,000%Reduction in Accounts -45%

Documents versus FTEsDocuments versus FTEs
0
500,000
1,000,000
1,500,000
2,000,000
199019911992199319941995199619971998199920002001E
#Documents
0
200
400
600
800
1000
1200
#FTEs
#Documents #FTE

Redefining Tax DiscoveryRedefining Tax Discovery


Scores & Baseline for Each StatisticScores & Baseline for Each Statistic
Score BaselineEmployees 10 105,059Personal Income 18 $3,915,005,947B&O Taxable Income 14 $4,050,897,809Aircraft 5 459Special Events 4 5TD Registrations 10 57Vessels 6 11,176Farms 4 3,598Selected SICs 15 4,650Population 20 269,100TD Dollars Recovered 12 $4,072,432
Baseline numbers are an average of Kennewick, Olympia, Wenatchee and Yakima District Offices.

Total Score Expected ActualOffice Baseline Ratio Dollars Dollars Difference
Bellingham 1.36 $5,557,001 $12,831,614 $7,274,613Everett 1.74 7,067,684 4,405,685 -2,661,999Kirkland 2.44 9,925,761 3,109,446 -6,816,316Spokane 2.03 8,286,694 10,071,231 1,784,537Bremerton 0.57 2,311,699 1,711,176 -600,524Port Angeles 0.67 2,741,149 0 -2,741,149Renton 2.13 8,689,312 10,935,542 2,246,230Seattle 4.10 16,705,343 14,994,480 -1,710,862Wenatchee 0.93 3,798,621 3,285,649 -512,971Aberdeen 0.26 1,041,253 0 -1,041,253Kennewick 1.09 4,429,655 6,214,191 1,784,536Olympia 1.19 4,833,295 4,343,474 -489,821Tacoma 2.05 8,332,127 4,269,543 -4,062,584Vancouver 1.69 6,885,317 10,347,810 3,462,494Yakima 0.79 3,228,156 2,446,413 -781,744
Total $93,833,067 $88,966,254 -$4,866,813
Comparison of Actual vs. ExpectedComparison of Actual vs. ExpectedTax Discovery DollarsTax Discovery Dollars

Developing Survey ExpertiseDeveloping Survey Expertise

Surveys we’ve worked on in the last yearSurveys we’ve worked on in the last year
• Audit Process SurveyAudit Process Survey
• Taxpayer Account Administration Training SurveyTaxpayer Account Administration Training Survey
• Exit Interview SurveyExit Interview Survey
• All the analysis and crosstabulations on the Employee All the analysis and crosstabulations on the Employee Attitude SurveyAttitude Survey

Audit Process SurveyAudit Process Survey
Audits now include an explanation of test periods and sampling techniques. Auditors are instructed to reach agreement with taxpayers on test periods.
For those audits using block sampling:
• 23%disagreed that test periods were discussed by the auditor
• 24% disagreed that test periods were agreed upon with the auditor
• 10%disagreed that sampling techniques were appropriate

Some ResultsSome Results
Quality Teams saved $500,000 and generated $4.6 million Quality Teams saved $500,000 and generated $4.6 million in revenues in three years.in revenues in three years.
Reduced the number of reporting accounts by 45%.Reduced the number of reporting accounts by 45%.
Profiling of health care professionals yielded $2.5 million Profiling of health care professionals yielded $2.5 million in use tax.in use tax.
2nd delinquency notice to smaller accounts reduced 2nd delinquency notice to smaller accounts reduced referrals by 16%.referrals by 16%.