operations report -...
TRANSCRIPT

FIRST QUARTER 2018
May 1, 2018
OPERATIONS
REPORT

FORWARD-LOOKING STATEMENTSThis presentation contains forward-looking statements within the meaning of the federal securities laws. Although these statements reflect the current
views, assumptions, and expectations of our management, the matters addressed herein involve certain assumptions, risks, and uncertainties that could
cause actual activities, performance, outcomes, and results to differ materially from those indicated herein. Therefore, you should not rely on any of
these forward-looking statements. All statements, other than statements of historical fact, included in this presentation constitute forward-looking
statements, including but not limited to statements identified by the words “forecast,” “may,” “believe,” “will,” “should,” “plan,” “predict,” “anticipate,”
“intend,” “estimate,” and “expect” and similar expressions. Such forward-looking statements include, but are not limited to, statements about
guidance, projected or forecasted financial and operating results, timing for completion of construction or expansion projects, future operational results
of our customers, results in certain basins, future rig count information, objectives, expectations, intentions, and other statements that are not historical
facts. Factors that could result in such differences or otherwise materially affect our financial condition, results of operations, or cash flows include,
without limitation, (a) the dependence on Devon for a substantial portion of the natural gas and crude that we gather, process, and transport, (b)
developments that materially and adversely affect Devon or other customers, (c) Devon’s ability to compete with us, (d) adverse developments in the
midstream business may reduce our ability to make distributions, (e) our vulnerability to having a significant portion of our operations concentrated in
the Barnett Shale, (f) continually competing for crude oil, condensate, natural gas, and NGL supplies and any decrease in the availability of such
commodities, (g) decreases in the volumes that we gather, process, fractionate, or transport, (h) construction risks in our major development projects,
(i) our ability to receive or renew required permits and other approvals, (j) changes in the availability and cost of capital, including as a result of a
change in our credit rating, (k) operating hazards, natural disasters, weather-related issues or delays, casualty losses, and other matters beyond our
control, (l) impairments to goodwill, long-lived assets and equity method investments, and (m) the effects of existing and future laws and governmental
regulations, including environmental and climate change requirements and other uncertainties. These and other applicable uncertainties, factors, and
risks are described more fully in EnLink Midstream Partners, LP’s and EnLink Midstream, LLC’s filings (collectively, “EnLink Midstream”) with the Securities
and Exchange Commission, including EnLink Midstream Partners, LP’s and EnLink Midstream, LLC’s Annual Reports on Form 10-K, Quarterly Reports on
Form 10-Q and Current Reports on Form 8-K. Neither EnLink Midstream Partners, LP nor EnLink Midstream, LLC assumes any obligation to update any
forward-looking statements.
The assumptions and estimates underlying the forecasted financial information included in the guidance information in this presentation are inherently
uncertain and, though considered reasonable by the EnLink Midstream management team as of the date of its preparation, are subject to a wide
variety of significant business, economic, and competitive risks and uncertainties that could cause actual results to differ materially from those
contained in the forecasted financial information. Accordingly, there can be no assurance that the forecasted results are indicative of EnLink
Midstream’s future performance or that actual results will not differ materially from those presented in the forecasted financial information. Inclusion of
the forecasted financial information in this presentation should not be regarded as a representation by any person that the results contained in the
forecasted financial information will be achieved.
EnLink Midstream 1Q 2018 Operations Report 2

NON-GAAP FINANCIAL INFORMATION &
OTHER DEFINITIONSThis presentation contains non generally accepted accounting principles (GAAP) financial measures that we refer to as gross operating margin, adjusted EBITDA, distributable cash flow available to commonunit holders (“distributable cash flow”), and EnLink Midstream, LLC (ENLC) cash available for distribution. Each of the foregoing measures is defined below. EnLink Midstream believes these measures are usefulto investors because they may provide users of this financial information with meaningful comparisons between current results and prior-reported results and a meaningful measure of EnLink Midstream's cashflow after satisfaction of the capital and related requirements of their respective operations. Adjusted EBITDA achievement is a primary metric used in the EnLink Midstream Partners, LP (“ENLK” or “thePartnership”) credit facility and short-term incentive program for compensating its employees.
Adjusted EBITDA, gross operating margin, distributable cash flow, and ENLC cash available for distribution, as defined below, are not measures of financial performance or liquidity under GAAP. They should notbe considered in isolation or as an indicator of EnLink Midstream’s performance. Furthermore, they should not be seen as a substitute for metrics prepared in accordance with GAAP. Reconciliations of thesemeasures to their most directly comparable GAAP measures for the periods that are presented in this presentation are included in the Appendix to this presentation. See ENLK’s and ENLC’s filings with theSecurities and Exchange Commission for more information.
Definitions of non-GAAP measures used in this presentation:1) Gross operating margin - revenue less cost of sales2) Adjusted EBITDA - net income (loss) plus interest expense, provision (benefit) for income taxes, depreciation and amortization expense, impairments, unit-based compensation, (gain) loss on non-cash
derivatives, (gain) loss on disposition of assets, (gain) loss on extinguishment of debt, successful acquisition transaction costs, accretion expense associated with asset retirement obligations, reimbursedemployee costs, non-cash rent and distributions from unconsolidated affiliate investments, less payments under onerous performance obligations, non-controlling interest, and (income) loss fromunconsolidated affiliate investments
3) Distributable cash flow (DCF) - adjusted EBITDA (as defined above), net to the Partnership, less interest expense (excluding amortization of the EnLink Oklahoma Gas Processing, LP (together with itssubsidiaries, “EnLink Oklahoma T.O.”) acquisition installment payable discount), litigation settlement adjustment, interest rate swaps, current income taxes and other non-distributable cash flows, accruedcash distributions on Series B Preferred Units and Series C Preferred Units paid or expected to be paid, and maintenance capital expenditures, excluding maintenance capital expenditures that werecontributed by other entities and relate to the non-controlling interest of our consolidated entities
4) ENLC’s cash available for distribution (CAD) - net income (loss) of ENLC less the net income (loss) attributable to ENLK, which is consolidated into ENLC’s net income (loss), plus ENLC’s (i) share ofdistributions from ENLK, (ii) share of EnLink Oklahoma T.O. non-cash expenses, (iii) deferred income tax (benefit) expense, (iv) corporate goodwill impairment, if any, less ENLC’s interest share inmaintenance capital expenditures of EnLink Oklahoma T.O., less third-party non-controlling interest share of net income (loss) from consolidated affiliates, and other non-cash items not included in CAD
Other definitions and explanations of terms used in this presentation:1) ENLK’s Adjusted EBITDA is net to ENLK after non-controlling interest2) ENLK’s Distribution Coverage is defined as ENLK’s Distributable Cash Flow divided by ENLK’s total distributions declared3) ENLK’s Debt to Adjusted EBITDA, leverage ratio, is defined by the ENLK credit facility4) ENLC’s Growth Capital Expenditures reflect ENLC’s share of EnLink Oklahoma T.O. growth capital expenditures5) ENLC’s Distribution Coverage is defined as ENLC’s Cash Available for Distribution divided by ENLC’s total distributions declared6) Growth capital expenditures (GCE) generally include capital expenditures made for acquisitions or capital improvements that we expect will increase our asset base, operating income or operating
capacity over the long-term7) Maintenance capital expenditures (MCX) include capital expenditures made to replace partially or fully depreciated assets in order to maintain the existing operating capacity of the assets and to
extend their useful lives8) Segment profit (loss) is defined as operating income (loss) plus general and administrative expenses, depreciation and amortization, (gain) loss on disposition of assets, impairments and (gain) loss on
litigation settlement. Segment profit (loss) includes non-cash compensation expenses reflected in operating expenses. See “Item 8. Financial Statements and Supplementary Data – Note 15 – SegmentInformation” in ENLK’s Annual Report on Form 10-K for the year ended December 31, 2017, and, when available, “Item 1. Financial Statements and Supplementary Data – Note 11—Segment Information”in ENLK’s Quarterly Report on Form 10-Q for the three months ended March 31, 2018, for further information about segment profit (loss)
9) Minimum volume commitments (MVC) are contractual obligations for customers to ship and/or process a minimum volume of production on our systems over an agreed time period, and if the customerfails to meet the minimum volume, the customer is obligated to pay a contractually-determined fee. See “Item 7. Management’s Discussion and Analysis of Financial Condition and Results of Operations– Results of Operations” in ENLK’s Annual Report on Form 10-K for the year ended December 31, 2017, and, when available, “Item 7. Management’s Discussion and Analysis of Financial Condition andResults of Operations – Results of Operations” in ENLK’s Quarterly Report on Form 10-Q for the three months ended March 31, 2018, for further information
10) Gathering is defined as a pipeline that transports hydrocarbons from a production facility to a transmission line or processing facility. Transportation is defined to include pipelines connected to gatheringlines or a facility. Gathering and transportation are referred to as “G&T”
11) Gathering and processing are referred to as “G&P”
EnLink Midstream 1Q 2018 Operations Report 3

ENLINK MIDSTREAM: 1Q 2018 HIGHLIGHTS
STRONG FIRST QUARTER RESULTSDelivered Oklahoma segment profit growth of >10% sequentially --
Built on 4Q17 momentum and performance
POSITIVE OUTLOOK IN LINE WITH EXPECTATIONS
On track with robust organic growth -- Reaffirming full-year 2018 guidance
EXECUTING ON OUR RIGHT PLAN
7 growth strategies on track -- Delivering Oklahoma volume growth --
Barnett shale redevelopment underway --
Crude platform continues buildout -- Growing NGL services
DELIVERING ON EXPECTATIONS
EnLink Midstream 1Q 2018 Operations Report 4

RIGHT
PLAN
EXECUTION
EXCELLENCERIGHT
PARTNERS
RIGHT
PLACES
DELIVERING ON EXPECTATIONS:
First Quarter 2018

ENLK: BUSINESS EXECUTION DRIVES RESULTSSTRONG FIRST QUARTER AND POSITIVE OUTLOOK
EnLink Midstream 1Q 2018 Operations Report
($MM unless otherwise noted)1Q18 Results 2018 ENLK Guidance Reaffirmed
Net Income $65.1 $255 – $315
Adjusted EBITDA $243.7 $950 – $1,020
% Fee-based Gross Operating Margin ~95% ~90%
Distributable Cash Flow (DCF) $171.2 $630 – $680
Distribution Coverage 1.12x 1.00x – 1.10x
Debt / Adjusted EBITDA 3.85x 4.20x – 3.70x
Note: Commodity price assumptions (average): WTI $60.00/bbl, Henry Hub $3.00/MMBtu
Further strengthened financial position:
Generated adjusted EBITDA growth of ~17% and DCF growth of ~12% 1Q18 over 1Q17
Strong build in distribution coverage to 1.12x; ongoing commitment to Investment Grade rating
Forecast continued momentum into 2019 based on expansions underway, expecting another sequential year of attractive
adjusted EBITDA growth in 2019 of 5-10% over mid-point 2018
1Q18 HIGHLIGHTS
6

GROWTH IN OKLAHOMA CONTINUES TO DRIVE RESULTS
EnLink Midstream 1Q 2018 Operations Report 7Note: Commodity price assumptions (average): WTI $60.00/bbl, Henry Hub $3.00/MMBtu
Successfully self-funded ~50% of 1Q18 growth capital expenditures with excess CAD
Generated CAD growth of ~11% 1Q18 over 1Q17, further improved distribution coverage growth to 1.18x
Declared distribution growth of ~3.2% 1Q18 over 1Q17, demonstrating continued commitment to 5% as-declared distribution
growth, 2018 over 2017
1Q18 HIGHLIGHTS
($MM unless otherwise noted)1Q18 Results 2018 ENLC Guidance Reaffirmed
Net Income $57.1 $233 – $291
Cash Available for Distribution (CAD) $56.6 $230 – $240
Distribution Coverage 1.18x 1.16x – 1.22x
CAD from 16% EOGP Ownership $8.9 $40 – $50
Cash Income Taxes $0.1 ~$2
ENLC: FURTHER GROWTH IN DISTRIBUTION & COVERAGE

3
LOUISIANA
1Q18: RIGHT PLAN IN ACTIONSYSTEM GROWTH DRIVEN BY OUR STRATEGIES
EnLink Midstream 1Q 2018 Operations Report
DELAWARE BASIN
>110% GROWTHIN G&P VOLUMES QOQ1,2
LOBO 370 MMCF/DEXPECTED PROCESSING CAPACITY AROUND 2H18
Achieve scale
BARNETT SHALE
Proactive participation in redevelopment
DOWDUPONT / DEVON JVEXPECTS TO DRILL ~20 NEW WELLS IN 2018
~50 REFRACSEXPECTED IN 2018 BY PRODUCER CUSTOMERS
GULF COAST NGL
FULL CAPACITY UTILIZATIONAVERAGE CAJUN SIBON PIPELINE DURING 1Q18
Drive growth
NGL FRAC DECISIONEXPECTED TO BE ANNOUNCED IN 2018
OKLAHOMA
BLACK COYOTE PIPELINECRUDE GATHERING FLOWING VOLUMES APRIL ‘18
~65% GROWTHIN GAS PROCESSING VOLUMES QOQ1,2
Maximize strategic position
REDBUD PIPELINENEW CRUDE GATHERING PROJECT ANNOUNCED
Repurpose redundant infrastructure
OPTIMIZE ASSET VALUECAPITAL-EFFICIENT OPPORTUNITIES FOR EXISTING ASSETS IDENTIFIED
1 Quarter-over-quarter (QOQ) is defined as 1Q18 average over 1Q17 average. 2 Includes volumes associated with non-
controlling interests.
LOUISIANA GAS
Capture incremental opportunities
STRONG ASSET POSITIONDRIVES OPPORTUNITIES TO ADD LONG-TERM, HIGH-RETURN GROWTH WITH LIMITED CAPITAL
RECORD THROUGHPUT>2.2 BCF/D GAS G&T IN 1Q18
MIDLAND BASIN
>12% GROWTHIN GAS G&P VOLUME QOQ1
Increase asset utilization
>300% GROWTHIN CRUDE GATHERING VOLUME QOQ1
8
4
3
2
5 7
63
2
1
7
4 5
6
1

2018 GROWTH CAPITAL EXPENDITURES (GCE)CAPITAL SPEND REMAINS FOCUSED ON GROWTH AREAS
9
Oklahoma Texas LouisianaCrude &
CondensateCorporate
Total Growth
Capital
Maintenance
Capex
FY 2018 Revised $340 – $420 $210 – $250 $65 – $85 $80 – $90 $5 – $15 $700 – $860 $55 – $60
1Q18 Actual $97 $62 $6 $9 $1 $175 $6
Remainder of 2018 $243 - 323 $148 – 188 $59 – 79 $71 – 81 $4 – 14 $525 – 685 $49 - 54
2018 GCE BY SEGMENT – UPDATED FOR NEW OKLAHOMA CRUDE GATHERING PROJECT “REDBUD”
Note: Growth Capital Expenditures include capitalized interest. 1 Reflects newly announced $40MM Redbud project
and reallocation between Segments. EnLink Midstream 1Q 2018 Operations Report
700 – 860
630 - 770
580 - 71070 – 90
50 – 60
Growth Capital
Expenditures
JV Partners
Contributions
EnLink Funded
Consolidated
GCE
ENLC's Share of
EnLink
Oklahoma T.O.
GCE
ENLK Funded
GCE Guidance
175
150138
25
12
Growth Capital
Expenditures
JV Partners
Contributions
EnLink Funded
Consolidated
GCE
ENLC's Share of
EnLink
Oklahoma T.O.
GCE
ENLK Funded
GCE
1Q18 GCE ($MM)2018 GCE OUTLOOK1 ($MM)
Updated for Redbud, jointly funded ENLK /
ENLC project

PROJECT-LED EXPANSION ACROSS CORE AREASDIVERSIFIED PORTFOLIO OF ATTRACTIVE PROJECTS UNDER DEVELOPMENT
1 Delaware assets are 49.9% owned by NGP.
NGL BOLT-ON PROJECTS – enhancing value chain opportunities
o $35MM – $50MM expected 2018 capital spend
LA GAS – increasing commercial gas opportunities
o $10MM – $20MM expected 2018 capital spend
LOUISIANA
Gas G&P
DELAWARE GAS – increasing G&P system volumes
o $70MM – $90MM expected 2018 ENLK capital spend
1. LOBO III – 200 MMcf/d gas processing facility, 2H18
expected operational
2. Well connects & field compression
MIDLAND – increasing system volumes
o Gas G&P $45MM – $55MM expected 2018 well connect & field
compression capital
o Crude & Condensate Chickadee platform – bolt on projects $10MM –
$15MM EnLink 2018 capital spend
PERMIAN BASIN1
Gas G&P
THUNDERBIRD – 200 MMcf/d gas processing facility
o $100MM – $120MM EnLink expected 2018 capital
spend
o 1Q19 expected operational
CENTRAL OKLAHOMA – increasing G&P system volumes
o $160MM – $200MM expected 2018 well connect & field
compression EnLink capital
Crude & Condensate
BLACK COYOTE – initial crude gathering
o $25MM – $35MM EnLink 2018 capital spend
o Operational in April 2018
REDBUD – newly announced crude gathering platform
expansion
o $40MM EnLink expected 2018 capital spend
o 2H18 expected operational
OKLAHOMA
EnLink Midstream 1Q 2018 Operations Report 10

DRILLING RIG ACTIVITY SUBSTANTIATES OUR GROWTH BASIN STRATEGY
~ 32%
Drilling rig activity remains positively
correlated to strength and stability in
crude prices, supporting constructive
upstream and midstream fundamentals
EnLink’s near-term growth is driven by
attractive producer activity in the STACK
play, and Midland and Delaware basins,
where drilling rigs continue to outpace
U.S. macro trends
EnLink’s producer customers have
maintained active drilling programs on
our asset footprint, continuing to
outpace both U.S. and Growth Basin rig
growth
8571,021
Apr '17 Apr '18
467586
Apr '17 Apr '18
5166
Apr '17 Apr '18
U.S. RIG COUNT1 RIGS IN GROWTH BASINS1 RIGS ON OUR SYSTEMS1
1 April 2017 rig count according to May 2017 EnLink Operations Report. April 2018 rig count is as of April 27, 2018. All rig
data is according to RigData. Rig count includes rigs on assets with partial ownership. Growth Basins include key
counties in Central Oklahoma, and the Midland and Delaware Basins.
CONSISTENT E&P ACTIVITY ON OUR FOOTPRINT
~ 25%~ 29%
~ 19%
EnLink Midstream 1Q 2018 Operations Report 11
RIGHT
PLACES
RIGHT
PARTNERS

AVERAGE DRILLING RIG TRENDS DEMONSTRATE STRONG BASIN ACTIVITY
12-MONTH RIG TRENDS SIGNIFY VOLUME GROWTH
EnLink Midstream 1Q 2018 Operations Report 12
With 58 average active rigs operating on our footprint, EnLink realized attractive
processing growth in Growth areas
GROWTH BASIN VOLUME GROWTH
1 April 2017 rig count according to May 2017 EnLink Operations Report. April 2018 rig count is as of April 27, 2018.
All rig data is according to RigData. Rig count includes rigs on assets with partial ownership. Growth Basins include
key counties in Central Oklahoma, and the Midland and Delaware Basins.
51 53 60 61 66
Apr 2017 May - Aug
2017 Average
Sep - Dec
2017 Average
Jan - Apr
2018 Average
Apr 2018
On average during the past 12 months, 58 drilling rigs were active on EnLink’s footprint
58
RIGS ON OUR SYSTEMS1
OklahomaPermian
+30%Processing Volumes
1Q18 over 1Q17
+64% Processing Volumes
1Q18 over 1Q17

RIGHT
PLAN
EXECUTION
EXCELLENCERIGHT
PARTNERS
RIGHT
PLACES
RIGHT PLAN:
FOCUS ON CORE ASSETS

OKLAHOMA: SIZE, SCALE, & DIVERSIFICATION
COMPELLING STACK DEVELOPMENT EVIDENCES RIGHT PLACES, RIGHT PARTNERS
EnLink Midstream 1Q 2018 Operations Report 14
1. GAS - Expect to increase our processing capacity to
1.2 Bcf/d by 1Q19
16 producer customers with active drilling programs
year-to-date 2018
~80% segment profit growth 1Q18 over 1Q17
2. NGLs - Connected ~25 Mbbl/d equity volumes to
EnLink’s Gulf Coast value chain in 1Q18
Strong growth just one year after commencing
Chisholm II operations
Long-term basin positive outlook -
>600,000 dedicated acres represent significant growth opportunity for EnLink
Partnering with strong customers with decades of drilling inventory
G&P: A DEMONSTRATED CORE COMPETENCY
RIGHT PLAN: MAXIMIZE STRATEGIC POSITION
Note: Rig count according to RigData, as of April 27, 2018, and includes rigs on assets with partial ownership.
19RIGS ON DEDICATEDGAS G&P ACREAGE
RIGHT
PLACES
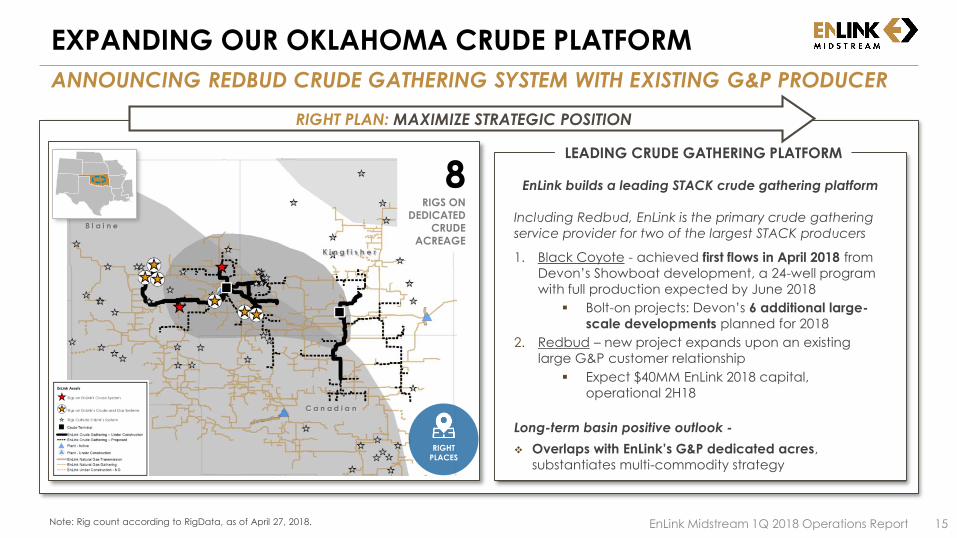
EXPANDING OUR OKLAHOMA CRUDE PLATFORM
ANNOUNCING REDBUD CRUDE GATHERING SYSTEM WITH EXISTING G&P PRODUCER
EnLink Midstream 1Q 2018 Operations Report 15
EnLink builds a leading STACK crude gathering platform
Including Redbud, EnLink is the primary crude gathering
service provider for two of the largest STACK producers
1. Black Coyote - achieved first flows in April 2018 from
Devon’s Showboat development, a 24-well program
with full production expected by June 2018
Bolt-on projects: Devon’s 6 additional large-
scale developments planned for 2018
2. Redbud – new project expands upon an existing
large G&P customer relationship
Expect $40MM EnLink 2018 capital,
operational 2H18
Long-term basin positive outlook -
Overlaps with EnLink’s G&P dedicated acres,
substantiates multi-commodity strategy
LEADING CRUDE GATHERING PLATFORM
RIGHT PLAN: MAXIMIZE STRATEGIC POSITION
Note: Rig count according to RigData, as of April 27, 2018.
8RIGS ON
DEDICATEDCRUDE
ACREAGE
RIGHT
PLACES

Devon's 24-well Showboat development achieved 1st production in April 2018 and is currently 40 days ahead of plan
Expect staggered well tie-ins over the next two months and full production expected by June 2018
1Q18 ENLINK GROWTH DRIVERS
Devon remains committed to its multiple, large scale,
multi-zone development projects, all of which,
SHOWBOAT HORSEFLY
BERNHARDT GEIS ML BLOCK
KRAKEN CASCADE
are dedicated to EnLink’s gas system
will be connected to Black Coyote
These projects are expected to add step-change
volume growth in EnLink’s systems in 2018 and beyond
DEVON DEVELOPMENT PROJECT TIMELINE
STACK DEVELOPMENT UPDATE: DEVON ENERGY
ENLINK CONNECTS TO OPERATIONAL MOMENTUM & SERVICES SIGNIFICANT GROWTH
EnLink Midstream 1Q 2018 Operations Report 16Note: Details above sourced from Devon Energy Corp. Please see the Investors’ section of the Devon website for
further details.

MIDLAND BASIN: FAVORABLE POSITION
QUALITY PRODUCER DEDICATIONS DRIVE GAS & CRUDE VOLUME RAMP
EnLink Midstream 1Q 2018 Operations Report 17
RIGHT PLAN: INCREASE ASSET UTILIZATION
1. GAS:
Ongoing consolidation between Midland based E&P
customers enhances strength of our gas footprint
Multiple residue gas options with sufficient pipeline
capacity to provide gas flow assurance
2. NGLS:
Connected ~35 Mbbl/d equity volumes to EnLink’s Gulf
Coast value chain in 1Q18
3. CRUDE:
Chickadee system volumes grew >10% 1Q18 over 4Q17
Achieved significant Chickadee system growth during 1st
year of start-up operations
Long-term basin positive outlook -
~440,000 dedicated acres represent significant growth
opportunity for EnLink
E&P partners increasingly have the scale & contiguous
acreage positions to maximize shale drilling economics
EXECUTING A 3-PRONGED COMMODITY STRATEGY GAS & CRUDE GATHERING IN THE CORE
17RIGS ON
DEDICATED
GAS G&P
ACREAGE
Note: Rig count according to RigData, as of April 27, 2018.
4RIGS ON
DEDICATED
CRUDE
ACREAGE
RIGHT
PLACES

DELAWARE BASIN: EXPANDING OUR G&P PLATFORMSTRONG VOLUME MOMENTUM EXITING 1Q18
EnLink Midstream 1Q 2018 Operations Report 18
1. Strong exit volumes at quarter-end
2. Volume ramp expectations continue to support Lobo complex expansion
3. EnLink’s gathering lines and processing plants are
located in core Northern Delaware basin
Added, WhiteWater pipeline, a 3rd gas takeaway
interconnect providing enhanced gas flow
assurance to producer customers
Organic growth opportunities on our existing Texas
and New Mexico footprint
Long-term basin positive outlook -
Strength of producer customers with active drilling
programs instills confidence in volume expectations
and system expansion
G&P: A DEMONSTRATED CORE COMPETENCY
RIGHT PLAN: ACHIEVE SCALE
18RIGS
DRILLING
ENLINK’S
CAPTURE
AREA
Note: Rig count according to RigData, as of April 27, 2018, and includes rigs on assets with partial ownership. Delaware
assets are 49.9% owned by Natural Gas Partners (NGP).
RIGHT
PLACES
4RIGS ON
DEDICATED
ACREAGE

GULF COAST NGLS: CAPTURING THE VALUE CHAIN
LINKING OKLAHOMA & PERMIAN NGL VOLUMES TO GULF COAST DEMAND
EnLink Midstream 1Q 2018 Operations Report 19
RIGHT PLAN: DRIVE GROWTH IN GULF COAST NGL PLATFORM
1. EnLink G&P growth and greater ethane recovery increased
volumes on our Cajun Sibon pipeline and NGL fractionation system
Cajun Sibon pipeline averaged full capacity in 1Q18
Realized >20% increase in average fractionation volumes 1Q18
over 1Q17
2. Extend the strategic advantage of Central Oklahoma and Permian
equity volumes
> 40% of Cajun Sibon volumes are sourced from EnLink’s Permian
and Central Oklahoma plants
> 45% of fractionation volumes are sourced from EnLink’s Permian,
Central Oklahoma, and Louisiana plants
3. Commercial service offerings have grown via Ascension Pipeline;
increased contracted storage volumes; new chemical logistic
services; truck and rail activity; and increasing exports
Long-term basin positive outlook -
Expect to announce fractionation decision in 2018 as demand for
additional capacity accelerates
EXPECT TO AVERAGE FULL CAPACITY IN 2018ACCESS TO KEY DEMAND MARKETS
RIGHT
PLACES

LOUISIANA GAS: ROBUST DEMAND GROWTH FORECAST
OPPORTUNITY TO SUPPLY MULTIPLE, KEY, DEMAND DRIVEN MARKET OUTLETS
EnLink Midstream 1Q 2018 Operations Report 20
1. 1Q18 average gas G&T record-setting throughput of ~2.2 Bcf/d 1Q18 marks the 8th consecutive quarter of average
G&T volume growth
Achieved peak day throughput of ~2.6 Bcf/d in
1Q18
G&T volumes increased by ~6% 1Q18 over 4Q17,
~15% 1Q18 over 1Q17
Long-term positive outlook -
Expect demand driven growth over next 3-5 years
Engaged in the evolving marketplace, developing unique service solutions via capital-efficient bolt-on projects to expand delivery reach; increase supply
options; and capture increasing market share of LNG
and Mississippi River market growth
LONG-TERM POSITIVE OUTLOOK
LAKE CHARLES &
LNG DEMAND
MARKETS
RIGHT PLAN: CAPTURE SIGNIFICANT INCREMENTAL GAS OPPORTUNITIES
RIGHT
PLACES
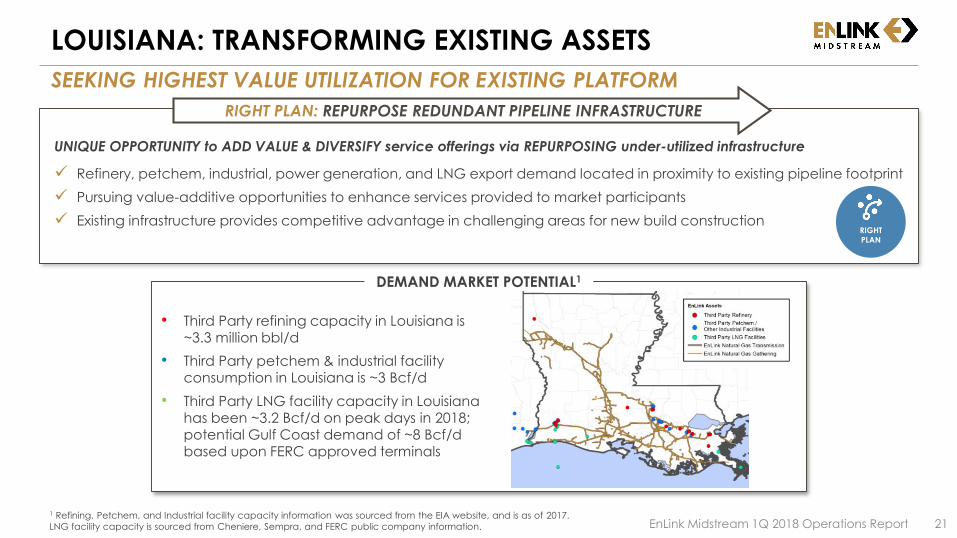
• Third Party refining capacity in Louisiana is ~3.3 million bbl/d
• Third Party petchem & industrial facility consumption in Louisiana is ~3 Bcf/d
• Third Party LNG facility capacity in Louisiana has been ~3.2 Bcf/d on peak days in 2018; potential Gulf Coast demand of ~8 Bcf/d based upon FERC approved terminals
DEMAND MARKET POTENTIAL1
LOUISIANA: TRANSFORMING EXISTING ASSETS
SEEKING HIGHEST VALUE UTILIZATION FOR EXISTING PLATFORM
EnLink Midstream 1Q 2018 Operations Report 21
UNIQUE OPPORTUNITY to ADD VALUE & DIVERSIFY service offerings via REPURPOSING under-utilized infrastructure
Refinery, petchem, industrial, power generation, and LNG export demand located in proximity to existing pipeline footprint
Pursuing value-additive opportunities to enhance services provided to market participants
Existing infrastructure provides competitive advantage in challenging areas for new build construction
RIGHT PLAN: REPURPOSE REDUNDANT PIPELINE INFRASTRUCTURE
1 Refining, Petchem, and Industrial facility capacity information was sourced from the EIA website, and is as of 2017.
LNG facility capacity is sourced from Cheniere, Sempra, and FERC public company information.
RIGHT
PLAN

BARNETT SHALE: REDEVELOPMENT PROGRESSES
REINVIGORATED ACTIVITY & NEW PARTNERS SUPPORT ENLINK VOLUMES
EnLink Midstream 1Q 2018 Operations Report 22
RIGHT PLAN: PROACTIVE PARTICIPATION IN REDEVELOPMENT
Note: Details above sourced from Devon Energy. Please see the Investors’ section of the Devon website for further
details.
Long-term basin positive outlook -
1. DowDupont and Devon have announced a JV to drill up to 116 new wells over a 5 year period ~20 wells expected to be drilled in 2018
2. Devon expects to deliver flat volumes 2018 over 2017, on its retained asset in North Texas Increasing its 2018 Barnett E&P capital commitment from
$50MM to $80MM, targeting ~50 horizontal refracs
3. Upon Devon’s closing of the sale of its Johnson County acreage, expect new, privately-funded, focused
producer customer Existing commercial relationship with the new producer
Encouraged by anticipated focus on production optimization
of existing wells, refrac candidates, and well drilling plans
Largest producer customers are accelerating activity levels Realizing new producing wells and incremental horizontal refracs
AVENUES TO STABILIZING VOLUME DECLINEMULTIPLE ACTIVE CUSTOMERS
RIGHT
PLAN

RIGHT
PLAN
EXECUTION
EXCELLENCERIGHT
PARTNERS
RIGHT
PLACES
APPENDIX

Maintain desirable position in key supply basins and critical
demand regions; portfolio of supply-push and demand-pull
assets provides diversification, stability, and value-chain
margin opportunities
SUSTAINABILITY AND GROWTH DRIVERSCORE ASSET INTEGRATION ACROSS PRODUCTS, BASINS & SERVICES
EnLink Midstream 1Q 2018 Operations Report 24
Continue developing a suite of integrated midstream solutions across commodities, basins and services; proactively growing scale and increasing utilization
Further organically develop and extend our strategic asset portfolio in top U.S. supply basins and demand regions
Focused execution on organic growth projects in our growing supply and demand areas
7FRACTIONATORS
~260MBBL/D FRACTIONATION CAPACITY
20PROCESSING FACILITIES
~4.8BCF/D PROCESSING CAPACITY
~11K MILES OF PIPELINE
~1,500EMPLOYEES OPERATING ASSETS IN 7 STATES
Note: Assets above include those with partial ownership.
RIGHT PLACES RIGHT PLAN

QUARTERLY VOLUMES & SEGMENT PROFIT
EnLink Midstream 1Q 2018 Operations Report 25Note: Includes profit and volumes associated with non-controlling interests.
Three Months Ended
In $ millions unless otherwise notedMar. 31,
2017
Jun. 30,
2017
Sep. 30,
2017Dec. 31,
2017Mar. 31,
2018
TexasSegment Profit $101.4 $105.6 $107.6 $106.3 $104.4Gross Operating Margin $145.3 $148.5 $148.7 $151.1 $148.6Gathering and Transportation (MMBtu/d) 2,274,100 2,272,100 2,251,700 2,254,100 2,190,800Processing (MMBtu/d) 1,162,100 1,179,700 1,194,300 1,201,100 1,194,100LouisianaSegment Profit $46.7 $45.4 $51.0 $69.1 $61.8
Gross Operating Margin $72.1 $70.0 $75.8 $95.6 $87.4Gathering and Transportation (MMBtu/d) 1,931,300 1,939,500 2,009,300 2,101,200 2,222,900Processing (MMBtu/d) 467,800 446,500 443,400 455,700 441,900
NGL Fractionation (bbls/d) 124,900 138,600 138,400 147,600 151,000OklahomaSegment Profit $53.4 $68.8 $79.1 $86.0 $95.4
Gross Operating Margin $67.5 $83.5 $96.2 $104.7 $116.1Gathering and Transportation (MMBtu/d) 705,500 765,500 889,200 953,600 1,047,900Processing (MMBtu/d) 652,800 733,100 872,200 978,700 1,069,400Crude & CondensateSegment Profit $11.2 $7.2 $10.4 $14.4 $8.9
Gross Operating Margin $31.9 $27.6 $29.5 $34.3 $27.6Crude Oil Handling (bbls/d) 110,400 107,600 95,700 119,200 127,700Brine Disposal (bbls/d) 4,300 4,800 4,800 2,900 2,800

341 362 408 427 442
821 818 786 774 752
1,162 1,180 1,194 1,201 1,194
1Q17 2Q17 3Q17 4Q17 1Q18
LOUISIANA GAS LIQUIDS
QUARTERLY VOLUMES
EnLink Midstream 1Q 2018 Operations Report 26
TEXAS
GATHERING & TRANSMISSION (1,000 MMBtu/d)
PROCESSING(1,000 MMBtu/d)
GATHERING & TRANSMISSION(1,000 MMBtu/d)
CRUDE & CONDENSATE(1,000 bbls/d)
North TXPermian North TXPermian
PROCESSING(1,000 MMBtu/d)
GATHERING & TRANSMISSION(1,000 MMBtu/d)
PROCESSING(1,000 MMBtu/d)
706 766889 954
1,048
1Q17 2Q17 3Q17 4Q17 1Q18
653733
872979
1,069
1Q17 2Q17 3Q17 4Q17 1Q18
313 341 385 405 424
1,961 1,931 1,867 1,849 1,767
2,274 2,272 2,252 2,254 2,191
1Q17 2Q17 3Q17 4Q17 1Q18
110 10896
119 128
1Q17 2Q17 3Q17 4Q17 1Q18
LOUISIANA NGL FRACTIONATION (1,000 bbls/d)
1,931 1,940 2,009 2,1012,223
1Q17 2Q17 3Q17 4Q17 1Q18
125139 138 148 151
1Q17 2Q17 3Q17 4Q17 1Q18
468 447 443 456 442
1Q17 2Q17 3Q17 4Q17 1Q18
Note: Includes volumes associated with non-controlling interests.
OKLAHOMA

CRUDE & CONDENSATELOUISIANA
SEGMENT PROFIT (IN $MM)
EnLink Midstream 1Q 2018 Operations Report 27
TEXAS
53.4
68.879.1
86.095.4
1Q17 2Q17 3Q17 4Q17 1Q18
13.2 14.7 17.8 16.5 15.7
88.2 90.9 89.8 89.8 88.7
101.4 105.6 107.6 106.3 104.4
1Q17 2Q17 3Q17 4Q17 1Q18
27.6 31.3 33.253.5 48.3
19.1 14.1 17.8
15.613.546.7 45.4 51.0
69.161.8
1Q17 2Q17 3Q17 4Q17 1Q18
11.2
7.2
10.4
14.4
8.9
1Q17 2Q17 3Q17 4Q17 1Q18
North TXPermian
NGLGas
OKLAHOMA
Note: Includes profit associated with non-controlling interests.
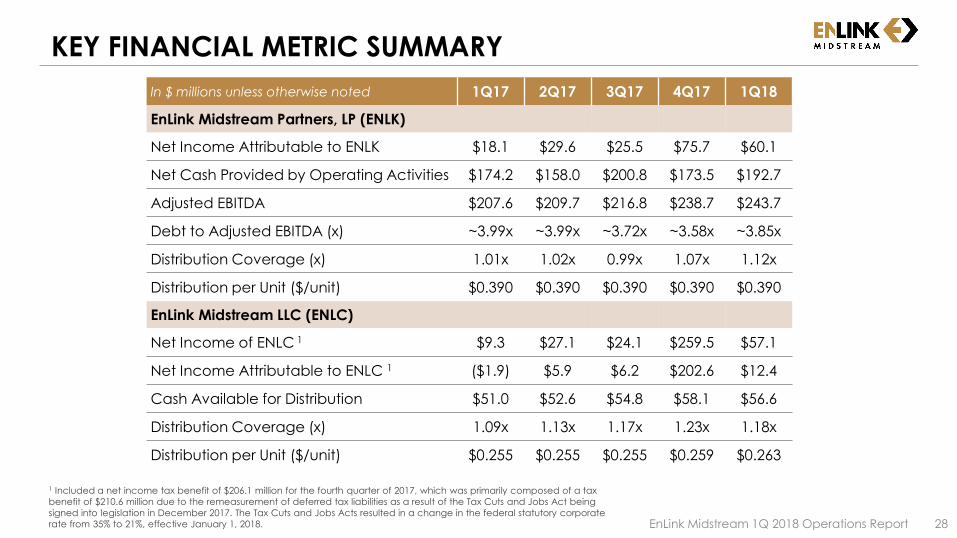
KEY FINANCIAL METRIC SUMMARY
EnLink Midstream 1Q 2018 Operations Report 28
In $ millions unless otherwise noted 1Q17 2Q17 3Q17 4Q17 1Q18
EnLink Midstream Partners, LP (ENLK)
Net Income Attributable to ENLK $18.1 $29.6 $25.5 $75.7 $60.1
Net Cash Provided by Operating Activities $174.2 $158.0 $200.8 $173.5 $192.7
Adjusted EBITDA $207.6 $209.7 $216.8 $238.7 $243.7
Debt to Adjusted EBITDA (x) ~3.99x ~3.99x ~3.72x ~3.58x ~3.85x
Distribution Coverage (x) 1.01x 1.02x 0.99x 1.07x 1.12x
Distribution per Unit ($/unit) $0.390 $0.390 $0.390 $0.390 $0.390
EnLink Midstream LLC (ENLC)
Net Income of ENLC 1 $9.3 $27.1 $24.1 $259.5 $57.1
Net Income Attributable to ENLC 1 ($1.9) $5.9 $6.2 $202.6 $12.4
Cash Available for Distribution $51.0 $52.6 $54.8 $58.1 $56.6
Distribution Coverage (x) 1.09x 1.13x 1.17x 1.23x 1.18x
Distribution per Unit ($/unit) $0.255 $0.255 $0.255 $0.259 $0.263
1 Included a net income tax benefit of $206.1 million for the fourth quarter of 2017, which was primarily composed of a tax
benefit of $210.6 million due to the remeasurement of deferred tax liabilities as a result of the Tax Cuts and Jobs Act being
signed into legislation in December 2017. The Tax Cuts and Jobs Acts resulted in a change in the federal statutory corporate
rate from 35% to 21%, effective January 1, 2018.

ENLC owns 100% of IDRs
ENLINK ORGANIZATIONAL CHART1
EnLink Midstream 1Q 2018 Operations Report 29
1 Information on this slide is as of March 31, 2018. 2 Represents TPG Capital and funds managed by the Merchant Banking
Division of Goldman Sachs. 3 Series C Preferred Units are perpetual preferred units that are not convertible into ENLK common
units, and therefore, are not factored into the percent ownership calculations for the limited partner and general partner
ownership percentages presented on this slide. 4 The limited partner and general partner ownership percentages presented
on this slide factor in the general partner interest, ENLK common units and Series B Preferred Units, which are convertible into
ENLK common units on a one-for-one basis. 5 Represents current Incentive Distribution Rights (IDR) split level plus GP
ownership.
IDR Splits
Dist. / Q Split Level5
< $0.2500 0.4% / 99.6%
< $0.3125 13.4% / 86.6%
< $0.3750 23.4% / 76.6%
> $0.3750 48.4% / 51.6%
Devon Energy Corp.
NYSE: DVN(BBB+/BBB/Ba1)
PublicUnitholders
EnLink Midstream, LLCGeneral Partner
NYSE: ENLC
~ 64% ~ 36%
~ 84%
~ 0.4% GP
~ 22% LP
~ 23% LP~ 41% LP
~ 14% LP
~ 16%
EnLink OklahomaGas Processing, LP
TPG Capital &Goldman Sachs2
Series B Preferred Equity Owners
EnLink Midstream Partners, LP4
Master Limited PartnershipNYSE: ENLK
(BBB-/BBB-/Ba1)
Public UnitholdersSeries C Preferred Equity Owners3
~ 100%

1) Net of amortization of debt issuance costs and discount and premium, which are included in interest expense but not included in net cash provided by operating activities. 2) Includes non-cash rent, which relates to lease incentives pro-rated over the lease term, and gains and losses on settled interest rate swaps designated as hedges related to debt issuances,
which are recorded in other comprehensive income (loss).3) Net of payments under onerous performance obligation offset to other current and long-term liabilities. 4) Non-controlling interest share of Adjusted EBITDA includes ENLC’s 16% share of Adjusted EBITDA from EnLink Oklahoma T.O., NGP Natural Resources XI, L.P.’s (“NGP”) 49.9% share of Adjusted
EBITDA from the Delaware Basin JV, Marathon Petroleum’s 50% share of Adjusted EBITDA from the Ascension JV, and other minor non-controlling interests. 5) Amortization of the EnLink Oklahoma T.O. installment payable discount is considered non-cash interest under the ENLK credit facility since the payment under the payable is consideration
for the acquisition of the EnLink Oklahoma T.O. assets. 6) Represents recoveries from a lawsuit settled in 2017 for amounts not previously deducted from distributable cash flow. 7) Excludes maintenance capital expenditures that were contributed by other entities and relate to the non-controlling interest share of our consolidated entities.8) Represents the cash distributions earned by the Series B Preferred Units and the Series C Preferred Units, assuming distributions are declared by our Board of Directors. Cash distributions to be
paid to holders of the Series B Preferred Units and Series C Preferred Units are not available to common unitholders.
RECONCILIATION OF NET CASH PROVIDED BY OPERATING ACTIVITIES
TO ADJUSTED EBITDA AND DISTRIBUTABLE CASH FLOW OF ENLK
EnLink Midstream 1Q 2018 Operations Report 30
All amounts in millionsThree Months Ended
3/31/2017 6/30/2017 9/30/2017 12/31/2017 3/31/2018
Net cash provided by operating activities $ 174.2 $ 158.0 $ 200.8 $ 173.5 $ 192.7
Interest expense, net (1) 37.3 40.1 41.5 39.9 42.2
Current income tax 0.8 (0.6) 0.7 1.7 1.0
Distributions from unconsolidated affiliate investments in excess of earnings 2.9 4.5 (0.1) (7.1) 1.4
Other (2) 0.9 4.8 (1.7) 2.3 1.8
Changes in operating assets and liabilities which (provided) used cash:
Accounts receivable, accrued revenues, inventories and other (19.4) (2.6) 127.5 107.7 55.6
Accounts payable, accrued gas and crude oil purchases and other (3) 14.5 12.9 (142.1) (67.1) (38.5)
Adjusted EBITDA before non-controlling interest $ 211.2 $ 217.1 $ 226.6 $ 250.9 $ 256.2
Non-controlling interest share of adjusted EBITDA (4) (3.6) (7.4) (9.8) (12.2) (12.5)
Adjusted EBITDA, net to EnLink Midstream Partners, LP $ 207.6 $ 209.7 $ 216.8 $ 238.7 $ 243.7
Interest expense, net of interest income (44.5) (47.1) (48.9) (47.4) (43.7)
Amortization of EnLink Oklahoma T.O. installment payable discount included in interest expense (5) 7.0 6.5 6.4 6.5 0.5
Litigation settlement adjustment (6) (12.3) (5.8) — — —
Current taxes and other (0.6) 0.4 (0.7) (1.6) (0.9)
Maintenance capital expenditures, net to EnLink Midstream Partners, LP (7) (4.2) (9.4) (6.9) (10.4) (6.2)
Preferred unit accrued cash distributions (8) — — (16.6) (22.1) (22.2)
Distributable cash flow $ 153.0 $ 154.3 $ 150.1 $ 163.7 $ 171.2

1) Represents distributions declared by ENLK and to be paid to ENLC on May 14, 2018 and distributions paid by ENLK to ENLC on February 13, 2018, November 13, 2017, August 11, 2017, and May 12, 2017.
2) Includes depreciation and amortization and unit-based compensation expense allocated to EnLink Oklahoma T.O.3) Represents ENLC’s stand-alone deferred taxes. 4) Represents NGP’s 49.9% share of the Delaware Basin JV, Marathon Petroleum’s 50% share of the Ascension JV, and other minor non-controlling interests.5) Represents, ENLC’s interest in EnLink Oklahoma T.O.s’ maintenance capital expenditures (which is netted against the monthly d isbursement of EnLink Oklahoma T.O.s’ adjusted EBITDA), and
other non-cash items not included in cash available for distribution.
RECONCILIATION OF NET INCOME OF ENLC TO ENLC CASH AVAILABLE FOR DISTRIBUTION
EnLink Midstream 1Q 2018 Operations Report 31
Three Months Ended
All amounts in millions 3/31/2017 6/30/2017 9/30/2017 12/31/2017 3/31/2018
Net income of ENLC $ 9.3 $ 27.1 $ 24.1 $ 259.5 $ 57.1
Less: Net income attributable to ENLK 18.1 29.6 25.5 75.7 60.1
Net income (loss) of ENLC excluding ENLK $ (8.8) $ (2.5) $ (1.4) $ 183.8 $ (3.0)
ENLC's share of distributions from ENLK (1) 49.8 49.9 49.9 49.9 49.9
ENLC's interest in EnLink Oklahoma T.O. non-cash expenses (2) 4.0 4.2 4.6 4.6 4.7
ENLC deferred income tax (benefit) expense (3) 2.5 3.3 2.5 (178.9) 5.8
Non-controlling interest share of ENLK's net income (loss) (4) 3.4 (2.2) (0.9) (1.4) (0.7)
Other items (5) 0.1 (0.1) 0.1 0.1 (0.1)
ENLC cash available for distribution $ 51.0 $ 52.6 $ 54.8 $ 58.1 $ 56.6

1) Includes accretion expense associated with asset retirement obligations and non-cash rent, which relates to lease incentives pro-rated over the lease term.
2) Non-controlling interest share of Adjusted EBITDA includes ENLC’s 16% share of Adjusted EBITDA from EnLink Oklahoma T.O., NGP’s 49.9% share of Adjusted EBITDA from the Delaware Basin JV, Marathon Petroleum’s 50% share of Adjusted EBITDA from the Ascension JV, and other minor non-controlling interests.
RECONCILIATION OF NET INCOME (LOSS) TO ADJUSTED EBITDA OF ENLK
EnLink Midstream 1Q 2018 Operations Report 32
Three Months Ended
All amounts in millions 3/31/2017 6/30/2017 9/30/2017 12/31/2017 3/31/2018
Net income $ 13.3 $ 32.7 $ 28.7 $ 80.1 $ 65.1
Interest expense, net of interest income 44.5 47.1 48.9 47.4 43.7
Depreciation and amortization 128.3 142.5 136.3 138.2 138.1
Impairments 7.0 — 1.8 8.3 —
(Income) loss from unconsolidated affiliates (0.7) 0.1 (4.4) (4.6) (3.0)
Distribution from unconsolidated affiliates 2.9 4.5 4.0 2.1 6.0
(Gain) loss on disposition of assets 5.1 (5.4) 1.1 (0.8) 0.1
Gain on extinguishment of debt — (9.0) — — —
Unit-based compensation 19.3 9.3 10.1 9.1 5.1
Income tax (benefit) provision 0.5 (0.3) 0.5 (24.7) 1.0
(Gain) loss on non-cash derivatives (5.3) (1.8) 3.3 (0.9) 3.5
Payments under onerous performance obligation offset to other current and long-term liabilities (4.5) (4.5) (4.5) (4.4) (4.5)
Other (1) 0.8 1.9 0.8 1.1 1.1
Adjusted EBITDA before non-controlling interest $ 211.2 $ 217.1 $ 226.6 $ 250.9 $ 256.2
Non-controlling interest share of adjusted EBITDA (2) (3.6) (7.4) (9.8) (12.2) (12.5)
Adjusted EBITDA, net to EnLink Midstream Partners, LP $ 207.6 $ 209.7 $ 216.8 $ 238.7 $ 243.7

RECONCILIATION OF ENLK’S OPERATING INCOME (LOSS) TO GROSS
OPERATING MARGIN OF ENLK
EnLink Midstream 1Q 2018 Operations Report 33
All amounts in millionsQ1 2018 Texas Louisiana OklahomaCrude and
Condensate Corporate Totals
Operating income $ 106.6
General and administrative expenses 26.2
Depreciation and amortization 138.1
Loss on disposition of assets 0.1
Segment profit $ 104.4 $ 61.8 $ 95.4 $ 8.9 $ 0.5 $ 271.0
Operating expenses 44.2 25.6 20.7 18.7 — 109.2
Gross operating margin $ 148.6 $ 87.4 $ 116.1 $ 27.6 $ 0.5 $ 380.2
Q4 2017 Texas Louisiana OklahomaCrude and
Condensate Corporate Totals
Operating income $ 98.1
General and administrative expenses 28.9
Depreciation and amortization 138.2
Gain on disposition of assets (0.8)
Impairments 8.3
Segment profit (loss) $ 106.3 $ 69.1 $ 86.0 $ 14.4 $ (3.1) $ 272.7
Operating expenses 44.8 26.5 18.7 19.9 — 109.9
Gross operating margin $ 151.1 $ 95.6 $ 104.7 $ 34.3 $ (3.1) $ 382.6
Q3 2017 Texas Louisiana OklahomaCrude and
Condensate Corporate Totals
Operating income $ 73.4
General and administrative expenses 30.0
Depreciation and amortization 136.3
Loss on disposition of assets 1.1
Impairments 1.8
Segment profit (loss) $ 107.6 $ 51.0 $ 79.1 $ 10.4 $ (5.5) $ 242.6
Operating expenses 41.1 24.8 17.1 19.1 — 102.1
Gross operating margin $ 148.7 $ 75.8 $ 96.2 $ 29.5 $ (5.5) $ 344.7

1) Total operating expenses for the three months ended March 31, 2017 included $2.0 million of unit-based compensation expense paid as bonus, which was granted and immediately vested in March 2017.
RECONCILIATION OF ENLK’S OPERATING INCOME (LOSS) TO GROSS
OPERATING MARGIN OF ENLK (CONT.)
EnLink Midstream 1Q 2018 Operations Report 34
All amounts in millions
Q2 2017 Texas Louisiana OklahomaCrude and
Condensate Corporate Totals
Operating income $ 70.4
General and administrative expenses 29.6
Depreciation and amortization 142.5
Gain on disposition of assets (5.4)
Gain on litigation settlement (8.5)
Segment profit $ 105.6 $ 45.4 $ 68.8 $ 7.2 $ 1.6 $ 228.6
Operating expenses 42.9 24.6 14.7 20.4 — 102.6
Gross operating margin $ 148.5 $ 70.0 $ 83.5 $ 27.6 $ 1.6 $ 331.2
Q1 2017 Texas Louisiana OklahomaCrude and
Condensate Corporate Totals
Operating income $ 57.6
General and administrative expenses 35.0
Depreciation and amortization 128.3
Loss on disposition of assets 5.1
Impairments 7.0
Gain on litigation settlement (17.5)
Segment profit $ 101.4 $ 46.7 $ 53.4 $ 11.2 $ 2.8 $ 215.5
Operating expenses (1) 43.9 25.4 14.1 20.7 — 104.1
Gross operating margin $ 145.3 $ 72.1 $ 67.5 $ 31.9 $ 2.8 $ 319.6

ENLK FORWARD-LOOKING RECONCILIATIONFORECASTED ENLK NET INCOME TO ADJUSTED EBITDA TO DISTRIBUTABLE CASH FLOW1
EnLink Midstream 1Q 2018 Operations Report 35
2018 Outlook
($ millions) Low Midpoint High
Net income (2) $ 255 $ 285 $ 315
Interest expense, net of interest income 175 179 183
Depreciation and amortization 554 564 574
Income from unconsolidated affiliate investments (19) (20) (21)
Distribution from unconsolidated affiliate investments 16 17 18
Unit-based compensation 42 37 32
Income taxes 4 5 6
Payments under onerous performance obligation offset to other current and long-term liabilities (18) (18) (18)
Adjusted EBITDA before non-controlling interest $ 1,009 $ 1,049 $ 1,089
Non-controlling interest share of adjusted EBITDA (3) (59) (64) (69)
Adjusted EBITDA, net to EnLink Midstream Partners, LP $ 950 $ 985 $ 1,020
Interest expense, net of interest income (175) (179) (183)
Preferred B and C units accrued cash distributions (89) (89) (89)
Current taxes and other (1) (5) (8)
Maintenance capital expenditures, net to EnLink Midstream Partners, LP (55) (57) (60)
Distributable cash flow $ 630 $ 655 $ 680
1) The forecasted net income guidance for the year ended December 31, 2018 excludes the potential impact of gains or losses on derivative activity, gains or losses on disposition of assets,
impairment expense, gains or losses as a result of legal settlements, gains or losses on extinguishment of debt, and the financial effects of future acquisitions. The exclusion of these items is
due to the uncertainty regarding the occurrence, timing and/or amount of these events.
EnLink Midstream does not provide a reconciliation of forward-looking Net Cash Provided by Operating Activities to Adjusted EBITDA because the companies are unable to predict
with reasonable certainty changes in working capital, which may impact cash provided or used during the year. Working capital includes accounts receivable, accounts payable
and other current assets and liabilities. These items are uncertain and depend on various factors outside the company’s control.
2) Net income includes estimated net income attributable to ENLK's non-controlling interest in ENLC's 16% share of net income from EnLink Oklahoma T.O., NGP Natural Resources XI, L.P.’s
(“NGP”) 49.9% share of net income from the Delaware Basin JV and Marathon Petroleum's 50% share of net income from the Ascens ion JV.
3) Non-controlling interest share of adjusted EBITDA includes ENLC’s 16% share of adjusted EBITDA from EnLink Oklahoma T.O., NGP’s 49.9% share of adjusted EBITDA from the Delaware Basin
JV, Marathon Petroleum’s 50% share of adjusted EBITDA from the Ascension JV, and other minor non-controlling interests.

ENLC FORWARD-LOOKING RECONCILIATION
EnLink Midstream 1Q 2018 Operations Report 36
1) The forecasted net income guidance for the year ended December 31, 2018 excludes the potential impact of gains or losses on derivative activity, gains or losses on disposition of assets, impairment expense, gains or losses as a result of legal settlements, gains or losses on extinguishment of debt, and the financial effects of future acquisitions. The exclusion of these items is due to the uncertainty regarding the occurrence, timing and/or amount of these events.
2) Net income of ENLC includes estimated net income attributable to ENLC's non-controlling interest in ENLK. 3) Net income attributable to ENLK is net of the estimated non-controlling interest share attributable to the Delaware Basin JV, Ascension JV and EnLink Oklahoma T.O. 4) Represents quarterly distributions estimated to be paid to ENLC by ENLK for 2018. 5) Represents estimated net income for NGP’s 49.9% share of the Delaware Basin JV, Marathon Petroleum’s 50% share of the Ascension JV and other minor non-controlling interests. 6) Represents ENLC's estimated stand-alone deferred taxes for 2018. 7) Represents 2018 maintenance capital expenditures attributable to ENLC’s share of EnLink Oklahoma T.O.
2018 Outlook
($MM) Low Midpoint High
Net income of ENLC (2) $ 233 $ 262 $ 291
Less: Net income attributable to ENLK (3) (225) (250) (275)
Net income of ENLC excluding ENLK $ 8 $ 12 $ 16
ENLC's share of distributions from ENLK (4) 201 201 201
ENLC's interest in EnLink Oklahoma T.O. depreciation 19 19 19
Non-controlling interest share of ENLK's net income (5) (11) (11) (11)
ENLC deferred income tax expense (6) 14 15 16
Maintenance capital expenditures (7) (1) (1) (1)
ENLC cash available for distribution $ 230 $ 235 $ 240
FORECASTED ENLC NET INCOME TO CASH AVAILABLE FOR DISTRIBUTION1

FOCUS ON PEOPLE | STRIVE FOR EXCELLENCE | BE ETHICAL | DELIVER RESULTS | BE GOOD STEWARDS
ENLINK.COM