operational plan 2016 2014 - ireland's health services · 1 operational plan 2016 2014...
TRANSCRIPT

1
2014 Operational Plan 2016
COMMUNITY HEALTHCARE ORGANISATION - AREA
7
(Dublin South City, Dublin South West, Dublin West,
Kildare/West Wicklow)
3 March 2016
Health and Wellbeing
Primary Care Services
Mental Health Services
Social Care Services

2
Mission
► People in Ireland are supported
by health and social care services
to achieve their full potential
► People in Ireland can access safe,
compassionate and quality care
when they need it
► People in Ireland can be confident
that we will deliver the best
health outcomes and value
through optimising our resources
Vision
A healthier Ireland with a high quality health service valued by all
Care Compassion Trust Learning
Goal 5Values
We will try to live our values every day and will continue to develop them

3
INTRODUCTION ................................................................................................................................................................. 4
Community Healthcare Organisation 7 ..................................................................................................... 4
South Dublin/Kildare West Wicklow ......................................................................................................... 4
IMPROVING QUALITY & REFORMING SERVICE DELIVERY. .................................................................................................. 11
Quality and Safety .................................................................................................................................... 11
Health Service Reform. ............................................................................................................................ 14
Clinical Strategy and Programmes. ......................................................................................................... 15
OPERATIONAL FRAMEWORK ............................................................................................................................................ 16
Financial Framework - Funding and Financial Outlook ........................................................................ 16
The Workforce Position ........................................................................................................................... 33
ACCOUNTABILITY FRAMEWORK. ...................................................................................................................................... 37
Governance & Accountability. ................................................................................................................. 37
OPERATIONAL SERVICE DELIVERY – CORPORATE GOALS IMPLEMENTATION ..................................................................... 42
Health & Wellbeing Division ................................................................................................................... 43
Primary Care ........................................................................................................................................... 50
Mental Health Services CHO 7 ................................................................................................................ 61
Social Care .............................................................................................................................................. 70
APPENDICES .................................................................................................................................................................. 86
Appendix 1: Primary Care Financial Tables ........................................................................................... 86
Appendix 2 – Balance Scorecard & Key Performance Indicators .......................................................... 87
Appendix 3 Key Performance Indicators (KPIs) ..................................................................................... 99
Appendix 4 – Capital Projects Primary Care ........................................................................................ 137
4
Introduction Community Healthcare Organisation 7 South Dublin/Kildare West Wicklow Area 7 – Population 668,250 (14.5% of the National Population). Kildare West Wicklow LHO, Dublin West LHO, Dublin South City LHO and Dublin South West LHO. Community Healthcare Organisation 7 covers for all or part of Local Authority Areas: Kildare, Wicklow, South Dublin CC and Dublin City Council.
Demographic Highlights:
0-18 185,810 0-5 68,885 65+ 67,854 75+ 25,185
103,578 persons born overseas comprising 15.5% of the population:
Polish 20,490 UK 10,745 Lithuanian 5,648 Other EU 20,849 Elsewhere 46, 026 A key priority in 2016 is to progress the further development of the structures and processes to ensure that this Community Healthcare Organisation supports the health needs of the population with high quality services provided to them as close to their homes as possible. Next steps in this process include the appointment of Heads of Services across the various Divisions to form a management team for this CHO. Work will also progress in relation to the reconfiguration of services into 14 Community Health Networks which will, in time, become the principal unit of local service delivery to the population. The Dublin Midlands Hospital Group provides acute health services within this CHO and it is essential that linkages forged between Community Services and St James’s Hospital, Tallaght Hospital and Naas General Hospital are maintained and strengthened so as to ensure that the public we serve receive the care they are entitled to. This area faces challenging targets for 2016 particularly in terms of meeting increasing demand for services within a constrained financial framework. We must also address the challenge of increasing regulatory requirements and the need to maintain a high quality of service. At the same time there are opportunities in the HSE Service Plan 2016 across each of the Divisions to improve services in our catchment area.
5
Health & Wellbeing:
• Work will progress on the Healthy Ireland implementation plan this year.
• Immunisation rates and Child Health Screening remain a concern given the decreasing resource available within Primary Care to provide core services.
• Within this CHO the Integrated Care Programmes will support a range of initiatives this year including Older Persons and Chronic Disease Management.
• Staff will continue the good work in implementing the Tobacco Strategy across Divisions and increased numbers of staff will be released for training to support this programme.
• This CHO has engaged heavily with South Dublin County Council and Kildare County Council and are key partners within the LCDC structures. However, issues remain regarding the engagement with Dublin City Council which it is hoped can be addressed with the assistance of the Division in 2016.
Primary Care
• Significant issues remain in relation to the provision of Primary Care services within the CHO. Given the projected shortfall between allocated budget and expenditure a range of measures to avoid cost increases as well as reducing current expenditure levels will be required.
• The full implementation of the Pay Bill Management Framework will lead to a reduction in both frontline professional staff and administrative support during 2016. In addition, the opening of new facilities will be contingent on a funding source being identified.
• The 14 proposed Community Health Networks will form the cornerstone of service provision into the future. Work on the development of these networks will continue in 2016.
• Service Developments in the HSE National Service Plan will support the development of Chronic Disease Management initiatives in conjunction with General Practice. Potential service initiatives with Tallaght Hospital, Trinity College and local General Practitioners will also be explored through the Tallaght Project during the year.
• The implement Children First in Primary Care is a key priority during 2016 and staff engagement in relation to this will continue under the guidance of the Division.
• Participate in GP Out of Hours Service review
• Participate in Primary Care Electronic Patient Management System Project
• Implement Healthy Ireland priority actions in relation to Tobacco Control, Obesity and Immunisations
Palliative Care.
• The redevelopment of St. Brigid’s Hospice with the support of the Friends of St. Brigid’s will progress this year.
• Continue to support our partner agencies in ensuring that a quality patient centred approach is at the heart of
service provision.
6
Social Inclusion
• Support health recommendations of the National Homelessness initiative
• Work with minority groups to improve access to Primary Care (Travellers & Roma)
• Work with National Office for Suicide Prevention in relation to the Traveller Suicide Initiative
Social Care - Older Persons Services:
• Home Support through Home Help and Home Care Packages have proven to be essential support to keeping older persons in their homes as long as possible. Significant challenges exist in 2016 to match demand for these services with the available finances. Significant assistance and support from the Social Care Division is essential in addressing the gap between the current demand for service and the available resource.
• We will continue to work with the Social Care Division and the Acute Hospitals in our catchment to provide targeted support to patients discharging from hospital to help them to remain at home through intensive Home Care Packages within the available resource.
• The Single Assessment Tool was successfully piloted in this area in partnership with Tallaght Hospital in 2015. This work will continue in 2016.
• The Clinical Programme for Older Persons will support a more Intensive integrated system of support for the integrated care of Older People between Community Services and Tallaght Hospital. This is a significant opportunity to further work in partnership with the Social Care Division and Tallaght Hospital to enhance services to older persons in this community.
• Specific issues remain in our Community Nursing Units in relation to the cost of care. The excessive cost of care will be reduced through focussed management intervention throughout the year to bring our costs in line with our peers.
• The continued implementation of the HSE Policy in relation to the Safeguarding of Vulnerable Adults will be supported through the further rollout of training to appropriate staff.
Disability Services:
• The financial position in relation to Disability Services is of extreme concern. Work will continue to address significant run rate issues in 2016. A range of measures are currently underway to minimise this but significant assistance from the Social Care Division will be required to agree a plan for a sustainable level of service that addresses the needs of the population of this CHO.
• Progressing Children’s Disability Services: The reconfiguration of Children’s Disability Services will continue across the CHO in partnership with CHO 6 and our voluntary partners.
• Significant risk remains in relation to compliance with the Disability Act 2005. Assessment of Need continues to be an issue given the very young population and the relative dearth of resource in the area.
• Value for Money/Congregated Settings: Focussed plans to move individuals from their current residential placements into community living arrangements will be finalised and implemented in partnership with our Voluntary organisations.

7
• Emergency Placements: Work will continue with our voluntary providers to cater for emergencies that arise during the year from existing resources. A full review of current placements will be undertaken to try and ensure better value for money while maintaining safe placements
• School Leaver in 2016: The HSE Service Plan makes provision for the resources required to ensure that 2016 school leavers have appropriate onward placements and work will continue with the Division to access those resources. Risk remains in relation those school leavers with very high needs.
• A comprehensive bid will be made to secure an appropriate share of new development posts for this CHO.
Mental Health
• Mental Health Services in this CHO have previously been part of two separate Supercatchment Areas, one comprising the Kildare West Wicklow Service and the Midlands, and, the other, comprising the St James’s Service and the St Loman’s’ Service. Work will continue in 2016 to integrate all of the services, including Child & Adolescent Mental Health Services, into one integrated service.
• Work on the National Children’s Hospital will continue in 2016 and this CHO will continue to develop plans with the Mental Health Division for the Child & Adolescent Mental Health component of the services to be provided at that location.
• Service users in this Community Healthcare Organisation have benefitted significantly from the additional funding made available through the HSE National Service Plan in recent years. However, services generally remain underfunded in comparison with national norms and significant risks remain across the full range of services. In particular, the capacity of the Kildare West Wicklow Service is inadequate and a range of supports for both community based and acute inpatient services are essential to address risk issues in 2016.
• The continued development of Psychiatry of Old Age Services in 2016 is a welcome addition to services given the demographic profile of the CHO
• Mental Health Services comprise an essential component of the overall service provision to the population and services will continue the process to reconfigure teams in to networks of approximately 50, 000 to mirror other community services.
• The Connected for Life Programme will commence in two locations across the CHO this year and it is hoped that two additional Jigsaw programmes will also commence.
• Service User representation is recognised as an essential component within Mental Health Services and initiatives to enhance this will continue this year.
• This CHO will also bid for additional resources to build capacity in sector teams and address acute capacity issues.
Capital:
• Primary Care Centres at Tallaght, Blessington and Kildare town are due to be completed in 2016. However, due to funding issues the opening of these facilities will be contingent on a funding source being identified.
• Capital approval for the enhancement/replacement of the Community Nursing Units within the HSE is a positive development and work will proceed in line with the timeframes outlined in the capital plan.
• Capital support to assist the de-congregation of institutional settings in the Disability Services will allow for significant progress this year in those services.

8
Quality & Patient Safety
• Significant risks exist within the CHO arising from the lack of a dedicated resource for Quality & Patient Safety. This deficit will be addressed with the support of the Divisions which will allow the CHO put in place the necessary QPS structures.
• Recruitment of additional Quality, Safety & Risk Managers will be required during the year.
• Consolidation of existing Quality, Safety & Risk committees across the Community Healthcare Organisation will continue as a key part of the formation and evolution of the CHO structures.
• Implementation of HSE Serious Incident Management Plan will continue
• Systems analysis training for staff will enhance the internal capacity to meet Quality & Patient Safety requirements.
• Ongoing implementation of HIQA Standards across services both in residential services and within the Primary Care services remains a key priority across all divisions.
Accountability Framework
The HSE’s Accountability Framework was introduced in 2015 and has been further enhanced and developed for 2016.
As part of the HSE’s overall governance arrangements, the Accountability Framework is an important development
which will support the implementation of the new health service structures. The Balance Scorecard dimensions of
Access, Quality, Finance, and HR form the basis for the National Performance Reports each month and are based on a
number of key priorities of the National Service Plan. The Chief Officer, CHO 7 is responsible for the delivery of the key
result areas, identified in the Balance Scorecard, as part of a Formal Performance Agreement between the Director
General and the National Directors and between the National Directors and the Hospital Group CEOs and the CHO
Chief Officers. This is managed through a series of monthly performance meetings with the National Divisions.
Arrangements are in place with the interim CHO 7 management team to report on the delivery of the key result areas in
the balance scorecard.
Workforce The staff of CHO 7 continues to be its most valuable resource and is central to improvement in service user care,
productivity and performance. Engagement and involvement of staff in the new service design and delivery is a key
priority for 2016. Recruiting and retaining motivated and skilled staff is a key objective and the effective management of
the workforce will underpin the accountability framework in 2016. This requires that our organisation has the most
appropriate configuration to deliver services in the most cost effective and efficient manner to maximum benefit.
Employment controls in 2016 will be based on the configuration of the workforce within funded levels. This requires an
integrated approach, with service management being supported by HR and Finance. It further requires finance and HR
workforce data, monitoring and reporting to be aligned. This will be developed once the Heads of Finance and HR are in
place.
Reconfiguration and integration of services in line with the CHO report, the implementation of service improvement
initiatives and the reorganisation of existing work and staff will all contribute to delivering a workforce that is more
adaptable, flexible and responsive to the needs of the services.
9
Risks to the Delivery of the Operational Plan HSE structural reforms will impact on CHO 7 in 2016 as services across former ISA’s Dublin South Central and Dublin
South West/Kildare West Wicklow are aligned at local level. We will continue to strive to prioritise service delivery in an
equitable and transparent way.
Structural reform challenges, together with limited financial and human resources will impact on service delivery and risk
in the following areas:
Structural Risks
• Management of capacity risk including financial management, given the scale of change being delivered. This is of
particular concern in 2016 in the context of legislation regarding supplementary budgets.
• Organisational capacity to support the implementation of the reform programme will be essential to ensuring the
overall governance and stability of services at CHO level.
• Implementation of national priorities will continue to be a risk in a climate of transition to a CHO structure.
• The extent of organisational capacity required to develop the required primary care networks and primary care
teams and the associated scaling of models and pathways of care required to deliver high quality services
• Non-integration of ICT systems not fit for purpose from Clinical, HR and Financial perspective.
Service Risks
� Demographic pressures over and above those planned for delivery in 2016.
� Meeting HIQA standards for public long stay residential facilities, disability and primary care services.
� Financial risks associated with statutory and regulatory compliance.
� The ability to recruit and retain skilled and qualified clinical staff.
� The potential of pay cost growth which has not been funded.
� The deficit in Acute Mental Health Bed Capacity will continue to be a risk.
� The increase in demand for Home Care Packages beyond those funded is of a particular risk in 2016 in the
context of a continued focus on alleviation of pressures in ED departments.
� Significant cost containment measures are required within this CHO to ensure that services are delivered
within the financial allocation.

10
Conclusion CHO 7 will continue to work towards maximising the safe delivery of services within the financial and human resources
available while at the same time ensuring that quality and patient safety remains at the core of the delivery system.
However, our ability to expand or put in place any additional new services in 2016, other than those specifically provided
for in the Letter of Determination will be limited. This will be challenging as we re-structure our services in this CHO,
whilst ensuring equality of services across our organisation in an ever increasing demand led environment. While it is
acknowledged this list is not exhaustive, every effort will be made to mitigate the risks outlined above however it may not
be possible to eliminate them in full within the current budgetary envelope.
David Walsh Chief Officer Community Healthcare Organisation 7 South Dublin/Kildare/West Wicklow February 2016
11
Improving Quality & Reforming Service Delivery.
Quality and Safety The HSE is committed to putting in place a quality, safety and enablement programme to support high quality, evidence based, safe effective and person centred care. Quality improvement, quality assurance and verification, will underpin the HSE approach to quality and safety in 2016, as is essential in times of constrained resources and change.
Leadership, including clinical leadership, is essential to embed a quality ethos in all services delivered and funded by the HSE and extends from the Directorate, the service Divisions and across the health and social care services. The appointment of Chief Executive Officers to the Hospital Groups and Chief Officers to the Community Healthcare Organisations paves the way for strong leadership so that quality is at the core of all we do.
Quality and safety priority areas for 2016 are:
• Proactive approach to service user and staff engagement.
• Completion of Self assessment against the National Standards for Safer Better Healthcare at CHO and divisional
level (where applicable), Development and implementation of Quality Improvement Plans
• Ensure Community Healthcare Organisations have clear structures to govern and deliver quality care.
• Quality improvement capacity building and the establishment of quality improvement collaboratives.
• The development and use of appropriate quality performance measures.
• Establishment of Key performance indicators for quality improvement and patient safety and monitoring of this
system.
• Introduction of Quality Profiles to measure and support improvement.
• The development and implementation of a quality assurance and verification framework.
• The management of Reportable and Serious Reportable Events in accordance with HSE protocol.
• Identification and management of Risk through the Implementation of the Risk Register system at divisional and
CHO level.
Strategic Priorities for 2016
Person Centred Care
• Develop strong partnerships with patients and service users to achieve meaningful input into the planning, delivery
and management of health and social care services to improve patient and service user experience and outcomes.
Effective Care
• Ensure that patients or service users are responded to and cared for in the appropriate setting including:
• Home, community and primary care, mental health and social care settings.
• Implement the National Clinical Guideline - Sepsis Management.
• Support the work of the National Clinical Effectiveness Committee and the implementation of the National Clinical
Effectiveness Committee guidelines.
• Establish a revised Primary Care Medicines Management Programme to review all aspect of medicines
procurement, prescribing and usage to ensure that potential health outcome from medicine are realised
• Health & Wellbeing will work to improve the uptake rate of the influenza vaccine amongst frontline healthcare
workers in acute hospitals and long-term facilities in the community
12
Safe Care
• Continue quality improvement programmes in the area of Healthcare Associated Infections (HCAI) and implement
the national guidelines for Methicillin-resistant Staphylococcus aureus (MRSA), Clostridium difficile and Sepsis, and
the National Standards for the Prevention and Control of Healthcare Associated Infections with a particular focus on
antimicrobial stewardship and control measures for multi-resistant organisms.
• Continue quality improvement in Medication Management and Safety.
• Implementation of HSE Open Disclosure policy across all health and social care settings.
• Implementation of the Safeguarding Vulnerable Persons at Risk of Abuse – National Policy & Procedures (December 2014)
Improving Quality • Development of models of frontline staff engagement to improve services.
• Mental Health services will lead a national safety programme which will aim to reduce avoidable harm in mental health services with an initial focus on acute inpatient care and post discharge period.
• Build capacity (Diploma, methodologies and toolkits).
• Develop further quality improvement collaborative in key services.
• Lead, in consultation with the services, a programme focused on the improvement of hydration and nutrition for service users.
• Development and implementation of a system of Healthcare Quality Improvement Audits.
• Develop a Quality Profile framework for application within all Health and Wellbeing Services and Functions
• Agree and implement a strategic approach to improving quality and patient safety to support the HSE in continuing to deliver on its overall priority on quality and patient safety.
Assurance and Verification
• Development and Implementation of measurable performance indicators and outcome measures for quality and risk.
• Development of quality and risk performance standards.
• Ensure routine assessment and reports on key aspects of quality and risk indicators.
• Implementation the National Adverse Events Management System (NAEMS) across all services.
• Development and Implementation of a system to facilitate the identification, assessment and management of risk at CHO, Divisional and service level
• Implementation remedial actions, additional control measures where required.
• Development, Implementation and audit of a process for the management of serious events requiring reporting and investigation in accordance with the safety incident management policy 2014.
• Implementation of a system for the dissemination, implementation and monitoring of recommendations from investigations.
• Develop and maintain CHO and divisional Risk Registers
• Manage complaints to ensure that learning is derived
13
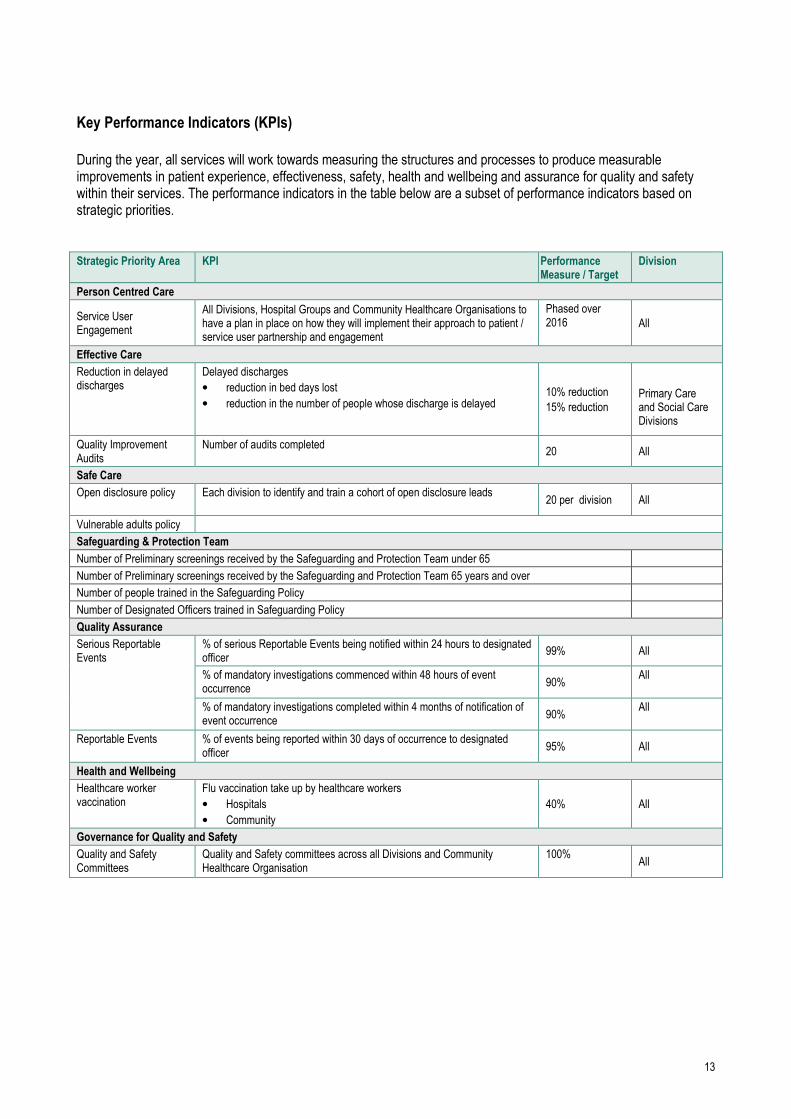
Key Performance Indicators (KPIs)
During the year, all services will work towards measuring the structures and processes to produce measurable improvements in patient experience, effectiveness, safety, health and wellbeing and assurance for quality and safety within their services. The performance indicators in the table below are a subset of performance indicators based on strategic priorities. Strategic Priority Area KPI Performance
Measure / Target Division
Person Centred Care
Service User Engagement
All Divisions, Hospital Groups and Community Healthcare Organisations to have a plan in place on how they will implement their approach to patient / service user partnership and engagement
Phased over 2016
All
Effective Care
Reduction in delayed discharges
Delayed discharges
• reduction in bed days lost
• reduction in the number of people whose discharge is delayed 10% reduction
15% reduction
Primary Care and Social Care Divisions
Quality Improvement Audits
Number of audits completed 20 All
Safe Care
Open disclosure policy
Each division to identify and train a cohort of open disclosure leads 20 per division All
Vulnerable adults policy
Safeguarding & Protection Team
Number of Preliminary screenings received by the Safeguarding and Protection Team under 65
Number of Preliminary screenings received by the Safeguarding and Protection Team 65 years and over
Number of people trained in the Safeguarding Policy
Number of Designated Officers trained in Safeguarding Policy
Quality Assurance
Serious Reportable Events
% of serious Reportable Events being notified within 24 hours to designated officer
99% All
% of mandatory investigations commenced within 48 hours of event occurrence
90% All
% of mandatory investigations completed within 4 months of notification of event occurrence
90% All
Reportable Events
% of events being reported within 30 days of occurrence to designated officer
95% All
Health and Wellbeing
Healthcare worker vaccination
Flu vaccination take up by healthcare workers
• Hospitals
• Community
40% All
Governance for Quality and Safety
Quality and Safety Committees
Quality and Safety committees across all Divisions and Community Healthcare Organisation
100%
All

14
Health Service Reform.
Brief Description Supporting the goals of the Corporate Plan 2015–2017, the reform programme will drive the delivery of person-centred, integrated care across the health and social care services, leading to better outcomes for patients and service users. The model of care which we provide must be fit for purpose and the best that it can be. Provision of care must be integrated by providing better and easier access to services for the public which are close to where people live. Services are being re-organised to ensure they are based on need, and are delivered in the most appropriate way. To drive health service reform, service delivery reform programmes are in place for CHOs and Hospital Groups, National Ambulance Services, National Clinical and Integrated Care programmes and all of the key enabling programmes (including quality and safety, HR, ICT, Finance). Changes in the national divisional structures reflecting the changes to service delivery are being developed as part of the National Centre Programme. Maintaining momentum in this reform programme in the context of increasing operational pressure on the health and social care delivery system is a key focus for 2016. An Action Plan for Health Service Reform is being agreed to support NSP 2016 and will map out the key service improvement deliverables for the reform programme for 2016 and beyond to 2019.
Governance and Management Arrangements to local CHO PMO The nine CHOs are in the process of being established under the leadership of their Chief Officers. The CHO Implementation Programme will deliver on the recommendations of the CHO Report to establish appropriate governance and management arrangements for the delivery of services at local community level A significant programme of change is underway to enable and drive the establishment of CHOs with the aim of delivering integrated services and better outcomes for service users. A robust programme management and governance structure is being adopted at national and local levels to support the programme, manage implementation and ensure that the benefits to the service users remain at the driving force for all programme activities.
Local and National CHO Programme Management Offices The CHO Implementation Programme will be managed through a CHO National PMO and PMOs in each of the CHOs. The local PMOs are being established to oversee local implementation of CHO Reform Projects and other care service improvement and corporate change initiatives. Dedicated staff will be assigned to the National and Local PMOs to oversee the CHO Implementation, as well as project resources to drive the project delivery. The local PMOs will operate in conjunction with the CHO National PMO and the newly established PMOs in the Care National Divisions and the Corporate Services Divisions. The local PMO will report to the Chief Officer and will work closely with the National PMO. Local PMO and other staff working on projects have available to them supports in the form of Project and Change Management training and IT Programme Management tools.

15
Clinical Strategy and Programmes. Clinical Strategy and Programmes are leading a large scale programme of work to develop a system of integrated care across health and social care services – a major element of health reform in Ireland. This is a long term programme of improvement and change and will involve people at every level of the health services working together to create improved experiences and outcomes for the people in their care, in a way which puts them at the centre of all services.
The National Clinical Programmes continue to modernise and improve the way in which specific areas of health and social care services are provided and delivered by designing and guiding the implementation of standardised models of care, clinical guidelines, care pathways and associated strategies through 31 national clinical programmes.
The Office of Nursing and Midwifery Services leads and supports the nursing and midwifery professions to deliver safe, high quality person-centred healthcare that enables people to lead healthier and more fulfilled lives. The work is aligned to legislation and health policy.
The Integrated Care Programmes continue to progress the establishment, enablement and delivery of five integrated care programmes:
• Patient flow
• Older people
• Prevention and management of chronic disease
• Children
• Maternity care.
All of these to a different extent involve the health and personal social services of CHO 7. We are working with these programmes to improve our services.
CHO7 specific Programmes
• CHO 7 is a pilot site for the Older People Integrated Care Programme and a service will be developed across
primary and acute settings in the Tallaght area in 2016.
• The National Service Plan allocates resources to CHO 7 to further develop services for the Prevention &
Management of Chronic Diseases in 2016.

16
Operational Framework Financial Framework - Funding and Financial Outlook CHO7 has received a total revenue allocation of €480.60m in 2016 to provide health and social care services within its
catchment area. This is the budget allocated by Corporate Finance and is replicated in the Divisional Operational Plan.
When compared to the National Budgeting system (Rosetta), there may be differences which will be accounted for
through recurring Budget posted on Rosetta after October 2015, as well as budget adjustments subsequent to the
drafting of the Operations plan.
The total funding available for existing services represents a decrease of €3.41m (0.7%) on the final outturn budget for
2015. When taking into account the reduction in regional Contract Beds & Subvention in Older Persons services of
c.€5m (assumed at break even in 2016) and Transitional Care Bed (TCB) funding of €3.6m, the budget for 2016 has
increased by €5.2m on these two factors alone. However, as the TCB monies were used to assist in balancing the
overall SCOP position in 2015, the retraction of these monies reflects a higher opening deficit carried into 2016.
On a direct Budget comparison basis, and when factoring in and/or extracting items not continuing into 2016, the overall
Budget has increased by c. €4m (0.8%). Almost €2m of the increase in is Demand Led Schemes, with another €1m in
Primary Care services to deal with paediatric home care packages.
Overall, the remaining net increase of €940k represents just 0.2% growth against the base allocation. This needs to be
factored against the backdrop of economic and other factors such as wider population growth of 0.7% nationally (0.79%
for CHO7), increased levels of service demand associated with an ageing population, the extra day’s cost in 2016 and
the overall non-funding of increments and non pay inflation.
Saving targets across the sectors in 2016 are included in the overall Budget figure at €2.29m.
2015 also saw significant cost pressure growth in emergency placements in Disability settings and in Home Care
package expenditure in Older Persons services, where such expenditure was designed to alleviate overcrowding in
Acute Hospital settings. This will continue to present as a significant challenge in 2016.

17
Table 1 below outlines a summary of the relative financial position for Statutory services and Section 38 (Voluntary)
Agency services between 2015 and 2016.
Table 1 - 2015 - 2016 Spend and Allocation by Division - CHO7 (Statutory funded & S38)
Statutory & S38 Services Outturn
2015
(€m)
Budget
2015
(€m)
Deficit/
(Surplus)
2015
(€m)
Deficit/
(Surplus)
2015 (%)
Projected
Outturn
2016
(€m)
Advised
Budget
2016
(€m)
Deficit/
(Surplus)
before Cost
Containment
2016 (€m)
Deficit/
(Surplus)
2016 (%)
Primary Care 78.85 77.52 1.34 1.7% 80.01 78.59 1.42 1.8%
Social Inclusion 46.14 45.99 0.15 0.3% 46.81 46.00 0.82 1.8%
Palliative Care 22.26 23.02 (0.75) -3.3% 23.34 23.36 (0.02) -0.1%
S/T (exc schemes) 147.26 146.52 0.73 0.5% 150.16 147.94 2.22 1.5%
Local Schemes 45.10 44.28 0.82 1.8% 46.27 46.27 0.00 0.0%
Primary Care Total 192.36 190.81 1.55 0.8% 196.43 194.21 2.22 1.1%
Mental Health Total 72.56 71.94 0.62 0.9% 75.43 72.88 2.55 3.5%
Older Persons 68.36 67.26 1.10 1.6% 71.84 65.47 6.37 9.7%
Disability Services 153.90 147.18 6.72 4.6% 159.15 148.04 11.11 7.5%
Social Care Total 222.26 214.44 7.81 3.6% 230.98 213.51 17.48 8.2%
Totals 487.18 477.19 9.98 2.1% 502.84 480.60 22.24 4.6%
Table 2 provides a similar summary of the relative financial position for Statutory services only between 2015 and 2016.
Table 2 - 2015 - 2016 Spend and Allocation by Division - CHO7 (Statutory funded only)
Statutory Services Only Outturn
2015
(€m)
Budget
2015
(€m)
Deficit/
(Surplus)
2015
(€m)
Deficit/
(Surplus)
2015 (%)
Projected
Outturn
2016
(€m)
Advised
Budget
2016
(€m)
Deficit/
(Surplus)
before Cost
Containment
2016 (€m)
Deficit/
(Surplus)
2016 (%)
Primary Care 78.85 77.52 1.34 1.7% 80.01 78.59 1.42 1.8%
Social Inclusion 46.14 45.99 0.15 0.3% 46.81 46.00 0.82 1.8%
Palliative Care 2.83 2.82 0.01 0.3% 2.81 2.82 (0.02) -0.7%
S/T (exc schemes) 127.83 126.33 1.50 1.2% 129.63 127.41 2.22 1.7%
Local Schemes 45.10 44.28 0.82 1.8% 46.27 46.27 (0.00) 0.0%
Primary Care Total 172.93 170.61 2.31 1.4% 175.90 173.68 2.22 1.3%
Mental Health Total 72.56 71.94 0.62 0.9% 75.43 72.88 2.55 3.5%
Older Persons 56.23 55.11 1.12 2.0% 60.50 54.13 6.37 11.8%
Disability Services 58.33 52.23 6.10 11.7% 63.22 52.11 11.11 21.3%
Social Care Total 114.56 107.34 7.22 6.7% 123.72 106.24 17.48 16.4%
Totals 360.05 349.90 10.15 2.9% 375.04 352.80 22.24 6.3%
As outlined above the significant deficit drivers will be in Older Persons and Disability services. Mental Health services require significant cost containment or other measures to avoid a deficit position at the end of 2016. Primary Care services represent a challenge of €2.22m, or 1.3%, and will be dealt with through cost containment measures.

18
The cost containment summary is outlined below as follows:
Table 3 - 2016 Cost Containments (Statutory funded & S38)
Statutory & S38 Services Deficit/
(Surplus)
before Cost
Containment
2016 (€m)
Type 1
CC Plan
(€m)
Type 2
CC Plan
(€m)
Type 3
CC Plan
(€m)
Total Cost
Containment
(€m)
Remaining
Deficit/(Surplus)
(€m)
Deficit/
(Surplus)
2016 (%)
Primary Care 1.42 0.79 0.77 0.00 1.56 (0.14) -0.2%
Social Inclusion 0.82 0.31 0.51 0.00 0.82 0.00 0.0%
Palliative Care (0.02) 0.00 0.00 0.00 0.00 (0.02) -0.1%
S/T (exc schemes) 2.22 1.09 1.28 0.00 2.38 (0.16) -0.1%
Local Schemes 0.00 0.00 0.00 0.00 0.00 0.00 0.0%
Primary Care Total 2.22 1.09 1.28 0.00 2.38 (0.16) -0.1%
Mental Health Total 2.55 0.16 0.20 0.00 0.36 2.19 3.0%
Older Persons 6.37 3.00 0.00 0.00 3.00 3.37 5.1%
Disability Services 11.11 0.50 2.78 0.00 3.28 7.83 5.3%
Social Care Total 17.48 3.50 2.78 0.00 6.28 11.20 5.2%
Totals 22.24 4.75 4.26 0.00 9.01 13.24 2.8%
The types of cost containments can be summarised as follows:
Type 1 - cost reduction driven by improved practices and targeted cost reductions, particularly in Agency, Overtime, Paybill and Non Pay
Type 2 - reduction in service delivery Type 3 - additional sanctioned spend The 2016 allocation includes funding for cost increases arising from the Lansdowne Road Agreement and for the
rollover of funded 2015 service developments, such as Sleepover monies and School leavers in Disability settings as
well as Demand Led Scheme growth and Paediatric Home Care Packages in Primary Care.
No funding has been provided for increments, the additional day in 2016, or other pay/non pay cost pressures over
which CHO7 has limited control. Where possible, these increases will require re-allocation from existing resources to
prevent the emergence of deficits.
CHO7 is fully committed to delivering efficiencies where possible, whilst acknowledging the requirement to continue to
provide safe and effective services to a growing and ageing population. The above financial summary reinforces the
inherent financial risk associated with the current budgetary allocation for CHO7.
Primary Care Financial Framework
The National Service Plan 2016 sets out the details of the primary care budget of €3,624.4m for 2016, which is an increase of 5.55% on the Budget for 2015.
In January 2016, Primary Care Division advised CHO7 of its 2016 Statutory services Budget as follows:
19
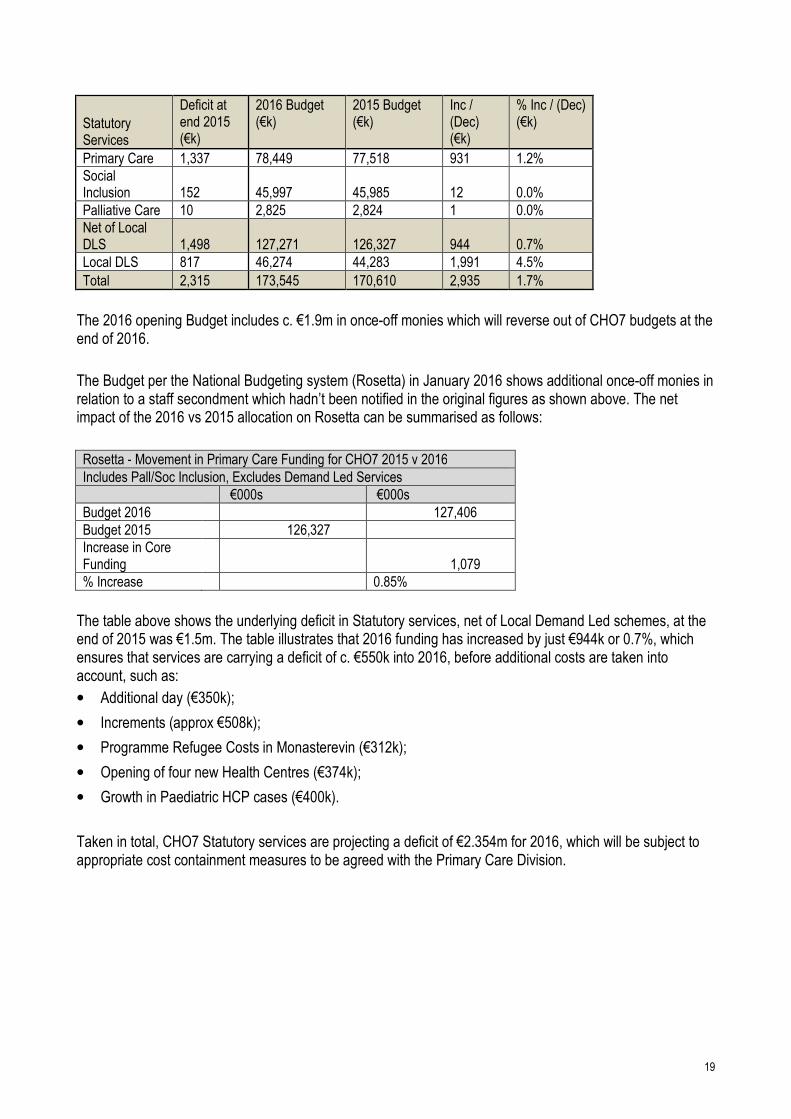
Statutory Services
Deficit at end 2015 (€k)
2016 Budget (€k)
2015 Budget (€k)
Inc / (Dec) (€k)
% Inc / (Dec) (€k)
Primary Care 1,337 78,449 77,518 931 1.2%
Social Inclusion 152 45,997 45,985 12 0.0%
Palliative Care 10 2,825 2,824 1 0.0%
Net of Local DLS 1,498 127,271 126,327 944 0.7%
Local DLS 817 46,274 44,283 1,991 4.5%
Total 2,315 173,545 170,610 2,935 1.7%
The 2016 opening Budget includes c. €1.9m in once-off monies which will reverse out of CHO7 budgets at the end of 2016.
The Budget per the National Budgeting system (Rosetta) in January 2016 shows additional once-off monies in relation to a staff secondment which hadn’t been notified in the original figures as shown above. The net impact of the 2016 vs 2015 allocation on Rosetta can be summarised as follows:
Rosetta - Movement in Primary Care Funding for CHO7 2015 v 2016
Includes Pall/Soc Inclusion, Excludes Demand Led Services
€000s €000s
Budget 2016 127,406
Budget 2015 126,327
Increase in Core Funding 1,079
% Increase 0.85%
The table above shows the underlying deficit in Statutory services, net of Local Demand Led schemes, at the end of 2015 was €1.5m. The table illustrates that 2016 funding has increased by just €944k or 0.7%, which ensures that services are carrying a deficit of c. €550k into 2016, before additional costs are taken into account, such as:
• Additional day (€350k);
• Increments (approx €508k);
• Programme Refugee Costs in Monasterevin (€312k);
• Opening of four new Health Centres (€374k);
• Growth in Paediatric HCP cases (€400k).
Taken in total, CHO7 Statutory services are projecting a deficit of €2.354m for 2016, which will be subject to appropriate cost containment measures to be agreed with the Primary Care Division.
20
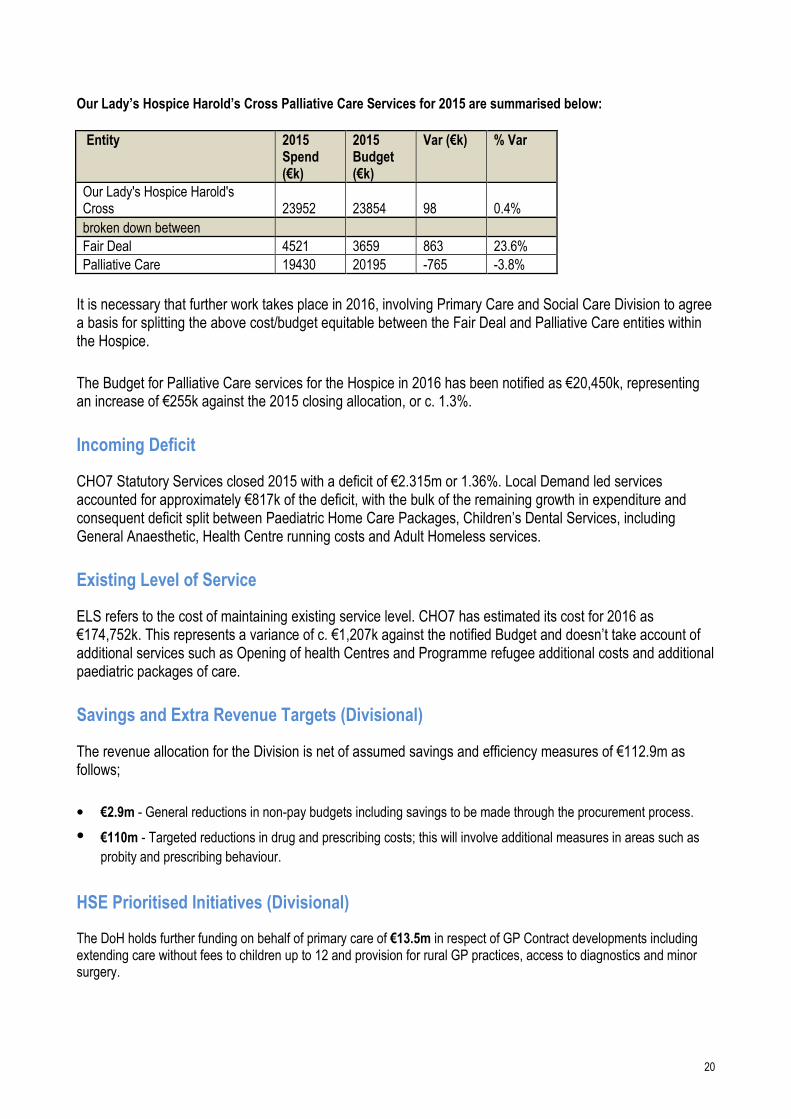
Our Lady’s Hospice Harold’s Cross Palliative Care Services for 2015 are summarised below:
Entity 2015
Spend (€k)
2015 Budget (€k)
Var (€k) % Var
Our Lady's Hospice Harold's Cross 23952 23854 98 0.4%
broken down between
Fair Deal 4521 3659 863 23.6%
Palliative Care 19430 20195 -765 -3.8%
It is necessary that further work takes place in 2016, involving Primary Care and Social Care Division to agree a basis for splitting the above cost/budget equitable between the Fair Deal and Palliative Care entities within the Hospice.
The Budget for Palliative Care services for the Hospice in 2016 has been notified as €20,450k, representing an increase of €255k against the 2015 closing allocation, or c. 1.3%.
Incoming Deficit
CHO7 Statutory Services closed 2015 with a deficit of €2.315m or 1.36%. Local Demand led services accounted for approximately €817k of the deficit, with the bulk of the remaining growth in expenditure and consequent deficit split between Paediatric Home Care Packages, Children’s Dental Services, including General Anaesthetic, Health Centre running costs and Adult Homeless services.
Existing Level of Service
ELS refers to the cost of maintaining existing service level. CHO7 has estimated its cost for 2016 as €174,752k. This represents a variance of c. €1,207k against the notified Budget and doesn’t take account of additional services such as Opening of health Centres and Programme refugee additional costs and additional paediatric packages of care.
Savings and Extra Revenue Targets (Divisional)
The revenue allocation for the Division is net of assumed savings and efficiency measures of €112.9m as follows;
• €2.9m - General reductions in non-pay budgets including savings to be made through the procurement process.
• €110m - Targeted reductions in drug and prescribing costs; this will involve additional measures in areas such as
probity and prescribing behaviour.
HSE Prioritised Initiatives (Divisional) The DoH holds further funding on behalf of primary care of €13.5m in respect of GP Contract developments including extending care without fees to children up to 12 and provision for rural GP practices, access to diagnostics and minor surgery.

21
Pay and Pay Related Savings (Divisional) The Division commenced the implementation of a plan for the conversion of agency in 2015 and this will continue in 2016. In line with Pay Bill Management Policy, the replacement of existing posts will be dependent on individual CHO being able to deliver its planned services within allocated funding.
Financial Risk Areas In 2016 all services will be required to operate within the notified Budget.
For CHO7, this has been estimated as representing a financial challenge of €2.354m. There is a requirement for some restructuring of Budgets between services, however the significant deficits as broken down by service is as follows:
• Health Centres - €846k;
• Adult Homeless - €820k;
• Paediatric packages - €591k;
• Childrens Dental Services - €285k.
Some of these deficits areas are offset by surpluses in General Primary Care services and Adult Dental Services and will be part of a process of budget re-alignment in 2016.
Mental Health Financial Framework
• MHD have notified a Budget figure for 2016 of €73.036m. This includes an amount of €1.9m for Developments posts brought forward from planned developments in 2013/2014, leaving a net Budget figure of €71.130m. When taking account of other net additions/changes in 2016 of €125k, the notified brought forward base budget for 2016 is €71.005m. This compares to an opening base figure for 2016 on the national Rosetta system of €71.201m.
• Expenditure on MH services in 2015, excluding Once-offs, amounted to €71.798m. When compared to the starting net Budget for 2016 of €71.130m, this equates to an opening deficit of €0.668m.
• Expenditure in 2016 is set to rise on foot of expenditure trend increases during 2015. This increase resulted from significant pressures in our Lakeview Acute unit which regularly operated beyond safe capacity, thereby resulting in the requirement for placements to 3rd Part service providers. We estimate the deficit under this heading to be in the region of €1.3m for 2015.
• Other significant cost drivers include Nursing costs in Lakeview as well as Medical Agency costs in Mid West, Mid East and North East Community settings. Persistent difficulties in recruiting staff to services have hampered our ability to reduce Agency costs in any significant manner
• CHO7 is likely to likely to be showing a deficit of c. €2.6m in 2016. This is largely within the Kildare West Wicklow service which has been shown to be consistently under resourced in MHD comparatives. A strategy to manage both financial and service risk is being agreed with the Mental Health Division.
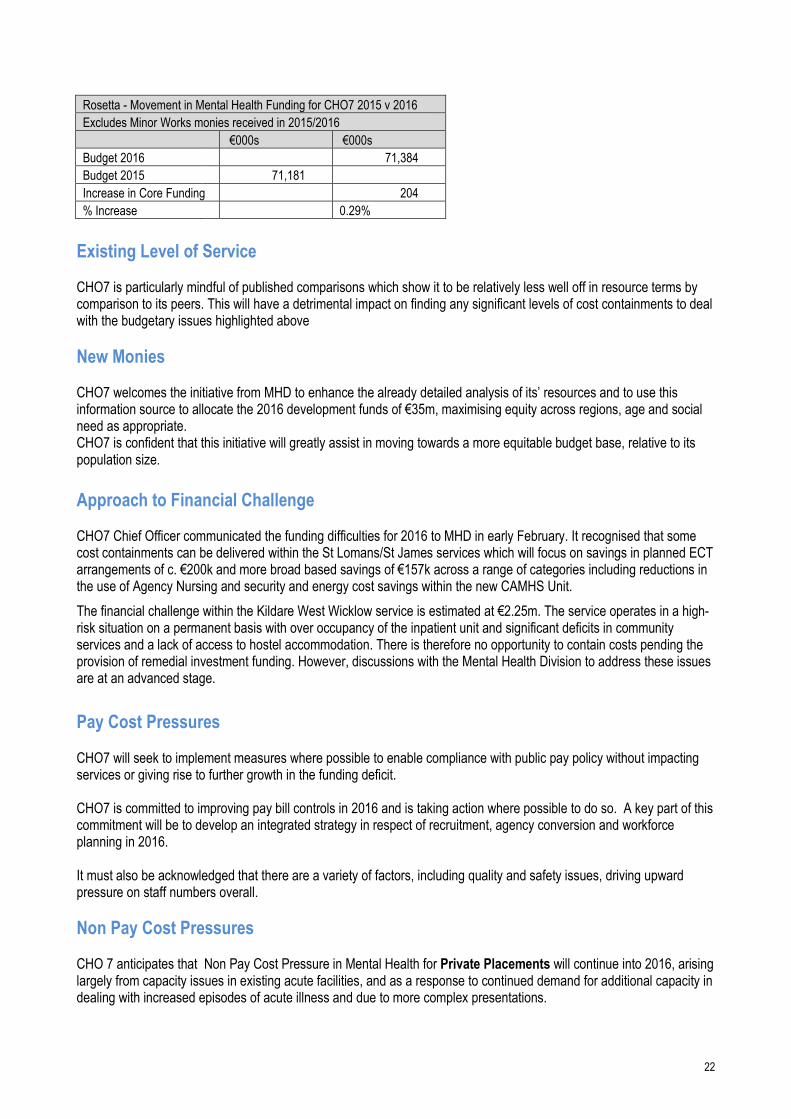
A Summary of the movement in the Mental Health funding position as at Jan 2016 on the national Budgeting system
(Rosetta) shows that the net Budget between 2015 and 2016, when taking account of once-off Minor Capital works
monies received across year-end, increased by €204k, or 0.29%.
There are additional adjustments to be received on Rosetta, which will amend this figure over the course of 2016,
including Development posts monies of €1.9m
22
Rosetta - Movement in Mental Health Funding for CHO7 2015 v 2016
Excludes Minor Works monies received in 2015/2016
€000s €000s
Budget 2016 71,384
Budget 2015 71,181
Increase in Core Funding 204
% Increase 0.29%
Existing Level of Service CHO7 is particularly mindful of published comparisons which show it to be relatively less well off in resource terms by comparison to its peers. This will have a detrimental impact on finding any significant levels of cost containments to deal with the budgetary issues highlighted above
New Monies CHO7 welcomes the initiative from MHD to enhance the already detailed analysis of its’ resources and to use this information source to allocate the 2016 development funds of €35m, maximising equity across regions, age and social need as appropriate. CHO7 is confident that this initiative will greatly assist in moving towards a more equitable budget base, relative to its population size.
Approach to Financial Challenge CHO7 Chief Officer communicated the funding difficulties for 2016 to MHD in early February. It recognised that some cost containments can be delivered within the St Lomans/St James services which will focus on savings in planned ECT arrangements of c. €200k and more broad based savings of €157k across a range of categories including reductions in the use of Agency Nursing and security and energy cost savings within the new CAMHS Unit.
The financial challenge within the Kildare West Wicklow service is estimated at €2.25m. The service operates in a high-risk situation on a permanent basis with over occupancy of the inpatient unit and significant deficits in community services and a lack of access to hostel accommodation. There is therefore no opportunity to contain costs pending the provision of remedial investment funding. However, discussions with the Mental Health Division to address these issues are at an advanced stage.
Pay Cost Pressures CHO7 will seek to implement measures where possible to enable compliance with public pay policy without impacting services or giving rise to further growth in the funding deficit. CHO7 is committed to improving pay bill controls in 2016 and is taking action where possible to do so. A key part of this commitment will be to develop an integrated strategy in respect of recruitment, agency conversion and workforce planning in 2016. It must also be acknowledged that there are a variety of factors, including quality and safety issues, driving upward pressure on staff numbers overall.
Non Pay Cost Pressures CHO 7 anticipates that Non Pay Cost Pressure in Mental Health for Private Placements will continue into 2016, arising largely from capacity issues in existing acute facilities, and as a response to continued demand for additional capacity in dealing with increased episodes of acute illness and due to more complex presentations.

23
Savings and Efficiency Measures - €2.5m The MHD revenue allocation for 2016 is net of assumed savings and efficiency measures of €2.5m. CHO7 shares in these savings as follows:
• €23k – general reductions in non-pay budgets including savings to be made through the procurement process.
• €119k - additional Value for Money / Efficiency Savings needed to cover our share of a national fund to support
Integrated Care Programmes (€9m), Quality Improvement and Assurance Initiatives (€3m) and support for
CHOs/HGs (€1.2m) which benefit all service users.
Income Focus Income – CHO7 will ensure compliance with the 2011 Health (Charges for In-Patient Services) Regulations and the National Guidelines for Long Stay Charges.
Financial Risk Areas
In identifying potential risks to the delivery of the Financial Plan, it is acknowledged that while every effort will be made to mitigate these risks, it may not be possible to eliminate them in full. These financial risks largely resulting from increased demand for services, increased regulatory requirements and staff recruitment and retention issues are outlined in the previous Risks section of this plan.
Community Costing The Chief Officer will:
• Ensure that the CHO 7 has a robust approach to costing services and cycles of care in order to fully inform commissioning of services and the objective allocation of resources.
• Ensure that there is robust financial analysis to allow a better understanding of the drivers of costs. This will allow better forecasting of future costs and improved service reports.
CHO 7 will support the divisional work on this initiative in maximising the evidence base for improved resource allocation methods and approaches for deployment of mental health resources.
Finance Work Plan A specific emphasis by the HSE throughout 2016 will be on standardising and streamlining finance processes, with an initial focus on service arrangements and invoice payments and progressing ledger alignment, to facilitate a common understanding and to support financial performance management. CHO 7 acknowledges the requirement to operate within the limits of the funding notified to it and will ensure this receives the very significant management focus required in 2016. Given the scale of the demographic, regulatory and other service pressures, there is a substantial financial risk being managed within this plan. In the context of the Accountability Framework, particular attention will be focused on driving financial performance across the CHOs in light of the scale of the financial challenge.
2016 CHO7 MH Allocation (Notified)

24
All figures are in (€000's)
2014 Actual Net Spend
2015 Proj Spend Ongoing Services
2015 MW OO
2015 NMW OO
2015 Proj Tot
2016 Op Bud
2013/2014 Dev Posts
2016 Closing Bud (Notified Allocation)
CHO7 68,532 71,798 435
328 72,561 70,974 1,906 72,880

25
Social Care Financial Framework Social Care - Allocation (National) The national Social Care allocation for 2016 is €3,201.5m representing an increase of €104.8m or 3.3% on the projected outturn 2015. Whilst continuing efforts will be made to reform and improve services based on existing values with service users at the centre of all decision making, there will also be a focus on the cost and sustainability of services while ensuring at all times that services are delivering best value for money for the public and service users. The additional €104.8m funding is welcome, however, the challenge for 2016 is Social Care’s capacity to meet the increasing demand of an ageing population, together with changing needs and an increasing number of people with a disability with more complex service requirements. Demand for services continues to increase as the population of 65 years and over will increase by 3.1% between 2015 and 2016, equating to an additional 19,400 people. The population 85 years and over (which places the largest pressure on services) is growing at a rate of 4.2% between 2015 and 2016.
Budget Framework 2016
TABLE 2
Disabilities Older Persons
NHSS Total Social Care
Opening Base Allocation 2016 1,461.1 657.8 873.9 2,992.8
2015 Additional Base Funding
HIQA Cost Pressures 45.5 45.5
Non-Pay Clinical 0.0 5.0 5.0
Subtotal 2015 Additional Base Funding 45.5 5.0 0.0 50.5
2016 Existing Level of Service Funding
Pay Including Lansdowne Road Agreement (LRA)
LRA 11.9 3.4 15.3
PSPR and Other Pressures 0.7 0.3 1.0
LRC Recommendations 8.0 8.0
Subtotal Pay Including Lansdowne Road Agreement (LRA) 20.6 3.7 0.0 24.4
2016 Non Pay Funding
Non Pay 0.0 0.4 12.1 12.5
Non Pay – Therapy 2.0 2.0
Non Pay - School Leavers 6.0 6.0
Non Pay - Emergency Places 16.5 16.5
NHSS Demographics 0.0 14.7 14.7
Subtotal 2016 Non Pay Funding 24.5 0.4 26.8 51.7
Full Year Cost 2015 Commitments
ED - Winter Plan 6.8 6.8
Delayed Discharges 12.4 39.3 51.7
Subtotal Full Year Cost 2015 Commitments 0.0 19.2 39.3 58.5
2016 Existing Level of Service Funding 45.1 23.3 66.1 134.6
2016 Savings Measures
Cost Savings 2016 (0.2) (0.3) (0.5)
ADJ ICPs Other (1.6) (2.5) (4.1)
2016 Savings Measures (1.8) (2.8) 0.0 (4.6)
2016 Additional Funding Available for Existing Service
2016 Total Funding available for Existing Services 1,550.0 683.3 940.0 3,173.3
2016 New Initiatives
Disability School Leavers 7.3 7.3
Expansion of Respite Beds 1.0 1.0
2016 New Initiatives 8.3 0.0 0.0 8.3
2016 Net Determination 1,558.2 683.3 940.0 3,181.5
*Time related savings from Development Funding allocated once off 20.0 20.0
Total 2016 Net Determination 1,558.2 703.3 940.0 3,201.5

26
The cost of providing the existing services at the 2015 level will grow in 2016 due to a variety of factors including national pay agreements / public pay policy requirements, quality and safety requirements, regulatory requirements, unfunded emergency places, other clinical non pay costs, price rises etc. A total of €316.1m has been provided towards the expected growth in costs in 2016 of existing services for all HSE services, of this figure €130m has been provided for Social Care services, made up of €20.5m services for Older Persons, €66.1m NHSS and €43.4m Disability Services. The balance of 2016 expected cost growth is to be dealt with by way of additional savings and other financial measures. These measures will be specified by CHO and underpinned by a robust pay bill management strategy with a particular emphasis on agency conversion. In addition each CHO must implement a robust review mechanism for the appropriateness of current levels of Home Help/ Homecare Packages and Replacement Residential/Emergency Placements to establish the possibility of recycling hours/packages/places.
Table 2 above Budget Framework 2016 - sets out the budget allocations for Social Care in respect of 2016
Additional Base Funding and ELS for Social Care
• Additional recurring funding of €50.5m (€45.5m disability services, €5m services for older persons) has been
provided in respect of the 2015 base allocation this will assist the Social Care in addressing the unfunded costs
brought forward from 2015 with the balance to be dealt with by way of savings and other financial measures.
• A total of €58.5m has been provided in 2016 for the cost of initiatives commenced in 2015 which will have a full year
incremental cost in 2016, €6.8m has been allocated to the winter initiative and €51.7m for the Delayed Discharge
Initiative. Both initiatives are intended to alleviate pressures on the acute hospital system.
• €6m funding has been provided for the full year cost of 2015 school leavers and €2m for the full year cost of 2015
therapy posts.
• €16.5m is allocated for provision of full year costs of replacement of residential capacity and emergency places
approved by the HSE and commenced in 2015.
Pay Funding and ELS for Social Care
• €24.4m has been allocated to Social Care for both Statutory and Section 38 Providers to off-set the growth in pay
costs associated with the Lansdowne Road Agreement, Labour Relations Commission recommendations and other
pay pressures.
Non Pay Funding
• Additional funding of €26.8m has been provided to the Nursing Home Support Scheme, €14.7m for demographics
to continue to maintain the waiting time at no longer than 4 weeks, provided that the demand for the scheme
remains unchanged, €12.1m has been provided to deal NTPF awarded price increases for private nursing home
provision within the NHSS scheme.
New Initiatives
• School Leavers - Additional funding of €7.25m will be made available in 2016 for the provision of a day centre place
for approximately 1,500 young adults for persons with a disability who are exiting school or rehab training places. In
implementing this initiative, providers will be required to adhere to the principles of the New Directions.
• Home Respite Initiatives – an additional €1m has been allocated in 2016 for the development of community based
home respite initiatives within the disability sector.

27
• €8m is being held by the DoH for provision of therapeutic services for young people, including early intervention
teams and in particular speech and language therapy services. In line with Progressing Disability Services for
Children and Young Adults (0-18s Programme) €4m of this held funding is allocated for 75 new therapy posts. This
will assist with the significant programme of reconfiguration already underway within the service which will see the
creation of 129 Children’s Disability Network Teams. This initiative also includes an initiative to address waiting lists
for therapeutic services for children and young people – in particular speech and language therapy. €4m has been
provided for these initiatives in 2016 and detailed plans are being prepared in conjunction with Primary Care. Full
year funding for this initiative will be made available in 2017.
An important aspect of the budgetary framework for Social Care in 2016 is that approval has been given to utilise €20m in expected time related savings from the €58.5m new initiatives money held by the DoH to maintain 2015 outturn levels in Home Care and Transitional Care.
Approach to Financial Management 2016 (CHO7)
Financial Risk Areas - Disability Services (Statutory)
CHO7 has identified a significant financial challenge of €11.076m in Statutory Disability services in respect of maintaining existing levels of service and meeting commitments within the net revenue allocation notified for 2016 of €52,152k.
The challenge can be summarised as commencing from the 2015 closing deficit position of €6,100k as follows:
Breakdown of Deficit at end 2015 (€k)
Capitation 3,944
Grants 118
Statutory 2,039
Total 6,100
The working assumption is that a significant portion of once-off Budget monies in 2015, approximately €433k, reflect expenditure which will not recur in 2016. It equally follows that the 2016 Budget will be adjusted to return monies provided to the Voluntary services providers in error relating to school leavers monies provided in the base rollover in 2015 and again in 2016 in relation to the same cohort of service users.
Assuming the budgetary position on Rosetta, adjusted for school leavers monies to revert to CHO7 statutory services, equates to €52,152k for 2016, CHO7 expects to be in a deficit position by the end of 2016 of €11,076k, explained as follows:
Reconciliation of 2015 deficit to 2016 projected deficit
Deficit c/f from 2015 6,100
Run Rate increases impact in 2016 2,592
TUSLA Cases 1,176
New/Enhanced Placements 1,144
Own staff Increments 64
Total Deficit 11,076
The key approach to address the financial risk will be a measure of containments, including as follows
• review of existing emergency placements, c €500k;
28
• cessation of Agency/Private AON services, c. €400k;
• non actioning of TUSLA cases €1,176k;
• non actioning/paring back of critical emergency cases €1,200k
The above cost containments have the potential to reduce the potential deficit from c. €11.1m to €7.8m. Additional assistance has been sought from the Division in terms of securing an appropriate share of the €16m available nationally to deal with Emergency Placement costs. CHO7 recognises the need to operate within the planned cost level for 2016 in order for the HSE to deliver a balanced position, whilst also recognising the extremely limited scope to address the significant cost drivers with this health area.
Financial Risk Areas - Disability Services (Voluntary)
The tables below illustrate the relative budget movement for CHO7 Section 38 (Voluntary) agencies. The overarching assumption taken by CHO7 management is that each Agency will break even against its’ Budget, and the CHO will actively engage with each Agency in order to assist in doing so. Cheeverstown House has received an increase in allocation for 2016 of €379k over 2015 levels. The table below summarises the position per the National budgetary system (Rosetta). The 2016 budget is adjusted for a retraction of School Leavers funding of €22k, while the 2015 budget is adjusted for supplementary and one off funding of €392k received which was not carried into the 2016 allocation. The budget increase of €379k (1.66%) relates mainly to additional LRA funding €334k & School leavers funding of €72k, with a deduction of €28k for saving measures offsetting against these increases.
Cheeverstown - Movement in Funding for CHO7 2015 v 2016
Heading Comment €000s €000s
Budget 2016 After SL funding retraction of €22k 23,181
Budget 2015
After removing once-off funding in 2015 with no relation to 2016 costs, i.e., partial supplementary & Pensions
22,802
Increase in Core Funding 379
% Increase 1.66%
KARE has received an increase in allocation for 2016 of €588k over 2015 levels. The table below summarises the position per the National budgetary system (Rosetta). The 2016 budget is adjusted for a retraction of School Leavers funding of €147k, while the 2015 budget is adjusted for supplementary and one off funding of €140k received which was not carried into the 2016 allocation. The budget increase of €588k (3.55%) relates mainly to additional LRA funding €277k & School leavers funding of €332k with a deduction of €23k for saving measures offsetting against these increases.

29
KARE - Movement in Funding for CHO7 2015 v 2016
Heading Comment €000s €000s
Budget 2016 After SL funding retraction of €147k
17,158
Budget 2015
After removing once-off funding not carried into 2016 of partial supplementary & SL Capital
16,571
Increase in Core Funding 588
% Increase 3.55%
Peamount Disability services has received an increase in allocation for 2016 of €400k over 2015 levels. The table below summarises the position per the National budgetary system (Rosetta). The 2015 budget is adjusted for supplementary and once off funding of €695k received which was not carried into the 2016 allocation. The budget increase of €400k (3.32%) relates mainly to additional LRA funding €417k, with a deduction of €15k for saving measures offsetting against these increases.
Peamount (Disabilities) - Movement in Funding for CHO7 2015 v 2016
Heading Comment €000s €000s
Budget 2016 12,456
Budget 2015
After removing once-off funding not carried into 2016 of partial supplementary
12,056
Increase in Core Funding 400
% Increase 3.32%
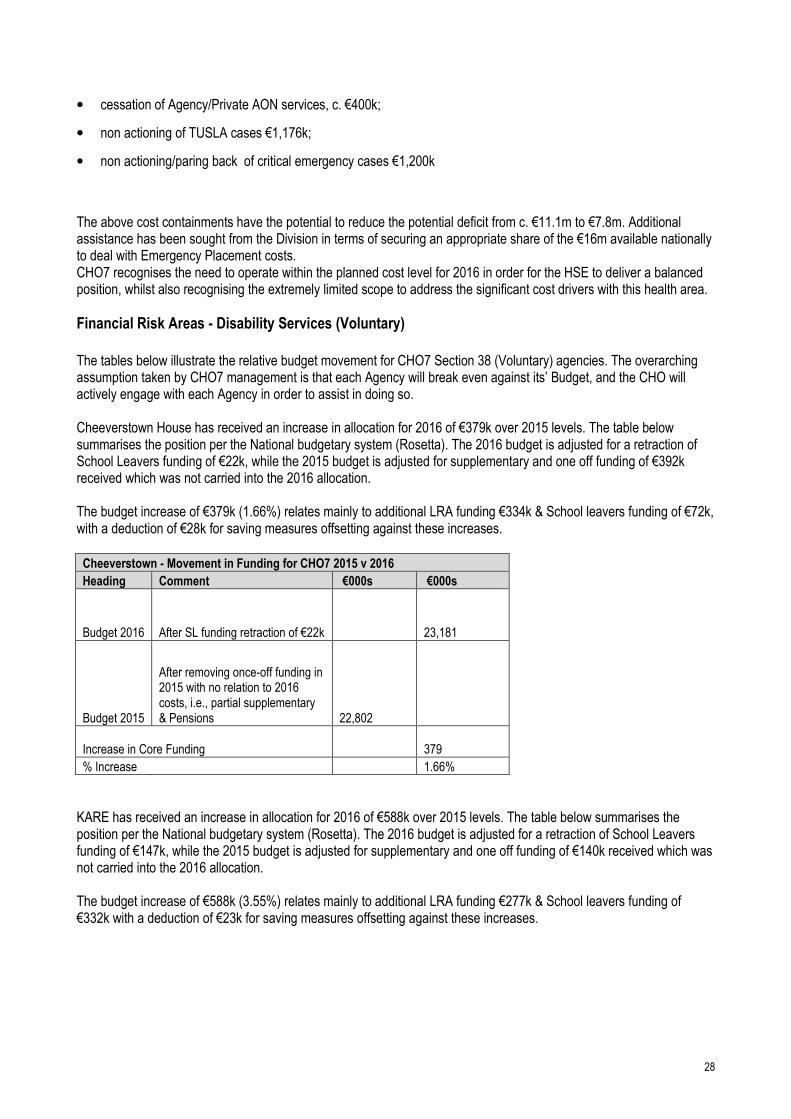
Stewarts Disability services has received an increase in allocation for 2016 of €1,138k over 2015 levels. The table below summarises the position per the National budgetary system (Rosetta). The 2016 budget is adjusted for a retraction of School Leavers funding of €228k, while the 2015 budget is adjusted for supplementary 2015 funding of €301k received which was not carried into the 2016 allocation. The budget increase of €1,138k (2.71%) relates mainly to additional LRA funding €702k & School leavers funding of €457k with a deduction of €56k for saving measures offsetting against these increases.
30
Stewarts - Movement in Funding for CHO7 2015 v 2016
Heading Comment €000s €000s
Budget 2016
After SL funding retraction of €228k
43,134
Budget 2015
After removing once-off funding not carried into 2016 of partial supplementary & SL Capital
41,995
Increase in Core Funding 1,138
% Increase 2.71%
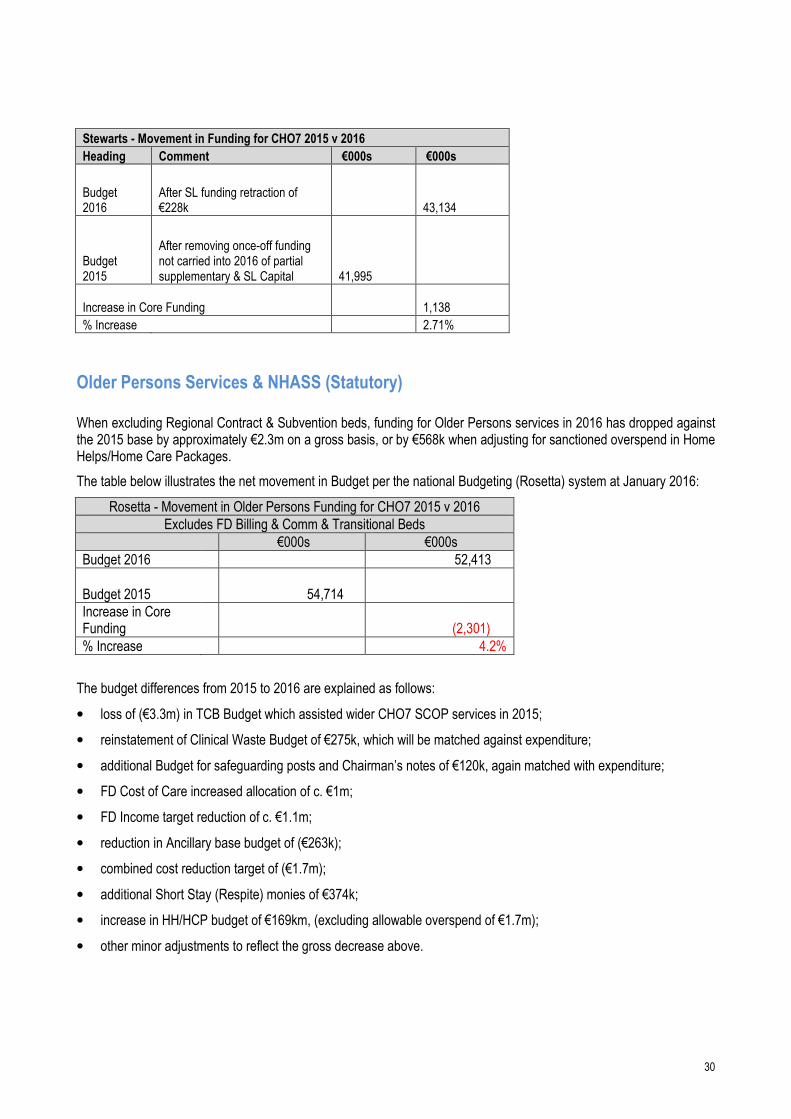
Older Persons Services & NHASS (Statutory) When excluding Regional Contract & Subvention beds, funding for Older Persons services in 2016 has dropped against the 2015 base by approximately €2.3m on a gross basis, or by €568k when adjusting for sanctioned overspend in Home Helps/Home Care Packages.
The table below illustrates the net movement in Budget per the national Budgeting (Rosetta) system at January 2016:
Rosetta - Movement in Older Persons Funding for CHO7 2015 v 2016
Excludes FD Billing & Comm & Transitional Beds
€000s €000s
Budget 2016 52,413
Budget 2015 54,714
Increase in Core Funding (2,301)
% Increase 4.2%
The budget differences from 2015 to 2016 are explained as follows:
• loss of (€3.3m) in TCB Budget which assisted wider CHO7 SCOP services in 2015;
• reinstatement of Clinical Waste Budget of €275k, which will be matched against expenditure;
• additional Budget for safeguarding posts and Chairman’s notes of €120k, again matched with expenditure;
• FD Cost of Care increased allocation of c. €1m;
• FD Income target reduction of c. €1.1m;
• reduction in Ancillary base budget of (€263k);
• combined cost reduction target of (€1.7m);
• additional Short Stay (Respite) monies of €374k;
• increase in HH/HCP budget of €169km, (excluding allowable overspend of €1.7m);
• other minor adjustments to reflect the gross decrease above.
31
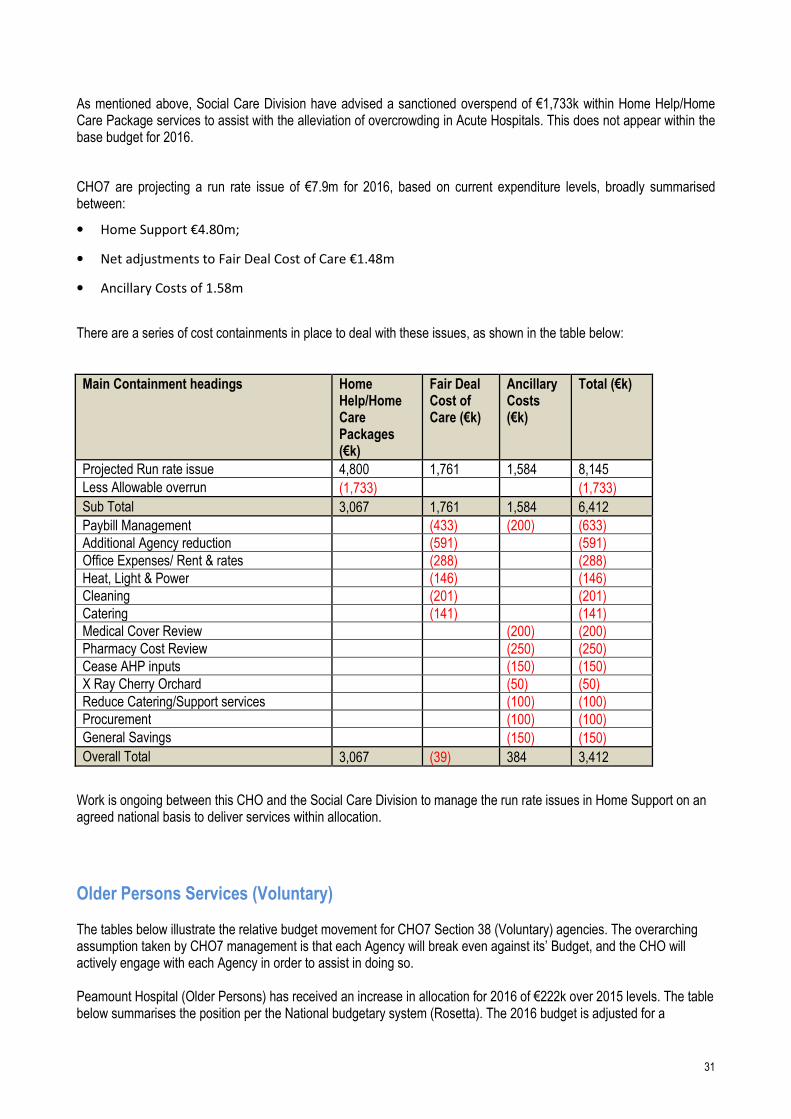
As mentioned above, Social Care Division have advised a sanctioned overspend of €1,733k within Home Help/Home Care Package services to assist with the alleviation of overcrowding in Acute Hospitals. This does not appear within the base budget for 2016.
CHO7 are projecting a run rate issue of €7.9m for 2016, based on current expenditure levels, broadly summarised between:
• Home Support €4.80m;
• Net adjustments to Fair Deal Cost of Care €1.48m
• Ancillary Costs of 1.58m
There are a series of cost containments in place to deal with these issues, as shown in the table below:
Main Containment headings Home Help/Home Care Packages (€k)
Fair Deal Cost of Care (€k)
Ancillary Costs (€k)
Total (€k)
Projected Run rate issue 4,800 1,761 1,584 8,145
Less Allowable overrun (1,733) (1,733)
Sub Total 3,067 1,761 1,584 6,412
Paybill Management (433) (200) (633)
Additional Agency reduction (591) (591)
Office Expenses/ Rent & rates (288) (288)
Heat, Light & Power (146) (146)
Cleaning (201) (201)
Catering (141) (141)
Medical Cover Review (200) (200)
Pharmacy Cost Review (250) (250)
Cease AHP inputs (150) (150)
X Ray Cherry Orchard (50) (50)
Reduce Catering/Support services (100) (100)
Procurement (100) (100)
General Savings (150) (150)
Overall Total 3,067 (39) 384 3,412
Work is ongoing between this CHO and the Social Care Division to manage the run rate issues in Home Support on an agreed national basis to deliver services within allocation.
Older Persons Services (Voluntary) The tables below illustrate the relative budget movement for CHO7 Section 38 (Voluntary) agencies. The overarching assumption taken by CHO7 management is that each Agency will break even against its’ Budget, and the CHO will actively engage with each Agency in order to assist in doing so. Peamount Hospital (Older Persons) has received an increase in allocation for 2016 of €222k over 2015 levels. The table below summarises the position per the National budgetary system (Rosetta). The 2016 budget is adjusted for a

32
retraction of School Leavers funding of €22k, while the 2015 budget is adjusted for supplementary and one off funding of €779k received which was not carried into the 2016 allocation. The budget increase of €222k (2.88%) relates mainly to additional LRA funding €258k with net adjustments of €36k offsetting against these increases.
Peamount (Older Persons) - Movement in Funding for CHO7 2015 v 2016
Heading Comment €000s €000s
Budget 2016
7,934
Budget 2015
After retracting once-off monies of €c.€779k provided in 2015 for backdated Fair Deal
7,712
Increase in Core Funding 222
% Increase 2.88%
Our Lady’s Hospice (Older Persons) has received an increase in allocation for 2016 of €4k over 2015 levels. The table below summarises the position per the National budgetary system (Rosetta). The budget increase of €4k (0.12%) relates mainly to ELS Pay pressures.
OLH (Older Persons) - Movement in Funding for CHO7 2015 v 2016
Heading Comment €000s €000s
Budget 2016
3,663
Budget 2015
3,659
Increase in Core Funding 4
% Increase 0.12%
33
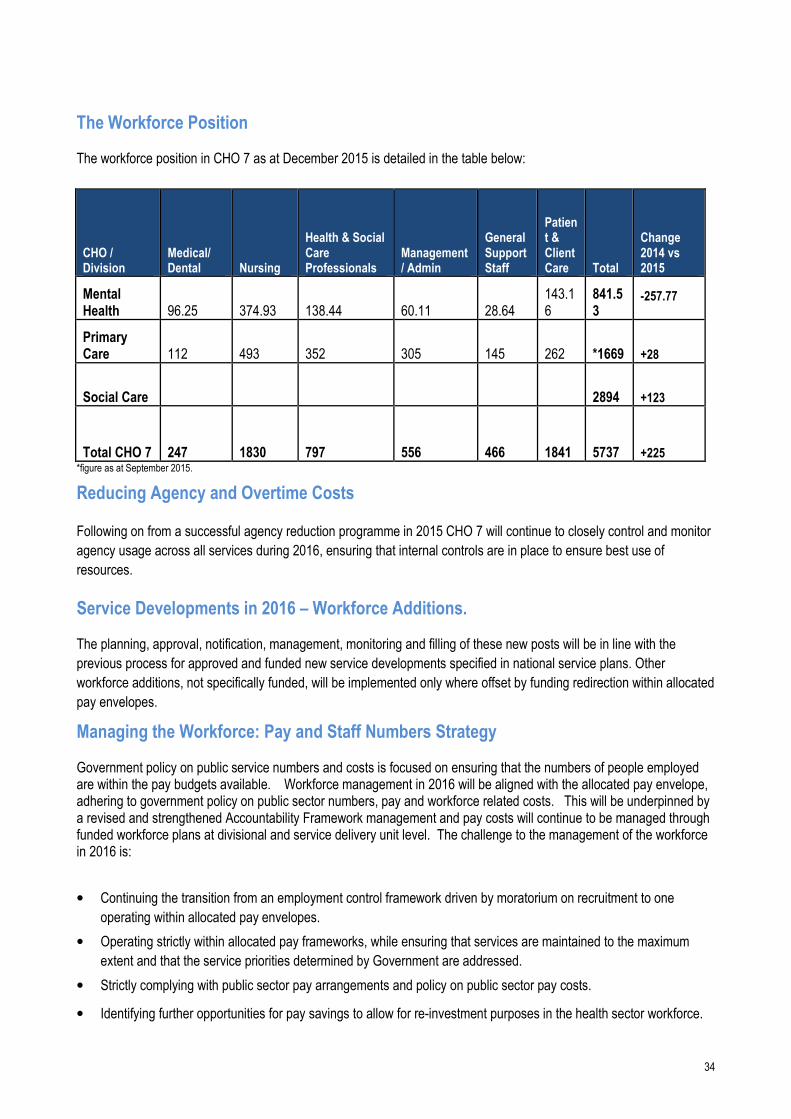
The Workforce Position The health sector’s workforce is at the core of the delivery of healthcare services working within and across all care
settings in communities, hospitals and healthcare offices. Staff are central to the improvement in patient care,
productivity and performance. A culture of compassionate care and a sense of belonging among staff will create and
embed an organisation-wide approach to delivering a high quality, effective and safe service to our patients and clients.
The health service will continue to nurture, support and develop a workforce that is dedicated to excellence, welcomes
change and innovation, embraces leadership and teamwork, fosters inclusiveness and diversity and maintains
continuous professional development and learning.
The People Strategy 2015–2018 has been developed in recognition of the vital role the workforce plays in delivering
safer and better healthcare. The strategy is underpinned by its commitment to engage, develop, value and support the
workforce.
Recruiting and retaining motivated and skilled staff remains paramount for the delivery of health services delivered every day to an increasing and changing demographic population. This challenge is even greater now as the Health Reform Programme requires significant change management, organisation redesign and organisational development support.
CHO 7 expects to complete the establishment of its Management Team in Q1 2016. This will include the filling the post
of Head of Human Resources (HR). The Head of HR will play a key role in leading work across all divisions to provide
a workforce which is responsive, flexible and adaptable to meet the ever changing needs within the health services.
The Head of HR will actively contribute to the delivery of patient/client centred services and will play a key role in
supporting and directing the CHO towards the achievement of the service’s objectives.
CHO 7 will further develop structures and processes related to Human Resource Management in line with current
ongoing Divisional structural changes and the HSE People Strategy 2015-2018.
CHO 7 is committed to developing the competencies and skills of its entire workforce. In particular there will be a focus
on the Leadership Development Programme and Performance as it will be critical to support new emerging senior teams
and to build managerial capacity in the context of a rapidly changed and evolving health service with new structures and
integration of statutory and voluntary agencies.
Staff Engagement An engaged and motivated workforce delivers better patient outcomes. It is only by listening to the views and experiences of staff that improvements to the health service, as a place to work, can be delivered. The messages from the first staff survey conducted in late 2014 have been identified and will need to be addressed. The next staff survey will be conducted in mid 2016.
Employee engagement is a core and central theme to the People Strategy 2015–2018 with a focus on developing mechanisms for more effective internal communications to support listening and learning across the whole sector, involving staff more in planning and decision-making and enabling them to propose and act on their ideas to improve the quality of care. This includes ensuring staff have the space to discuss their professional and career aspirations with their managers and that these engagements will inform learning and development.
34
The Workforce Position The workforce position in CHO 7 as at December 2015 is detailed in the table below:
CHO / Division
Medical/ Dental Nursing
Health & Social Care Professionals
Management/ Admin
General Support Staff
Patient & Client Care Total
Change 2014 vs 2015
Mental Health 96.25 374.93 138.44 60.11 28.64
143.16
841.53
-257.77
Primary Care 112 493 352 305 145 262 *1669 +28
Social Care 2894 +123
Total CHO 7 247 1830 797 556 466 1841 5737 +225 *figure as at September 2015.
Reducing Agency and Overtime Costs
Following on from a successful agency reduction programme in 2015 CHO 7 will continue to closely control and monitor
agency usage across all services during 2016, ensuring that internal controls are in place to ensure best use of
resources.
Service Developments in 2016 – Workforce Additions. The planning, approval, notification, management, monitoring and filling of these new posts will be in line with the
previous process for approved and funded new service developments specified in national service plans. Other
workforce additions, not specifically funded, will be implemented only where offset by funding redirection within allocated
pay envelopes.
Managing the Workforce: Pay and Staff Numbers Strategy Government policy on public service numbers and costs is focused on ensuring that the numbers of people employed are within the pay budgets available. Workforce management in 2016 will be aligned with the allocated pay envelope, adhering to government policy on public sector numbers, pay and workforce related costs. This will be underpinned by a revised and strengthened Accountability Framework management and pay costs will continue to be managed through funded workforce plans at divisional and service delivery unit level. The challenge to the management of the workforce in 2016 is:
• Continuing the transition from an employment control framework driven by moratorium on recruitment to one
operating within allocated pay envelopes.
• Operating strictly within allocated pay frameworks, while ensuring that services are maintained to the maximum
extent and that the service priorities determined by Government are addressed.
• Strictly complying with public sector pay arrangements and policy on public sector pay costs.
• Identifying further opportunities for pay savings to allow for re-investment purposes in the health sector workforce.
35
Paybill Management Pay and Staffing Controls will be enhanced in 2016. Service Delivery Units will be required to submit monthly written assurance and exception reports in respect of ‘starters and leavers’. Detailed challenges to any upward movements will be instigated with a view to eliminating further employment growth unless specifically funded in additional 2016 monies. There will be a focus on continued agency conversion and the elimination of further unfunded growth. There may be a need for targeted WTE reductions in 2016 to offset the full year costs of 2015 recruitment if operating outside of the allocated pay envelope.
The discretion now being provided in managing the workforce presents potentially greater and different management challenges. Service managers will have to focus on stretching pay expenditure to deliver optimal hourly labour costs and optimising the capacity and capability of their workforce, while strictly adhering to the pay envelope. This requires an integrated approach, with service management being supported by HR and finance. It further requires finance and HR workforce data, monitoring, and reporting to be aligned.
The 2013 Incentivised Career Break Scheme of up to three years duration concludes at the start of July 2016 and the re-integration of experienced employees, where they wish to return to public health sector employment, will be managed centrally by HBS.
The Lansdowne Road Public Service Stability Agreement 2013–2018 The Lansdowne Road Agreement, concluded in May 2015, between government and public sector unions represents an extension of the Haddington Road Agreement (HRA) until 2018. A key additional factor in the agreement is a strengthened oversight and governance arrangement for dealing with matters of implementation and interpretation in respect of disputes that may arise.
The key enablers, such as additional working hours, that existed under the HRA up to now will remain for the duration of the extended agreement and will continue to assist clinical and service managers to manage their workforce through the flexibility measures contained. These enablers will support the reform, reconfiguration and integration of services and contribute to delivering a workforce that is more adaptable, flexible and responsive to needs of the services, while operating with lower pay expenditure costs and within allocated pay envelopes.
The HRA continues to provide the necessary enablers to allow for:
• Workforce practice changes
• Reviews of rosters, skill-mix and staffing levels.
• Increased use of productivity measures
• Use of redeployment mechanisms
• Greater use of shared services and combined services focused on cost effectiveness and cost efficiencies.
Attendance and Absence Management This continues to be a key priority area for CHO 7 and robust attendance management programme is in place and will continue during 2016. The performance target for 2016 remains at < 3.5% staff absence rate.
Employee Engagement CHO 7 Human Resources will develop a Staff Engagement Action Plan during 2016. CHO 7 will to develop mechanisms for more effective communications.

36
European Working Time Directive CHO 7 is committed to maintaining and progressing compliance with the requirement of the European Working Time Directive for both NCHDs and staff in the social care sector. CHO 7 have established a local verification forum to achieve EWTD compliance.
Health and Safety at Work CHO 7 will continue to comply with the Safety, Health and Welfare at Work Act, 2015, by continuing to work in
partnership with HSE Occupational Health Department, HSE Health and Safety Advisors, HSE Employee Assistance
Programme and HSE Employee Relations.
Health Services People Strategy 2015 – 2018 Leaders in People Services CHO 7 welcomes the development of the Health Services People Strategy 2015 – 2018 Leaders in People Services and
will endeavour to meet its objectives, within funded budget. The People Strategy will result in improved performance,
workforce optimisation and a learning organisation delivering the overall goal of safer better healthcare system.
HR Indicators of Performance
HR Expected Activity / Target 2016
Absence
• % of absence rates by staff category ≤ 3.5%
Staffing Levels and Costs
• % variation from funded staffing thresholds ≤ 0.5%
Compliance with European Working Time Directive (EWTD)
• < 24 hour shift (Acute and Mental Health) 100%
• < 48 hour working week (Acute and Mental Health) 95%
Health and Safety
• No. of calls that were received by the National Health and Safety Helpdesk during the quarter 15% increase

37
Accountability Framework. Governance & Accountability. The HSE is the statutory body tasked with the responsibility for the delivery of health and personal social care services in Ireland. In discharging its public accountabilities, the HSE has in place a Governance Framework covering corporate, clinical and financial governance. While the HSE’s primary accountability is to the Minister for Health, it has a range of other accountability obligations to the Oireachtas and to its Regulators. The HSE recognises the critical importance of good governance and of continually enhancing its accountability arrangements. In this regard, and in the context of the establishment of the Hospital Groups and Community Healthcare Organisations, the HSE is strengthening its accountability arrangements and is putting in place a new Accountability Framework. In implementing the HSE’s Accountability Framework 2016 the National Performance Oversight Group seeks
assurance, on behalf of the Director General, that the National Directors of the Divisions are delivering against priorities
and targets set out in the Service Plan and in the Performance Agreements 2016.
The performance indicators against which Divisional performance is monitored are set out in the Balance Score Cards
grouped under Access, Quality, Finance and People. The key performance indicators are also included in the individual
Performance Agreements between the Director General and the National Director.
Performance against the Balanced Scorecards is reported in the monthly published Performance Report. Where the
data indicates underperformance in service delivery against targets and planned levels of activity, the National
Performance Oversight Group explores this with the relevant National Director at the monthly performance meeting and
seeks explanations and remedial actions where appropriate to resolve the issue.
As part of the Accountability Framework an Escalation and Intervention process has been developed and implemented.
The Escalation and Intervention Framework sets clear thresholds for intervention for a number of priority Key
Performance Indicators and a rules-based process for escalation at a number of different levels.
Accountability Levels The implementation of the new CHO structure and the development of CHO 7 within this structure will see significant
reconfiguration in 2016 that will impact on governance and accountability across all services. CHO 7 has a governance
and accountability structure that spans both the ISA structure and the new CHO structure:
• CHO 7 is managed by the Chief Officer, who has established an interim Management Team, to support the
delivery of services across the CHO. This team meets monthly and is chaired by the Chief Officer;
• Dublin South West/Kildare West Wicklow and Dublin South Central ISA’s are managed by an Area Manager and
each has an Area Management Team which meets on a monthly basis chaired by the Area Manager;
• Each ISA operates reporting structures in the Area across all services, Primary Care, Social Care, Mental Health
and Health and Wellbeing Services, with Managers of these services reporting to the Area Manager;
• Service Managers and Heads of Disciplines report to the Managers of our services, who in turn have service
delivery teams within each service that report into them;

38
• Funded organisations are accountable under the Service Arrangements and are monitored through IMR and
Service Arrangement meetings. Financial accounts and reports are submitted and reviewed.
Accountability Suite (Plans, Agreements and Reports) There are a number of documents that form the basis of the Accountability Framework.
• The Corporate Plan 2015-2017 is the 3 year strategic Plan for the Health Service.
• The National Service Plan sets out prospectively the performance commitments of the HSE. It describes the type
and volume of services which will be provided within the funding provided by Government. This Plan serves as the
Contract between the HSE and the Minister for Health, against which the performance of the HSE is measured.
• Operational Plans are prepared for each of the HSE’s service Divisions. These detailed plans, together with the
Divisional component of the National Service Plan are the basis against which the performance of each National
Director and their Division are measured and reported.
Performance Agreements During 2016 the monitoring and management of these plans will be further strengthened through the formal
Performance Agreements which explicitly link accountability for the delivery of the HSE’s Plans to managers at each
level of the organisation.
• The National Director Performance Agreement will be between the Director General and National Directors. (i.e.
Acute Hospitals, Primary Care, Social Care, Mental Health, Health and Wellbeing and the National Ambulance
Service).
• The Hospital Group CEO Performance Agreement will be between the National Director Acute Hospitals and each
Hospital Group CEO.
• A single CHO Chief Officer Performance Agreement (covering all community services Divisions) will be put in place
between the four National Directors for Primary Care, Social Care, Mental Health and Health and Wellbeing and
each of the CHO Chief Officers.
• Performance Agreements at each level, while linked to specific Divisions and service organisations, will also set out
expectations in relation to integration priorities and cross boundary working.
The Executive Management Committee (EMC) for Community HealthCare, comprising the four National Directors (i.e.
Primary Care, Social Care, Mental Health, Health and Wellbeing) established in 2015 will continue in its current form in
2016. During 2015 the National Director for Social Care was appointed by the Director General to chair the Committee.
These arrangements will remain in place in 2016 and be updated as relevant.
It is at this Forum that each CHO Chief Officer is held to account and the Committee is expected to oversee community
services performance in a coordinated way. Individual National Directors and their teams will continue to have ongoing
interactions with the CHO Chief Officers and their teams in the normal course of the business of each Division. In this
context National Directors will continue to hold their Divisional meetings with each CHO in discharging their delegated
accountability.
CHO Chief Officers are accountable to each of the 4 National Directors for delivery of services within that Division, but
will continue to have a single reporting relationship to the chair of the Executive Committee.
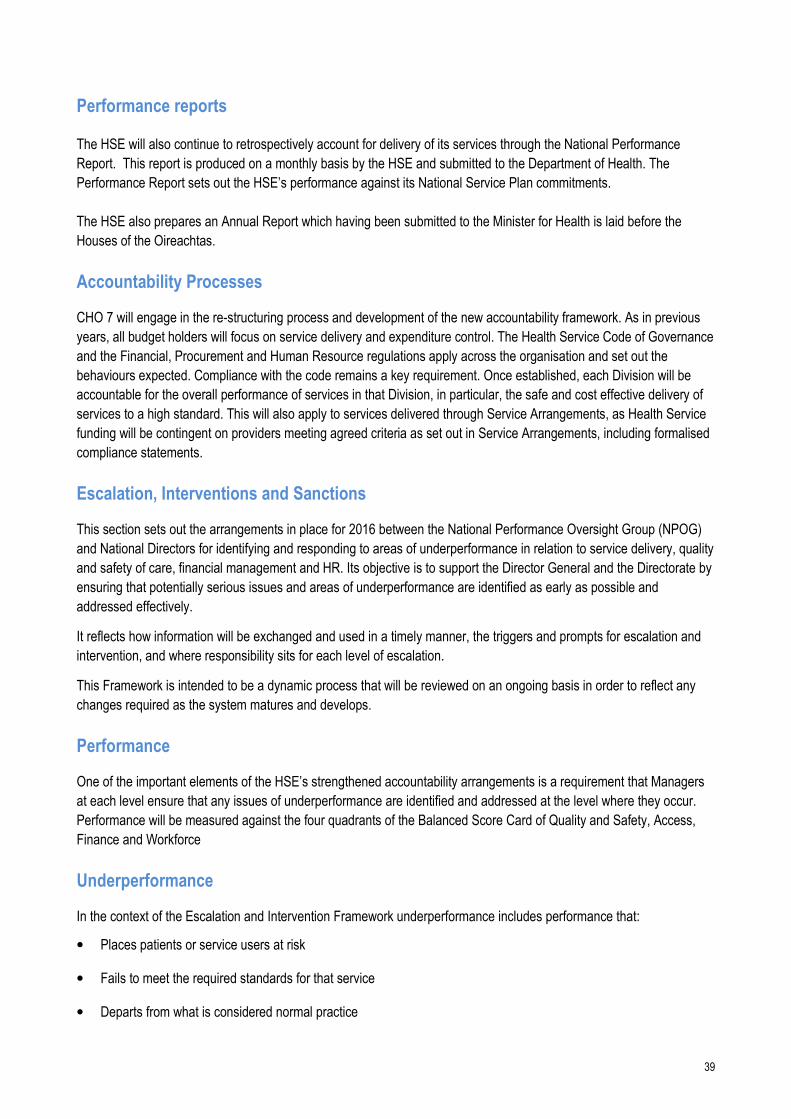
39
Performance reports
The HSE will also continue to retrospectively account for delivery of its services through the National Performance
Report. This report is produced on a monthly basis by the HSE and submitted to the Department of Health. The
Performance Report sets out the HSE’s performance against its National Service Plan commitments.
The HSE also prepares an Annual Report which having been submitted to the Minister for Health is laid before the
Houses of the Oireachtas.
Accountability Processes CHO 7 will engage in the re-structuring process and development of the new accountability framework. As in previous
years, all budget holders will focus on service delivery and expenditure control. The Health Service Code of Governance
and the Financial, Procurement and Human Resource regulations apply across the organisation and set out the
behaviours expected. Compliance with the code remains a key requirement. Once established, each Division will be
accountable for the overall performance of services in that Division, in particular, the safe and cost effective delivery of
services to a high standard. This will also apply to services delivered through Service Arrangements, as Health Service
funding will be contingent on providers meeting agreed criteria as set out in Service Arrangements, including formalised
compliance statements.
Escalation, Interventions and Sanctions This section sets out the arrangements in place for 2016 between the National Performance Oversight Group (NPOG)
and National Directors for identifying and responding to areas of underperformance in relation to service delivery, quality
and safety of care, financial management and HR. Its objective is to support the Director General and the Directorate by
ensuring that potentially serious issues and areas of underperformance are identified as early as possible and
addressed effectively.
It reflects how information will be exchanged and used in a timely manner, the triggers and prompts for escalation and
intervention, and where responsibility sits for each level of escalation.
This Framework is intended to be a dynamic process that will be reviewed on an ongoing basis in order to reflect any
changes required as the system matures and develops.
Performance One of the important elements of the HSE’s strengthened accountability arrangements is a requirement that Managers
at each level ensure that any issues of underperformance are identified and addressed at the level where they occur.
Performance will be measured against the four quadrants of the Balanced Score Card of Quality and Safety, Access,
Finance and Workforce
Underperformance In the context of the Escalation and Intervention Framework underperformance includes performance that:
• Places patients or service users at risk
• Fails to meet the required standards for that service
• Departs from what is considered normal practice

40
Where the measures and targets set out in these areas are not being achieved, this will be considered to be
‘underperformance’.
Escalation can be described as the increased and intensified application of focus and scrutiny on a particular area of
underperformance in order to improve performance.
The Escalation Framework sets clear thresholds for intervention for a number of priority Key Performance Indicators and
a rules-based process for escalation at a number of different levels.
It is recognised that underperformance may be minor to severe and may be temporary or persistent. Any formal
designation of service underperformance will recognise these conditions. Each Divisional National Director will be
required therefore as part of the enhanced Accountability Framework 2016 to agree an overall set of thresholds and
‘tolerance levels’ against which underperformance issues will need to be escalated to a number of different levels which
are described below.
An issue that requires escalation can start in any part of the organisation and this process ensures that Service
Managers, Hospital Group CEOs, Chief Officers of Community Healthcare Organisations and National Directors provide
assurance or escalate issues in accordance with the processes set out in this document.
Where escalation occurs, the accountability arrangements in place will require the relevant senior manager to ensure
that appropriate interventions are commissioned and implemented.
Escalation Process
Each National Director is responsible for maintaining appropriate governance arrangements for their Division to ensure
that it is operating effectively and delivering quality and safe care to patients.
The objective of the National Performance Oversight Group is to co-ordinate their work programme on behalf of the
Directorate to seek assurance on the safe, effective and efficient delivery of services. Issues arising will normally be
dealt with by National Directors through their normal reporting channels of Hospital Groups and the Executive
Management Committee.
The following sections describe the formal performance escalation process as part of the Accountability Framework
2016 and outline the process in terms of:
• Responsibilities at each level of performance and escalation
• The thresholds and tolerances for underperformance services for red escalation (to NPOG) for a number of priority
measures
• The type of supports, interventions and sanctions to be taken at each escalation level
Escalation Levels
The National Performance Oversight Group has developed a 4 point Escalation Framework from Level 1 (Yellow) to
Level 4 (Black) which will be used to escalate issues and incidents as required.
• Level 1 (Yellow) is at Hospital Group CEO or Chief Officer CHO level
41
• Level 2 (Amber) is at National Director level
• Level 3 (Red) is at National Performance Oversight Group level
• Level 4 (Black) is at Director General level.
Hospital Group CEO or Chief Officer CHO Level Level 1 Yellow Escalation – Concern across several areas Performance Trigger: Continued failure to achieve or maintain one or more key deliverables. Description: Level 1 Yellow Escalation indicates a concern or concerns that require investigation by the
CEO of the Hospital Group or the Chief Officer of the relevant Community Healthcare Organisation. It is likely that this level of escalation will be instigated following persistent performance issues of a material nature that may span one or more areas. It may also be where the CEO Hospital Group or Chief Officer CHO lacks confidence in recovery plan(s) of the service(s) in question.
Escalation Action The CEO Hospital Group or Chief Officer CHO will be actively involved in determining the
necessary supports and interventions in order to deliver the required outcomes / improvements.
Support: Support focused on improvement on specific issues and recovery plans Interventions: Intervention is likely to be focused on supporting improvement in particular areas, but
broader intervention can be deployed. Interventions are likely to include the development and implementation of remedial action plans.
Sanctions: No sanctions are likely at this level of escalation De-escalation Sustained improvement of KPIs causes removal of escalation actions. Accountability: Accountability at this level of escalation is through the relevant Hospital Group CEO or the
Chief Officer of the Community Healthcare Organisation. The involvement of the National Performance Oversight Group is not required
Thresholds and tolerances will be reviewed in light of the NSP2016 and agreed with National Directors

42
Operational Service Delivery – Corporate Goals Implementation

43
Health & Wellbeing Division Figure 1 – Description of Health & Wellbeing functions.

44
Introduction: Improving the health and wellbeing of Ireland’s population is a national priority and a key element of healthcare reform. As part of this reform and in response to Ireland's changing health and wellbeing profile, the Healthy Ireland (HI) Framework was adopted by the Irish Government. This commitment is also reflected in the HSE’s Corporate Plan, Building a high quality health service for a healthier Ireland 2015-2017, which identifies the promotion of ‘health and wellbeing as part of everything we do’ within its five over-arching Corporate Goals.
Within the HSE, the Health and Wellbeing Division is responsible for driving and coordinating the health service response to this agenda. Our work is focussed on helping people to stay healthy and well, reducing health inequalities and protecting people from threats to their health and wellbeing. Whilst much of the day to day work of the division is discrete, we are driving a collaborative effort to:
• Ensure health system implementation of Healthy Ireland goals • Reduce levels of chronic disease by addressing modifiable lifestyle risk factors • Enhance and improve service delivery models for the health of the population • Protect the population from threats to their health and wellbeing • Create and better support cross-sectoral partnerships for improved health outcomes.
The enabling role of Health and Wellbeing in translating the HI Framework into tangible and impactful actions across the HSE remains a key priority for the Division this year. A major milestone in formulating the health services response to the HI Framework was achieved in 2015, with the publication of our Healthy Ireland in the Health Services National Implementation Plan 2015-2017 (HI Implementation Plan) which specifically focuses on the HSE, our workforce, our services and the people to whom we provide services. This year will see the further embedding of these priorities across a greater number of service areas and within local plans and services, particularly Hospital Groups and Community Healthcare Organisations (CHOs). Staff delivering services within the Health and Wellbeing Division will have responsibility for driving this agenda on a partnership basis, building on the work already undertaken in 2014/15. The strengthening of the health service response to specific policy priority areas will be a key feature of 2016 and its areas of focus are set out in this Operational Plan. Implementation of the actions set out in this plan will be commensurate with available funding, with some being prioritised and phased during 2016. Many are to be delivered on a partnership basis, with other Divisions, healthcare organisations and agencies, Local Authorities, Government Departments, statutory and voluntary organisations and academia. This reflects the joined up approach necessary to deliver on the Healthy Ireland vision.
Developments and Reform Priorities 2016 Improving the health and wellbeing of Ireland’s population is a Government priority and is one of four pillars of healthcare reform outlined in Future Health – A Strategic Framework for Reform of the Health Services 2012 – 2015. The implementation of the HSE’s HI Implementation Plan is key to the creation of a more sustainable health and social care service and to the rebalancing of health priorities towards chronic disease prevention and population health improvement. The HSE’s HI Implementation Plan has identified three clear strategic priorities for action, because in one way or another, every part of the health service is engaged in improving health and wellbeing. These will be progressed in 2016 with a sector-wide focus on
• System Reform - ensuring that we deliver the significant reforms which are underway to support a better health system
• Reducing Chronic Disease - the biggest risk to our population’s health and our services

45
• Staff Health and Wellbeing - ensuring we have a resilient and healthy workforce
A significant programme of change is underway to enable and drive the establishment of Hospital Groups and CHOs with the aim of delivering integrated services and better outcomes for service users. The appointment of a Head of Health and Wellbeing to the Senior Management of each CHO in 2016 will be a significant enabler to the translation of the goals and actions set out in the HI Implementation Plan within communities.
The appointment of a Head of Health and Wellbeing to the Senior Management of CHO 7 in 2016 will be a significant enabler to the translation of the goals and actions set out in the HI Implementation Plan within communities. A range of other critical developments and reforms will be delivered in 2016. They include: • The continued, phased implementation of the Breast Check age extension programme to women aged 65 to 69 within our National Screening Service • Within the Child Health area, the augmentation of the current Primary Childhood Immunisation (PCI) schedule to address agreed public health priorities.
• The continued support for the development of care pathways for key chronic conditions
• Review of the governance of the National Emergency Management Function. The HI Implementation Plan also presents six themes which the HSE has prioritised for action to reduce the burden of chronic disease and improve the health and well being of our staff. Many actions from the plan are outlined in this document, with a focus on delivery in 2016. These will be taken forward through the continued work of national policy priority programmes in areas such as Tobacco Free Ireland, Healthy Eating and Active Living (HEAL), Healthy Childhood Programme, Alcohol , Wellbeing and Mental Health, Positive Ageing and Sexual Health. CHO7 will commence the implementation of Health Ireland in our local health services.

46
Health and Wellbeing and the Clinical and Integrated Care Programmes The provision of care across the spectrum of primary, community, pre-hospital and hospital services should be person-centred and coordinated. CHO 7 and the Dublin Midlands Hospitals Group will continue to expand on our 2015 initiatives to provide better, easier access to high quality services which are close to where people live. We will aid to deliver services in a joined up way, placing people’s needs at its core. It is a long term programme of improvement and change and will involve people at every level of the health services working together to create improved experiences and outcomes for the people in our care.
Health Inequalities Addressing the wider causes of ill-health and reducing inequalities requires the collective efforts of whole of government and whole of society. Much of the focus of the Healthy Ireland in the Health Services Implementation Plan centres on the actions which are likely to be most effective in reducing health inequalities, and thereby giving us the greatest opportunity to narrow the gap and increase population health and wellbeing for all. These include, inter alia, early child development positive ageing; tackling causes of chronic diseases including tobacco, alcohol consumption, poor diet and lack of exercise. The Health Services’ operations and services can directly shape and influence this through its day to day work and help achieve greater health equity. It also has an important role to play in advocating for the implementation of a broader range of actions in the wider Irish social, economic and regulatory environment. Creating, improving and maintaining health and wellbeing for all is complex and requires an overall view of population health and an understanding of local communities and their specific needs. The updating, wider dissemination and use of published County Profiles developed in 2015 will help support this work locally within the HSE and more widely through our collaborative work on the Local Community Development Committees (LCDC) and Children and Young People’s Services Committees (CYPSC).

47
Supporting Service Delivery
Health and Wellbeing is of critical importance in all aspects of the work of CHO7. It is not simply a visible operation in its own right but cuts across all operational services in primary care, mental health and social care.
Our Accountability Throughout the year we will be engaged with the National Health and Wellbeing Division and a central focus of those discussions will be our progress in CHO7 measured against the priorities and actions of the National Service Plan. This process is guided through the use of a balance scorecard focused on key metrics.
Key Priorities and Actions to Deliver on Goals in 2016
Corporate Goal
Health and Wellbeing Strategic Priority
Actions 2016 Measure of Performance
End Qtr
Goal 1: Promote health and wellbeing as part of everything we do so that people will be healthier
Priority: ‘Healthy Ireland in the Health Service’ – National Implementation Plan 2015 - 2017
Support the development and implementation of CHO Healthy Ireland Plans as resources permit.
CHO Plan in place by year end.
Q1 – Q4
Goal 1: Promote health and wellbeing as part of everything we do so that people will be healthier
Priority: ‘Healthy Ireland in the Health Service’ – National Implementation Plan 2015 - 2017
Develop Action plan to progress Breastfeeding in Ireland within HI Framework and across Primary Care and acute sector as with community and voluntary sector
Ongoing Q1 – Q4
Goal 1: Promote health and wellbeing as part of everything we do so that people will be healthier
Priority: Immunisation CHO 7 commits to augmenting the current primary immunisation schedule to address agreed public health priorities. CHO 7 commits to improve national immunisation update rates in partnership with Primary Care CHO 7 commits to implement changes to Primary Childhood Immunisation Programme and Schools Immunisation Programmes as resources allow. CHO 7 commits to implementation the recommendations from the review of models of delivery and governance of immunisation services.
Community Medical Services will address BCG wait list challenges when supply issues are resolved.
Ongoing Ongoing Ongoing Ongoing Meet KPI Targets
Q1 – Q4 Q1 – Q4 Q1-Q4 Q1-Q4 Q1 – Q4

48
Improve influenza uptake rates amongst staff in frontline (longer-term care in the community) and amongst persons aged 65 and over.
Ongoing
Q4
Goal 1: Promote health and wellbeing as part of everything we do so that people will be healthier
Priority: Tobacco Free Campus Policy and BISC training
Support the continued role out of the Tobacco Free Campus Policy in Social Care with set targets – specific targets to be set
Continue to support the release of frontline staff to attend BISC training
Attain targets for new and existing sites to adhere to tobacco free campus policy 123
Q1 - Q4
Q1 - Q4
Goal 2: Provide fair, equitable and timely access to quality, safe health services that people need
Priority: Protect the population from threats to their Health and Wellbeing
Ongoing engagement with Emergency Management Regional
Ongoing Q1 – Q4
Goal 2: Provide fair, equitable and timely access to quality, safe health services that people need
Priority: Protect the population from threats to their Health and Wellbeing
Promote the prevention and control of health care associated infection within all service areas
Development of
Infection Control Team
and implementation of
Health Care Associated
Infection Control Audit
Programme
Meet KPI Targets
Q1 – Q4
Q1 - Q4
Q1 – Q4
Goal 2: Provide fair, equitable and timely access to quality, safe health services that people need
Priority: Infection Prevention and Control
Develop a plan in relation to HCAI/AMR with Primary Care services as resources allow.
Put Plan in place by year end.
Q1 – Q4
Goal 2: Provide fair, equitable and timely access to quality, safe health services that people need
Priority: Protect the population from Threats to their Health and Wellbeing
Ongoing structured discharge planning to ensure there is a safe and coordinated discharge from the acute sector to community
Safer discharges, less re-admissions, better patient outcomes and satisfaction Reduction in complaints
Q1 – Q4
Q1-Q4
Goal 3: Foster a culture that is honest, compassionate, transparent and accountable
Priority: Implement a uniform system for recording, collating and reporting Complaints and Compliments across Health and Wellbeing and its services
Continue to work with the National Complaints Governance & Learning Team to review complaints, analyze trends and put in place action plans to improve service
Measurable reduction
in complaints
Q1 – Q4

49
Goal 4: Engage, Develop and value our workforce to deliver the best possible care and services to them
Priority: Provide training and support to staff to embed the concept of ‘every contact counts’ through the provision of training and support, improved data capture and the development of a framework and implementation plan for the National Brief Intervention Model
Practice Development Co-ordinators will identify gaps in training, audit practice, and community audit, developing and implementing required training programmes
Ongoing Q1 – Q4
Goal 5: Manage resources in a way that delivers best health outcomes, improves people’s experience of using the service and demonstrates value for money
Priority: Embed Health and Wellbeing indicators within HSE reform programmes and projects
CHO 7 will support the introduction of the individual health Identifier.
Improved patient safety
and more efficient
service (national
dependency on
implementation)
Q1 – Q4
Goal 5: Manage resources in a way that delivers best health outcomes, improves people’s experience of using the service and demonstrates value for money
Priority: Embed Health and Wellbeing indicators within HSE reform programmes and projects
Develop and progress the priority work streams of the five Integrated Care Programmes to improve integration of services, access and outcomes for patients in collaboration with Clinical Strategy and Programmes
Ongoing Developments Q1-Q4
Goal 5: Manage resources in a way that delivers best health outcomes, improves people’s experience of using the service and demonstrates value for money
Priority: Incorporate prevention and intervention requirements into existing and new clinical care programmes
Integrated Care Programme - Older People CHO 7 & Tallaght Hospital. Chronic Disease Management Programme.
Ongoing Developments
Ongoing Developments
Q1-Q4
Q1-Q4

50
Primary Care Introduction The development of primary care services is a key element of the overall Health Reform programme. The core objective is to achieve a more balanced health service by ensuring that the vast majority of patients and clients who require urgent or planned care are managed within primary and community based settings, while ensuring that services are:
• Safe and of the highest quality
• Responsive and accessible to patients and clients
• Highly efficient and represent good value for money
• Well integrated and aligned with the relevant specialist services.
Primary Care services include primary care, primary care reimbursement, social inclusion, and palliative care services. A key priority for 2016 is the continued implementation of the recommendations of Community Healthcare Organisations – Report and Recommendations of the Integrated Service Area Review Group, 2014. There will be a continued emphasis on enhanced control and accountability for primary care services. This will strengthen the accountability framework and outline explicit responsibilities for managers at all levels. Primary Care services in CHO 7 will be provided from 14 Community Health Networks areas – see map below.

51
Primary Care Over the last number of years work has been underway to realise the vision for primary care services whereby the health of the population is managed, as far as possible, within a primary care setting, with people very rarely requiring admission to a hospital. This approach is now aligned with the Healthy Ireland framework, noting the importance of primary care to the delivery of health improvement gains. Primary care will play a central role in co-ordinating and delivering a wide range of integrated services in collaboration with other service areas. The primary care team (PCT) is the central point for service delivery which actively engages to address the medical and social care needs of the population in conjunction with a wider range of Health and Social Care Network (HSCN) services.
PCRS The Primary Care Schemes are the means through which the health system delivers a significant proportion of primary care services. Scheme services are delivered by primary care contractors e.g. general practitioners, pharmacists, dentists, optometrists and/or ophthalmologists.
Services are provided to 2.3 million people in the community through 7,061 Primary Care Contractors. The schemes include:
• General Medical Services (GMS) – Medical Card Scheme including GP Visit Cards.
• Drug Payment Scheme.
• Long Term Illness Scheme.
• Dental Treatment Services Scheme (DTSS).
• High Tech Drug Arrangements.
• Primary Childhood Immunisation Scheme.
• Community Ophthalmic Scheme.
• Services under Health (Amendment) Act 1996.
• Methadone Treatment Scheme.
Social Inclusion The core objective of Social Inclusion is improvement of health outcomes for the most vulnerable in society. This includes provision of targeted interventions for people from traditionally marginalised groups who experience health inequalities, have difficulties accessing services and present with multiple, complex health and support needs. Vulnerable people and communities falling within the remit of Social Inclusion include Irish Travellers and Roma, Asylum seekers and refugees and LGBT service users. Issues of addiction, substance misuse, homelessness and domestic, sexual and gender based violence are overarching themes. The cross cutting nature of social inclusion, with intersection of a range of issues across service user groups demands a partnership approach across statutory and voluntary sectors where responses are flexible, sophisticated, coordinated and aimed at eventual integration of service users into mainstream services, where possible. At the same time, social inclusion works with mainstream services towards assuring accessibility to disadvantaged service users.
Socially excluded service users are often invisible in datasets or outcome frameworks and this presents a challenge to ongoing maintenance of a focus on the needs of such vulnerable people. It is incumbent on Social Inclusion services to continue working towards development and application of appropriate disaggregated data that accurately reflects health needs and outcomes of vulnerable groups; such efforts will continue to be progressed during 2016, aligned with objectives of the Healthy Ireland Implementation Plan.
52
Palliative Care
Palliative care is an approach that improves the quality of life of patients and their families facing the problems associated with life-limiting illness. This is achieved through the prevention and relief of suffering by means of early identification, high quality assessment and management of pain and other physical, psychosocial and spiritual problems. In recent years, the scope of palliative care has broadened and includes not only cancer related diseases but supporting people through non-malignant and chronic illness also. In 2015 the Health Service established a stakeholder representative working group to review existing national strategies and policies, most of which are more than 5 years old. A new plan, which will provide the direction for palliative care services for the next 3 years, will be published early in 2016. The plan will be developed in collaboration with the National Clinical Programme for Palliative Care.
In 2016 engagement will continue with voluntary service providers, the Irish Hospice Foundation, the All Island Institute for Hospice and Palliative Care and the voluntary hospice movement to ensure that emerging needs and solutions can be identified and addressed. The Integrated Care Programmes (ICPs) are core to operational delivery and reform. Palliative Care recognises the potential for the ICPs to improve integration of services, access and outcomes, and commits to actively supporting the development and implementation of the priority work streams of the five ICPs in 2015.
The vision for the future is that palliative care will be a gradual and natural increasing component of care from diagnosis to death. Palliative Care will ensure that people with a life-limiting condition, and their families, can easily access a level of high quality service that is appropriate to their needs, regardless of age, care setting, or diagnosis.
Developments and Challenges in 2016
The 2016 New National Funding Allocation of €13.5m will facilitate progress in relation to:
• Extension of free GP care to all children aged under 12 years (6 years to under 12 years) subject to negotiations
under the Framework Agreement.
• Improved access to diagnostics (ultrasound and x-rays) for GPs.
• Expansion of the minor surgery initiative.
• Improved access to primary care psychology and counselling will be progressed.
• Improved access to primary care speech and language therapy services will be progressed.
The challenges for 2016 will be in the areas of:
• Provision of new drugs and cancer drugs.
• Provision of oral health prevention services.
• Provision of addiction services within the Primary Care setting in line with Government Policy.
• Provision of services to homeless people in line with Government Policy.
• The provision of enhanced care support planning for complex Homeless Service users.
• Provision of services in line with the requirements of the Refugee Protection Programme.
• The implementation of the National Traveller and Roma Inclusion Strategy.
• Participation within the LCDC – structures for Healthy Ireland and working with the National Children’s Hospital Group
to develop Health Children Programmes in the south inner city.

53
Key Priorities and Actions to Deliver on Goals in 2016
Actions 2016 Measure of Performance End Qtr
Corporate Goal Primary Care Strategic Priority
Goal 1: Promote health and wellbeing as part of everything we do so that people will be healthier
Priority: Implement, in collaboration with Health and Wellbeing child health programmes/initiative to improve health outcomes for children
Child Health: Work in partnership with the Health and Wellbeing Division in the achievement of compliance with KPI Targets.
Meet KPI targets Q1 – Q4
Goal 1: Promote health and wellbeing as part of everything we do so that people will be healthier
Priority: Implement, in collaboration with Health and Wellbeing child health programmes/initiative to improve health outcomes for children
Continue to work in collaboration initiatives to improve health outcomes for vulnerable populations
CHO 7 will continue to engage with local LCDSs.
Q1 – Q4
Work in collaboration with Health & Wellbeing on Child Health Programmes and initiatives.
CHO 7 will continue to roll out Child Health programmes/Initiatives to improve health outcomes for children.
Q1 – Q4
Goal 1: Promote health and wellbeing as part of everything we do so that people will be healthier
Priority: Tobacco Free Campus Policy and BISC training
Support the continued role out of the Tobacco Free Campus Policy in Primary Care with set targets – specific targets to be set
CHO 7 is committed to a target of 5% of Primary Care staff attending BISC training in 2016.
Q1 - Q4
Goal 1: Promote health and wellbeing as part of everything we do so that people will be healthier
Priority: Support Health Promotion and improvement Initiatives in primary care.
Support the implementation of the Sexual Health Strategy.
CHO7 will seek guidance from H&WB division on implantation of identified, resourced actions.
Q1 – Q4
Goal 1: Promote health and wellbeing as part of everything we do so that people will be healthier
Priority: Improve national immunisation rates in partnership with Health and Wellbeing
Continue to provide primary and secondary school immunisation in accordance with the national immunisation schedule
Ongoing Q1 – Q4

54
Due to shortage of Vaccines and no definite date confirmed that we will receive vaccine.
Community Medical Services will address BCG wait list challenges through provision of additional vaccination clinics/extension of existing clinics as necessary subject to funding
Meet KPI Targets Q1 – Q4
Goal 1: Promote health and wellbeing as part of everything we do so that people will be healthier
Priority: Strengthen national supports and guidance to primary care providers in relation to Health Care Associated Infections
Continue the promotion of hand hygiene training and hygiene audit in keeping with national priorities
Ongoing Q1 – Q4
Goal 2: Provide fair, equitable and timely access to quality, safe health services that people need
Priority: Provide improved and additional services at primary care (PCT and Network) level
Continue to consolidate the delivery of primary care services through our Primary Care teams and our 14 CHNs when in place.
Meet KPI targets Q1 – Q4
Goal 2: Provide fair, equitable and timely access to quality, safe health services that people need
Priority: Provide improved and additional services at primary care (PCT and Network) level
Implement the recommendations from the GP Out of Hours Review Report once published
Implement recommendations (publication dependent)
Q1 – Q4
Goal 2: Provide fair, equitable and timely access to quality, safe health services that people need
Priority: National Standards for Safer Better health Care
Support the Implementation of National Standards for Safer Better Healthcare.
CHO 7 will identify Quality Improvement Plans and agree reporting mechanism to be adhered to.
Q1 – Q4
Goal 2: Provide fair, equitable and timely access to quality, safe health services that people need
Priority: Provide improved and additional services at primary care (PCT and Network) level
Will continue to work with estates for minor and major capital to extend and reconfigure existing Health Centres, and development of new Primary Care initiatives
Upgraded centres Q1 – Q4
Goal 2: Provide fair, equitable and timely access to quality, safe health services that people need
Priority: Provide improved and additional services at primary care (PCT and Network) level
Extend the 2015 Minor Surgery Project to further practices and target activity transfer from acute hospitals of up to 10,000 procedures.
National dependency. Await direction from Minor Surgery Project Manager on further rollout of this initiative
Q1-Q4

55
Goal 2: Provide fair, equitable and timely access to quality, safe health services that people need
Priority: Provide improved and additional services at primary care (PCT and Network) level
Extend direct access for GPs to ultrasound and x-ray
National dependency. CHO 7 will participate as required.
Q1-Q4
Goal 2: Provide fair, equitable and timely access to quality, safe health services that people need
Priority: Provide improved and additional services at primary care (PCT and Network) level
Extend GP Access under Framework Agreement -
National dependency. CHO 7 will participate as required.
Q1-Q4
Goal 2: Provide fair, equitable and timely access to quality, safe health services that people need
Priority: Improve access to Oral Health and Orthodontics.
Work with Orthodontic Services to ensure governance of service meets CHO7 requirements. Dependent on National actions.
CHO 7 will participate as required.
Q1 – Q4
Goal 2: Provide fair, equitable and timely access to quality, safe health services that people need
Priority: Strengthen Primary Care Psychology services.
National dependency. CHO 7 will participate as required.
Q1 – Q4
Goal 2: Provide fair, equitable and timely access to quality, safe health services that people need
Priority: Review access to SPLT services.
National dependency. CHO 7 will participate as required.
Q1 – Q4
Goal 2: Provide fair, equitable and timely access to quality, safe health services that people need
Priority: Improve Cross Division Service Integration
Implement the Primary Care Education, Pathways and Research in Dementia (PREPARED) Programme.
National dependency. CHO 7 will participate as required.
Q1 – Q4
Goal 2: Provide fair, equitable and timely access to quality, safe health services that people need
Social Inclusion Priority: Improve health outcomes for persons with addiction issues
Implement the New National Drugs Strategy when published in line with available resources.
National dependency. CHO 7 will participate as required.
On-going
Goal 2: Provide fair, equitable and timely access to quality, safe health services that people need
Social Inclusion Priority: Improve health outcomes for persons with addiction issues
Provide additional supports for those presenting with multi substance addictions as resources allow.
Meet KPI targets Q3

56
Goal 2: Provide fair, equitable and timely access to quality, safe health services that people need
Social Inclusion Priority: Support the Implementation Plan to reduce Homelessness
Continue to work with Dublin Regional Homeless Executive (DRHE) and NGO’s through the SLA process subject to resources.
Meet KPI targets Q1 – Q4
Goal 2: Provide fair, equitable and timely access to quality, safe health services that people need
Social Inclusion Priority: Improve health outcomes for vulnerable groups - Traveller and Roma health
Continue to work with relevant NGOs to ensure agreed work plans are delivered
Meet KPI targets Q1 – Q4
Goal 2: Provide fair, equitable and timely access to quality, safe health services that people need
Social Inclusion Priority: Improve health outcomes for vulnerable groups Domestic, Sexual and Gender based violence
Work with NGO’s to ensure training is being carried out as per SLA’s
Ongoing engagement with NGO’s to review if training requirements being met
Q1 – Q4
Goal 2: Provide fair, equitable and timely access to quality, safe health services that people need
Social Inclusion Priority: Improve health outcomes for vulnerable groups Intercultural Health
Continue to work with NGO’s and monitor health needs
Ongoing meetings during 2016
Q1 – Q4
Goal 2: Provide fair, equitable and timely access to quality, safe health services that people need
Palliative Care Priority: Improve quality within palliative care service provision
CHO 7 will participate as required by National Palliative Care Lead on National Actions.
National dependency. CHO 7 will participate as required.
Q1-Q4
Goal 2: Provide fair, equitable and timely access to quality, safe health services that people need
Quality and Safety Priority: collaborative with QID in reducing harm as part of the safety programme
Continue to support the Pressure Ulcers to Zero collaborative
CHO 7 will continue to prioritise the roll out the pressure ulcer to zero collaborative, and continue to roll out the programme across all PCTs.
Q1 – Q3
Goal 3: Foster a culture that is honest, compassionate, transparent and accountable
Quality and Safety Priority: Patient engagement and empowerment.
CHO 7 will establish a formal process to engage with patients and service users on their experience of primary care.
Results of service user experience process.
Q2 - Q4
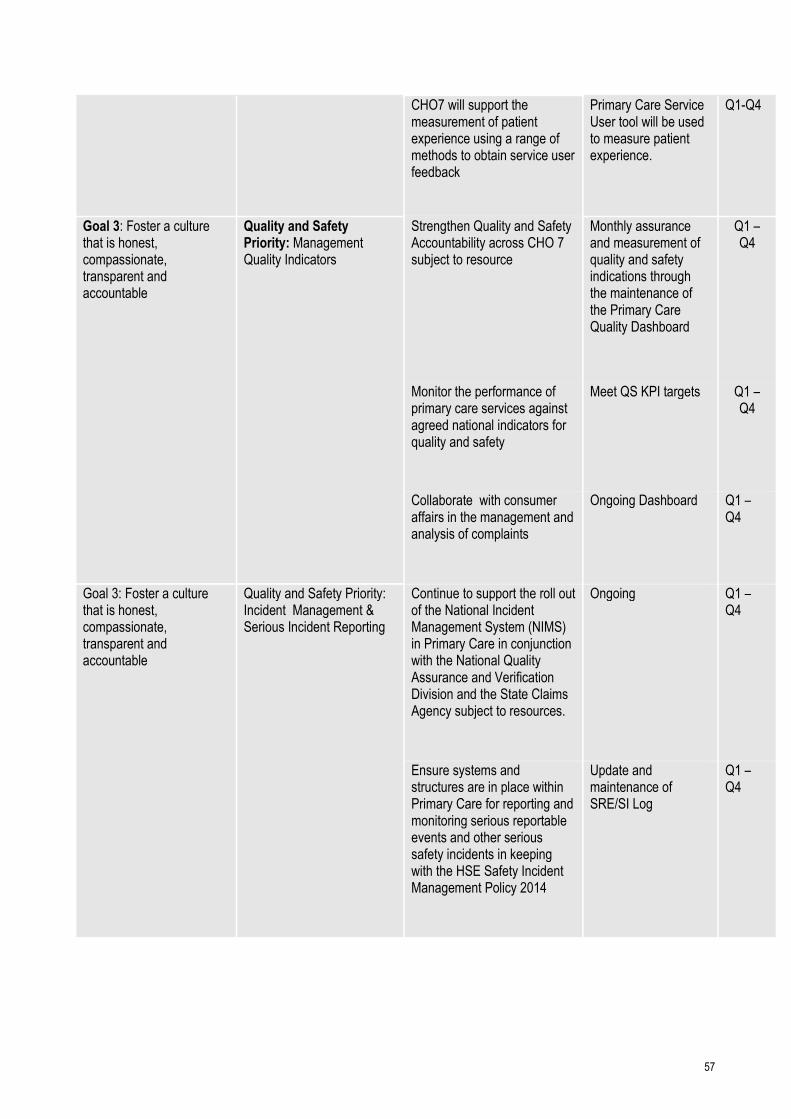
57
CHO7 will support the measurement of patient experience using a range of methods to obtain service user feedback
Primary Care Service User tool will be used to measure patient experience.
Q1-Q4
Goal 3: Foster a culture that is honest, compassionate, transparent and accountable
Quality and Safety Priority: Management Quality Indicators
Strengthen Quality and Safety Accountability across CHO 7 subject to resource
Monthly assurance and measurement of quality and safety indications through the maintenance of the Primary Care Quality Dashboard
Q1 – Q4
Monitor the performance of primary care services against agreed national indicators for quality and safety
Meet QS KPI targets Q1 – Q4
Collaborate with consumer affairs in the management and analysis of complaints
Ongoing Dashboard Q1 – Q4
Goal 3: Foster a culture that is honest, compassionate, transparent and accountable
Quality and Safety Priority: Incident Management & Serious Incident Reporting
Continue to support the roll out of the National Incident Management System (NIMS) in Primary Care in conjunction with the National Quality Assurance and Verification Division and the State Claims Agency subject to resources.
Ongoing Q1 – Q4
Ensure systems and structures are in place within Primary Care for reporting and monitoring serious reportable events and other serious safety incidents in keeping with the HSE Safety Incident Management Policy 2014
Update and maintenance of SRE/SI Log
Q1 – Q4

58
Goal 3: Foster a culture that is honest, compassionate, transparent and accountable
Quality and Safety Priority: Children First
Local implementation plans to be developed.
CHO 7 will develop a summary of local plans in relation to implementation of Children First in 2016.
Q1
Goal 3: Foster a culture that is honest, compassionate, transparent and accountable
Quality and Safety Priority: Serious Incident Reporting
Ensure systems and structures are in place within Primary Care for reporting and monitoring serious reportable events and other serious safety incidents in keeping with the HSE Safety Incident Management Policy 2014
Update and maintenance of SRE/SI Log
Q1 – Q4
Continue to support the roll out of the National Incident Management System (NIMS) in Primary Care in conjunction with the /National Quality Assurance and Verification Division and the State Claims Agency
Ongoing Q1 – Q4
Goal 3: Foster a culture that is honest, compassionate, transparent and accountable
Quality and Safety Priority: Open Disclosure
Build capacity for roll out of Open Disclosure Policy
Participation of Senior Staff in the OD ‘Train the Trainer’ Programme
Q1 - Q4
Goal 3: Foster a culture that is honest, compassionate, transparent and accountable
Social Inclusion Priority: Roll out of Brief Intervention Training
Continued roll out of brief intervention training to staff
Ongoing. Completion of training for all staff in the Drugs and Alcohol Services
Q1
Goal 3: Foster a culture that is honest, compassionate, transparent and accountable
Palliative Care: Priority: Encourage the on-going development of person-centred services
Continue to engage and work with palliative care providers in CHO 7 in the development of person-centred services
Ongoing process through SA/IMR
Q1 – Q4
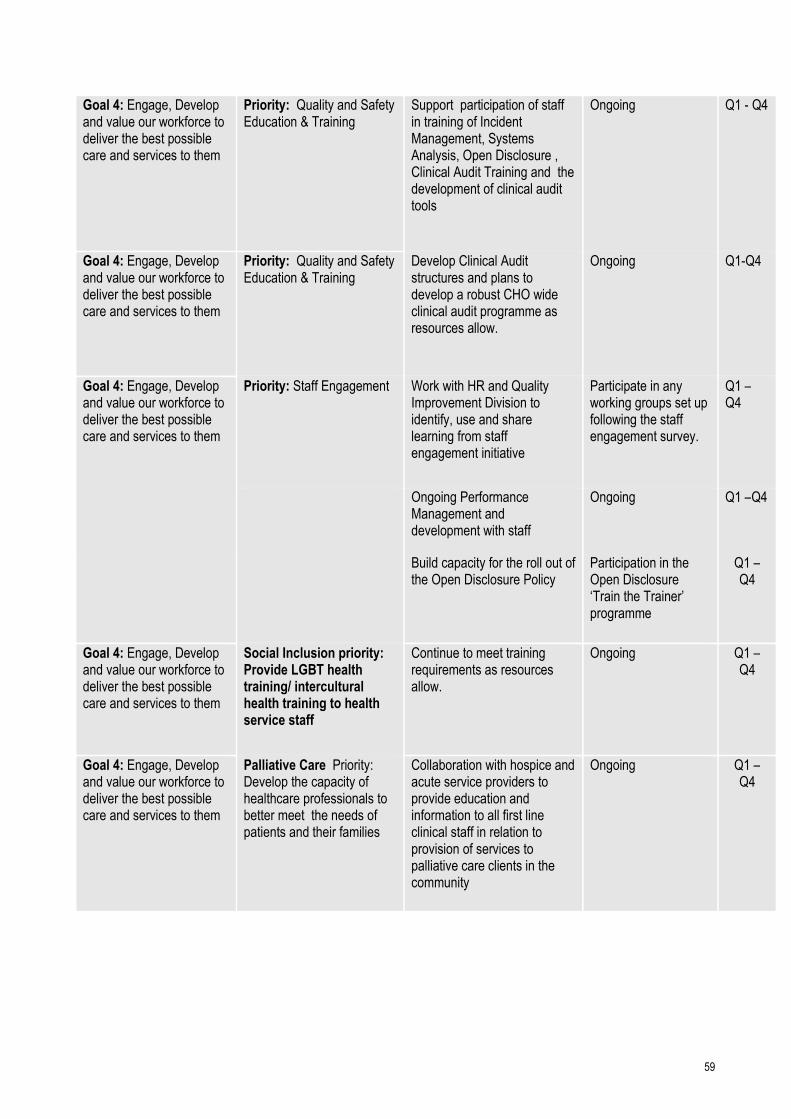
59
Goal 4: Engage, Develop and value our workforce to deliver the best possible care and services to them
Priority: Quality and Safety Education & Training
Support participation of staff in training of Incident Management, Systems Analysis, Open Disclosure , Clinical Audit Training and the development of clinical audit tools
Ongoing Q1 - Q4
Goal 4: Engage, Develop and value our workforce to deliver the best possible care and services to them
Priority: Quality and Safety Education & Training
Develop Clinical Audit structures and plans to develop a robust CHO wide clinical audit programme as resources allow.
Ongoing Q1-Q4
Goal 4: Engage, Develop and value our workforce to deliver the best possible care and services to them
Priority: Staff Engagement Work with HR and Quality Improvement Division to identify, use and share learning from staff engagement initiative
Participate in any working groups set up following the staff engagement survey.
Q1 – Q4
Ongoing Performance Management and development with staff
Ongoing Q1 –Q4
Build capacity for the roll out of the Open Disclosure Policy
Participation in the Open Disclosure ‘Train the Trainer’ programme
Q1 – Q4
Goal 4: Engage, Develop and value our workforce to deliver the best possible care and services to them
Social Inclusion priority: Provide LGBT health training/ intercultural health training to health service staff
Continue to meet training requirements as resources allow.
Ongoing Q1 – Q4
Goal 4: Engage, Develop and value our workforce to deliver the best possible care and services to them
Palliative Care Priority: Develop the capacity of healthcare professionals to better meet the needs of patients and their families
Collaboration with hospice and acute service providers to provide education and information to all first line clinical staff in relation to provision of services to palliative care clients in the community
Ongoing Q1 – Q4
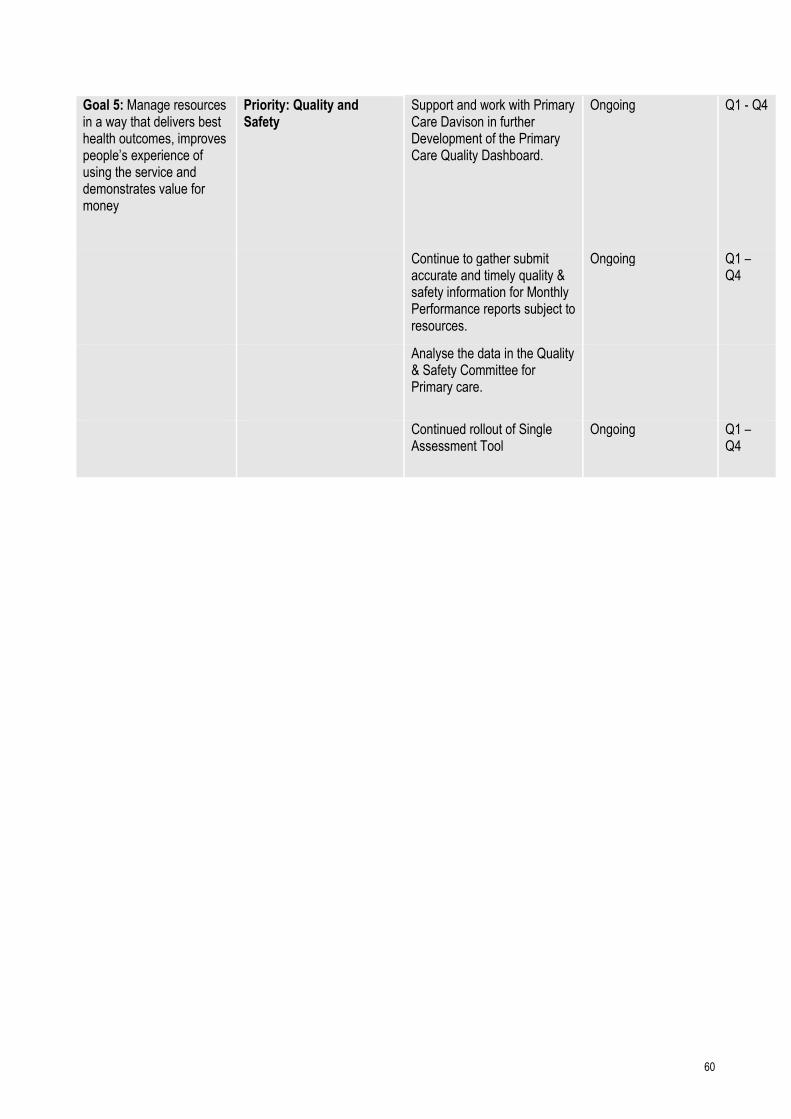
60
Goal 5: Manage resources in a way that delivers best health outcomes, improves people’s experience of using the service and demonstrates value for money
Priority: Quality and Safety
Support and work with Primary Care Davison in further Development of the Primary Care Quality Dashboard.
Ongoing Q1 - Q4
Continue to gather submit accurate and timely quality & safety information for Monthly Performance reports subject to resources.
Ongoing Q1 – Q4
Analyse the data in the Quality & Safety Committee for Primary care.
Continued rollout of Single Assessment Tool
Ongoing Q1 – Q4

61
Mental Health Services CHO 7 Dublin South Central Mental Health Services Kildare West Wicklow Mental Health Services
Area Description The Dublin South Central Mental Health Service encapsulates the geographical areas of the former Dublin West/South West Mental Health Service (Lomans / Tallaght) and the Dublin South City Mental Health Service (St James’s). While serving a total population of 406,441 in the South Central and South West parts of Dublin, the service now also includes Child and Adolescent Mental Health Services that were formerly provided by HSE Linn Dara service and the Lucena Clinical Services provided by St John of Gods. A number of service providers from Intellectual Disabilities are also included within the Mental Health Division and have responsibility for providing mental health services for people with Intellectual Disabilities. These several providers include Stewarts Hospital Palmerstown, Cheeverstown House Services, Dublin South City Intellectual Disability Service and St John of Gods. A number of other key stakeholders are also based in the locality and it is planned that the Mental Health Directorate will formalise links and promote the integration agenda with these services as part of the emerging directorate requirements. These services include Addiction Services, Homeless services and EVE-Community Based Recovery Programmes. The Cloverhill/Wheatfield prison complex is also located within the catchment area.
Service Description The general adult services in the former Dublin West/South West service are largely community-oriented with an emphasis on delivering care in the community and have well developed community mental health and homecare teams (CMHTs). Due to limited resources, the Dublin South City Service at St. James’s lacks this level of community care capacity. The catchment area also has Psychiatry of Later Life (PLL) teams and a Rehabilitation team. The demands on the PLL team have increased year on year as the at risk population has increased in size and also according as the number of nursing home beds in the catchment area increases. Psychological Medicine Liaison services are provided within the two acute hospitals in Tallaght and St James’s. Child & Adolescent Mental Health Services are delivered in three Community centres for the catchment area. The service budget includes funding for a number of National and Regional services such as externally provided assisted admissions service and the Alba National Counselling Services. Funding for Child & Adolescent Mental Health Services (CAMHS) is inclusive of funding for services delivered in the neighbouring Areas of Dublin North, Kildare, West Wicklow and Midlands. The interim CAMHs Acute Inpatient unit based at St. Loman’s Hospital was replaced by a 22 bed Unit which opened in December 2015. There is a service requirement to widen the access to the acute care programme including in-patient beds within the catchment area give the local demographics. This extended acute care programme will be dependent on sourcing sufficient and appropriately skilled staff. The Kildare West Wicklow Mental Health Service is a Community Based Mental Health Service which started in 1992 with the opening of the 29 bed Lakeview Acute Admissions Unit in Naas General Hospital. The population of the area has grown from 135,000 in 1992 to 228,400 in 2011. Further population growth is expected due to the age structure in the area and its proximity to Dublin. The mental health services in the area have been managed in a Supercatchment Area with the Laois/Offaly/Longford/ Westmeath services this is now changing to conform with the new Community Healthcare Organization boundaries.

62
Quality and Service User Safety The CHO 7 mental health services will support the Division in providing high quality and safe services for our service users and staff. The service will engage with the Division to build the capacity of service users, families and carers to influence the design and delivery of Mental Health Services.
Dublin South Central Mental Health Services
Population
General Adult Teams
Population Served CAMHS Population served
Tallaght 79,062 Ballyfermot/ St. James’s 81,215
Clondalkin 57,846 Clondalkin 58,537
Ballyfermot 81,093 Lucan 44,487
Crumlin 49,845 Total 184,239
Owendoher 65,913 North Kildare 71,673
Drimnagh 27,384 Mid Kildare 71,679
Camac 45,298 South Kildare 66,960
Total 406,441 (inclusive of CAMHs)
Spend and Budget
(1)
2014 Actual Net Spend
(2) 2015 Projected Net Spend
(5)
2016 opening Budget
53,994,681 55,613,777 57,268,493
Staffing Medical/ Dental
Nursing Health & Social Care Professionals
Management/ Admin
General Support Staff
Other Patient & Client Care
Total
Dec 2015
75.45 268.6 116.48 54.28 25.52 132.79 673.12
Services Provided
Service No. Provided Service No. Provided
No of Adult Acute Inpatient Beds 103
General Adult Psychiatry of Old Age
No. of non acute beds for adults 0 No. of Day Hospitals 2
No. of Day Hospitals 6 No. of Community Mental Health Teams
2
No. of Community Mental Health Teams 7 Number of Day Centres 0
Number of Day Centres 4 Specialist Mental Health Services
No, of High Support Community 6 No. of Rehab and Recovery Teams 1

63
Residences
No. of Low and Medium support Community Residences
12 No. of Liaison Psychiatry Teams
2
No. of MHID Teams 2
CAMHS
Number of Inpatient Beds 22
No of Day Hospitals 1 (Cherry Orchard)
No of Community Mental Health Teams 8* *Number of CMHT’s includes teams for Dublin North, Kildare/ West Wicklow

64
Corporate Goal Mental Health Strategic Priority
Actions 2016 Measure of Performance
End Qtr
Goal 1 – Promote health and wellbeing as part of everything we do so that people will be healthier:
Priority 1 Greater availability of Rehabilitation Services. Priority 2 Support the continued roll out of tobacco free campuses in line with national policy. Priority 3 Roll out of pilot project with the three cancer screening programmes for mental health patients in Dublin South Central
Develop the Rehabilitation service to enhance individual recovery and ultimately reduce the pressures on the inpatient bed resource Promote participation in smoking cessation programmes and provision of nicotine replacement therapy to those in residential settings Staff participation in and promotion of screening programmes.
Dependent on resources being made available through service developments Monitor bed occupancy in acute unit. Increased participation in smoking cessation initiatives. Increased uptake of screening by users of Mental Health Service.
Q1-4 Q3 Q1-4
Goal 2 – Provide fair, equitable and timely access to quality, safe health services that people need:
Priority 1 Further develop Clinical Care Programmes Priority 2 Deliberate Self Harm Programme
Continued support of the 3 Clinical Care Programmes including the provision of a Community Based Eating disorder programme in CAMHS Review and implement the Clinical Deliberate Self Harm programme in the Emergency Departments in
Dependent on resources being made available through service developments Monitor uptake of Early Intervention of Psychosis Programme. Ensure programme is implemented. Reduction of
Q3-4 Q1-4
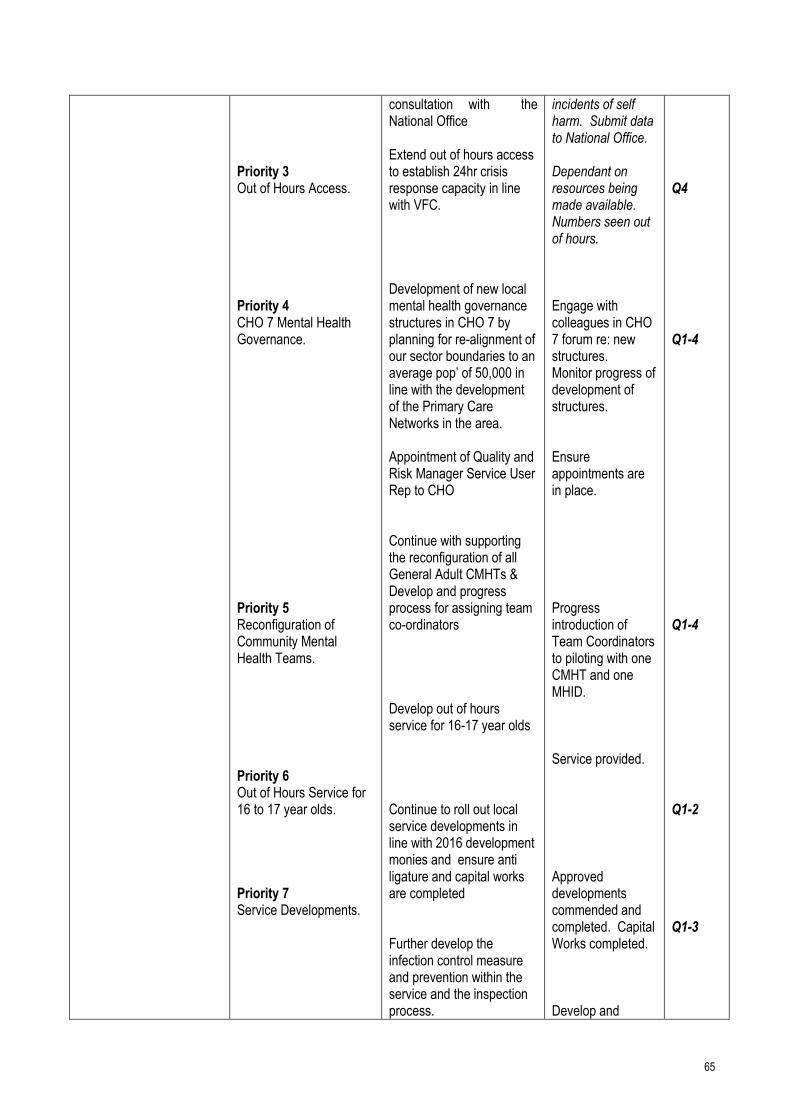
65
Priority 3 Out of Hours Access. Priority 4 CHO 7 Mental Health Governance. Priority 5 Reconfiguration of Community Mental Health Teams. Priority 6 Out of Hours Service for 16 to 17 year olds. Priority 7 Service Developments.
consultation with the National Office Extend out of hours access to establish 24hr crisis response capacity in line with VFC. Development of new local mental health governance structures in CHO 7 by planning for re-alignment of our sector boundaries to an average pop’ of 50,000 in line with the development of the Primary Care Networks in the area. Appointment of Quality and Risk Manager Service User Rep to CHO Continue with supporting the reconfiguration of all General Adult CMHTs & Develop and progress process for assigning team co-ordinators Develop out of hours service for 16-17 year olds Continue to roll out local service developments in line with 2016 development monies and ensure anti ligature and capital works are completed Further develop the infection control measure and prevention within the service and the inspection process.
incidents of self harm. Submit data to National Office. Dependant on resources being made available. Numbers seen out of hours. Engage with colleagues in CHO 7 forum re: new structures. Monitor progress of development of structures. Ensure appointments are in place. Progress introduction of Team Coordinators to piloting with one CMHT and one MHID. Service provided. Approved developments commended and completed. Capital Works completed. Develop and
Q4 Q1-4 Q1-4 Q1-2 Q1-3

66
Goal 3 : Foster a Culture that is honest compassionate transparent and accountable. Goal 4: Engage Develop and value our workforce who deliver the best possible care to the people who depend on them:
Priority 8 Infection Control Priority 9 ECT Priority 1 Service User Engagement Priority 2 Open disclosure training. Priority 3 Reduction of stigma. Priority 1 Peer Support Priority 2: Retention of staff.
Continue with pilot project of ECT based in AMNCH. Seek approval as a development post for CNM11 Continue the roll out of programmes to support collaboration and partnership with service users, family members and carers. Roll out open disclosure training. Continue to support the roll of recently appointed Suicide Prevention Resource Officers in the community. Implement the Peer Support Worker role within the Mental Health Services and continue with its development subject to resources. Optimise the recruitment and retention of staff by engagement with NRS and Third Level Colleges to maximise the available skill sets.
infection control strategy in conjunction with National Office Risk Management Division. ECT Service operable. Number of family and Carers engaged. Numbers trained. No of facilitated sessions. Increased retention of staff.
Q1 Q1 Q1-4 Q1-4 Q2-4 Q2-4 Q1-4
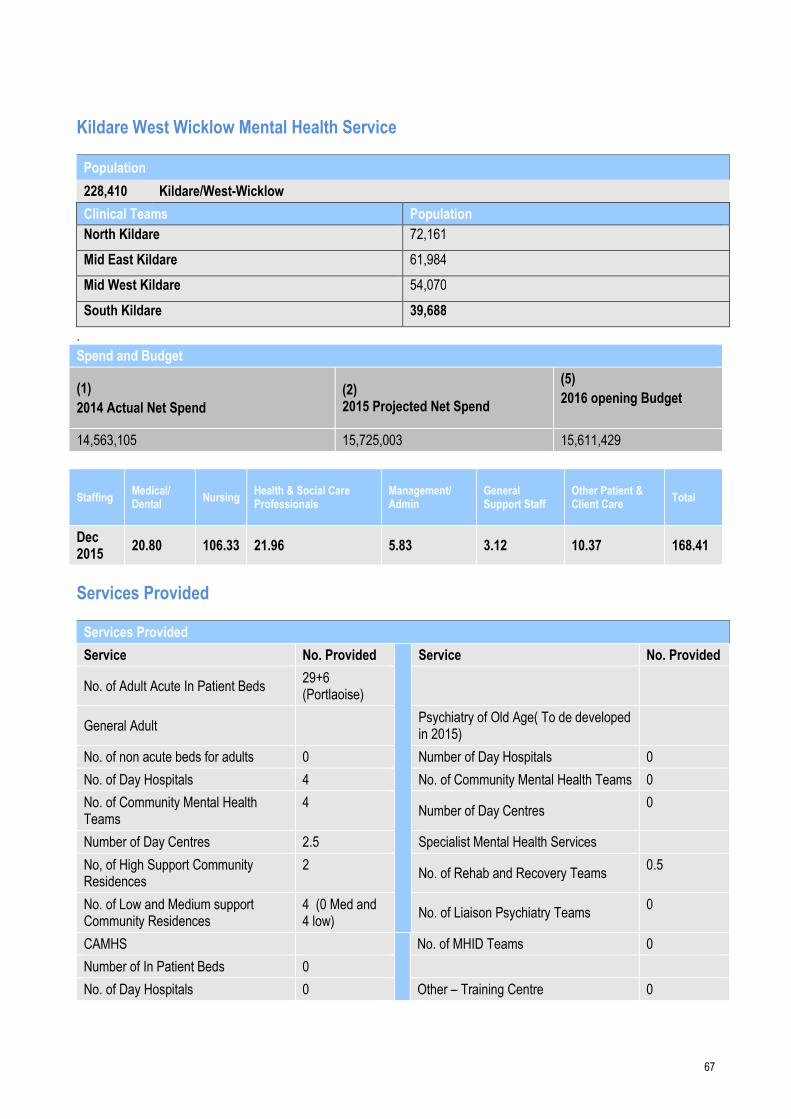
67
Kildare West Wicklow Mental Health Service
Population
228,410 Kildare/West-Wicklow
Clinical Teams Population
North Kildare 72,161
Mid East Kildare 61,984
Mid West Kildare 54,070
South Kildare 39,688
.
Spend and Budget
(1)
2014 Actual Net Spend
(2) 2015 Projected Net Spend
(5)
2016 opening Budget
14,563,105 15,725,003 15,611,429
Staffing Medical/ Dental
Nursing Health & Social Care Professionals
Management/ Admin
General Support Staff
Other Patient & Client Care
Total
Dec 2015
20.80 106.33 21.96 5.83 3.12 10.37 168.41
Services Provided
Services Provided
Service No. Provided Service No. Provided
No. of Adult Acute In Patient Beds 29+6 (Portlaoise)
General Adult Psychiatry of Old Age( To de developed
in 2015)
No. of non acute beds for adults 0 Number of Day Hospitals 0
No. of Day Hospitals 4 No. of Community Mental Health Teams 0
No. of Community Mental Health Teams
4 Number of Day Centres
0
Number of Day Centres 2.5 Specialist Mental Health Services
No, of High Support Community Residences
2 No. of Rehab and Recovery Teams
0.5
No. of Low and Medium support Community Residences
4 (0 Med and 4 low)
No. of Liaison Psychiatry Teams 0
CAMHS No. of MHID Teams 0
Number of In Patient Beds 0
No. of Day Hospitals 0 Other – Training Centre 0

68
No. of Community Mental Health Teams
0
Corporate Goal Mental Health Strategic Priority
Actions 2016 Measure of Performance End Qtr
Goal -1 Promote health and wellbeing as part of everything we do so that people will be healthier.
Goal -2
Provide fair, equitable and timely access to quality, safe health services that people need.
Mental Health Strategic Priority 1: Promote the mental health of our population in collaboration with other services and agencies including reducing loss of life by suicide
Mental Health Strategic Priority 2:
Engage with Connecting for Life Strategy as rolled out in Kildare
Develop the Rehabilitation service in AMH KWW to enhance individual recovery and ultimately reduce the pressures on the inpatient bed resource
Plan realignment of our sector boundaries to an average population of 50,000 in line with the development of the Primary Care Networks in the area.
A plan has been developed based on identified needs of the area for 3 new 17 bed high support hostels. For submission to Estates planning meeting Feb 2016
Plan to develop a High Obs unit within existing footprint in Lakeview unit
MOU to be agreed with Portlaoise in absence of new structure, Ongoing bed shortage now at crisis in KWW
Develop a model of care for DSH in ED
Continued roll out of 3 national Clinical care
Kildare localised Connecting for Life Strategy Increase in number of individuals engaging with rehab team New aligned teams Decreasing length of stay in acute unit. Decrease in institutionalisation of individuals. Approval from Estates to proceed
Q4
Q1-Q4
Q2-4
Q2-4
Q2-4
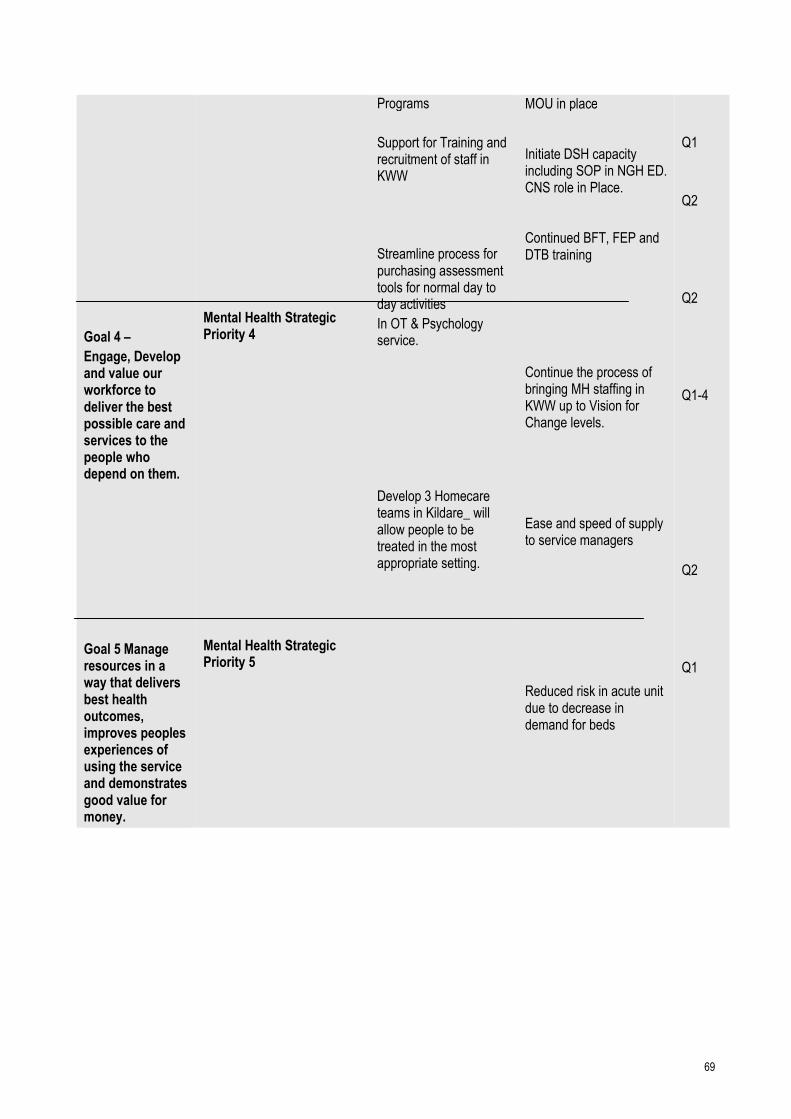
69
Goal 4 –
Engage, Develop and value our workforce to deliver the best possible care and services to the people who depend on them.
Goal 5 Manage resources in a way that delivers best health outcomes, improves peoples experiences of using the service and demonstrates good value for money.
Mental Health Strategic Priority 4
Mental Health Strategic Priority 5
Programs
Support for Training and recruitment of staff in KWW
Streamline process for purchasing assessment tools for normal day to day activities
In OT & Psychology service.
Develop 3 Homecare teams in Kildare_ will allow people to be treated in the most appropriate setting.
MOU in place Initiate DSH capacity including SOP in NGH ED. CNS role in Place. Continued BFT, FEP and DTB training Continue the process of bringing MH staffing in KWW up to Vision for Change levels. Ease and speed of supply to service managers Reduced risk in acute unit due to decrease in demand for beds
Q1
Q2
Q2
Q1-4
Q2
Q1

70
Social Care
Introduction CHO 7 Social Care Services provides older persons and disability services to a population of 668,250. The population of people over 65 years within the area is 93,039. CHO 7 is committed to developing different models of service delivery to support older people to age positively. Life expectancy for people with a disability is increasing and is welcome. CHO 7 is proactively implementing the recommendations of the key priorities nationally – such as Progressing Children’s Disability Services, New Directions Report and De-congregation Settings in partnership with Voluntary Providers. The increasing demand for services within the social care division will be a particular challenge within CHO 7 both from a financial and service delivery perspective. To remain within the financial allocation will require significant focus and cost containment measures with inherent risk to service delivery
Service Description Social Care Services within CHO 7 are focused on:
• Maximising the potential of older people, their families and local communities, to maintain people in their own
homes and communities, while delivering high quality residential care when required.
• Enabling people with disabilities to achieve their full potential living ordinary lives in ordinary places, as
independently as possible while ensuring that the voice of service users and their family is heard and that they are
fully involved in planning and improving services to meet their needs.
• Reforming our services to maximise the use of existing resources and developing sustainable models of service
provision with positive outcomes for service users, delivering best value for money.
Maximise Delivery of Social Care within Available Resources 2016
The social care allocation for CHO 7 for 2016 is €226.75m which indicates a budgetary deficit problem of €19m.
This assumes that the S38s will breakeven against budget by implementing cost containment measures as
required
Whilst continuing efforts will be made to reform and improve services based on existing values with service users at the
centre of all decision making, there will also be a focus on the cost and sustainability of services while ensuring at all
times that services are delivering best value for money for the public and service users.
The challenge for 2016 is social care’s capacity to meet the increasing demand of an ageing population, together with
changing needs and an increasing number of people with a disability with more complex service requirements. Demand
for services continues to increase as the population of 65 years and over will increase by 3.1% nationally between 2015
and 2016 and the population 85 years and over (which places the largest pressure on services) is growing at a rate of
4.2% nationally between 2015 and 2016. Additionally, the Census 2011 reports that 13% of the national population
report at least one disability and one in 10 adults of working age report a disability. To respond to the projected increase
in the number of people living with a disability in conjunction with the age profile and increased life expectancy of those
with a disability, it is necessary for a more affordable and sustainable model of services to be put in place.

71
Our operational plan for Social Care Services provides clarity as to the services we intend to provide over 2016, building
on progress made over recent years. This plan details the many actions we will undertake over the year. Our actions
and goals will be dependent primarily on financial and human resources available to us. We will endeavour to comply
with the Pay-bill Management and Control Framework within CHO 7 in all our operational endeavours and all service
provision will be subject to compliance with same. However, this creates a significant challenge for CHO 7 especially in
terms of posts which require filling that are not in the run rate.
Introduction of the Single Assessment Tool (SAT) Progress the implementation of the IT enabled standardised assessment of health and care needs of older people through the implementation of the Single Assessment Tool project. Phased implementation is planned with an initial focus on access to long term care, resulting in a minimum of 50% of NHSS application assessed using SAT by the end of 2016. Implementation for applications to home care services will follow resulting in a minimum of 25% of HCP applications assessed using SAT by the end of 2016.
Actions to Implement SAT Q Implementation of SAT initially in 4 Early Adopter sites (Beaumont, CUH, UHG & Tallaght hospitals and surrounding community locations)
− Identification of SAT assessors & release for training and completion of Training and Assessor Competency Evaluation
− Commencement of SAT assessments for 6 month period initially for older people seeking access to NHSS and thereafter HCP
Q1 – Q2 Q1 – Q2 Q1 – Q2
Evaluation of implementation in Early Adopter sites after 6 months Q3
Phased implementation into remaining locations Q3-Q4
CHO Specific Actions to Implement SAT Q
CHO Action
CHO 2, 4, 7, 9
Implementation in Early Adopter Hospital/Community Site – UGH and Galway, CUH & Cork City, Tallaght Hospital and Dublin SW, Beaumont & Dublin North
Q1- Q2
CHO 1, 3,5,6,8
Commence phased implementation following Early Adopter evaluation
Q3-Q4
The implementation of SAT will require the re-designation of a number of staff to carry out assessment s in the Community and in the acute hospital. This will impact on service provision elsewhere in the older persons’ service.
Quality and Service User Safety CHO 7 Social Care Services are committed to the continued implementation of a strong system of integrated corporate
and clinical governance within our social care services. In 2016 we will continue, subject to resources, to:
• Further develop structures and processes relating to clinical governance and proactively promote service user
involvement;
• Ensure quality standards and arrangements are enforced in accordance with statutory and organisational
requirements;
• Monitor quality improvement and patient safety through use of key performance indicators;
• Promote the prevention and control of healthcare associated infection;
• Promote risk management as everyday practice across all services and enhance the way we manage and learn
from incidents;

72
• Ensure compilation and regular review of risk registers for all services/service areas;
• Strengthen SA and GA review and management for all agencies, through an enhanced monitoring framework;
• Ensure the delivery of a high quality, patient centered service through the review of structures so as to meet the
social/ physical/ medical needs of those accessing HSE services;
• Implement the Safeguarding Vulnerable Persons at risk of abuse – National Policy and Procedures
Staffing Levels in Social Care Division
CHO / Division
Medical/ Dental Nursing
Health & Social Care Professionals
Management/ Admin
General Support Staff
Patient & Client Care Total
Change 2014 vs 2015
Social Care 22 757 266 176 280 1394 2895 +123
Services Provided
Older Persons Services
Home Support Services through Home Help, Home Care Packages and Intensive Home Care Packages
Day Care Services/Day Hospitals
Meals on Wheels Services through Voluntary Providers
Home Help Services through Voluntary Providers
Long stay Services through our Community Nursing Units and District Hospitals
Nursing Home Support Scheme
Short Stay Provision
Respite Services
Disability Services
Disability Services are mainly provided through Section 38 and 39 agencies on behalf of CHO 7, these consist of;
Residential Care
Day Care
Rehabilitation Training
Specialists Schools
Multidisciplinary Supports
Early Intervention Teams
Home Support Services
73
Service Reform Fund The CHO will engage with the Disability service reform fund as appropriate to support decongregation of institutional settings with specific priority actions in relation to St John of God Services in Celbridge and significant progress to be made with other services regarding their plans for decongregation.
Children’s’ Disability Network Teams. Work is underway in reconfiguring children’s disability services into geographically based Children’s Disability Network Teams (Early-Intervention and School-aged or 0–18 Teams), with 56 of the 129 teams reconfigured. The objective of the programme is to provide one clear referral pathway for all children (0–18s), irrespective of their disability, where they live or the school they attend. 2016 will see the completion of the full reconfiguration of 0–18s disability services into 129 Children’s Disability Network Teams. Oversight of implementation will be provided through working group 2 of the Transforming Lives process. In 2016 Social Care services will:
Complete the process of reconfiguration of 0–18s disability services into Children’s Disability Network Teams, including the provision of 75 additional WTE therapy posts through new staff appointments to reconfigured multi-disciplinary geographic based teams and through using innovative approaches to achieve targeted reductions in waiting lists for therapies.
CHO 7 will implement National Access Policy in collaboration with primary care to ensure one clear pathway of access for all children with a disability into their local services.
New Directions – reconfiguring day services including school leavers and rehabilitative training (New Funding €7.25m)
In 2015, a national project group was established to develop and oversee a process to attend to the needs of school leavers and those existing rehabilitative training (RT) that require a HSE funded adult day service.
• In 2016, CHO7 will continue the implementation of New Directions which will progress an approach of individualised
supports for all current users of HSE funded adult day services.
• Benchmark providers against standards framework developed in conjunction with NDA.
• Develop a CHO implementation structure to support New Directions.
• Develop a framework for person-centred planning.
• Support development of day places for 43 RT and 105 School leaver s in CHO 7.
National Guidelines on Accessible Health and Social Care Services
• Work with services to ensure that they are examining their services for accessibility, in line with the national
guidelines.
Governance and communication
CHO 7 will bbuild capacity to effectively manage incidents and complaints.
Service User and Family Engagement within the Disability Sector

74
• CHO 7 will continue to work with the Confidential Recipient.
• CHO 7 will continue to improve Compliance with National Standards for Disability Residential Centres – Quality Improvement Enablement Programme / Quality Improvement Team
• CHO 7 staff will continue to participate in training to improve the quality and safety of our services.
Governance and Service Arrangements
• CHO 7 will develop a strong regional capability to ensure effective governance and accountability in respect of S38
and S39 Agencies.

75
Key Priorities & Actions to Deliver on Goals in 2016 Corporate Goal Social Care
Strategic Priority Actions 2016 Measure of
Performance End Qtr
Older Persons Services
Goal 1: Promote health and wellbeing as part of everything we do so that people will be healthier
Priority: Promote Positive Ageing and Improve Physical Activity Levels
Engage with Health and Well Being Division in rolling out of National Positive Ageing Strategy and other Age Friendly initiatives with Local Authorities.
Implementation of strategies and Initiatives
Q1 - Q4
Continue to work with Co. Councils promoting Health & Well Being through LCDCs
Continued cooperation with Co. Councils
Q1 and ongoing
Goal 1: Promote health and wellbeing as part of everything we do so that people will be healthier
Priority: Implement actions from the Dementia Strategy Implementation Programme
Develop a CHO wide Strategy to implement actions from the National Dementia Strategy
Development and implementation of strategy
Q2 and ongoing
Goal 1: Promote health and wellbeing as part of everything we do so that people will be healthier
Priority: Implement Older Persons Remaining at Home (OPRAH)
Continue existing initiatives supporting OPRAH
Successful continuance of existing strategy
Q1 and ongoing
Goal 1: Promote health and wellbeing as part of everything we do so that people will be healthier
Priority: Tobacco Free Campus Policy and BISC training
Support the continued role out of the Tobacco Free Campus Policy in Social Care with set targets – 100% of new and 75% of existing sites.
Attain targets for new and existing sites to adhere to tobacco free campus policy
Q1 - Q4
Goal 1: Promote health and wellbeing as part of everything we do so that people will be healthier
Priority: Improve compliance with Safeguarding vulnerable persons at risk of abuse
Continue to improve services within the context of implementation of the Safeguarding Vulnerable Persons at Risk of Abuse Policy
Ensuring compliance with Strategy/Policy
Q1 and ongoing

76
Goal 2: Provide fair, equitable and timely access to quality, safe health services that people need
Priority: NHSS (Fair Deal)
Continue to support Fair Deal Process
Streamlined processing of applications/Maintain 4 week waiting time for approval
Q1 and ongoing
Goal 2: Provide fair, equitable and timely access to quality, safe health services that people need
Priority: Home Care Packages (HCPs) Home Care improvement Plan
Standardise processes in relation to HCP’s and Home Help provision.
HCP applications to be dealt with in an efficient and timely manner Support the development of implementation group(s) and/or pilot projects as required to progress implementation in line with national plan
Q2 Q1
Ensure fair and equitable access to HCPs Participate as required in projects to implement HCP Improvement Plan
Goal 2: Provide fair, equitable and timely access to quality, safe health services that people need
Priority: Home Help Hours (HHHs)
Continue funding of Home Help Hours to funded levels
HH applications to be dealt with in an efficient and timely manner
Q1 and ongoing
Goal 2: Provide fair, equitable and timely access to quality, safe health services that people need
Priority: Transitional Care Funding
Continue implementation of Transitional Care Funding throughout CHO 7
Ensure Transitional Care Funding applications are dealt with in an efficient and timely manner and facilitate discharge
Q1 and ongoing
Goal 2: Provide fair, equitable and timely access to quality, safe health services that people need
Priority: Enhance Respite Care Provision
Review and determine Respite Care Requirements within CHO 7
Implementation of Care Requirements
Q1 - Q4
Goal 2: Provide fair, equitable and timely access to quality, safe health services that people need.
Priority: Actions for Falls Prevention and Bone Health
Development of integrated care pathways for falls with division.
Support the division in identifying additional adapter sites in CHO 7
Q1 - Q4
Goal 2: Provide fair, equitable and timely access to quality, safe health services that people need
Priority: Actions to Implement the Carers Strategy
Progress to support and monitor the CHO projects through the assistance of a national project team.
CHO will continue to work with Local authorities in Kildare West Wicklow, Dublin South West & Dublin South East to further promote the concepts of the Age Friendly Cities and Communities Strategy.
Q1 - Q4
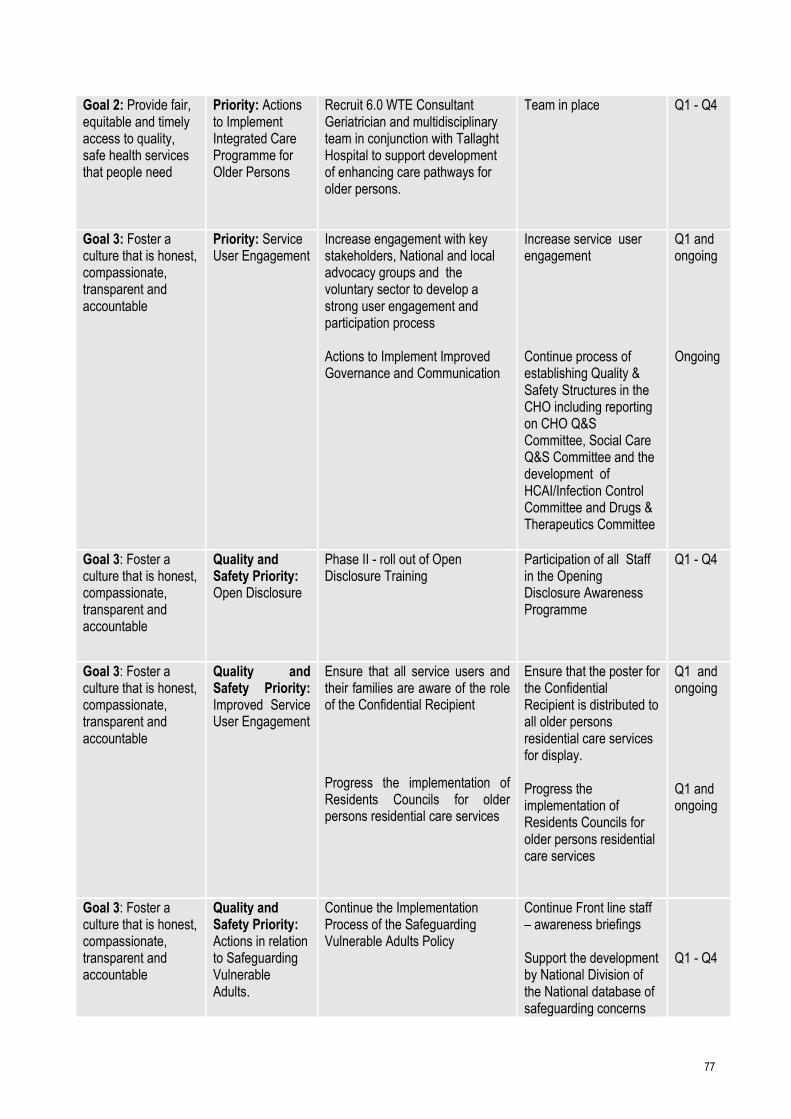
77
Goal 2: Provide fair, equitable and timely access to quality, safe health services that people need
Priority: Actions to Implement Integrated Care Programme for Older Persons
Recruit 6.0 WTE Consultant Geriatrician and multidisciplinary team in conjunction with Tallaght Hospital to support development of enhancing care pathways for older persons.
Team in place Q1 - Q4
Goal 3: Foster a culture that is honest, compassionate, transparent and accountable
Priority: Service User Engagement
Increase engagement with key stakeholders, National and local advocacy groups and the voluntary sector to develop a strong user engagement and participation process Actions to Implement Improved Governance and Communication
Increase service user engagement Continue process of establishing Quality & Safety Structures in the CHO including reporting on CHO Q&S Committee, Social Care Q&S Committee and the development of HCAI/Infection Control Committee and Drugs & Therapeutics Committee
Q1 and ongoing Ongoing
Goal 3: Foster a culture that is honest, compassionate, transparent and accountable
Quality and Safety Priority: Open Disclosure
Phase II - roll out of Open Disclosure Training
Participation of all Staff in the Opening Disclosure Awareness Programme
Q1 - Q4
Goal 3: Foster a culture that is honest, compassionate, transparent and accountable
Quality and Safety Priority: Improved Service User Engagement
Ensure that all service users and their families are aware of the role of the Confidential Recipient
Progress the implementation of Residents Councils for older persons residential care services
Ensure that the poster for the Confidential Recipient is distributed to all older persons residential care services for display. Progress the implementation of Residents Councils for older persons residential care services
Q1 and ongoing Q1 and ongoing
Goal 3: Foster a culture that is honest, compassionate, transparent and accountable
Quality and Safety Priority: Actions in relation to Safeguarding Vulnerable Adults.
Continue the Implementation Process of the Safeguarding Vulnerable Adults Policy
Continue Front line staff – awareness briefings Support the development by National Division of the National database of safeguarding concerns
Q1 - Q4

78
Goal 4: Engage, develop and value our workforce to deliver the best possible care and services to the people who depend on them
Priority: Leadership Presence
Support the development of leaders at CHO level to provide direction and purpose and connect with all staff and teams through opened and ongoing communication and engagement as a core leadership activity.
Ongoing communication and engagement from leaders.
Q1 - Q4
Goal 4: Engage, develop and value our workforce to deliver the best possible care and services to the people who depend on them
Priority: Staff Voice
Encourage feedback and value staff opinions
Service Improvements Q1 - Q 4 and ongoing
Goal 4: Engage, develop and value our workforce to deliver the best possible care and services to the people who depend on them
Priority: Staff Motivation
Foster a culture of partnership with staff
Improved staff morale and work ethic
Q1 and ongoing
Goal 4: Engage, develop and value our workforce to deliver the best possible care and services to the people who depend on them
Priority: Learning and Development Approach
Encourage staff to engage and participate in online training programmes
Better educated and motivated staff
Q1 - Q4
Goal 4: Engage, develop and value our workforce to deliver the best possible care and services to the people who depend on them
Priority: Public Residential Care Workforce Plan
Support the National Older Persons services in the development of a SMART action plan to implement the agreement reached at the Workplace Relations Commission regarding skill mix in the CHO’s,
Service Improvements Q1 - Q4

79
Goal 5: Manage resources in a way that delivers best health outcomes, improves people’s experience of using the service and demonstrates value for money
Priority: Improve compliance with HIQA residential standards
Continue working towards compliance with HIQA residential standards
Compliant with HIQA Standards
Q1 - Q4
Goal 5: Manage resources in a way that delivers best health outcomes, improves people’s experience of using the service and demonstrates value for money
Priority: Roll out of skill mix initiative to elderly residential units
Ensure skill mix is an integral component in the HR management of residential units
Appropriate skill mix present in residential units
Q2
Goal 5: Manage resources in a way that delivers best health outcomes, improves people’s experience of using the service and demonstrates value for money
Priority: Continue to address cost of care challenge in public units
Review non pay costs in public residential units
Reduction in cost of care Q1 –Q4
Goal 5: Manage resources in a way that delivers best health outcomes, improves people’s experience of using the service and demonstrates value for money
Priority: Introduction of the Single Assessment Tool (SAT)
Roll out SAT Programme in 2016 SAT to be fully implemented in CHO 7
Q4
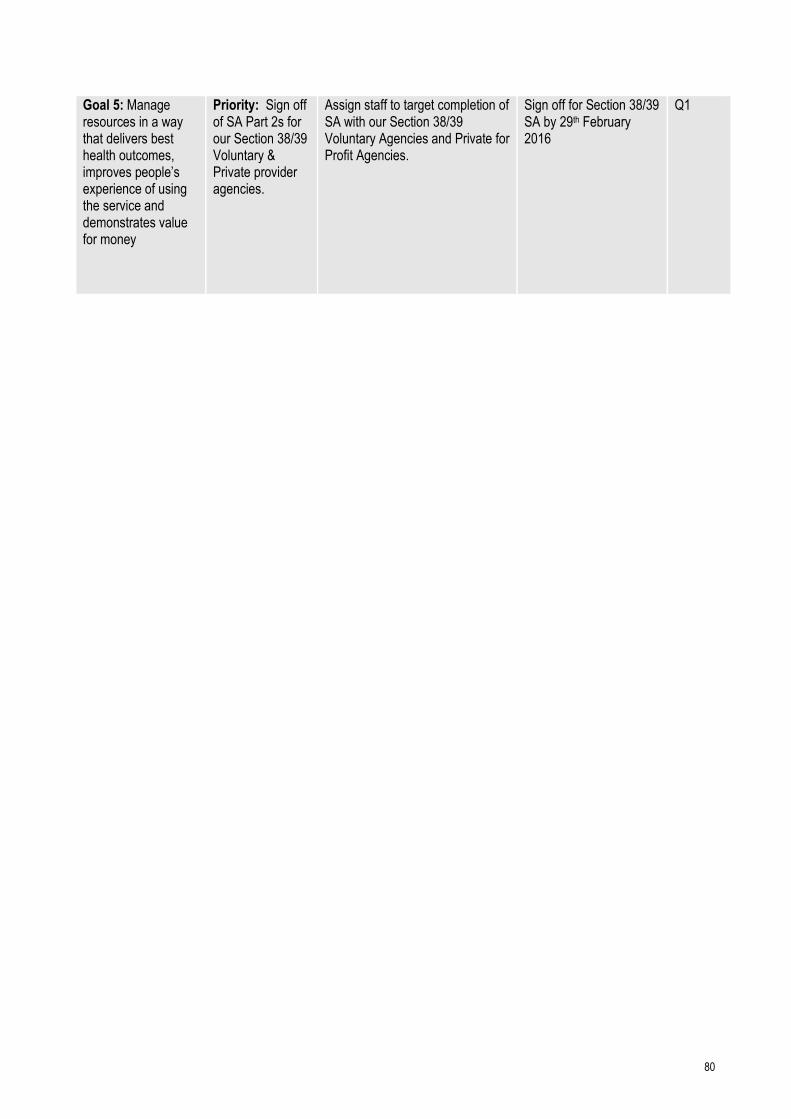
80
Goal 5: Manage resources in a way that delivers best health outcomes, improves people’s experience of using the service and demonstrates value for money
Priority: Sign off of SA Part 2s for our Section 38/39 Voluntary & Private provider agencies.
Assign staff to target completion of SA with our Section 38/39 Voluntary Agencies and Private for Profit Agencies.
Sign off for Section 38/39 SA by 29th February 2016
Q1
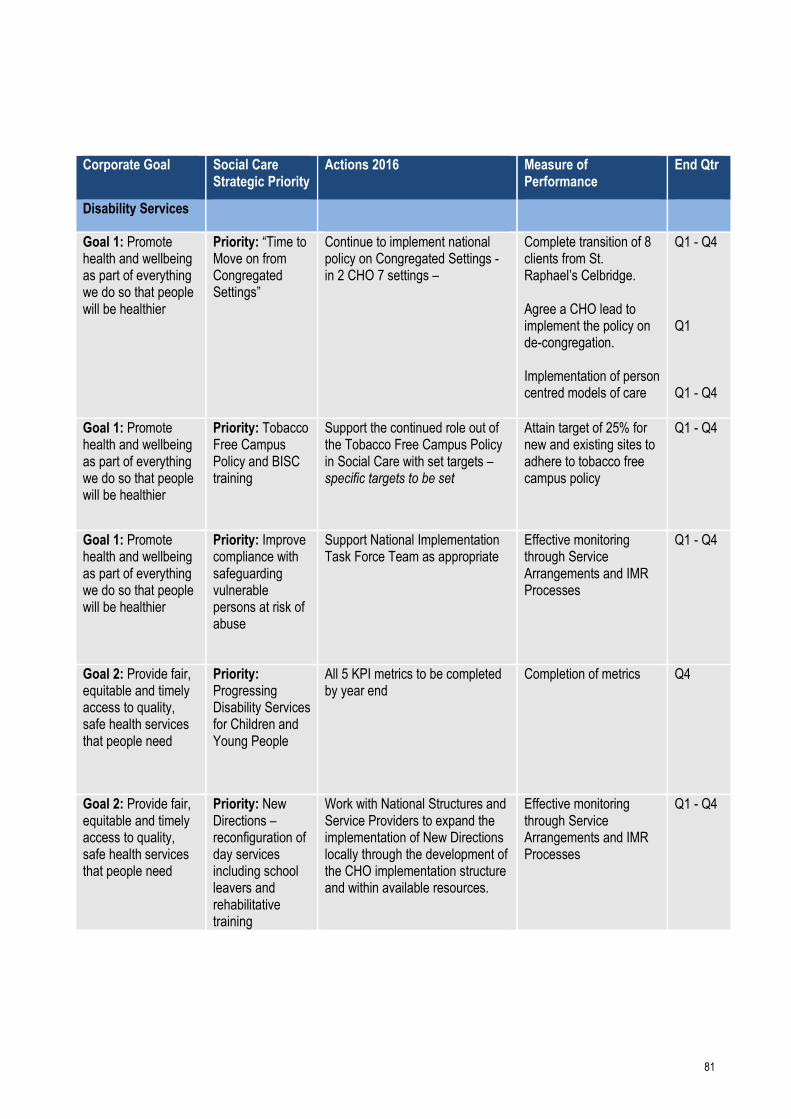
81
Corporate Goal Social Care
Strategic Priority Actions 2016 Measure of
Performance End Qtr
Disability Services
Goal 1: Promote health and wellbeing as part of everything we do so that people will be healthier
Priority: “Time to Move on from Congregated Settings”
Continue to implement national policy on Congregated Settings - in 2 CHO 7 settings –
Complete transition of 8 clients from St. Raphael’s Celbridge. Agree a CHO lead to implement the policy on de-congregation. Implementation of person centred models of care
Q1 - Q4 Q1 Q1 - Q4
Goal 1: Promote health and wellbeing as part of everything we do so that people will be healthier
Priority: Tobacco Free Campus Policy and BISC training
Support the continued role out of the Tobacco Free Campus Policy in Social Care with set targets – specific targets to be set
Attain target of 25% for new and existing sites to adhere to tobacco free campus policy
Q1 - Q4
Goal 1: Promote health and wellbeing as part of everything we do so that people will be healthier
Priority: Improve compliance with safeguarding vulnerable persons at risk of abuse
Support National Implementation Task Force Team as appropriate
Effective monitoring through Service Arrangements and IMR Processes
Q1 - Q4
Goal 2: Provide fair, equitable and timely access to quality, safe health services that people need
Priority: Progressing Disability Services for Children and Young People
All 5 KPI metrics to be completed by year end
Completion of metrics Q4
Goal 2: Provide fair, equitable and timely access to quality, safe health services that people need
Priority: New Directions – reconfiguration of day services including school leavers and rehabilitative training
Work with National Structures and Service Providers to expand the implementation of New Directions locally through the development of the CHO implementation structure and within available resources.
Effective monitoring through Service Arrangements and IMR Processes
Q1 - Q4

82
Goal 2: Provide fair, equitable and timely access to quality, safe health services that people need
Priority: Rehabilitation Strategy and Integrated Care Programme
Commence planning for implementation of neuro rehabilitation strategy at CHO level
Successful completion of strategy with timelines outlining implementation phases
Q1 - Q4
Goal 2: Provide fair, equitable and timely access to quality, safe health services that people need
Priority: Reconfiguring Disability services into Network Disability Teams.
Reconfigure into 4 x 0-18 teams in DSC and 2 x 0-18 Teams in DSW. KWW will be demonstration site for Outcomes for Children and their Families Framework
Delivery of Network Disability teams.
Q1 - Q4
Goal 2: Provide fair, equitable and timely access to quality, safe health services that people need
Priority: Demographic and Changing Need
Address emerging needs within available resources; notify national system of unmet needs and risks
Continue to monitor emerging needs at local level
Q1 and ongoing
Goal 3: Foster a culture that is honest, compassionate, transparent and accountable
Priority: Develop Improved Service User Engagement
Increase engagement with key stakeholders, advocacy groups and the voluntary sector to develop a strong user engagement and participation process
Positive feedback from service user forums
Q1 - Q4
Goal 3: Foster a culture that is honest, compassionate, transparent and accountable
Priority: Service User Engagement
Increase engagement with key stakeholders, National and local advocacy groups and the voluntary sector to develop a strong user engagement and participation process Actions to Implement Improved Governance and Communication
Increase service user engagement Continue process of establishing Quality & Safety Structures in the CHO including reporting on CHO Q&S Committee, Social Care Q&S Committee and the development of HCAI/Infection Control Committee and Drugs & Therapeutics Committee
Q1 and ongoing Ongoing
Goal 3: Foster a culture that is honest, compassionate, transparent and accountable
Quality and Safety Priority: Improved Service User Engagement
Ensure that all service users and their families are aware of the role of the Confidential Recipient
Progress the implementation of Residents Councils for older
Ensure that the poster for the Confidential Recipient is distributed to all residential care services for display. Progress the implementation of
Q1 and ongoing Q1 and

83
persons residential care services
Residents Councils for in residential care services.
ongoing
Goal 3: Foster a culture that is honest, compassionate, transparent and accountable
Quality and Safety Priority: Actions in relation to Safeguarding Vulnerable Adults.
Continue the Implementation Process of the Safeguarding Vulnerable Adults Policy
Continue Front line staff – awareness briefings Support the development by National Division of the National database of safeguarding concerns
Q1 - Q4
Goal 3: Foster a culture that is honest, compassionate, transparent and accountable
Priority: Quality Enablement Programme.
Continue to support work to improve the implementation of the Quality Improvement Division enablement programme.
Take immediate, medium and longer term actions to respond to HIQA concerns and recommendations arising from inspection findings of disability residential services
Q1 - Q4
Goal 4: Engage, develop and value our workforce to deliver the best possible care and services to the people who depend on them
Priority: Leadership Presence
Enhancement of leadership qualities though Future Leaders Programme
Ongoing communication and engagement from leaders
Q1 - Q4
Goal 4: Engage, develop and value our workforce to deliver the best possible care and services to the people who depend on them
Priority: Staff Voice
Encourage feedback and value staff opinions
Development of a culture of learning and improvement
Q1 - Q 4
Goal 4: Engage, develop and value our workforce to deliver the best possible care and services to the people who depend on them
Priority: Staff Motivation
Foster a culture of partnership with staff
Improved staff morale and work ethic
Q1 and ongoing

84
Goal 4: Engage, develop and value our workforce to deliver the best possible care and services to the people who depend on them
Priority: Learning and Development Approach
Encourage staff to engage and participate in online training programmes
Better educated and motivated staff
Q1 - Q4
Goal 5: Manage resources in a way that delivers best health outcomes, improves people’s experience of using the service and demonstrates value for money
Priority: Improve compliance with HIQA standards in disability residential centres
Continue to support system wide residential services 6 step programme
National dependency with support from nominated CHO leads
Q1 - Q4
Goal 5: Manage resources in a way that delivers best health outcomes, improves people’s experience of using the service and demonstrates value for money
Priority: Service Improvement Team
Support Service Improvement Team in the provision of guidance and support across public residential facilities in a safe, equitable and cost effective manner
Identification and implementation of models of best practice in relation to the delivery of services
Q1 and ongoing
Goal 5: Manage resources in a way that delivers best health outcomes, improves people’s experience of using the service and demonstrates value for money
Priority (Disabilities): Ensure compliance with the Pay-Bill Management and Control Framework
Monitoring and control process at CHO Level
Management of services within control framework
Q1 - Q4
Goal 5: Manage resources in a way that delivers best health outcomes, improves people’s experience of using the service and demonstrates value for money
Priority: Continuation of the VFM Programme and Policy Review
Continue to engage with National Directorate projects/actions/priorities in accordance with timelines agreed with National Directorate
Implementation of initiatives /actions to be determined in accordance with national directorate targets
Q1 - Q4

85
Goal 5: Manage resources in a way that delivers best health outcomes, improves people’s experience of using the service and demonstrates value for money
Priority: Sign off of SA Part 2s for our Section 38/39 Voluntary & Private provider agencies.
Assign staff to target completion of SA with our Section 38/39 Voluntary Agencies and Private for Profit Agencies.
Sign off for Section 38/39 SA by 29th February 2016
Q1

Appendices
Appendix 1: Primary Care Financial Tables
2016 CHO Net Expenditure Allocations
CHO Pay Non Pay Gross Budget Income Net Budget
€m €m €m €m €m
Primary Care 54.0 25.0 79.0 -.3 78.7
Social Inclusion 17.7 28.1 45.8 -.1 45.7
Palliative Care 2.3 .5 2.9 .0 2.8
Core Services 74.1 53.6 127.6 -.4 127.2
Local DLS .0 46.3 46.3 .0 46.3
Total 74.1 99.9 173.9 -.4 173.5
OLH
Primary Care .0 .0 .0 .0 .0
Social Inclusion .0 .0 .0 .0 .0
Palliative Care 23.2 5.5 28.7 -8.2 20.5
Core Services 23.2 5.5 28.7 -8.2 20.5
Local DLS .0 .0 .0 .0 .0
Total 23.2 5.5 28.7 -8.2 20.5
Total Area 7 (Incl. OLH)
Primary Care 54.0 25.0 79.0 -.3 78.7
Social Inclusion 17.7 28.1 45.8 -.1 45.7
Palliative Care 25.6 6.0 31.6 -8.3 23.3
Core Services 97.3 59.1 156.4 -8.6 147.7
Local DLS .0 46.3 46.3 .0 46.3
Total 97.3 105.3 202.6 -8.6 194.0

87
Appendix 2 – Balance Scorecard & Key Performance Indicators
Balance Scorecard – Quality and Access Indicators of Performance
Health & Wellbeing
Quality Expected Activity / Target 2016
Access Expected Activity / Target 2016
Service User Experience
• % of complaints investigated within 30 working days of being acknowledged by the complaints officer
75% National Screening Service
• BreastCheck: % BreastCheck screening uptake rate
> 70%
Safe Care
• % of Serious Reportable Events being notified within 24 hours to the Senior Accountable Officer and entered on the National Incident Management System (NIMS)
99% • CervicalCheck: % eligible women with at least one satisfactory
CervicalCheck screening in a 5 year period > 80%
• % of investigations completed within 120 days of the notification of the event to the Senior Accountable Officer
90% • BowelScreen: % of client uptake rate in the BowelScreen
programme > 45%
National Screening Service
• BreastCheck: % women offered hospital admission for treatment within 3 weeks of diagnosis of breast cancer
> 90% • Diabetic RetinaScreen: % Diabetic RetinaScreen uptake rate > 56%
• CervicalCheck: % urgent cases offered a Colposcopy appointment within 2 weeks of receipt of letter in the clinic
> 90%
Health Promotion and Improvement – Tobacco
• No. of smokers who received intensive cessation support from a cessation counsellor
11,500
Public Health – Immunisation
• % of healthcare workers who have received seasonal Flu vaccine in the 2015-2016 influenza season (acute hospitals and long term care facilities in the community)
40%
Environmental Health Service – Food Safety
• No. of official food control planned, and planned surveillance inspections of food businesses
33,000
% children aged 24 months who have received 3 doses
of the 6 in1 vaccine 95%
• % children aged 24 months who have received the Measles, Mumps, Rubella (MMR) vaccine
95%
Effective Care
Health Promotion and Improvement
• Tobacco: % of smokers on cessation programmes who were quit at one month
45%
Public Health
• Child Health: % of children reaching 10 months within the reporting period who have had child development health screening on time or before reaching 10 months of age
95%
• Immunisation: % uptake in Flu vaccine for those aged 65 and older with a medical card or GP visit card
75%
• Child Health: % of newborn babies visited by a PHN within 72 hours of discharge from maternity services
97%
Finance Expected Activity / Target 2016
HR Expected Activity / Target 2016
Budget Management including savings
Net Expenditure variance from plan (within budget)
• Pay – Direct / Agency / Overtime
0.33%
Absence
• % of absence rates by staff category <3.5%
• Non-pay 0.33% Staffing Levels and Costs
• % variance from funded staffing thresholds < 0.5%
• Income 0.33%
Health and Safety
• No. of calls that were received by the National Health and Safety Helpdesk during the quarter
15% increase
Service Arrangements / Annual Compliance Statement
• % of number of Service Arrangements signed 100%
• % of the monetary value of Service Arrangements signed
100%
• % of Annual Compliance Statements signed 100%
Capital
• Capital expenditure versus expenditure profile 100%
Key Result Areas – Governance and Compliance

88
(Development focus in 2015)
Audit
• % of internal audit recommendations implemented by due date
75%
• % of internal audit recommendations implemented, against total number of recommendations, within 12 months of report being received
95%
Balance Scorecard - Quality and Access Indicators of Performance
Quality Expected Activity / Target 2016
Primary Care
Service User Experience
• Complaints
System-wide
• % of PCTs by CHO that can evidence service user involvement. 100%
Safe Care
• Serious Reportable Events System-wide
• Safety Incident Reporting
Healthcare Associated Infections: Medication Management
• Consumption of antibiotics in community settings (defined daily doses per 1,000 population)
< 21.7
Effective Care
Community Intervention Teams (number of referrals)
• Admission Avoidance (includes OPAT)
6,941
141
• Hospital Avoidance 4,922
• Early discharge (includes OPAT) 1,878
• Unscheduled referrals from community sources 0
Health Amendment Act: Services to persons with state acquired Hepatitis C
• Number of patients who were reviewed 180
Primary Care Reimbursement Service
Effective Care
Medical Cards
• % of Medical Card / GP Visit Card applications, assigned for Medical Officer review, processed within 5 days – this is a national target
90%
• % of Medical Card / GP Visit Card applications which are accurately processed by national medical card unit staff
95%
Social Inclusion
Effective Care
Traveller Health
• No. of people who received health information on type 2 diabetes and cardiovascular health
475
Homeless Services
• % of service users admitted to homeless emergency accommodation hostels / facilities whose health needs have been assessed as part of a Holistic Needs Assessment (HNA) within two weeks of admission
85%

89
Quality Expected Activity / Target 2016
Palliative Care
Effective Care
• % of patients triaged within 1 working day of referral
90%
• % of patients with a multi-disciplinary care plan documented within 5 working days of initial review
90%
Access Expected Activity / Target 2016
Primary Care
GP Activity
• No. of contacts with GP Out of Hours service
61,997
Nursing
• No. of new patients accepted on the caseload and waiting to be seen over 12 weeks
0
Speech and Language Therapy
• % on waiting list for assessment ≤ 52 weeks
100%
• % on waiting list for treatment ≤ 52 weeks 100%
Physiotherapy and Occupational Therapy
• % of new patients seen for assessment within 12 weeks 70%
• % on waiting list for assessment ≤ 52 weeks 100%
Podiatry, Ophthalmology, Audiology, Dietetics and Psychology
Podiatry
• % on waiting list for treatment ≤ 52 weeks
100%
• % on waiting list for treatment ≤ 12 weeks 75%
Ophthalmology
• % on waiting list for treatment ≤ 52 weeks
100%
• % on waiting list for treatment ≤ 12 weeks 60%
Audiology
• % on waiting list for treatment ≤ 52 weeks
100%
• % on waiting list for treatment ≤ 12 weeks 60%
Dietetics
• % on waiting list for treatment ≤ 52 weeks
100%
• % on waiting list for treatment ≤ 12 weeks 70%
Psychology
• % on waiting list for treatment ≤ 52 weeks
100%
• % on waiting list for treatment ≤ 12 weeks 60%
Oral Health
• % of new patients who commenced treatment within 3 months of assessment
80%
Orthodontics
• % of referrals seen for assessment within 6 months
75%
• Reduce the proportion of patients on the treatment waiting list longer than 4 years (grade IV and V)
< 5%

90
Access Expected Activity / Target 2016
Primary Care Reimbursement Service
Medical Cards **
• % of completed Medical Card / GP Visit Card applications processed within 15 days
95%
• No. of persons covered by Medical Cards as at 31st December 1,675,767
• No. of persons covered by GP Visit Cards as at 31st December 485,192*
Social Inclusion
Substance Misuse
• % of substance misusers (over 18 years) for whom treatment has commenced within one calendar month following assessment
100%
• % of substance misusers (under 18 years) for whom treatment has commenced within one week following assessment
100%
• No. of clients in receipt of opioid substitution treatment (outside prisons) 3,740
• Average waiting time from referral to assessment for opioid substitution treatment 14 days
• Average waiting time from opioid substitution assessment to exit from waiting list or treatment commenced
28 days
Needle Exchange
• No. of unique individuals attending pharmacy needle exchange 0
Palliative Care
• Access to specialist inpatient bed within 7 days
98%
• Access to specialist palliative care services in the community provided within 7 days (home, nursing home, non-acute hospital)
95%
• No. of patients in receipt of specialist palliative care in the community 308
• No. of children in the care of the children’s outreach nursing team / specialist palliative care team
140
*Target does not include Universal GP Visit Cards for children aged 6 to 11 years ** These are National Targets for Medical Cards.

91

92
Balance Scorecard Mental Health
Quality and Access Indicators of Performance Expected Activity / Target 2016
Service User Experience*
• Complaints System-wide. See page 119
Safe Care
• Serious Reportable Events
• Safety Incident Reporting
CAMHs
• Admissions of children to Child and Adolescent Acute Inpatient Units as a % of the total no. of admissions of children to mental health acute inpatient units
95%
• % of bed days used in HSE Child and Adolescent Acute Inpatient Units as a total of bed days used by children in mental health acute inpatient units
95%
Effective Care
General Adult Community Mental Health Teams
• % of accepted referrals / re-referrals offered first appointment within 12 weeks / 3 months by General Adult Community Mental Health Team
90%
• % of accepted referrals / re-referrals offered first appointment and seen within 12 weeks / 3 months by General Adult Community Mental Health Team
75%
• % of new (including re-referred) General Adult Community Mental Health Team cases offered appointment and DNA in the current month
18%
Psychiatry of Old Age Community Mental Health Teams
• % of accepted referrals / re-referrals offered first appointment within 12 weeks / 3 months by Psychiatry of Old Age Community Mental Health Teams
98%
• % of accepted referrals / re-referrals offered first appointment and seen within 12 weeks / 3 months by Psychiatry of Old Age Community Mental Health Teams
95%
• % of new (including re-referred) Old Age Psychiatry Team cases offered appointment and DNA in the current month
3%
CAMHs
• % of accepted referrals / re-referrals offered first appointment within 12 weeks / 3 months by CAMH Teams
78%
• % of accepted referrals / CAMH re-referrals offered first appointment and seen within 12 weeks / 3 months by CAMH Teams
72%
• % of new (including re-referred) child / adolescent referrals offered appointment and DNA in the current month
10%
Access Expected Activity / Target 2016
Total no. to be seen or waiting to be seen by CAMHs
• Total no. to be seen for a first appointment at the end of each month.
2,449
• Total no. to be seen 0–3 months 1,308
• Total no. on waiting list for a first appointment waiting > 3 months 1,141
• Total no. on waiting list for a first appointment > 12 months 0
*An indicator in relation to Service User Experience is currently being developed and will be finalised in Q4 2016

93
Finance Indicators of Performance
Finance Expected Activity / Target 2016
Budget Management including savings
Net Expenditure variance from plan (within budget)
• Pay – Direct / Agency / Overtime
0.33%
• Non-pay 0.33%
• Income 0.33%
• Acute Hospitals private charges – Debtor Days – Consultant Sign-off 90% @ 15 days by 31/12/16
• Acute Hospitals private income receipts variance from Actual v Plan ≤ 5%
Service Arrangements / Annual Compliance Statement
• % of number of Service Arrangements signed 100%
• % of the monetary value of Service Arrangements signed 100%
• % of Annual Compliance Statements signed 100%
Capital
• Capital expenditure versus expenditure profile 100%
Audit
• % of internal audit recommendations implemented by due date
75%
• % of internal audit recommendations implemented, against total number of recommendations, within 12 months of report being received
95%
HR Indicators of Performance
HR Expected Activity / Target 2016
Absence
• % of absence rates by staff category ≤ 3.5%
Staffing Levels and Costs
• % variation from funded staffing thresholds ≤ 0.5%
Compliance with European Working Time Directive (EWTD)
• < 24 hour shift (Acute and Mental Health) 100%
• < 48 hour working week (Acute and Mental Health) 95%
Health and Safety
• No. of calls that were received by the National Health and Safety Helpdesk during the quarter 15% increase

94
Balanced Score Cards Disability Services
Quality and Safety Access
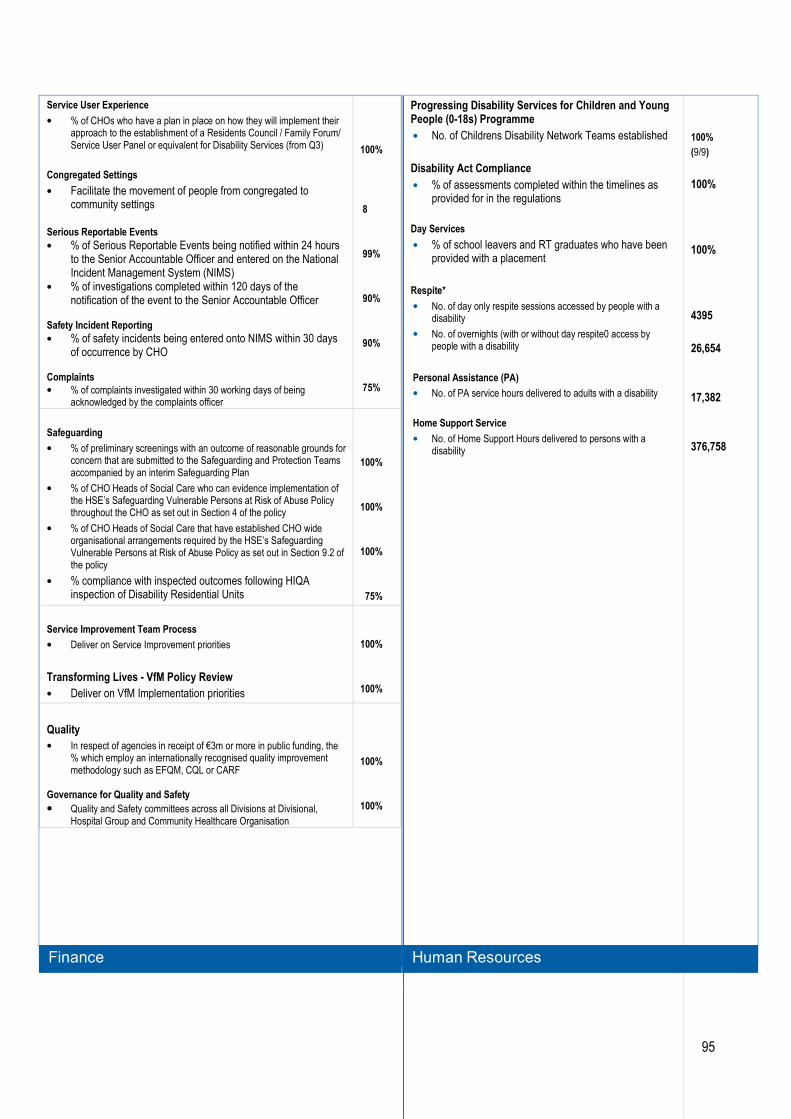
95
Service User Experience
• % of CHOs who have a plan in place on how they will implement their approach to the establishment of a Residents Council / Family Forum/ Service User Panel or equivalent for Disability Services (from Q3)
Congregated Settings
• Facilitate the movement of people from congregated to community settings
Serious Reportable Events
• % of Serious Reportable Events being notified within 24 hours to the Senior Accountable Officer and entered on the National Incident Management System (NIMS)
• % of investigations completed within 120 days of the notification of the event to the Senior Accountable Officer
Safety Incident Reporting
• % of safety incidents being entered onto NIMS within 30 days of occurrence by CHO
Complaints
• % of complaints investigated within 30 working days of being acknowledged by the complaints officer
100%
8
99%
90%
90%
75%
Safeguarding
• % of preliminary screenings with an outcome of reasonable grounds for concern that are submitted to the Safeguarding and Protection Teams accompanied by an interim Safeguarding Plan
• % of CHO Heads of Social Care who can evidence implementation of the HSE’s Safeguarding Vulnerable Persons at Risk of Abuse Policy throughout the CHO as set out in Section 4 of the policy
• % of CHO Heads of Social Care that have established CHO wide organisational arrangements required by the HSE’s Safeguarding Vulnerable Persons at Risk of Abuse Policy as set out in Section 9.2 of the policy
• % compliance with inspected outcomes following HIQA inspection of Disability Residential Units
100%
100%
100%
75%
Service Improvement Team Process
• Deliver on Service Improvement priorities
Transforming Lives - VfM Policy Review
• Deliver on VfM Implementation priorities
100%
100%
Quality
• In respect of agencies in receipt of €3m or more in public funding, the % which employ an internationally recognised quality improvement methodology such as EFQM, CQL or CARF
Governance for Quality and Safety
• Quality and Safety committees across all Divisions at Divisional, Hospital Group and Community Healthcare Organisation
100%
100%
Progressing Disability Services for Children and Young People (0-18s) Programme
• No. of Childrens Disability Network Teams established
Disability Act Compliance
• % of assessments completed within the timelines as provided for in the regulations
Day Services
• % of school leavers and RT graduates who have been provided with a placement
Respite*
• No. of day only respite sessions accessed by people with a disability
• No. of overnights (with or without day respite0 access by people with a disability
Personal Assistance (PA)
• No. of PA service hours delivered to adults with a disability
Home Support Service
• No. of Home Support Hours delivered to persons with a disability
100%
(9/9)
100%
100%
4395
26,654
17,382
376,758
Finance Human Resources
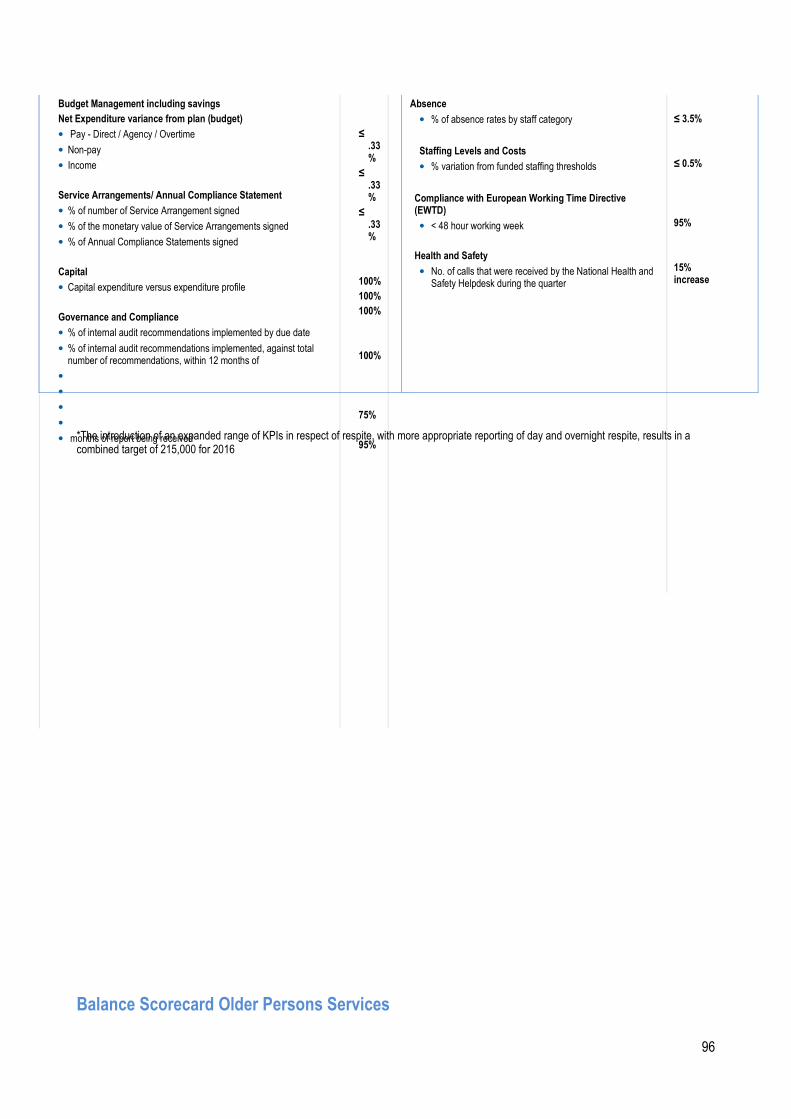
96
Budget Management including savings
Net Expenditure variance from plan (budget)
• Pay - Direct / Agency / Overtime
• Non-pay
• Income
Service Arrangements/ Annual Compliance Statement
• % of number of Service Arrangement signed
• % of the monetary value of Service Arrangements signed
• % of Annual Compliance Statements signed
Capital
• Capital expenditure versus expenditure profile
Governance and Compliance
• % of internal audit recommendations implemented by due date
• % of internal audit recommendations implemented, against total number of recommendations, within 12 months of
•
•
•
•
• months of report being received
≤ .33%
≤ .33%
≤ .33%
100%
100%
100%
100%
75%
95%
Absence
• % of absence rates by staff category
Staffing Levels and Costs
• % variation from funded staffing thresholds
Compliance with European Working Time Directive (EWTD)
• < 48 hour working week
Health and Safety
• No. of calls that were received by the National Health and Safety Helpdesk during the quarter
≤ 3.5%
≤ 0.5%
95%
15% increase
*The introduction of an expanded range of KPIs in respect of respite, with more appropriate reporting of day and overnight respite, results in a combined target of 215,000 for 2016
Balance Scorecard Older Persons Services
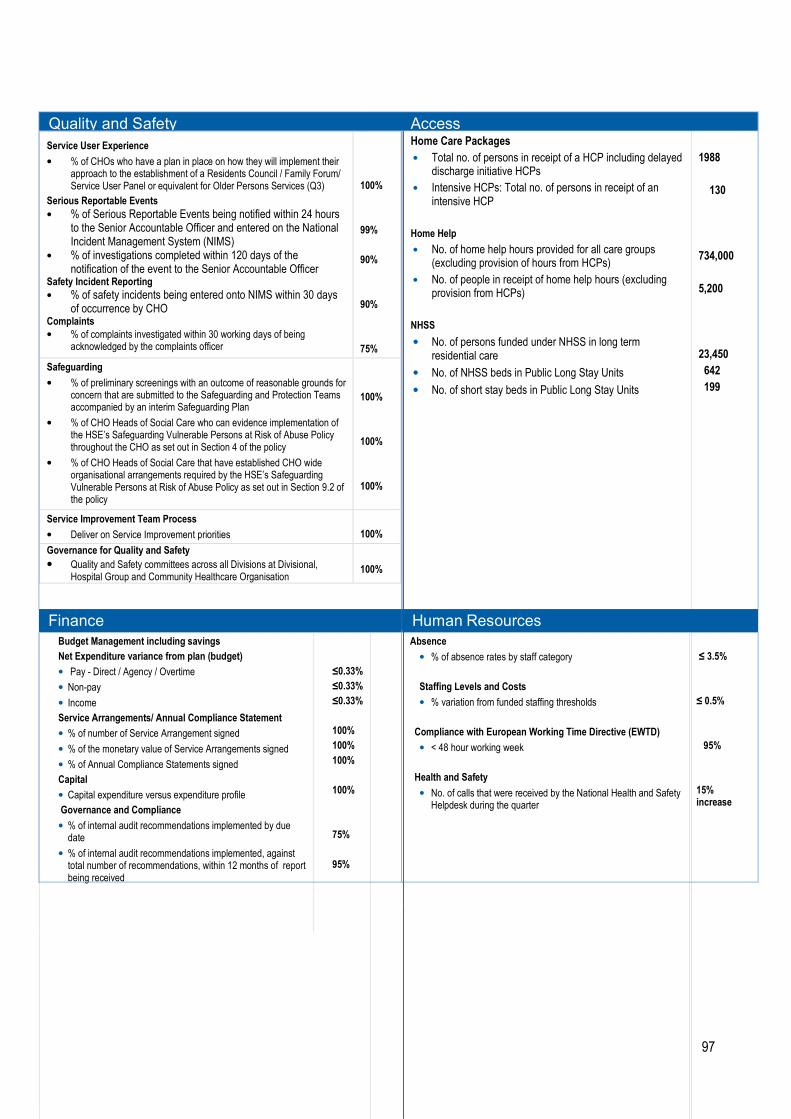
97
Quality and Safety Access
Service User Experience
• % of CHOs who have a plan in place on how they will implement their approach to the establishment of a Residents Council / Family Forum/ Service User Panel or equivalent for Older Persons Services (Q3)
Serious Reportable Events
• % of Serious Reportable Events being notified within 24 hours to the Senior Accountable Officer and entered on the National Incident Management System (NIMS)
• % of investigations completed within 120 days of the notification of the event to the Senior Accountable Officer
Safety Incident Reporting
• % of safety incidents being entered onto NIMS within 30 days of occurrence by CHO
Complaints
• % of complaints investigated within 30 working days of being acknowledged by the complaints officer
100%
99%
90%
90%
75%
Safeguarding
• % of preliminary screenings with an outcome of reasonable grounds for concern that are submitted to the Safeguarding and Protection Teams accompanied by an interim Safeguarding Plan
• % of CHO Heads of Social Care who can evidence implementation of the HSE’s Safeguarding Vulnerable Persons at Risk of Abuse Policy throughout the CHO as set out in Section 4 of the policy
• % of CHO Heads of Social Care that have established CHO wide organisational arrangements required by the HSE’s Safeguarding Vulnerable Persons at Risk of Abuse Policy as set out in Section 9.2 of the policy
100%
100%
100%
Service Improvement Team Process
• Deliver on Service Improvement priorities
100%
Governance for Quality and Safety
• Quality and Safety committees across all Divisions at Divisional, Hospital Group and Community Healthcare Organisation
100%
Home Care Packages
• Total no. of persons in receipt of a HCP including delayed discharge initiative HCPs
• Intensive HCPs: Total no. of persons in receipt of an intensive HCP
Home Help
• No. of home help hours provided for all care groups (excluding provision of hours from HCPs)
• No. of people in receipt of home help hours (excluding provision from HCPs)
NHSS
• No. of persons funded under NHSS in long term residential care
• No. of NHSS beds in Public Long Stay Units
• No. of short stay beds in Public Long Stay Units
1988
130
734,000
5,200
23,450
642
199
Finance Human Resources
Budget Management including savings
Net Expenditure variance from plan (budget)
• Pay - Direct / Agency / Overtime
• Non-pay
• Income
Service Arrangements/ Annual Compliance Statement
• % of number of Service Arrangement signed
• % of the monetary value of Service Arrangements signed
• % of Annual Compliance Statements signed
Capital
• Capital expenditure versus expenditure profile
Governance and Compliance
• % of internal audit recommendations implemented by due date
• % of internal audit recommendations implemented, against total number of recommendations, within 12 months of report being received
≤0.33%
≤0.33%
≤0.33%
100%
100%
100%
100%
75%
95%
Absence
• % of absence rates by staff category
Staffing Levels and Costs
• % variation from funded staffing thresholds
Compliance with European Working Time Directive (EWTD)
• < 48 hour working week
Health and Safety
• No. of calls that were received by the National Health and Safety Helpdesk during the quarter
≤ 3.5%
≤ 0.5%
95%
15% increase

98

99
Appendix 3 Key Performance Indicators (KPIs) Health & Wellbeing KPIs
Health and Wellbeing
Indicator Reporting Frequency
NSP 2015 Expected Activity / Target
Projected Outturn 2015
Expected Activity / Target 2016
Tobacco
No. of smokers who received intensive cessation support from a cessation counsellor
M
123
11,000
11,500
No. of frontline staff trained in brief intervention smoking cessation M 1,350 1,120 1,350
% of smokers on cessation programmes who were quit at one month Q New PI 2016 45%
Healthy Eating Active Living
No. of 5k Parkruns completed by the general public in community settings
M
New PI 2016
4,935
No. of frontline healthcare staff who have completed the physical activity e-learning module
M
New PI 2016
45
No. of people who have completed a structured patient education programme for diabetes
M
New PI 2016
200
% of PHNs trained by dietician’s in the Nutrition Reference Pack for Infants 0-12 months
Q
New PI 2016
50%
No. of people attending a structured community based healthy cooking programme M New PI 2016 900
% of preschools participating in Smart Start M New PI 2016 15%
% of primary schools trained to participate in the after schools activity programme - Be Active
M
New PI 2016
20%
Child Health
% of children reaching 10 months within the reporting period who have had child development health screening on time or before reaching 10 months of age
M
95%
93.5%
95%
% of newborn babies visited by a PHN within 72 hours of discharge from maternity services
Q 97% 97.4% 97%
% of babies breastfed (exclusively and not exclusively) at first PHN visit Q 56% 53.5% 56%
% of babies breastfed (exclusively and not exclusively) at 3 month PHN visit Q 38% 34.6% 38%
% of total number of maternity hospitals with Baby Friendly Hospital designation Bi-annual New PI 2016 58%
Immunisations and Vaccines
% children aged 12 months who have received 3 doses Diphtheria (D3), Pertussis (P3), Tetanus (T3) vaccine Haemophilus influenza type b (Hib3) Polio (Polio3) hepatitis B (HepB3) (6 in 1)
Q
95%
91.4%
95%
% children at 12 months of age who have received two doses of the Pneumococcal Conjugate vaccine (PCV2)
Q 95% 91.2% 95%
% children at 12 months of age who have received 1 dose of the Meningococcal group C vaccine (MenC2)
Q 95% 90.9% 95%
% children aged 24 months who have received 3 doses Diphtheria (D3), Pertussis (P3), Tetanus (T3) vaccine, Haemophilus influenza type b (Hib3), Polio (Polio3), hepatitis B (HepB3) (6 in 1)
Q 95% 95.0% 95%
% children aged 24 months who have received 3 doses Meningococcal C (MenC3) vaccine
Q 95% 87.2% 95%
% children aged 24 months who have received 1 dose Haemophilus influenza type B (Hib) vaccine
Q 95% 90.7% 95%
% children aged 24 months who have received 3 doses Pneumococcal Conjugate (PCV3) vaccine
Q 95% 91.5% 95%
% children aged 24 months who have received the Measles, Mumps, Rubella (MMR) vaccine
Q 95% 92.7% 95%
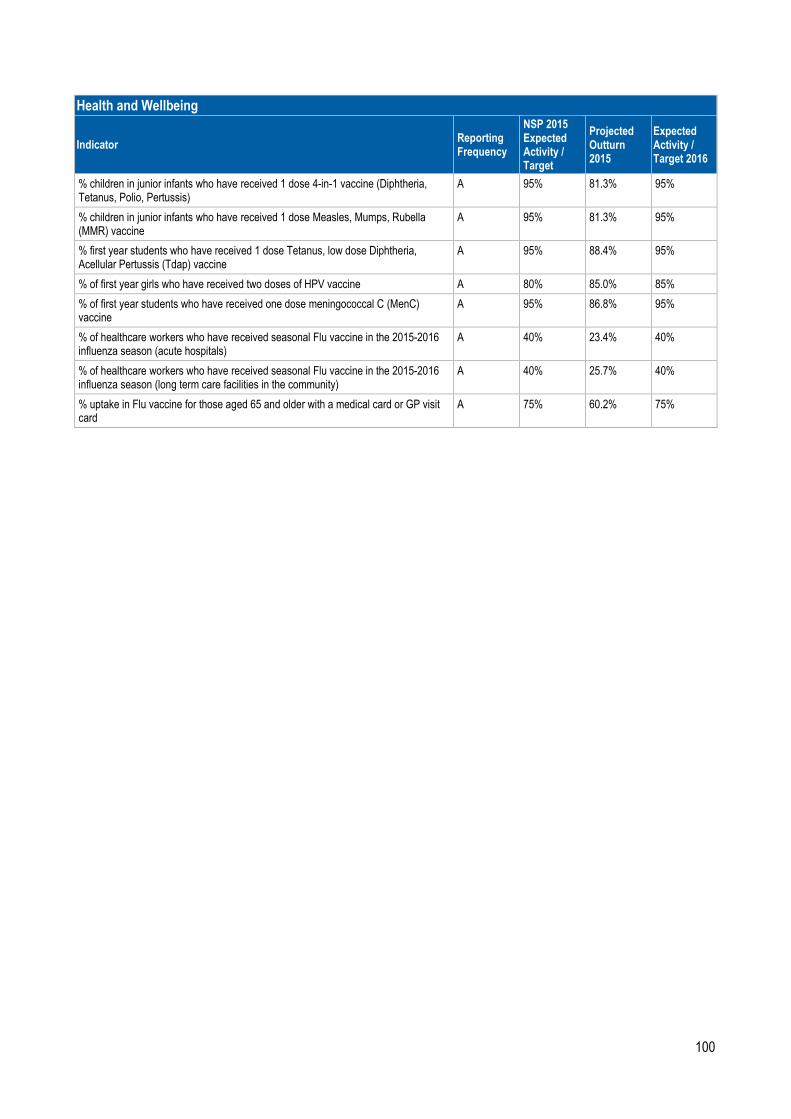
100
Health and Wellbeing
Indicator Reporting Frequency
NSP 2015 Expected Activity / Target
Projected Outturn 2015
Expected Activity / Target 2016
% children in junior infants who have received 1 dose 4-in-1 vaccine (Diphtheria, Tetanus, Polio, Pertussis)
A 95% 81.3% 95%
% children in junior infants who have received 1 dose Measles, Mumps, Rubella (MMR) vaccine
A 95% 81.3% 95%
% first year students who have received 1 dose Tetanus, low dose Diphtheria, Acellular Pertussis (Tdap) vaccine
A 95% 88.4% 95%
% of first year girls who have received two doses of HPV vaccine A 80% 85.0% 85%
% of first year students who have received one dose meningococcal C (MenC) vaccine
A 95% 86.8% 95%
% of healthcare workers who have received seasonal Flu vaccine in the 2015-2016 influenza season (acute hospitals)
A 40% 23.4% 40%
% of healthcare workers who have received seasonal Flu vaccine in the 2015-2016 influenza season (long term care facilities in the community)
A 40% 25.7% 40%
% uptake in Flu vaccine for those aged 65 and older with a medical card or GP visit card
A 75% 60.2% 75%
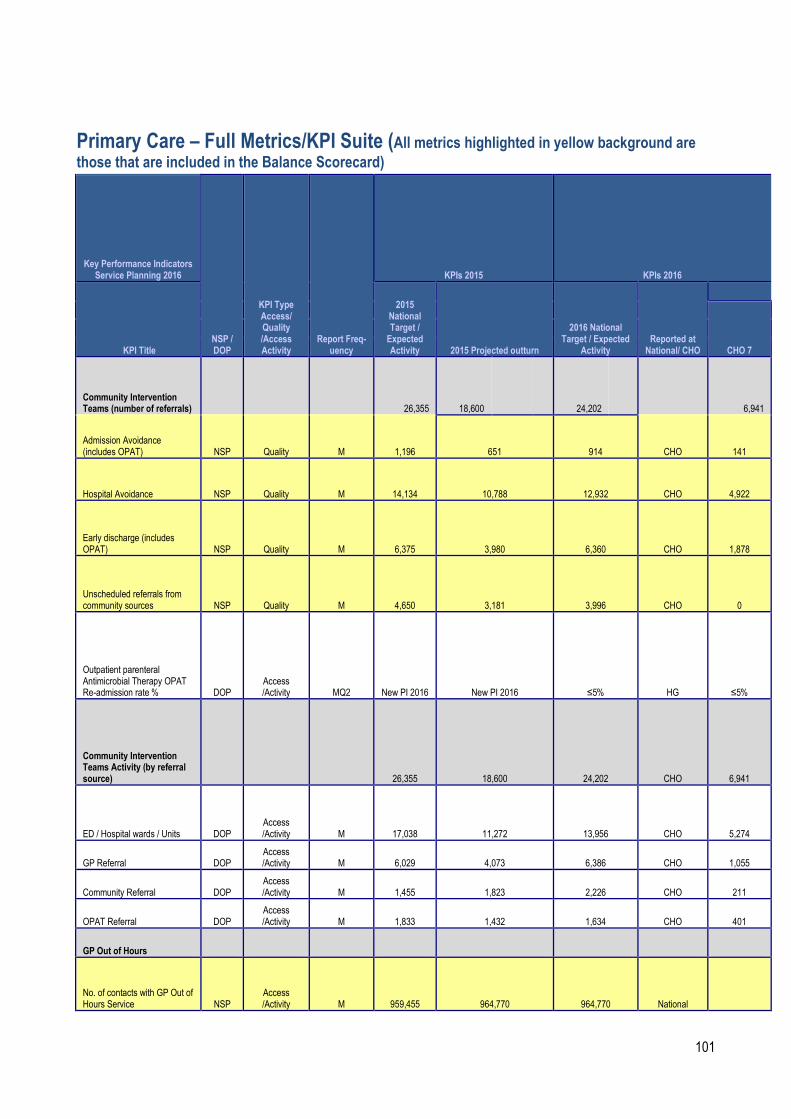
101
Primary Care – Full Metrics/KPI Suite (All metrics highlighted in yellow background are those that are included in the Balance Scorecard)
Key Performance Indicators Service Planning 2016
NSP / DOP
KPI Type Access/ Quality /Access Activity
Report Freq-uency
KPIs 2015 KPIs 2016
KPI Title
2015 National Target / Expected Activity 2015 Projected outturn
2016 National Target / Expected
Activity Reported at National/ CHO
CHO 7
Community Intervention Teams (number of referrals) 26,355 18,600 24,202 6,941
Admission Avoidance (includes OPAT) NSP Quality M 1,196 651 914 CHO 141
Hospital Avoidance NSP Quality M 14,134 10,788 12,932 CHO 4,922
Early discharge (includes OPAT) NSP Quality M 6,375 3,980 6,360 CHO 1,878
Unscheduled referrals from community sources NSP Quality M 4,650 3,181 3,996 CHO 0
Outpatient parenteral Antimicrobial Therapy OPAT Re-admission rate % DOP
Access /Activity MQ2 New PI 2016 New PI 2016 ≤5% HG ≤5%
Community Intervention Teams Activity (by referral source) 26,355 18,600 24,202 CHO 6,941
ED / Hospital wards / Units DOP Access /Activity M 17,038 11,272 13,956 CHO 5,274
GP Referral DOP Access /Activity M 6,029 4,073 6,386 CHO 1,055
Community Referral DOP Access /Activity M 1,455 1,823 2,226 CHO 211
OPAT Referral DOP Access /Activity M 1,833 1,432 1,634 CHO 401
GP Out of Hours
No. of contacts with GP Out of Hours Service NSP
Access /Activity M 959,455 964,770 964,770 National

102
Tobacco Control
% of primary care staff to undertake brief intervention training for smoking cessation DOP Quality Q New 2016 New 2016 5% CHO 5%
Physiotherapy
No of patient referrals DOP Activity M 184,596 192,884 193,677 CHO 22,237
No of patients seen for a first time assessment DOP Activity M 159,260 158,262 160,017 CHO 16,886
No of patients treated in the reporting month (monthly target) DOP Activity M 34,993 35,291 36,430 CHO 4,171
No of face to face contacts/visits DOP Activity M 770,878 767,109 775,864 CHO 85,229
Total No. of physiotherapy patients on the assessment waiting list at the end of the reporting period * DOP Access M New PI 2016 New PI 2016 28,527 CHO 2,791
No. of physiotherapy patients on the assessment waiting list at the end of the reporting period 0 - ≤ 12 weeks DOP Access M New PI 2016 New PI 2016 No target CHO No target
No. of physiotherapy patients on the assessment waiting list at the end of the reporting period >12 weeks - ≤ 26 weeks DOP Access M New PI 2016 New PI 2016 No target CHO No target
No. of physiotherapy patients on the assessment waiting list at the end of the reporting period >26 weeks but ≤ 39 weeks DOP Access M New PI 2016 New PI 2016 No target CHO No target
No. of physiotherapy patients on the assessment waiting list at the end of the reporting period >39 weeks but ≤ 52 weeks DOP Access M New PI 2016 New PI 2016 No target CHO No target

103
No. of physiotherapy patients on the assessment waiting list at the end of the reporting period > 52 weeks DOP Access M New PI 2016 New PI 2016 No target CHO No target
% of new patients seen for assessment within 12 weeks NSP Access M 80%
83%
70% CHO 70% Data Gap
% on waiting list for assessment ≤ to 52 weeks NSP Access M New PI 2016 New PI 2016 100% CHO 100%
% on waiting lists for assessment ≤ 39 weeks DOP Access M New PI 2016 New PI 2016
95%
CHO
95%
% on waiting lists for assessment ≤ 26 weeks DOP Access M New PI 2016 New PI 2016
90%
CHO
90%
Occupational Therapy
No of patient referrals DOP Activity M 85,030 88,162 89,989 CHO 13,286
No of new patients seen for a first assessment DOP Activity M 83,004 84,983 86,499 CHO 14,611
No of patients treated (direct and indirect) monthly target DOP Activity M 19,811 20,070 20,291 CHO 2,835
Total No. of occupational therapy patients on the assessment waiting list at the end of the reporting period ** DOP Access M New PI 2016 New PI 2016 19,932 CHO 2,329
No. of occupational therapy patients on the assessment waiting list at the end of the reporting period 0 - ≤ 12 weeks DOP Access M New PI 2016 New PI 2016 No target CHO No target
No. of occupational therapy patients on the assessment waiting list at the end of the reporting period >12 weeks - ≤ 26 weeks DOP Access M New PI 2016 New PI 2016 No target CHO No target
No. of occupational therapy patients on the assessment waiting list at the end of the reporting period >26 weeks but ≤ 39 weeks DOP Access M New PI 2016 New PI 2016 No target CHO No target

104
No. of occupational therapy patients on the assessment waiting list at the end of the reporting period >39 weeks but ≤ 52 weeks DOP Access M New PI 2016 New PI 2016 No target CHO No target
No. of occupational therapy patients on the assessment waiting list at the end of the reporting period > 52 weeks DOP Access M New PI 2016 New PI 2016 No target CHO No target
% of new patients seen for assessment within 12 weeks NSP Access M 80%
76%
70% CHO 70% Data Gaps
% on waiting list for assessment ≤ to 52 weeks NSP Access M New PI 2016 New PI 2016 100% CHO 100%
% on waiting lists for assessment ≤ 39 weeks DOP Access M New PI 2016 New PI 2016
95%
CHO
95%
% on waiting lists for assessment ≤ 26 weeks DOP Access M New PI 2016 New PI 2016
80%
CHO
80%
Orthodontics
No. of patients receiving active treatment at the end of the reporting period DOP Access Q 21,050 16,887 16,887
National/
former region
% of referrals seen for assessment within 6 months NSP Access Q 75% 74% 75%
National/
former region
% on waiting list for assessment ≤ 12 months DOP Access Q 100% 99.80% 100%
National/
former region
% of patients on the treatment waiting list less than 2 years DOP Access Q 75% 60% 75%
National/
former region
% of patients on treatment waiting list less than 4 years (grade 4 and 5) DOP Access Q 95% 92% 95%
National/
former region
No. of patients on the assessment waiting list at the
DOP Access Q 6,165 5,966 5,966
National/

105
end of the reporting period former region
No. of patients on the treatment waiting list – grade 4 –at the end of the reporting period DOP
Access /Activity Q 9,444 9,912 9,912
National/
former region
No. of patients on the treatment waiting list – grade 5 –at the end of the reporting period DOP
Access /Activity Q 7,562 8,194 8,194
National/
former region
Reduce the proportion of patients on the treatment waiting list longer than 4 years (grade IV and V) NSP Access Q <5% 8% <5%
National/
former region
Oral Health (Primary Dental Care and Orthodontics)
No. of new patients attending for Scheduled Assessment DOP
Access /Activity M
No Target 2015 Unavailable Unavailable CHO Unavailable
No. of new patients attending for Unscheduled Assessment DOP
Access /Activity M
No Target 2015 Unavailable Unavailable CHO Unavailable
% of new patients who commenced treatment within 3 months of assessment NSP Access M
No Target 2015 Not Available 80% CHO 80%
Healthcare Associated Infections: Medication Management CHO
Consumption of antibiotics in community settings (defined daily doses per 1,000 population) NSP Quality <21.7 25.7 <21.7 National
Primary Care – Psychology
No. of patient referrals DOP Activity M New 12,250 12,261 CHO 1,467
Existing patients seen in the month DOP Activity M
No Target 2015 2,601 2,626 CHO 194

106
New patients seen DOP Activity M No Target 2015 9,387 9,367 CHO 1,368
Total No. of psychology patients on the treatment waiting list at the end of the reporting period * DOP Access M New PI 2016 New PI 2016 6,028 CHO 609
No. of psychology patients on the treatment waiting list at the end of the reporting period 0 - ≤ 12 weeks DOP Access M New PI 2016 New PI 2016 No target CHO No target
No. of psychology patients on the treatment waiting list at the end of the reporting period >12 weeks - ≤ 26 weeks DOP Access M New PI 2016 New PI 2016 No target CHO No target
No. of psychology patients on the treatment waiting list at the end of the reporting period >26 weeks but ≤ 39 weeks DOP Access M New PI 2016 New PI 2016 No target CHO No target
No. of psychology patients on the treatment waiting list at the end of the reporting period >39 weeks but ≤ 52 weeks DOP Access M New PI 2016 New PI 2016 No target CHO No target
No. of psychology patients on the treatment waiting list at the end of the reporting period > 52 weeks DOP Access M New PI 2016 New PI 2016 No target CHO No target
% on waiting list for treatment ≤ to 52 weeks NSP Access M New PI 2016 New PI 2016 100% CHO 100%
% on waiting lists for treatment ≤ 39 weeks DOP Access M New PI 2016 New PI 2016
90%
CHO
90%
% on waiting lists for treatment ≤ 26 weeks DOP Access M New PI 2016 New PI 2016
80%
CHO
80%

107
% on waiting lists for treatment ≤ 12 weeks NSP Access M New PI 2016 New PI 2016
60%
CHO
60%
Primary Care – Podiatry
No. of patient referrals DOP Activity M New 10,689 11,589 CHO No direct service
Existing patients seen in the month DOP Activity M
No Target 2015 5,095 5,210 CHO
No direct service
New patients seen DOP Activity M No Target 2015 7,279 8,887 CHO
No direct service
Total No. of podiatry patients on the treatment waiting list at the end of the reporting period * DOP Access M New PI 2016 New PI 2016 3,186 CHO
No direct service
No. of podiatry patients on the treatment waiting list at the end of the reporting period 0-12 weeks DOP Access M New PI 2016 New PI 2016 No target CHO No target
No. of podiatry patients on the treatment waiting list at the end of the reporting period 12 weeks ≤ 26 weeks DOP Access M New PI 2016 New PI 2016 No target CHO No target
No. of podiatry patients on the treatment waiting list at the end of the reporting period 26 weeks ≤ 39 weeks DOP Access M New PI 2016 New PI 2016 No target CHO No target
No. of podiatry patients on the treatment waiting list at the end of the reporting period 39 weeks ≤ 52 weeks DOP Access M New PI 2016 New PI 2016 No target CHO No target
No. of podiatry patients on the treatment waiting list at the end of the reporting period > 52 weeks DOP Access M New PI 2016 New PI 2016 No target CHO No target
% on waiting list for treatment ≤ to 52 weeks NSP Access M New PI 2016 New PI 2016 100% CHO 100%
% on waiting lists for treatment ≤ 39 weeks DOP Access M New PI 2016 New PI 2016 95% CHO 95%
% on waiting lists for treatment ≤ 26 weeks DOP Access M New PI 2016 New PI 2016 90% CHO 90%
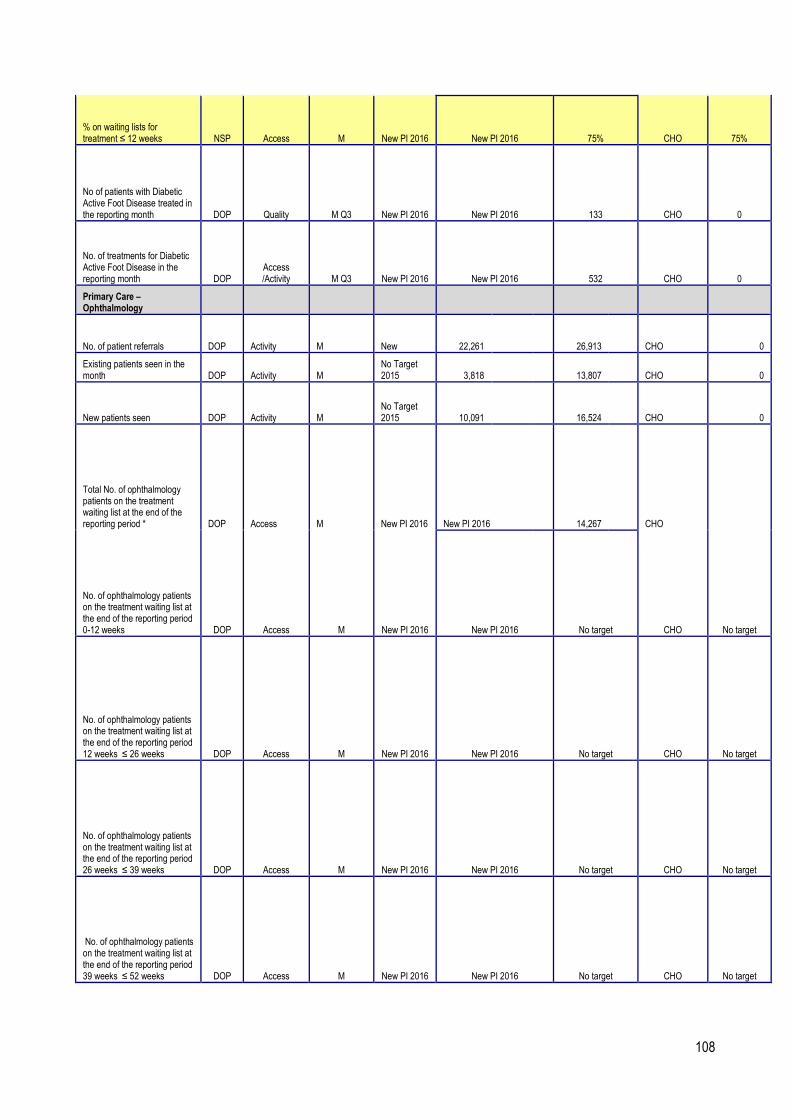
108
% on waiting lists for treatment ≤ 12 weeks NSP Access M New PI 2016 New PI 2016 75% CHO 75%
No of patients with Diabetic Active Foot Disease treated in the reporting month DOP Quality M Q3 New PI 2016 New PI 2016 133 CHO 0
No. of treatments for Diabetic Active Foot Disease in the reporting month DOP
Access /Activity M Q3 New PI 2016 New PI 2016 532 CHO 0
Primary Care – Ophthalmology
No. of patient referrals DOP Activity M New 22,261 26,913 CHO 0
Existing patients seen in the month DOP Activity M
No Target 2015 3,818 13,807 CHO 0
New patients seen DOP Activity M No Target 2015 10,091 16,524 CHO 0
Total No. of ophthalmology patients on the treatment waiting list at the end of the reporting period * DOP Access M New PI 2016 New PI 2016 14,267 CHO
No. of ophthalmology patients on the treatment waiting list at the end of the reporting period 0-12 weeks DOP Access M New PI 2016 New PI 2016 No target CHO No target
No. of ophthalmology patients on the treatment waiting list at the end of the reporting period 12 weeks ≤ 26 weeks DOP Access M New PI 2016 New PI 2016 No target CHO No target
No. of ophthalmology patients on the treatment waiting list at the end of the reporting period 26 weeks ≤ 39 weeks DOP Access M New PI 2016 New PI 2016 No target CHO No target
No. of ophthalmology patients on the treatment waiting list at the end of the reporting period 39 weeks ≤ 52 weeks DOP Access M New PI 2016 New PI 2016 No target CHO No target
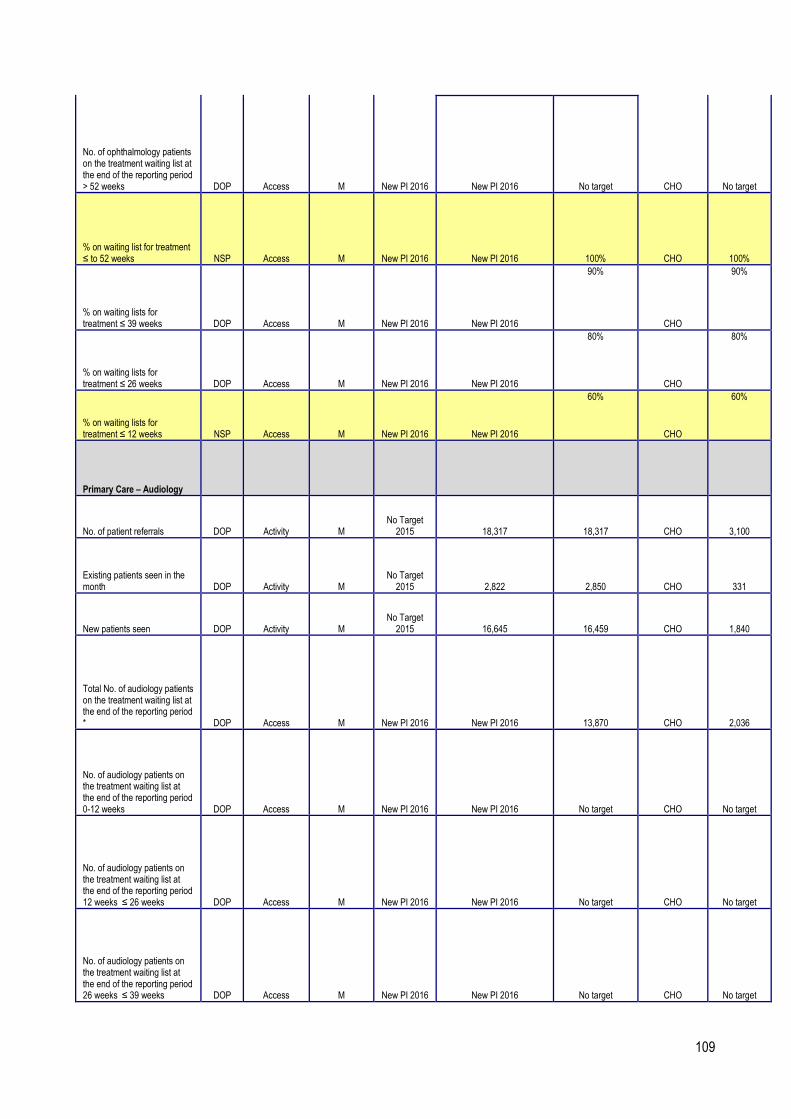
109
No. of ophthalmology patients on the treatment waiting list at the end of the reporting period > 52 weeks DOP Access M New PI 2016 New PI 2016 No target CHO No target
% on waiting list for treatment ≤ to 52 weeks NSP Access M New PI 2016 New PI 2016 100% CHO 100%
% on waiting lists for treatment ≤ 39 weeks DOP Access M New PI 2016 New PI 2016
90%
CHO
90%
% on waiting lists for treatment ≤ 26 weeks DOP Access M New PI 2016 New PI 2016
80%
CHO
80%
% on waiting lists for treatment ≤ 12 weeks NSP Access M New PI 2016 New PI 2016
60%
CHO
60%
Primary Care – Audiology
No. of patient referrals DOP Activity M No Target 2015 18,317 18,317 CHO 3,100
Existing patients seen in the month DOP Activity M
No Target 2015 2,822 2,850 CHO 331
New patients seen DOP Activity M No Target 2015 16,645 16,459 CHO 1,840
Total No. of audiology patients on the treatment waiting list at the end of the reporting period * DOP Access M New PI 2016 New PI 2016 13,870 CHO 2,036
No. of audiology patients on the treatment waiting list at the end of the reporting period 0-12 weeks DOP Access M New PI 2016 New PI 2016 No target CHO No target
No. of audiology patients on the treatment waiting list at the end of the reporting period 12 weeks ≤ 26 weeks DOP Access M New PI 2016 New PI 2016 No target CHO No target
No. of audiology patients on the treatment waiting list at the end of the reporting period 26 weeks ≤ 39 weeks DOP Access M New PI 2016 New PI 2016 No target CHO No target

110
No. of audiology patients on the treatment waiting list at the end of the reporting period 39 weeks ≤ 52 weeks DOP Access M New PI 2016 New PI 2016 No target CHO No target
No. of audiology patients on the treatment waiting list at the end of the reporting period > 52 weeks DOP Access M New PI 2016 New PI 2016 No target CHO No target
% on waiting list for treatment ≤ to 52 weeks NSP Access M New PI 2016 New PI 2016 100% CHO 100%
% on waiting lists for treatment ≤ 39 weeks DOP Access M New PI 2016 New PI 2016
90%
CHO
90%
% on waiting lists for treatment ≤ 26 weeks DOP Access M New PI 2016 New PI 2016
80%
CHO
80%
% on waiting lists for treatment ≤ 12 weeks NSP Access M New PI 2016 New PI 2016
60%
CHO
60%
Primary Care – Dietetics
No. of patient referrals DOP Activity M No Target 2015
25,138
27,858 CHO 2,613 (data gap)
Existing patients seen in the month DOP Activity M
No Target 2015
3,393
5,209 CHO 220 (data gap)
New patients seen DOP Activity M No Target 2015
19,281
21,707 CHO 1,767
(data gap)
Total No. of dietetics patients on the treatment waiting list at the end of the reporting period * DOP Access M New PI 2016 New 2016 5,479 CHO 486
No. of dietetics patients on the treatment waiting list at the end of the reporting period 0-12 weeks
DOP Access M New PI 2016 New PI 2016 No target CHO No target
No. of dietetics patients on the treatment waiting list at the end of the reporting period 12 weeks ≤ 26 weeks
DOP Access M New PI 2016 New PI 2016 No target CHO No target

111
No. of dietetics patients on the treatment waiting list at the end of the reporting period 26 weeks ≤ 39 weeks
DOP Access M New PI 2016 New PI 2016 No target CHO No target
No. of dietetics patients on the treatment waiting list at the end of the reporting period 39 weeks ≤ 52 weeks
DOP Access M New PI 2016 New PI 2016 No target CHO No target
No. of dietetics patients on the treatment waiting list at the end of the reporting period > 52 weeks
DOP Access M New PI 2016 New PI 2016 No target CHO No target
% on waiting list for treatment ≤ to 52 weeks NSP Access M New PI 2016 New PI 2016 100% CHO 100%
% on waiting lists for treatment ≤ 39 weeks
DOP Access M New PI 2016 New PI 2016
95%
CHO
95%
% on waiting lists for treatment ≤ 26 weeks
DOP Access M New PI 2016 New PI 2016
85%
CHO
85%
% on waiting lists for treatment ≤ 12 weeks
NSP Access M New PI 2016 New PI 2016
70%
CHO
70%
Primary Care – Nursing
No. of patient referrals DOP Activity M No Target 2015 150,768 159,694 CHO
1,702 (Data gap)
Existing patients seen in the month DOP Activity M
No Target 2015 63,724 64,660 CHO
1,800 (Data gap)
New patients seen DOP Activity M No Target 2015 115,785 123,024 CHO
1,884 (Data gap)
Number of new patients accepted on the caseload and waiting to be seen over 12 weeks NSP Access M New 2016 New 2016 0 CHO 0
Primary Care – Speech and Language Therapy***

112
No. of patient referrals DOP Activity M No Target 2015 50,863 50,863 CHO 5,769
Existing patients seen in the month DOP Activity M Q2 New 2016 New PI 2016 New PI 2016 CHO New PI 2016
New patients seen for initial assessment DOP Activity M
No Target 2015 41,083 41,083 CHO 4,045
Total No. of speech and language patients waiting initial assessment at end of the reporting period **** DOP Access M New 2016 New PI 2016 13,050 CHO 3,057
Total No. of speech and language patients waiting initial therapy at end of the reporting period **** DOP Access M New 2016 New PI 2016 8,279 CHO 1,060
% on waiting list for assessment ≤ to 52 weeks NSP Access M New PI 2016 New PI 2016 100% CHO 100%
% on waiting list for treatment ≤ to 52 weeks NSP Access M New PI 2016 New PI 2016 100% CHO 100%
Health Amendment Act - Services to persons with state acquired Hepatitis C
No. of patient who were reviewed. NSP Quality Q 820 22 798 National 180
Note: All waiting list targets reflect end of year target.
*Monthly average based on April – Oct 2015 submitted data.
** Monthly average based on July – Oct 2015 submitted data.
*** Speech and Language Therapy Data includes all non – acute activity across the care groups.
**** SLT Monthly average based on Jan – Oct. 2015 submitted data

113
Quality and Patient Safety – Full Metrics/KPI Suite (All metrics highlighted in yellow background are those that are included in the Balance Scorecard)
Key Performance Indicators Service Planning 2016 KPIs 2015 KPIs 2016
KPI Title NSP / DOP
KPI Type Access/
Quality /Access
Activity
Report
Freq-uency
2015 National Target / Expected Activity
2015 Projected outturn
2016 National Target / Expected Activity
Reported at
National / CHO CHO 7
Quality and Patient Safety
Service User Experience
% ratio of compliments to complaints by CHO DOP Quality Q New PI 2016 New PI 2016 New PI 2016 CHO
New PI 2016
% of complaints investigated within 30 working days of being acknowledged by the complaints officer (mandatory)
NSP Quality M System Wide New PI 2016 75% CHO 75%
Service User Involvement

114
% of PCTs by CHO, that can evidence service user involvement as required by Action 19 of the Primary Care Strategy – A New Direction (2001)
NSP Quality Q Q3 System wide New PI 2016 100% CHO 100%
Serious Reportable Events
% of Serious Reportable Events being notified within 24 hours to the Senior Accountable Officer (mandatory) and entered on the National Incident Management System (NIMS)*
NSP Quality M System wide New PI 2016 99% CHO 99%
% of investigations completed within 120 days of event occurrence)
NSP Quality M System wide New PI 2016 90% CHO 90%
Safety Incidence Reporting

115
% of Safety Incidents being entered on the National Incident Management System (NIMS) within 30 days of occurrence
NSP Quality Q System wide New PI 2016 90% CHO 90%
% of claims received by State Claims Agency that were not reported previously as an incident
NSP Quality A System wide New PI 2016 New PI 2016 CHO New PI 2016
* All incidents including SREs are to be reported on NIMS. Until IIMS has been formally stood down, all SREs must also be reported onto the Incident Information Management System (IIMS)
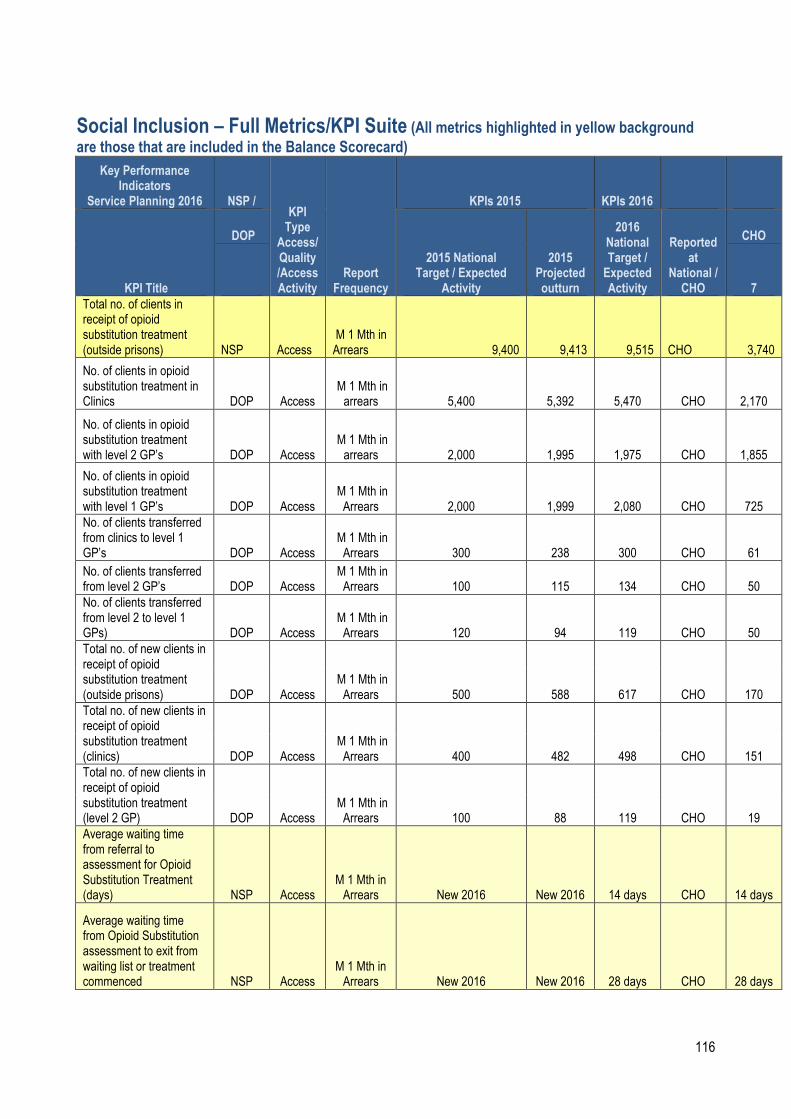
116
Social Inclusion – Full Metrics/KPI Suite (All metrics highlighted in yellow background are those that are included in the Balance Scorecard)
Key Performance Indicators
Service Planning 2016 NSP / KPI Type Access/ Quality /Access Activity
Report Frequency
KPIs 2015 KPIs 2016
KPI Title
DOP
2015 National Target / Expected
Activity
2015 Projected outturn
2016 National Target / Expected Activity
Reported at
National / CHO
CHO
7
Total no. of clients in receipt of opioid substitution treatment (outside prisons) NSP Access
M 1 Mth in Arrears 9,400 9,413 9,515 CHO 3,740
No. of clients in opioid substitution treatment in Clinics DOP Access
M 1 Mth in arrears 5,400 5,392 5,470 CHO 2,170
No. of clients in opioid substitution treatment with level 2 GP’s DOP Access
M 1 Mth in arrears 2,000 1,995 1,975 CHO 1,855
No. of clients in opioid substitution treatment with level 1 GP’s DOP Access
M 1 Mth in Arrears 2,000 1,999 2,080 CHO 725
No. of clients transferred from clinics to level 1 GP’s DOP Access
M 1 Mth in Arrears 300 238 300 CHO 61
No. of clients transferred from level 2 GP’s DOP Access
M 1 Mth in Arrears 100 115 134 CHO 50
No. of clients transferred from level 2 to level 1 GPs) DOP Access
M 1 Mth in Arrears 120 94 119 CHO 50
Total no. of new clients in receipt of opioid substitution treatment (outside prisons) DOP Access
M 1 Mth in Arrears 500 588 617 CHO 170
Total no. of new clients in receipt of opioid substitution treatment (clinics) DOP Access
M 1 Mth in Arrears 400 482 498 CHO 151
Total no. of new clients in receipt of opioid substitution treatment (level 2 GP) DOP Access
M 1 Mth in Arrears 100 88 119 CHO 19
Average waiting time from referral to assessment for Opioid Substitution Treatment (days) NSP Access
M 1 Mth in Arrears New 2016 New 2016 14 days CHO 14 days
Average waiting time from Opioid Substitution assessment to exit from waiting list or treatment commenced NSP Access
M 1 Mth in Arrears New 2016 New 2016 28 days CHO 28 days

117
Key Performance Indicators
Service Planning 2016 NSP / KPI Type Access/ Quality /Access Activity
Report Frequency
KPIs 2015 KPIs 2016
KPI Title
DOP
2015 National Target / Expected
Activity
2015 Projected outturn
2016 National Target / Expected Activity
Reported at
National / CHO
CHO
7
Number of people obtaining opioid substitution treatment from Pharmacies DOP Access
M 1 Mth in Arrears 6,430 6,421 6,463 CHO 2,110
No. of substance misusers who present for treatment DOP Access
Q 1 Q in arrears 1,274 per quarter
5,860 per annum 6,972 CHO 872
No. of substance misusers who present for treatment who receive an assessment within 2 weeks DOP Quality
Q 1 Mth in Arrears 797 per quarter
4,260 per annum 4,864 CHO 820
% of substance misusers who present for treatment who receive an assessment within 2 weeks DOP Quality
Q 1 Mth in Arrears 100% 71% 100% CHO 100%
No. of substance misusers (over 18 years) for whom treatment has commenced following assessment DOP Quality
Q 1 Mth in Arrears 1,124 per quarter
4.658 per annum 5,584 CHO 468
No. of substance misusers (over 18) for whom treatment has commenced within one calendar month following assessment DOP Quality
Q 1 Mth in Arrears 1,100 per quarter
4590 per annum 5,024 CHO 468
% of substance misusers (over 18 years) for whom treatment has commenced within one calendar month following assessment NSP Access
Q 1 Mth in Arrears 100% 97% 100% CHO 100%
No. of substance misusers (under 18 years) for whom treatment has commenced following assessment DOP Access
Q 1 Mth in Arrears 32 per quarter
302 per annum. 268 CHO 124
No. of substance misusers (under 18 years) for whom treatment has commenced within one week following DOP Access
Q 1 Mth in Arrears 30 per quarter
176 per annum 260 CHO 124

118
assessment
Key Performance Indicators
Service Planning 2016 NSP /
KPI Type Access/ Quality /Access Activity
Report Frequency
KPIs 2015 KPIs 2016
KPI Title
DOP 2015 National
Target / Expected Activity
2015 Projected outturn
2016 National Target / Expected Activity
Reported at
National / CHO
CHO
7
% of substance misusers (over 18 years) for whom treatment has commenced who have an assigned key worker DOP Quality
Q 1 Qtr in Arrears 100% 79% 100% 100%
% of substance misusers (over 18 years) for whom treatment has commenced who have a written care plan DOP Quality
Q 1 Qtr in Arrears 100% 84% 100% 100%
No. of substance misusers (under 18 years) for whom treatment has commenced DOP Access
Q 1 Qtr in Arrears 32 per quarter
302 per annum. 268 124
% of substance misusers (under 18 years) for whom treatment has commenced who have an assigned key worker DOP Quality
Q 1 Qtr in Arrears 100% 88% 100% 100%
% of substance misusers (under 18 years) for whom treatment has commenced who have a written care plan DOP Quality
Q 1 Qtr in Arrears 100% 88% 100% 100%
No. of problem alcohol users who present for treatment DOP Access
Q 1 Qtr in Arrears 699 per quarter
3,530 per annum 3540 400
No. of problem alcohol users who present for treatment who receive an assessment within 2 weeks DOP Access
Q 1 Qtr in Arrears 414 per quarter
2,240 per annum 2,344 400
% of problem alcohol users who present for treatment who receive an assessment within 2 weeks DOP Access
Q 1 Qtr in Arrears 100% 59% 100% 100%
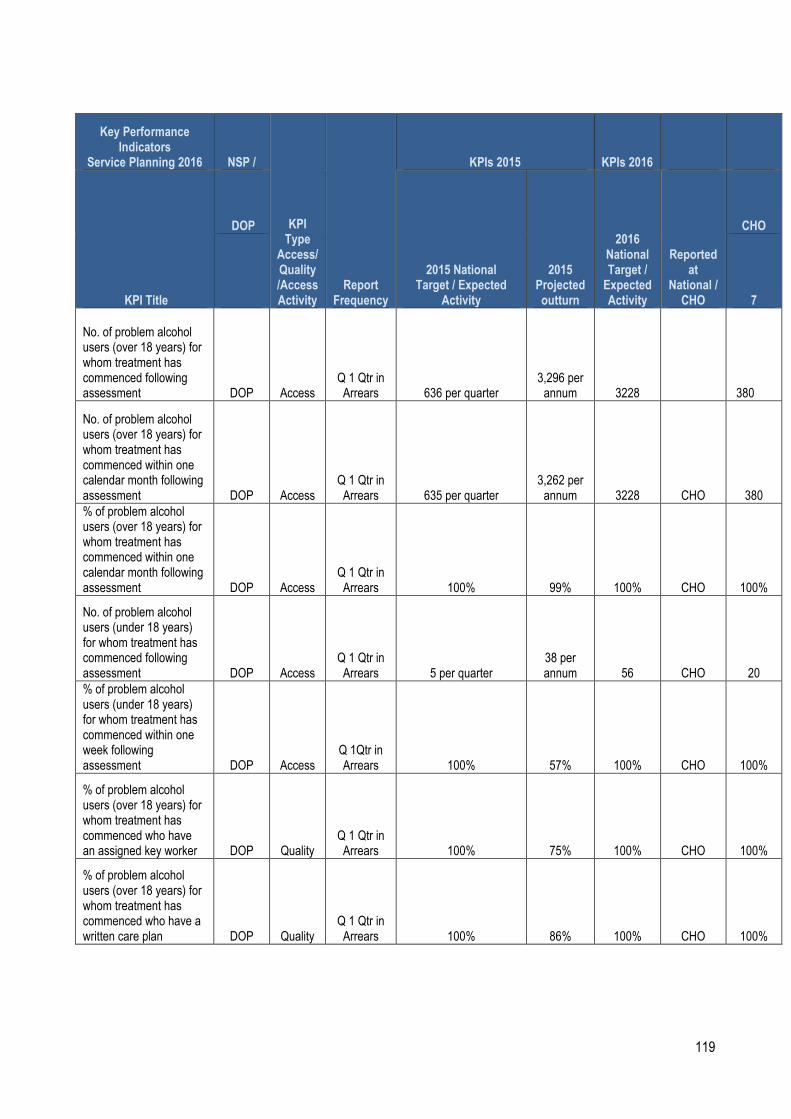
119
Key Performance Indicators
Service Planning 2016 NSP /
KPI Type Access/ Quality /Access Activity
Report Frequency
KPIs 2015 KPIs 2016
KPI Title
DOP
2015 National Target / Expected
Activity
2015 Projected outturn
2016 National Target / Expected Activity
Reported at
National / CHO
CHO
7
No. of problem alcohol users (over 18 years) for whom treatment has commenced following assessment DOP Access
Q 1 Qtr in Arrears 636 per quarter
3,296 per annum 3228 380
No. of problem alcohol users (over 18 years) for whom treatment has commenced within one calendar month following assessment DOP Access
Q 1 Qtr in Arrears 635 per quarter
3,262 per annum 3228 CHO 380
% of problem alcohol users (over 18 years) for whom treatment has commenced within one calendar month following assessment DOP Access
Q 1 Qtr in Arrears 100% 99% 100% CHO 100%
No. of problem alcohol users (under 18 years) for whom treatment has commenced following assessment DOP Access
Q 1 Qtr in Arrears 5 per quarter
38 per annum 56 CHO 20
% of problem alcohol users (under 18 years) for whom treatment has commenced within one week following assessment DOP Access
Q 1Qtr in Arrears 100% 57% 100% CHO 100%
% of problem alcohol users (over 18 years) for whom treatment has commenced who have an assigned key worker DOP Quality
Q 1 Qtr in Arrears 100% 75% 100% CHO 100%
% of problem alcohol users (over 18 years) for whom treatment has commenced who have a written care plan DOP Quality
Q 1 Qtr in Arrears 100% 86% 100% CHO 100%

120
% of problem alcohol users (under 18 years) for whom treatment has commenced who have an assigned key worker DOP Quality
Q 1 Qtr in Arrears 100% 86% 100% CHO 100%
Key Performance Indicators
Service Planning 2016 NSP / KPI Type Access/ Quality /Access Activity
Report Frequency
KPIs 2015 KPIs 2016
KPI Title
DOP 2015 National
Target / Expected Activity
2015 Projected outturn
2016 National Target / Expected Activity
Reported at
National / CHO
CHO
7
% of problem alcohol users (under 18 years) for whom treatment has commenced who have a written care plan DOP Quality
Q 1 Qtr in Arrears 100% 71% 100% CHO 100%
No. of tier 1 and tier 2 staff trained in SAOR Screening and Brief Intervention for problem alcohol and substance use DOP Quality
Q 1 Qtr in Arrears 300 244 300 CHO 40
No. of pharmacies recruited to provide Needle Exchange Programme DOP Quality
TRI M 1 Qtr in Arrears 129 132 119 CHO 0
No. of unique individuals attending pharmacy needle exchange NSP Access
TRI M 1 Qtr in Arrears 1,200 1,731 1,731 CHO 0
No. of pharmacy needle exchange packs provided DOP Access
TRI M 1 Qtr in Arrears 3,200 3,628 3,433 CHO 0
Average No. of needle / syringe packs per person DOP Quality
TRI M 1 Qtr in Arrears 15 16 16 CHO 0
No. and % of needle / syringe packs returned DOP Quality
TRI M 1 Qtr in Arrears 930 (30%)
930
1,032 (30%) CHO 0 30%
No. and % of individual service users admitted to homeless emergency accommodation hostels/ who have medical cards DOP Quality Q 75%
1046
1108 (75%) CHO
98 (75%) 71%
No and % of service users admitted during the quarter who did not have a valid medical card on admission and who were assisted by Hostel staff to acquire a medical card during the quarter. DOP Quality Q 90%
324
302 (70%) CHO 25
(70%) 75%

121

122
Key Performance Indicators
Service Planning 2016 NSP /
KPI Type Access/ Quality /Access Activity
Report Frequency
KPIs 2015 KPIs 2016
KPI Title
DOP 2015 National Target / Expected
Activity
2015 Projected outturn
2016 National Target / Expected Activity
Reported at
National / CHO
CHO
7
% of service users admitted to homeless emergency accommodation hostels/facilities whose health needs have been assessed as part of a holistic needs assessment (HNA) within 2 weeks of admission NSP Quality Q 85% 72% 85% CHO 85%
% of service users admitted to homeless emergency accommodation hostels / facilities whose health needs have been assessed and are being supported to manage their physical / general health, mental health and addiction issues as part of their care/support plan DOP
Q 80% 80% 80% CHO 80%
Quality
Number of people who received health information on type 2 diabetes and cardiovascular health NSP
Q
3,470
2,228 3,470 CHO 475
20% of the population in each Traveller Health
Unit
Quality
Number of people who received awareness and participated in positive mental health initiatives DOP Quality Q
3,470
3,108 3470 CHO 475
20% of the population in each Traveller Health
Unit
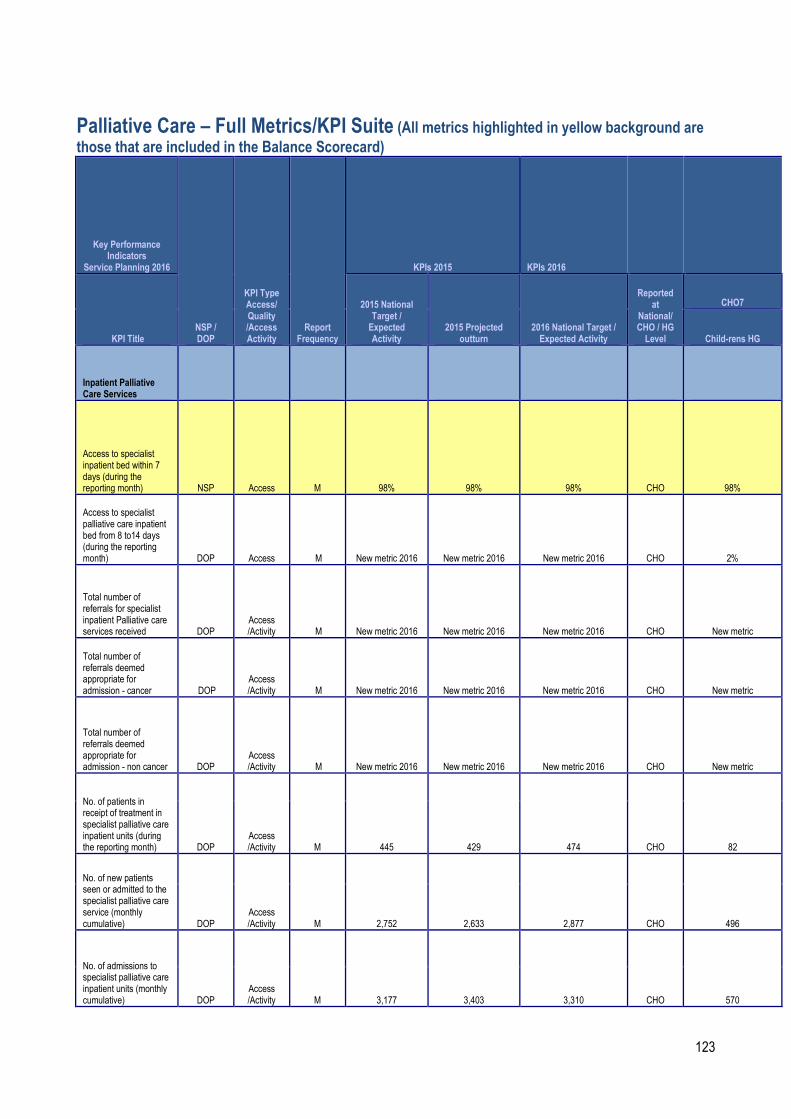
123
Palliative Care – Full Metrics/KPI Suite (All metrics highlighted in yellow background are those that are included in the Balance Scorecard)
Key Performance Indicators
Service Planning 2016
NSP / DOP
KPI Type Access/ Quality /Access Activity
Report Frequency
KPIs 2015 KPIs 2016
KPI Title
2015 National Target / Expected Activity
2015 Projected outturn
2016 National Target / Expected Activity
Reported at
National/ CHO / HG Level
CHO7
Child-rens HG
Inpatient Palliative Care Services
Access to specialist inpatient bed within 7 days (during the reporting month) NSP Access M 98% 98% 98% CHO 98%
Access to specialist palliative care inpatient bed from 8 to14 days (during the reporting month) DOP Access M New metric 2016 New metric 2016 New metric 2016 CHO 2%
Total number of referrals for specialist inpatient Palliative care services received DOP
Access /Activity M New metric 2016 New metric 2016 New metric 2016 CHO New metric
Total number of referrals deemed appropriate for admission - cancer DOP
Access /Activity M New metric 2016 New metric 2016 New metric 2016 CHO New metric
Total number of referrals deemed appropriate for admission - non cancer DOP
Access /Activity M New metric 2016 New metric 2016 New metric 2016 CHO New metric
No. of patients in receipt of treatment in specialist palliative care inpatient units (during the reporting month) DOP
Access /Activity M 445 429 474 CHO 82
No. of new patients seen or admitted to the specialist palliative care service (monthly cumulative) DOP
Access /Activity M 2,752 2,633 2,877 CHO 496
No. of admissions to specialist palliative care inpatient units (monthly cumulative) DOP
Access /Activity M 3,177 3,403 3,310 CHO 570

124
Key Performance Indicators
Service Planning 2016
NSP / DOP
KPI Type Access/ Quality /Access Activity
Report Frequency
KPIs 2015 KPIs 2016
KPI Title
2015 National Target / Expected Activity
2015 Projected outturn
2016 National Target / Expected Activity
Reported at National/ CHO / HG Level
CHO7
Childrens HG
Community Palliative Care Services
Access to specialist palliative care services in the community provided within 7 days (Home, Nursing Home, Non Acute hospital) (during the reporting month) NSP Access M 95% 87% 95% CHO 95%
Access to specialist palliative care services in the community provided to patients in their place of residence 8 to 14 days (Home, Nursing Home, Non Acute hospital) (during the reporting month) DOP Access M New metric 2016 New metric 2016 New metric 2016 CHO 3%
Access to specialist palliative care services in the community provided to patients in their place of residence 15+ days (Home, Nursing Home, Non Acute hospital) (during the reporting month) DOP Access M New metric 2016 New metric 2016 New metric 2016 CHO 2%
Total number of referrals received for specialist Palliative care services in the normal place of residence DOP
Access /Activity M New metric 2016 New metric 2016 New metric 2016 CHO New metric
Total number of referrals deemed appropriate for services - cancer DOP
Access /Activity M New metric 2016 New metric 2016 New metric 2016 CHO New metric
Total number of referrals deemed appropriate for services - non cancer DOP
Access /Activity M New metric 2016 New metric 2016 New metric 2016 CHO New metric
No. of patients in receipt of specialist palliative care in the community (monthly cumulative) NSP
Access /Activity M 3,248 3,178 3,309 CHO 308
No. of new patients seen or admitted to specialist palliative care services in the community DOP
Access /Activity M 8,907 9,089 9,353 CHO 941

125
Key Performance Indicators
Service Planning 2016
NSP / DOP
KPI Type Access/ Quality /Access Activity
Report Frequency
KPIs 2015 KPIs 2016
KPI Title
2015 National Target / Expected Activity
2015 Projected outturn
2016 National Target / Expected Activity
Reported at National/ CHO / HG Level
CHO7
Child-rens HG
No. of patients in receipt of specialist palliative day care services (during the reporting month) DOP
Access /Activity M 349 301 349 CHO 42
No. of new patients in receipt of specialist palliative day care services (monthly cumulative) DOP Access M 962 1003 985 CHO 92
No. of patients in receipt of care in designated palliative care support beds (during the reporting month) DOP
Access /Activity M 165 142 165 CHO 40
Children’s Palliative Care Services
No. of children in the care of the children’s outreach nursing team / specialist palliative care team NSP Access M 320 359 370 CHO 140
No. of children in the care of the children’s outreach nursing team / specialist palliative care team (Acute setting) DOP
Access /Activity M New metric 2016 New metric 2016 New metric 2016 CHO 115
No. of children in the care of the children’s outreach nursing team / specialist palliative care team (community) DOP
Access /Activity M n/a n/a New metric 2016 CHO 25
No. of new children in the care of the children’s outreach nursing team / specialist palliative care team DOP
Access /Activity M 229 190 190 CHO 59
No. of new children in the care of the children’s outreach nursing team / specialist palliative care team (Acute settings) DOP
Access /Activity M New metric 2016 New metric 2016 New metric 2016 CHO 48
No. of new children in the care of the children’s outreach nursing team / specialist palliative care team (Community) DOP
Access /Activity M New metric 2016 New metric 2016 New metric 2016 CHO 11

126
Key Performance Indicators
Service Planning 2016
NSP / DOP
KPI Type Access/ Quality /Access Activity
Report Frequency
KPIs 2015 KPIs 2016
KPI Title
2015 National Target / Expected Activity
2015 Projected outturn
2016 National Target / Expected
Activity
Reported at National/ CHO / HG Level
CHO7
Childrens HG
Total number of new referrals for inpatient services seen by the specialist palliative care team DOP
Access /Activity
n/a
Expected activity to be determined CHO
M 486
Specialist palliative care services provided in the acute setting for new patients and re referral within 2 days DOP Quality M n/a 93%
Target to be determined CHO
Bereavement Services
Total number of family units who received bereavement services DOP
Access /Activity M n/a 621 621 CHO New metric
% patients triaged within 1 working day of referral (acute service) NSP Quality
M
New metric 2016 New metric 2016 90% CHO 90%
2016 Q4 Reporting
% patients with a multidisciplinary care plan documented within 5 working days of initial review NSP Quality
M
New metric 2016 New metric 2016 90% CHO 90%
2016 Q4 Reporting
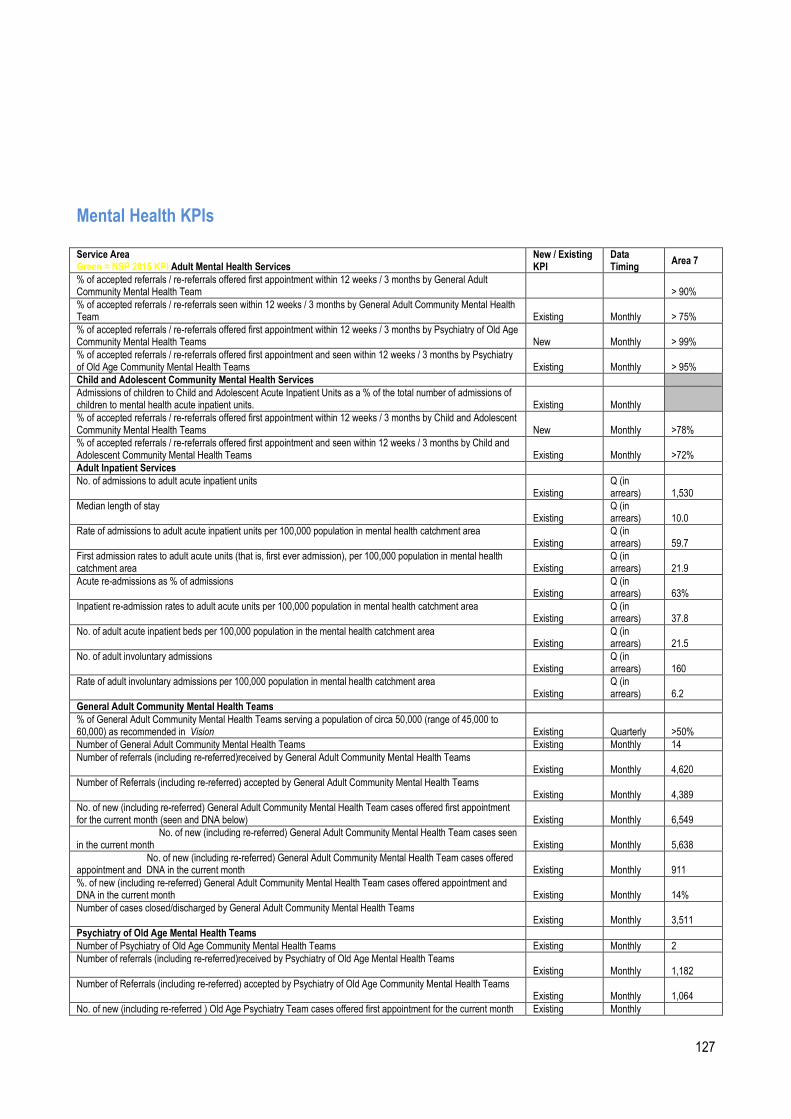
127
Mental Health KPIs Service Area Green = NSP 2015 KPI Adult Mental Health Services
New / Existing KPI
Data Timing
Area 7
% of accepted referrals / re-referrals offered first appointment within 12 weeks / 3 months by General Adult Community Mental Health Team
> 90%
% of accepted referrals / re-referrals seen within 12 weeks / 3 months by General Adult Community Mental Health Team Existing Monthly > 75%
% of accepted referrals / re-referrals offered first appointment within 12 weeks / 3 months by Psychiatry of Old Age Community Mental Health Teams New Monthly > 99%
% of accepted referrals / re-referrals offered first appointment and seen within 12 weeks / 3 months by Psychiatry of Old Age Community Mental Health Teams Existing Monthly > 95%
Child and Adolescent Community Mental Health Services
Admissions of children to Child and Adolescent Acute Inpatient Units as a % of the total number of admissions of children to mental health acute inpatient units. Existing Monthly
% of accepted referrals / re-referrals offered first appointment within 12 weeks / 3 months by Child and Adolescent Community Mental Health Teams New Monthly >78%
% of accepted referrals / re-referrals offered first appointment and seen within 12 weeks / 3 months by Child and Adolescent Community Mental Health Teams Existing Monthly >72%
Adult Inpatient Services
No. of admissions to adult acute inpatient units Existing
Q (in arrears) 1,530
Median length of stay Existing
Q (in arrears) 10.0
Rate of admissions to adult acute inpatient units per 100,000 population in mental health catchment area Existing
Q (in arrears) 59.7
First admission rates to adult acute units (that is, first ever admission), per 100,000 population in mental health catchment area Existing
Q (in arrears) 21.9
Acute re-admissions as % of admissions Existing
Q (in arrears) 63%
Inpatient re-admission rates to adult acute units per 100,000 population in mental health catchment area Existing
Q (in arrears) 37.8
No. of adult acute inpatient beds per 100,000 population in the mental health catchment area Existing
Q (in arrears) 21.5
No. of adult involuntary admissions Existing
Q (in arrears) 160
Rate of adult involuntary admissions per 100,000 population in mental health catchment area Existing
Q (in arrears) 6.2
General Adult Community Mental Health Teams
% of General Adult Community Mental Health Teams serving a population of circa 50,000 (range of 45,000 to 60,000) as recommended in Vision Existing Quarterly >50%
Number of General Adult Community Mental Health Teams Existing Monthly 14
Number of referrals (including re-referred)received by General Adult Community Mental Health Teams Existing Monthly
4,620
Number of Referrals (including re-referred) accepted by General Adult Community Mental Health Teams Existing Monthly
4,389
No. of new (including re-referred) General Adult Community Mental Health Team cases offered first appointment for the current month (seen and DNA below) Existing Monthly
6,549
No. of new (including re-referred) General Adult Community Mental Health Team cases seen in the current month Existing Monthly
5,638
No. of new (including re-referred) General Adult Community Mental Health Team cases offered appointment and DNA in the current month Existing Monthly
911
%. of new (including re-referred) General Adult Community Mental Health Team cases offered appointment and DNA in the current month Existing Monthly 14%
Number of cases closed/discharged by General Adult Community Mental Health Teams Existing Monthly
3,511
Psychiatry of Old Age Mental Health Teams
Number of Psychiatry of Old Age Community Mental Health Teams Existing Monthly 2
Number of referrals (including re-referred)received by Psychiatry of Old Age Mental Health Teams Existing Monthly
1,182
Number of Referrals (including re-referred) accepted by Psychiatry of Old Age Community Mental Health Teams Existing Monthly
1,064
No. of new (including re-referred ) Old Age Psychiatry Team cases offered first appointment for the current month Existing Monthly
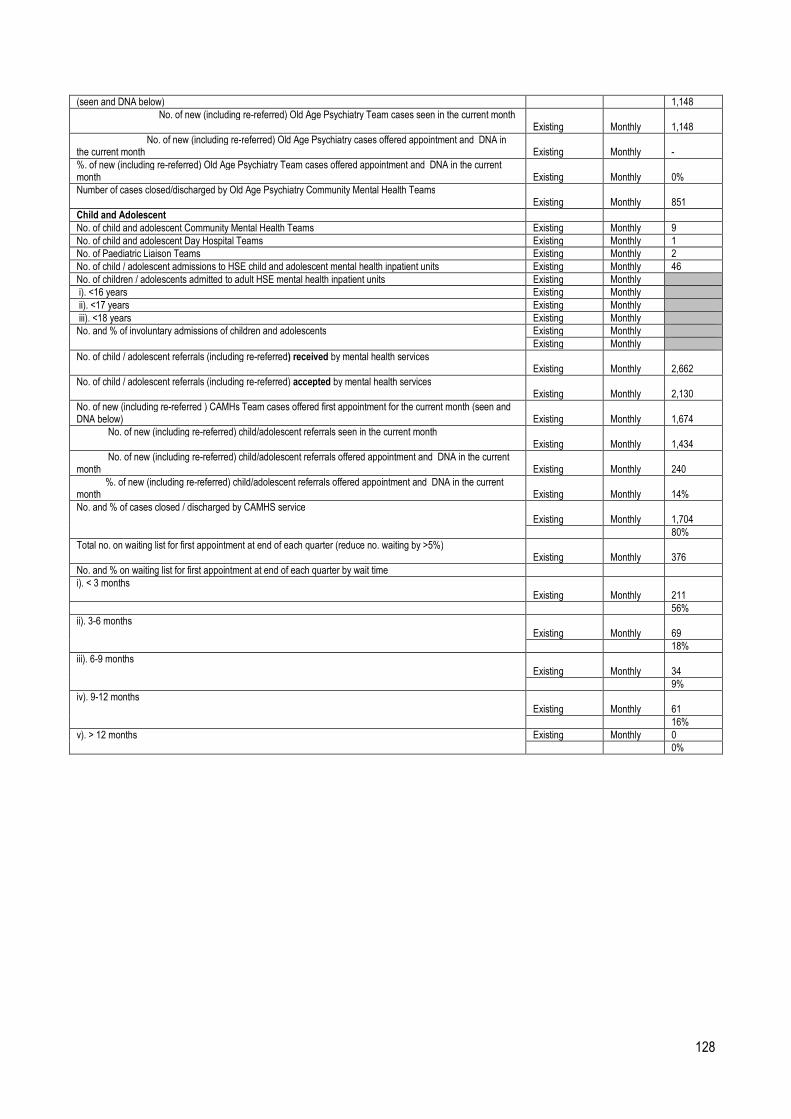
128
(seen and DNA below) 1,148
No. of new (including re-referred) Old Age Psychiatry Team cases seen in the current month Existing Monthly
1,148
No. of new (including re-referred) Old Age Psychiatry cases offered appointment and DNA in the current month Existing Monthly
-
%. of new (including re-referred) Old Age Psychiatry Team cases offered appointment and DNA in the current month Existing Monthly 0%
Number of cases closed/discharged by Old Age Psychiatry Community Mental Health Teams Existing Monthly
851
Child and Adolescent
No. of child and adolescent Community Mental Health Teams Existing Monthly 9
No. of child and adolescent Day Hospital Teams Existing Monthly 1
No. of Paediatric Liaison Teams Existing Monthly 2
No. of child / adolescent admissions to HSE child and adolescent mental health inpatient units Existing Monthly 46
No. of children / adolescents admitted to adult HSE mental health inpatient units Existing Monthly
i). <16 years Existing Monthly
ii). <17 years Existing Monthly
iii). <18 years Existing Monthly
No. and % of involuntary admissions of children and adolescents Existing Monthly
Existing Monthly
No. of child / adolescent referrals (including re-referred) received by mental health services Existing Monthly
2,662
No. of child / adolescent referrals (including re-referred) accepted by mental health services Existing Monthly
2,130
No. of new (including re-referred ) CAMHs Team cases offered first appointment for the current month (seen and DNA below) Existing Monthly
1,674
No. of new (including re-referred) child/adolescent referrals seen in the current month Existing Monthly
1,434
No. of new (including re-referred) child/adolescent referrals offered appointment and DNA in the current month Existing Monthly
240
%. of new (including re-referred) child/adolescent referrals offered appointment and DNA in the current month Existing Monthly 14%
No. and % of cases closed / discharged by CAMHS service Existing Monthly
1,704
80%
Total no. on waiting list for first appointment at end of each quarter (reduce no. waiting by >5%) Existing Monthly
376
No. and % on waiting list for first appointment at end of each quarter by wait time
i). < 3 months Existing Monthly
211
56%
ii). 3-6 months Existing Monthly
69
18%
iii). 6-9 months Existing Monthly
34
9%
iv). 9-12 months Existing Monthly
61
16%
v). > 12 months Existing Monthly 0
0%
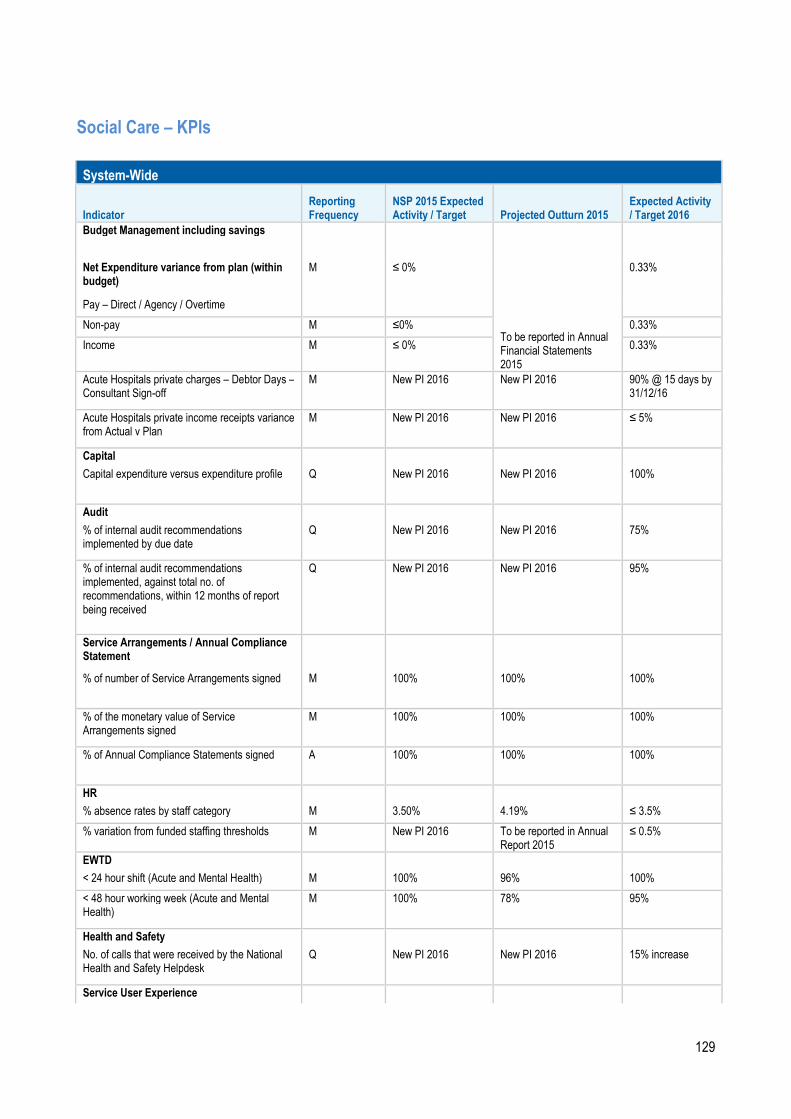
129
Social Care – KPIs
System-Wide
Indicator Reporting Frequency
NSP 2015 Expected Activity / Target Projected Outturn 2015
Expected Activity / Target 2016
Budget Management including savings
To be reported in Annual Financial Statements 2015
Net Expenditure variance from plan (within budget)
M ≤ 0% 0.33%
Pay – Direct / Agency / Overtime
Non-pay M ≤0% 0.33%
Income M ≤ 0% 0.33%
Acute Hospitals private charges – Debtor Days – Consultant Sign-off
M New PI 2016 New PI 2016 90% @ 15 days by 31/12/16
Acute Hospitals private income receipts variance from Actual v Plan
M New PI 2016 New PI 2016 ≤ 5%
Capital
Capital expenditure versus expenditure profile Q New PI 2016 New PI 2016 100%
Audit
% of internal audit recommendations implemented by due date
Q New PI 2016 New PI 2016 75%
% of internal audit recommendations implemented, against total no. of recommendations, within 12 months of report being received
Q New PI 2016 New PI 2016 95%
Service Arrangements / Annual Compliance Statement
% of number of Service Arrangements signed M 100% 100% 100%
% of the monetary value of Service Arrangements signed
M 100% 100% 100%
% of Annual Compliance Statements signed A 100% 100% 100%
HR
% absence rates by staff category M 3.50% 4.19% ≤ 3.5%
% variation from funded staffing thresholds M New PI 2016 To be reported in Annual Report 2015
≤ 0.5%
EWTD
< 24 hour shift (Acute and Mental Health) M 100% 96% 100%
< 48 hour working week (Acute and Mental Health)
M 100% 78% 95%
Health and Safety
No. of calls that were received by the National Health and Safety Helpdesk
Q New PI 2016 New PI 2016 15% increase
Service User Experience
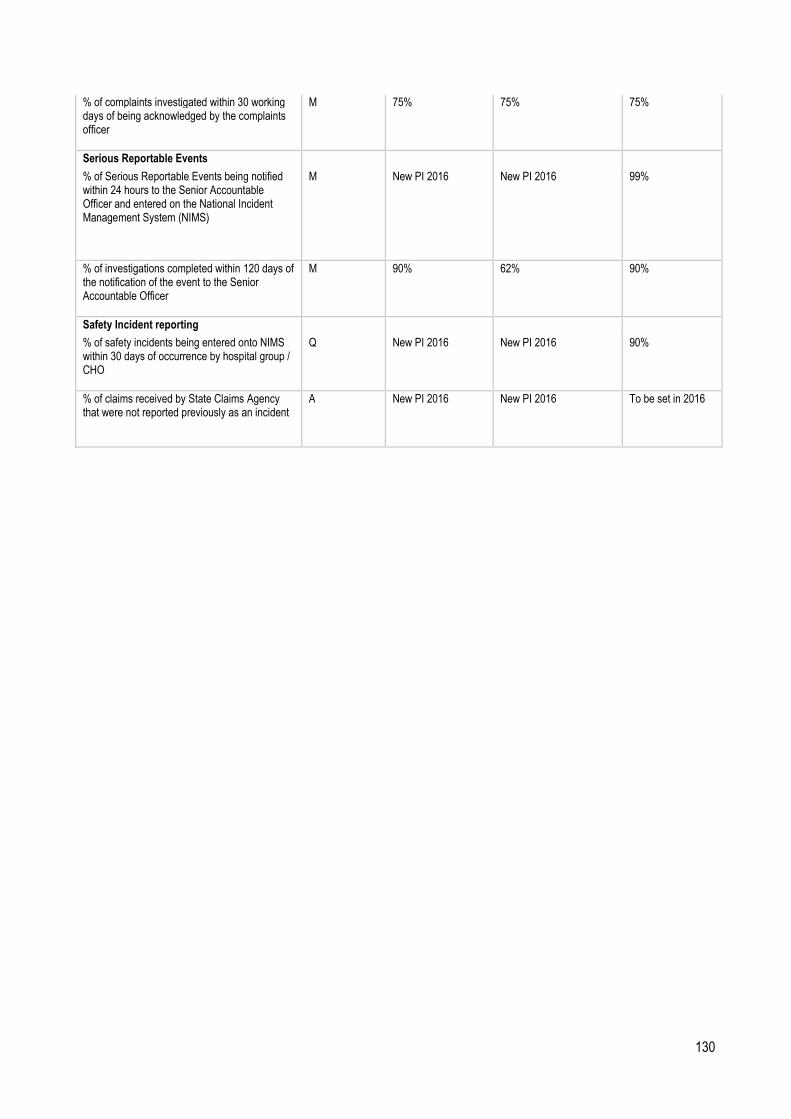
130
% of complaints investigated within 30 working days of being acknowledged by the complaints officer
M 75% 75% 75%
Serious Reportable Events
% of Serious Reportable Events being notified within 24 hours to the Senior Accountable Officer and entered on the National Incident Management System (NIMS)
M New PI 2016 New PI 2016 99%
% of investigations completed within 120 days of the notification of the event to the Senior Accountable Officer
M 90% 62% 90%
Safety Incident reporting
% of safety incidents being entered onto NIMS within 30 days of occurrence by hospital group / CHO
Q New PI 2016 New PI 2016 90%
% of claims received by State Claims Agency that were not reported previously as an incident
A New PI 2016 New PI 2016 To be set in 2016
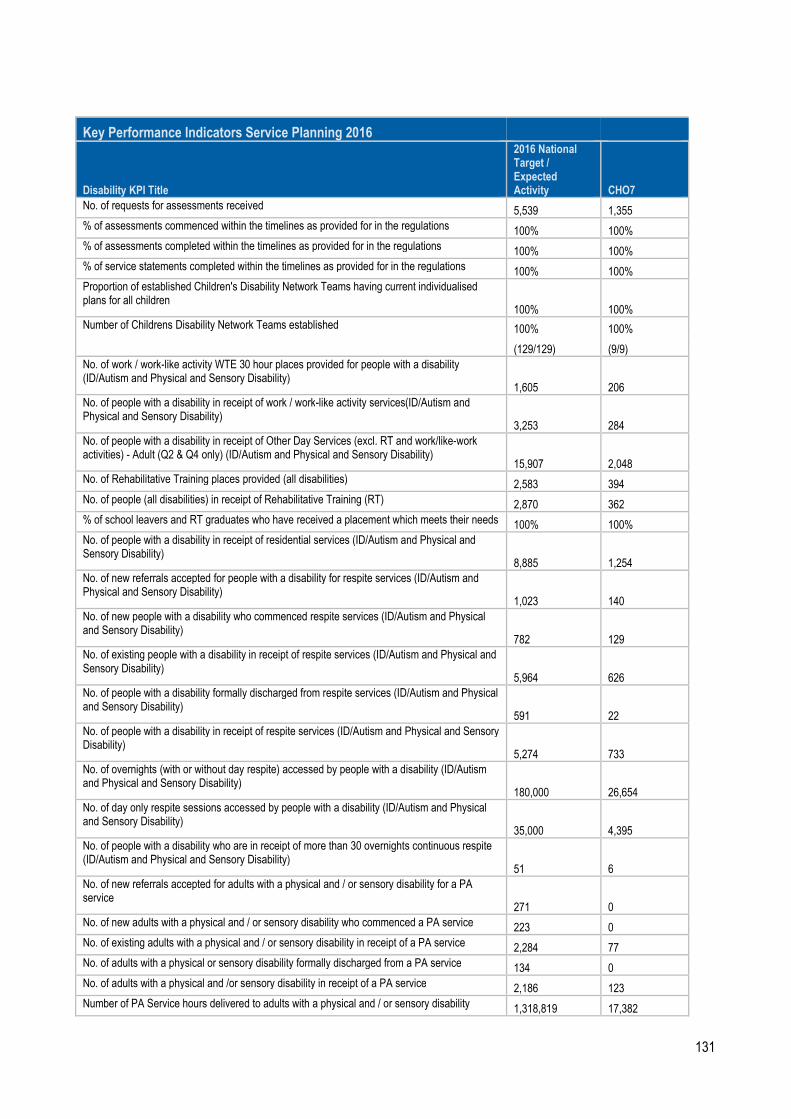
131
Key Performance Indicators Service Planning 2016
Disability KPI Title
2016 National Target / Expected Activity CHO7
No. of requests for assessments received 5,539 1,355
% of assessments commenced within the timelines as provided for in the regulations 100% 100%
% of assessments completed within the timelines as provided for in the regulations 100% 100%
% of service statements completed within the timelines as provided for in the regulations 100% 100%
Proportion of established Children's Disability Network Teams having current individualised plans for all children
100% 100%
Number of Childrens Disability Network Teams established 100% 100%
(129/129) (9/9)
No. of work / work-like activity WTE 30 hour places provided for people with a disability (ID/Autism and Physical and Sensory Disability)
1,605 206
No. of people with a disability in receipt of work / work-like activity services(ID/Autism and Physical and Sensory Disability)
3,253 284
No. of people with a disability in receipt of Other Day Services (excl. RT and work/like-work activities) - Adult (Q2 & Q4 only) (ID/Autism and Physical and Sensory Disability)
15,907 2,048
No. of Rehabilitative Training places provided (all disabilities) 2,583 394
No. of people (all disabilities) in receipt of Rehabilitative Training (RT) 2,870 362
% of school leavers and RT graduates who have received a placement which meets their needs 100% 100%
No. of people with a disability in receipt of residential services (ID/Autism and Physical and Sensory Disability)
8,885 1,254
No. of new referrals accepted for people with a disability for respite services (ID/Autism and Physical and Sensory Disability)
1,023 140
No. of new people with a disability who commenced respite services (ID/Autism and Physical and Sensory Disability)
782 129
No. of existing people with a disability in receipt of respite services (ID/Autism and Physical and Sensory Disability)
5,964 626
No. of people with a disability formally discharged from respite services (ID/Autism and Physical and Sensory Disability)
591 22
No. of people with a disability in receipt of respite services (ID/Autism and Physical and Sensory Disability)
5,274 733
No. of overnights (with or without day respite) accessed by people with a disability (ID/Autism and Physical and Sensory Disability)
180,000 26,654
No. of day only respite sessions accessed by people with a disability (ID/Autism and Physical and Sensory Disability)
35,000 4,395
No. of people with a disability who are in receipt of more than 30 overnights continuous respite (ID/Autism and Physical and Sensory Disability)
51 6
No. of new referrals accepted for adults with a physical and / or sensory disability for a PA service
271 0
No. of new adults with a physical and / or sensory disability who commenced a PA service 223 0
No. of existing adults with a physical and / or sensory disability in receipt of a PA service 2,284 77
No. of adults with a physical or sensory disability formally discharged from a PA service 134 0
No. of adults with a physical and /or sensory disability in receipt of a PA service 2,186 123
Number of PA Service hours delivered to adults with a physical and / or sensory disability 1,318,819 17,382

132
No. of adults with a physical and / or sensory disability in receipt of 1 - 5 PA Hours per week 957 28
No. of adults with a physical and / or sensory disability in receipt of 6 - 10 PA hours per week 538 24
No. of adults with a physical and / or sensory disability in receipt of 11 - 20 PA hours per week 397 19
No. of adults with a physical and / or sensory disability in receipt of 21 - 40 PA hours per week 256 11
No. of adults with a physical and / or sensory disability in receipt of 41 - 60 PA hours per week 73 3
No. of adults with a physical and / or sensory disability in receipt of 60+ PA hours per week 83 1
No. of new referrals accepted for people with a disability for home support services (ID/Autism and Physical and Sensory Disability)
1,416 104
No. of new people with a disability who commenced a home support service (ID/Autism and Physical and Sensory Disability)
1,273 90
No. of existing people with a disability in receipt of home support services (ID/Autism and Physical and Sensory Disability)
6,380 714
No. of people with a disability formally discharged from home support services (ID/Autism and Physical and Sensory Disability)
466 27
No of people with a disability in receipt of Home Support Services (ID/Autism and Physical and Sensory Disability)
7,312 888
No of Home Support Hours delivered to persons with a disability (ID/Autism and Physical and Sensory Disability)
2,600,000 376,758
No. of people with a disability in receipt of 1 - 5 Home Support hours per week (ID/Autism and Physical and Sensory Disability)
3,140 360
No. of people with a disability in receipt of 6 – 10 Home Support hours per week (ID/Autism and Physical and Sensory Disability)
1,197 158
No. of people with a disability in receipt of 11 – 20 Home Support hours per week (ID/Autism and Physical and Sensory Disability)
753 109
No. of people with a disability in receipt of 21- 40 Home Support hours per week (ID/Autism and Physical and Sensory Disability)
402 54
No. of people with a disability in receipt of 41 – 60 Home Support hours per week (ID/Autism and Physical and Sensory Disability)
97 11
No. of people with a disability in receipt of 60 +Home Support hours per week (ID/Autism and Physical and Sensory Disability)
127 17
Facilitate the movement of people from congregated to community settings 8
In respect of agencies in receipt of €3m or more in public funding, the % which employ an internationally recognised quality improvement methodology such as EFQM, CQL or CARF
100% 100%
% of compliance with outcomes of Disability Units following HIQA inspections by CHO 75% 75%
Service Improvement Team Process
100% Deliver on Service Improvement priorities
Transforming Lives
100% Deliver on VfM Implementation Priorities
Percentage of CHOs who have a plan in place on how they will implement their approach to the establishment of a Residents Council/Family Forum/Service User Panel or equivalent for Disability Services (reporting to commence by Q3)
100%

133
Key Performance Indicators Older Persons Services 2016
Older Persons KPI Title
2016 National Target / Expected Activity CHO7
Total no. of persons in receipt of a HCP/DDI HCP(Monthly target) 15,450 1988
No. of new HCP clients, annually 6,000 825
Intensive HCPs number of persons in receipt of an Intensive HCP at a point in time (Capacity) 130
No. of home help hours provided for all care groups (excluding provision of hours from HCPs) 10,437,000 734,000
No. of people in receipt of home help hours (excluding provision of hours from HCPs) (Monthly target) 47,800 5,200
No. of persons funded under NHSS in long term residential care during reporting month 23,450
% of clients with NHSS who are in receipt of Ancillary State Support 10% 10%
% of clients who have CSARs processed within 6 weeks 90% 90%
No. in receipt of subvention 187 19
No. of NHSS Beds in Public Long Stay Units. 5,255 642
No. of Short Stay Beds in Public Long Stay Units 2,005 199
Average length of Stay for NHSS clients in Public, Private and Saver Long Stay Units 3.2 3.2
% of population over 65 years in NHSS funded Beds (based on 2011 Census figures) 4% 4%
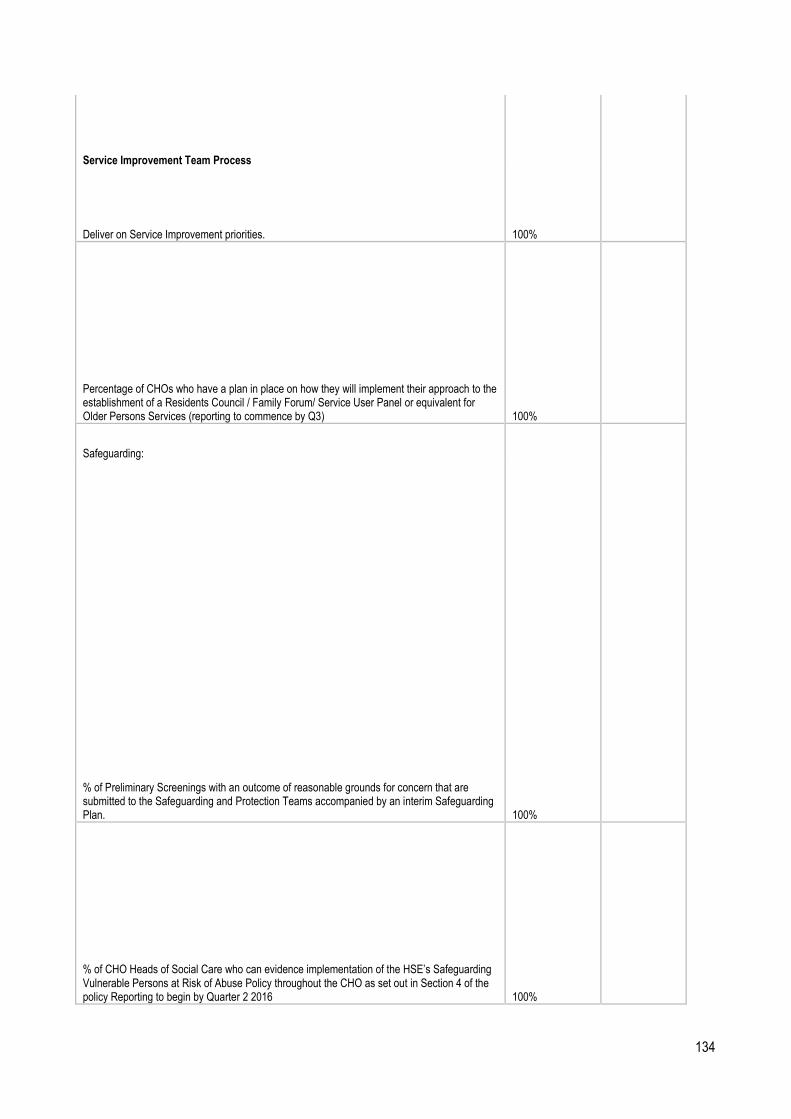
134
Service Improvement Team Process
100% Deliver on Service Improvement priorities.
Percentage of CHOs who have a plan in place on how they will implement their approach to the establishment of a Residents Council / Family Forum/ Service User Panel or equivalent for Older Persons Services (reporting to commence by Q3) 100%
Safeguarding:
100%
% of Preliminary Screenings with an outcome of reasonable grounds for concern that are submitted to the Safeguarding and Protection Teams accompanied by an interim Safeguarding Plan.
% of CHO Heads of Social Care who can evidence implementation of the HSE’s Safeguarding Vulnerable Persons at Risk of Abuse Policy throughout the CHO as set out in Section 4 of the policy Reporting to begin by Quarter 2 2016 100%
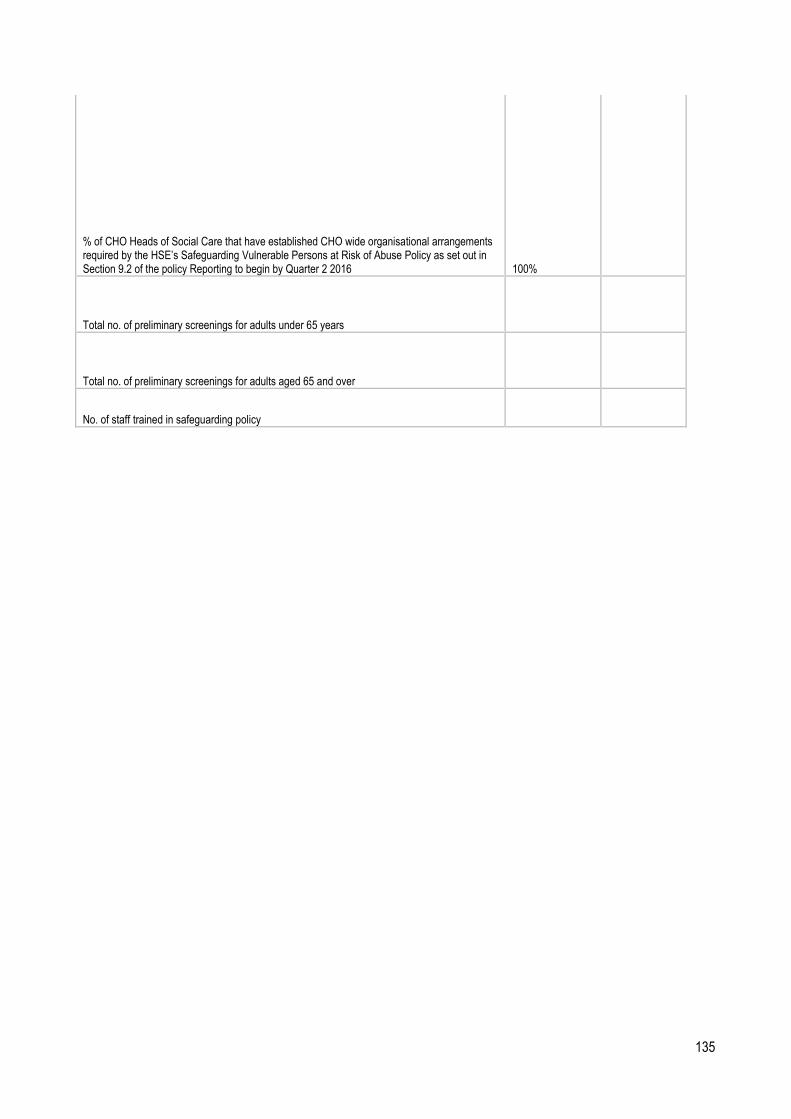
135
% of CHO Heads of Social Care that have established CHO wide organisational arrangements required by the HSE’s Safeguarding Vulnerable Persons at Risk of Abuse Policy as set out in Section 9.2 of the policy Reporting to begin by Quarter 2 2016 100%
Total no. of preliminary screenings for adults under 65 years
Total no. of preliminary screenings for adults aged 65 and over
No. of staff trained in safeguarding policy

136
KPIs pertaining to Quality and Safety structures and Effective and Safe Care which will be collected at CHO level are as follows:
Priority Area Metric Performance
Measure / Target
Governance for Quality and Safety
HCAI Committee % of CHOs who have in place a HCAI or Infection Control Committee 100%
Drugs & Therapeutic Committee
% of CHOs who have in place Drugs and Therapeutic Committee / Medication Management Committee
100%
Risk Registers % of CHOs who have in place a CHO-wide Social Care Risk Register 100%
Effective Care
HIQA Notifications % of CHOs who have in place a system for receipt and collation of HIQA Notification Forms submitted by HSE provided services
100%
% of CHOs who review the trends from the collation of HIQA Notification Forms submitted by HSE provided-services and take appropriate action by Q3.
100%
Service User Surveys % of CHOs who conduct annual service user experience surveys amongst representative samples of their Social Care service user population by Q3
100%
Safe Care
Recommendations % of CHOs who have a process in place to ensure the recommendations of any serious incident investigations are implemented, and learning shared by Q2
100%
Incidents % of CHOs who carry out an analysis of all reported incidents (numbers, types, trends)
100%
An online dashboard system is being developed to facilitate collection of these metrics at CHO level. It is expected that this will be in place by the end of Q2 2016.

137
Appendix 4 – Capital Projects Primary Care
CHO 7: Kildare/West Wicklow, Dublin West, Dublin South City, Dublin South West,
Facility Project Details
Project Completio
n
Fully Operationa
l
Additional Beds
Replacement Beds
2016 Capital Cost €m
Total
WTE
Revenue Costs €m
Kilnamanagh/Tymon, Dublin
Primary Care Centre, by lease agreement.
Q3 2016 Q4 2016 0 0 0 0 0 0
Springfield, Tallaght, Dublin
Primary Care Centre, by lease agreement.
Q3 2016 Q4 2016 0 0 0 0 0 0
Tus Nua, Kildare Town
Primary Care Centre, by lease agreement.
Q4 2015 Q1 2016 0 0 0 0 0 0
Celbridge, Co. Kildare
Primary Care Centre, by lease agreement.
Q4 2016 Q1 2017 0 0 0 0 0 0
Blessington, Co. Wicklow
Primary Care Centre, by lease agreement.
Q2 2016 Q2 2016 0 0 0 0 0 0