operational challenges to contemporary changes of ... interpretation, etc ... operational challenges...
TRANSCRIPT

Operational Challenges to Contemporary Satellite Imagery Characterization
Dath K. Mita, PhD Bill Baker, PhD ; Michael Toomey, PhD ; Tatiana Nawrocki; Christianna
Townsend
International Production Assessment Division, Office of Global Analysis, Foreign Agricultural Services, USDA
Joint 2014 JACIE Workshop and ASPRS 2014 Annual Conference
March 23 - 28, 2014
Louisville, Kentucky USA
FAS

Outline:
1. Share USDA Office of Global Analysis-International Production Assessment Division’s mission (what we do and why)
2. Share some operational challenges related to satellite earth observations
3. Listen to your perspective
FAS

Overview: USDA-Office Global Analysis
International Production Assessment Division
The Foreign Agricultural Service’s (FAS) Office of Global Analysis (OGA) serves as a major source of objective and reliable global agricultural production information to the World Agricultural Outlook Board (WAOB), the primary source of USDA’s global commodity outlook
The USDA’s outlook reports provide public access to information and data affecting world food security and are crucial in decisions affecting U.S. agriculture, trade policy, and food aid.
The reports provide monthly regional, national and subnational monitoring and analysis of crop conditions, yield forecasts, and the impact of events affecting crop production.
In addition, the FAS OGA provides support and maintenance of USDA’s global database of (1) Crop Area, Yields, and Production (PSD); (2) Weather and Soil Moisture; (3) Monthly Crop Growth Stage and Harvest Calendars, (4) Global Agricultural Monitoring (GLAM); (6) and others
FAS

4/3/2014
Economic
and Trend
Analysis
U.S. and
World
Weather
Travel
Reports
Remote
Sensing
Official
Country
Reports
Attaché
Reports
USDA’s Production
Forecast
News and
Reporting

USDA’s SIA Program The satellite imagery resources are managed through the USDA’s Satellite Imagery
Archive (SIA) program.
The SIA program was established by USDA’s Remote Sensing Coordinating Committee (RSCC) which is chaired by the USDA’s Office of the Chief Information Officer
The SIA fulfills its mission of providing USDA-wide cost effective data-sharing of satellite data through a centralized purchasing, receipt, inventory, storage, and dissemination of satellite imagery to USDA agencies and their affiliates: – Foreign Agricultural Service (FAS),
– Risk Management Agency (RMA),
– National Agricultural Statistics Service (NASS),
– Forestry Service (FS),
– Natural Resources Conservation Service (NRCS),
– Agricultural Research Service (ARS), and
– Farm Service Agency (FSA).
The SIA facility is managed through the online Archive Explorer (AE) system at http://www.pecad.fas.usda.gov/archive_explorer/default.cfm. The AE is a web-enabled browse and search tool, that allows users to browse, select, and retrieve the contents of the Satellite Imagery Archive
FAS

Data:
Soils, Crop, Weather
Extract Relevant data & Information
Actionable Knowledge
Actionable statistical
Insight
Analysis, Interpretation, etc…: visual or automated
--community of practitioners
Satellite observations (physical – chemical characterization of the earth surface)
Field Measurements, Field surveys
Domain specific…: meaning + understanding
---agricultural industry
Policy-Decision making --farmers, traders, politicians
OGA-IPAD Actionable Situation/Outlook Report
FAS

Data-Information Translation: reference points or benchmarks:
all about relativity: previous year, average, record, drought year
Statistics: Area, Yield, Production
Time of sowing: early, late, normal…
Seasonal crop & weather anomalies: normal, favorable, unfavorable (excess, drought, etc.)
State of plant growth and development
Phenological phase: vegetative, flowering, physiological maturity, harvest
FAS

Major Crop Monitoring Parameters What We Monitor and the Underlying Assumptions:
1. Crop Growth: Driven by temporal (seasonal) soil moisture (rainfall) We generate global vegetation conditions to monitor photosynthetic activity NDVI, ET provide metrics of crop growth, agricultural ecosystem functions and health
2. Crop Yields: Dependent on accumulated biomass, available soil moisture, etc A function of time and rainfall (length of growing & harvest period)
3. Planted/Harvested Cropland
Dependent on start of sowing rains Length of planting window Socio-economic factors (market prices, government incentives, etc.)
sowing
vegetative
reproductive
senescence
harvest
FAS

Operational Challenges Related to Satellite Earth Observations
1. Workflow integration
2. Data quality
3. Data processing
4. Data archive: big data problem
FAS

Goals: Operational vs. Science/Research/Deployment
Operational: High quality deliverables (reliability, credibility, legitimate) Data value defined in terms of the accuracy and quality of the outputs
and outcomes: similarity/dissimilarity to reality Ensure effectiveness/seamless protocols
fitting data seamlessly into existing workflows
Too time consuming or cumbersome data integration routines result in limited or no use
Science/Research/Deployment: Often related to spatial, spectral, radiometric, temporal sensitivity
FAS

MONITORING CROP CONDITIONS ……INDIA MONSOON SEASON
Challenge 1: Data Quality
FAS

• Landsat, MODIS, + Other
– India’s major crop season, kharif (monsoon season)
• Data gaps almost the entire season makes it difficult to generate reliable + consistent indicators/deliverable products
• Cloud minimizing protocols (in-house) much more time consuming and costly to fix
• More rework and assumptions resulting in extremely poor overall quality of deliverables
India: Monitoring Kharif (monsoon) Season Crops
A simple case with serious crop forecasting implications: cotton, rice, soybeans ….India’s monsoon reason data gaps
FAS

India, North 2013-Jul-28 to Aug-12 MOD44-16-day
No meaningful data interpolation, extrapolation, manipulation, etc. Monsoon season: June - September
Data source: 16-day MODIS
FAS

India, North 2013-Sept-14 to Sept-29 MOD44-16-day
No meaningful data interpolation, extrapolation, manipulation, etc. Monsoon season: June - September
Data source: 16-day MODIS
FAS

India, North 2013-Nov-01 to Nov-16 MOD44-16-day
No meaningful data interpolation, extrapolation, manipulation, etc. Monsoon season: June - September
Data source: 16-day MODIS
FAS

India Kharif (monsoon) Season Landsat Imagery
FAS

India Kharif (monsoon) Season Landsat 8, 7 Imagery
FAS

MONITORING EXTREME EVENTS Challenge 2: Massive datasets
…excess rainfall, flooding, drought…
FAS

Monitoring Crop Impacting Events:
Event progress: determine reasonable-practical frequency – daily, weekly, etc…
– spatial extent; depth, length of time
Crop Monitoring: – Crop types (major) identification
– Crop stage identification • Resilience, survival rate, compensatory growth etc..
USGS Hazards Data Distribution System is key for major disasters
FAS

Low Resolution
High Resolution
Moderate Resolution
MODIS Sampling frequency (daily/composite) Daily event progression Conditions within crop type (variability within type) LANDSAT
Lengthy frequency (8-16 days) Crop type identification (variability between type) Spatial extent
WorldView 2 Reference data “ground truth”
Evaluation-Monitoring Crop Impacting Events Data Selection, Processing, Analysis:
…..for regional, national, subnational analysis
incorporation of ancillary and derived data sets
+ FAS

Category 5 Typhoon Haiyan in Philippines, Nov 8th, 2013 Synoptic Scale Assessment: MODIS (500m)
Composites of rapid-response/daily imagery
Pre-Post Storm NDVI difference
FAS

Cropland Identification Crop Condition Assessment: Landsat
Compiled cloud-free Landsat imagery
Cross-referenced with high-resolution crop masks
Assessed crop condition and potential damage
GeoCover (30m)2000
FAS

WorldView2: Reference data (“ground truth”) provided large/local scale cropland assessment:
Imagery provided courtesy of Digital Globe. ©2013

Use of Ancillary Data
Assess potential flooding damage using derived flooding maps (UNOSAT)
FAS

BIG DATA PROBLEM
Challenge 3: Satellite Imagery Archive:
FAS

Satellite Imagery Archive Program: Big Data Problem
The amount of imagery in SIA and being collected is presenting:
Storage capacity problems
A daunting high storage cost
FAS

SIA Big Data Problem: Landsat 5; 7:
VNIR Spectral bands:
6 optical, 1 thermal
6 optical, 2 thermal
Radiometric resolution /information depth
8 bit imagery
SIA pack: 3 bands
(2 visible + NIR)
Landsat 8:
VNIR Spectral bands: 8 optical, 1 pan, 2 thermal
Radiometric resolution /information depth
16 bit imagery
SIA pack: ????
>More bands better characterize the physical and chemical nature of earth observations >lower resolution color bands (multispectral) can be enhanced/pan-sharpened with the panchromatic band
FAS
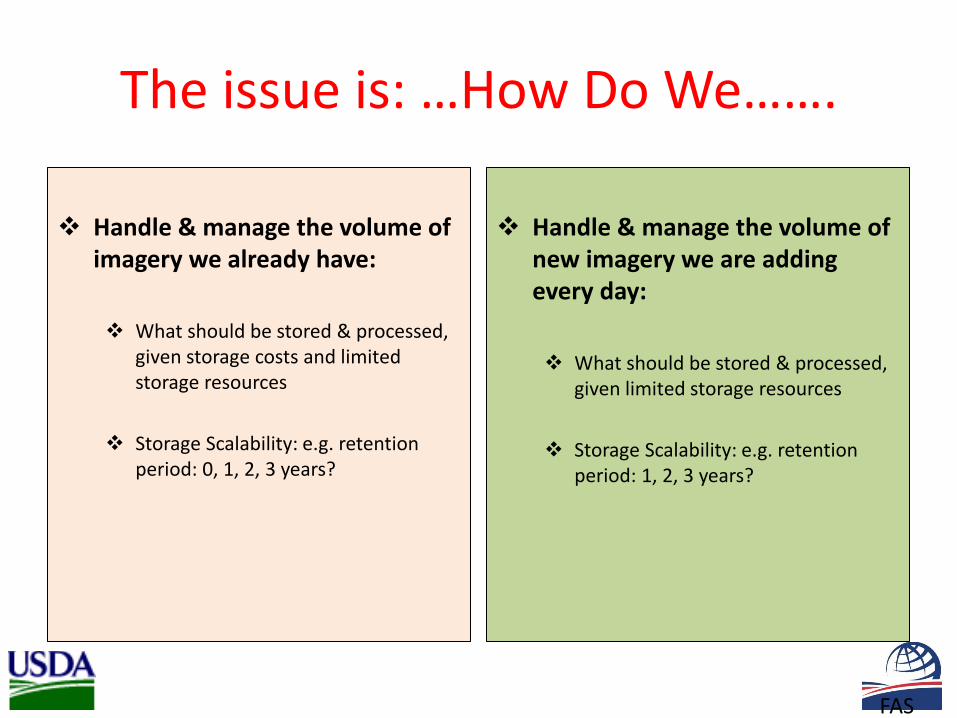
The issue is: …How Do We…….
Handle & manage the volume of imagery we already have:
What should be stored & processed,
given storage costs and limited storage resources
Storage Scalability: e.g. retention period: 0, 1, 2, 3 years?
Handle & manage the volume of new imagery we are adding every day:
What should be stored & processed,
given limited storage resources
Storage Scalability: e.g. retention period: 1, 2, 3 years?
FAS

Proposed Solutions
No more storage of L5, L7 datasets must be removed completely
Take advantage of image access developments: USGS infrastructure, ArcGIS
Online, Google Earth, etc. ?Conform with the need to
process large areas at near-real-time speeds
Adopt low-volume storage strategies (zip?)
Reduce storage retention period, 3 to 2 years
• Cloud computing – proposition
FAS

Cloud Computing Model: ………Things to consider…….
Continued fast access and processing capabilities
Does it affect applications: hardware-software
Re-locating datasets plus processing infrastructure
Short-long term impact on SIA members’ workflows
Sharing pool computing resources, e.g. SIA members, other users (licensing implications) Cloud computing model
provides network access to networks, servers, storage, applications, services, etc.
Determine who the primary Service Provider or else?? How to manage interactions
FAS

Applications: access + processing Storage - Infrastructure
USDA Satellite Imagery Archive
…Cost, time, efficiency, sustainability,
FAS

Contact :
USDA Foreign Agricultural Service Office of Global Analysis
International Production Assessment Division 1400 Independence Ave., S.W.
Washington, DC 20250 Tel: 202-720-7339
Browse Our Extensive Web Content at:
http://www.pecad.fas.usda.gov/
See Our Global Crop Explorer Site at:
http://www.pecad.fas.usda.gov/cropexplorer
FAS

Thanks… Questions
Comments
FAS
