operation manual - gut-stuttgart.de
TRANSCRIPT

Operation Manual
mIRoSpark Sliding Spark Spectrometer part New Model Structure

Manual: mIRoSpark - 1 - Copyright by IoSys/GUT
Table of contents
1 Description of the Sliding Spark Process ................................................................................................... 2
2 Setup of the Sliding Spark Spectrometer – SSS2 ....................................................................................... 3 2.1 The Sliding Spark Generator ................................................................................................................. 3 2.2 The Measuring Pistol .............................................................................................................................. 3 2.3 The Spectrometer Optic ......................................................................................................................... 4 2.4 The Computer with Control and Measurement Electronics ............................................................... 4
3 Hints and Instructions ................................................................................................................................... 5 3.1 Warnings and Safety Instructions ......................................................................................................... 5 3.2 Approval Instructions ............................................................................................................................. 5 3.3 Technical Data ......................................................................................................................................... 5
4 SSS2-Operation instructions ........................................................................................................................ 6 4.1 Starting ..................................................................................................................................................... 6 4.2 Measuring ................................................................................................................................................ 6 4.3 Transportation Handling ........................................................................................................................ 7 4.4 Mini-Plotter Handling .............................................................................................................................. 8
4.4.1 Integrated Mini-Plotter ....................................................................................................................... 8
5 The SSS2-pogram .......................................................................................................................................... 8 5.1 Conventions in this Manual ................................................................................................................... 8 5.2 Operating Elements in the Start-Display .............................................................................................. 9 5.3 Operating Elements in the Result-Display ......................................................................................... 10 5.4 Operating Elements in the Set-Mode .................................................................................................. 12
5.4.1 Operating Elements of the Numbers Block: .................................................................................... 12 5.5 Operating Elements in the Keys-Display ............................................................................................ 13 5.6 Recalibration of SSS2 ........................................................................................................................... 14
5.6.1 Error Messages of Recalibration Routine ........................................................................................ 15 5.7 Polymer Type Identification by Neuronal Networks .......................................................................... 16
5.7.1 Standard Model (All, for coloured, natural or milky-like plastic parts): ............................................ 17 5.7.2 Clear Type Model (clrT, for clear, transparent plastic parts): .......................................................... 17 5.7.3 Gray Type Model (gryT, for gray-coloured plastic parts): ................................................................ 18 5.7.4 Black Type Model (blkT, for black-coloured plastic parts): .............................................................. 18 5.7.5 DSD Model (for household and packaging plastics):....................................................................... 18
5.8 Additive Detection................................................................................................................................. 19 5.8.1 LOD Settings.................................................................................................................................... 20
5.9 Operating Elements in the Spc-Mode ................................................................................................. 21 5.9.1 The Main Menu ................................................................................................................................ 21 5.9.2 The Shift Menu................................................................................................................................. 22 5.9.3 The Bottom Menu ............................................................................................................................ 23 5.9.4 Additional Operating Elements ........................................................................................................ 23 5.9.5 The Intensity Menu .......................................................................................................................... 24
6 The System Files for SSS2 .......................................................................................................................... 25 6.1 The Setup File ........................................................................................................................................ 25 6.2 The Initialization File ............................................................................................................................. 25
7 Non-identifications / Incorrect identifications ........................................................................................... 26
8 Operational Disruptions .............................................................................................................................. 26
9 Sparking Spot as Detection Criterion ........................................................................................................ 27
10 Electrode Adjustment............................................................................................................................... 28
11 Time and Date Setting .............................................................................................................................. 28
12 Enter new Password................................................................................................................................. 28
13 Data Exchange .......................................................................................................................................... 29 13.1 Using PC-Link cable .......................................................................................................................... 29 13.2 Using USB-Stick ................................................................................................................................ 29
14 Trouble shooting ...................................................................................................................................... 30 14.1 The Unit Test Program ...................................................................................................................... 32

Manual: mIRoSpark - 2 - Copyright by IoSys/GUT
1 Description of the Sliding Spark Process
By inducing simultaneously vaporization and excitation, the sliding spark process allows electrically non-conducting components (which should preferably be compact and easily to be handled) of plastic and other non-conducting materials to be subjected to atomic spectrometric investigations under simple external conditions. Each investigation is carried out directly, almost no sample preparation is required. Surfaces, that are slightly dirty, can be freed of the material adhering to them by carrying out several measurements on the same sparking spot (measurement surface cleaning). The basic principle of the method is the thermal vaporization of a small amount of the plastic surface using high current sliding sparks of defined discharge characteristics. The complete measurement process is carried out in air under normal atmospheric conditions. A significant characteristic of the sliding spark process is the brief electric discharge that is induced to take place between two electrodes, which are separated from one another by a distance of a few millimeters, placed on the surface of the non-conducting material, i.e. the spark "slides" over the surface of the sample to be tested. In the course of this the components of the material (here: plastic) are vaporized, fragmented and ionized; bright, tube-shaped creeping discharge plasma is excited which emits characteristic light radiation. The ability to vary the discharge characteristics (hard or soft discharge) enables spectral lines with different excitation energies for light emission to be generated. Spectral analysis (in respect of the presence of particular wavelengths) of the spectrum as captured produces on the one hand information on the elements excited by the sliding spark. At the same time conclusions can be drawn on the concentration of an element in the sample from the intensity of the characteristic spectral lines. In addition, in the course of a sequence of sliding spark discharge processes, the surface of the material is changed in a specific manner since the continuous dissipation of energy along the sliding spark path leads to continuous removal of material. In the case of many plastics, continued discharges produce charring (e.g. in the case of plastics containing styrene such as ABS, PS, PPE etc.) or, as the case may be, incrustation of the sample surface. The progress of these surface changes provide a further characteristic of the sample being tested and yields a parameter for the material-specific function of the disruptive discharge voltage (that can be measured) as a function of the number of discharges. From the optical emission spectrum and the additional information from the dynamic disruptive discharge voltage values (Dynamic Discharge voltage Detector, DDD), statements can be made on the composition of the material under test. These can be used for the identification of different plastics, e.g. for recycling purposes. After the system has been appropriately calibrated with known samples, the approximate levels of particular elements in the sample can be obtained - even when the percentage levels of these are low. Evaluation of mean value spectra permits the reproducibility or precision of the statements to be increased.

Manual: mIRoSpark - 3 - Copyright by IoSys/GUT
2 Setup of the Sliding Spark Spectrometer – SSS2
The device which is equipped with a carrying handle and mainly consists of four function groups for the SSS2 part. These are in part integrated in the housing in modular fashion:
Sliding spark generator
Measuring pistol
Spectrometer optics
Computer with control and measurement electronics
2.1 The Sliding Spark Generator The pulse generator function group serves to generate the high current spark that "slides" over the surface of the dielectric material. The spark between the two electrodes is brought about with a high voltage pulse (Uign), which increases linearly to a level of several KV within a few milliseconds. Immediately following ignition along the path between the two electrodes, the energy stored in the capacitors (C, see figure) discharges via the spark path (E). The discharge of energy produces a short-lived direct current arc (current-carrying plasma) over the surface of the material. The duration of the charging process of the pulse capacitors (Ucharge) and thereby the amount of energy stored in them can be set via the software. Bringing into circuit an air coil (A) as additional inductance enables the discharge characteristics of the sliding spark to be changed. The air coil increases the period of the discharge and reduces the peak current (soft discharge). The ignition and charging circuits are separated from one another by diodes (D1, D2).
The abrupt collapse of the high voltage marks the breakdown of the spark path and the commencement of the abrupt high current discharge. The high voltage is measured indirectly with the aid of two high ohm resistors (R1, R2) connected in series. The maximum voltage measured immediately prior to the breakdown of the sliding spark path represents the ignition voltage for the specific material (DDD capturing). 2.2 The Measuring Pistol
The measuring gun is connected to the housing with a 2 m long metallic protective hose jacketed in PVC. A signal lamp (green/red) on the measuring gun indicates that the device is operational. The transmitting of the light from the spark path to the spectrometer optic is carried out with a fiber link, whereby the end of the optical fiber is protected against contamination with a quartz window at the base of the sparking chamber. The measuring gun itself enables the device to be brought up to the sample
in an easy manner. The cylindrical measuring head ( 50 mm) is pressed flush on to the sample as a closing piece and the measurement is triggered by pressing the start button. During the sparking process, a vacuum pump sucks the vaporization products out of the sparking chamber via a coarse particle filter through a filter cartridge filled with activated carbon. Sealing rings on the measuring head damp down the sparking noises. A capacitive proximity switch integrated in the measuring head as a protective switch avoids sparking on conducting materials.
Spectrometeroptics
Optical fibrePower
supply
Test gunPlastic testpart
ABS
Control andevaluation electronic
Spark generator
Fig. Schematic circuit diagram of the generator C = capacitor S = switch D = diodes
R = resistance E = electrodes
R2
Uignitiond
Ucharge
C S
AL
D2
D1
R1
E

Manual: mIRoSpark - 4 - Copyright by IoSys/GUT
2.3 The Spectrometer Optic The radiation generated by the sliding spark is transported via the optical fiber to the input gap of the multi-channel spectrometer to be scattered into its different wavelengths. From the end of the optical fiber the beam of light falls on an imaging diffraction grating.
The light reflected by the grating in the flat output level falls on three CCD (Charge Coupled Device)line sensors. These photo-detectors convert the light into electric analog signals. Approx. 6300 pixels of the optical spectrum are scanned simultaneously, whereby an almost complete overview spectrum in the spectral range from 210 to 560 nm with a resolution of approx. 0.1 nm is recorded.
The CCD signals are read opto-electronically after each sparking process. The analog CCD and DDD signals are digitalized on an interface board. The 12 bit digitalized data are then transferred to the evaluation computer. To improve the signal/noise (S/N) ratio, the signals are accumulated by the software after each individual sparking process and then a mean average value is formed by the number of measuring cycles that has been set to give the spectral representation that follows. The scaling of the dynamic range extends from 0 to 4096 arbitrary counts for a single scan (12 bit intensity resolution). For a improved scaling the dynamic range is rounded to 4100. 2.4 The Computer with Control and Measurement Electronics The functional tasks of the computer (PC/104 technology) are to transmit the sparking parameters to the generator and the spectrometer electronics and to further process and evaluate the signals received before outputting them on the 6.5" TFT flat screen. Direct operating of the software is made possible with an integrated touchscreen. The user enters the sparking parameters via the menu-guided SSS2-software. To facilitate handling further, the industrial PC supports the simultaneous connection of an external keyboard with a PS/2 plug. To avoid electromagnetic noise, the line to the keyboard is automatically interrupted with the aid of relay contacts during the sparking process and is then connected again. A serial interface (9 pole SUB-D plug) and an USB socket is provided for exchanging data via a PC-Link program.
Do not start a sparking process while a connection cable is connected at the COM port of the device. The electromagnetic radiation on the line could destroy the computer interface.
!

Manual: mIRoSpark - 5 - Copyright by IoSys/GUT
3 Hints and Instructions
3.1 Warnings and Safety Instructions Ensure that sparking is only carried out on the compact, non-conducting materials to be tested. When the device is used properly, a capacitive proximity sensor integrated in the measuring head prevents sparking to conducting materials (e.g. metals, metallized plastic surfaces, human beings and other living organisms).
IMPORTANT: Never attempt to trigger sparking on human beings or conducting materials. The current
shock can cause injuries or the current bridge can damage the unit.
In order to ensure that the device can operate properly, fix it in a manner so that it cannot slip and will not be subject to vibrations.
Ensure that there is an adequate circulation of air for the unit through its base plate. The slits on the device are for ventilation purposes and must not be covered over or otherwise blocked. The openings are designed to ensure that the device can function properly.
Take care that no liquid gets into the unit or the measuring gun. This can lead to internal components being damaged or to a short-circuit.
To avoid current bridges, do not use the unit near water or in moist ambient surroundings.
The unit may only be operated when connected to a socket with a grounded line.
Do not look visually into the sliding spark process without protection.
Do not operate the unit if the capacitive proximity sensor is not functioning properly.
Ensure that the 2m protective hose of the measuring pistol is not subjected to stress when being coiled up for transportation (damage of the fiber optic). Clamp the hose into the clip on the right side of the mIRoSpark or the SSS-2 device. Put in the measuring pistol in its holder and fix it gently with the security screw.
This measuring device consists of sensitive electronic components. Use not in accordance with the instruction may result in their destructions. Electrostatic discharges, induces voltage peaks and balance currents between different voltage potential are particularly harmful.
3.2 Approval Instructions
Tests should be carried out if possible in a shielded cabin (Faraday cage) in order to maintain the required limit values.
It is essential that attention is paid to the fact that the sliding spark spectrometer described is a specialist device. By reason of its specification, it is normally only to be used under laboratory conditions in an industrial operation. When the device is used in the proper manner for the purpose for which it was designed, high frequency electromagnetic radiation is generated automatically and inevitably during the sparking process as part of its function. 3.3 Technical Data Rated voltage: for Europe: 230Volt~/50Hz Rated voltage: for Japan: 100 Volt~, 50/60 Hz Rated current: 2 A max.
Protection class: Type of protection: IP 20 Mains connection: device plug Fuse: 5 A, fast, 20mm Dimensions (WxHxD): 364x200x376 mm (mIRoSpark) or 364x200x316 mm (SSS2) Weight: 14 kg (mIRoSpark) or 10 kg (SSS2) Ambient temperature: 15...35°C Max. relative air humidity: Operating: 10%...90%
!
!

Manual: mIRoSpark - 6 - Copyright by IoSys/GUT
4 SSS2-Operation instructions
4.1 Starting 1. Set the device up in a manner and at a place where it will not slip and where it will not be subject to vibration
and with the mounting grip at an angle. Ensure that the test device has an adequate circulation of air through the slits provided for this purpose.
2. Connect the device to an earthed mains connection (see: Technical Data). 3. Check the movable alignment of the electrodes in the measuring head (electrode gap should be 4.3 ± 0.1
mm). 4. Switch the device on at the rocker switch mounted at the back1 panel. The
green light ignites on the rocker switch and on the SSS2-measuring gun. Hardware parameter and last settings are automatically loaded and set. The device starts the SSS2-program and then switches to the mIRo-program automatically. The readiness of the device is signaled as shown.
5. Check the safety function of the proximity sensor on the measuring head by
touching the sensor with your finger. The signal lamp on the measuring gun must change from green to red whereby an audible click of the relay must be heard. If you now attempt to start the device with the start button, you should find that sparking is disabled and that shown message is displayed2. The device may only be operated when this sensor is functioning properly. The sensor prevents a sparking of electrical conductive samples like strong soot filled, metallized or damp samples or your skin.
4.2 Measuring 1. To identify the particular polymer type and its additives select the correct
identification model (Standard, clear-, black-, gray Type or DSD-Model) due to their colours or properties. The activation of these functions are signaled in red in the Result display (see: Polymer Type Identification by Neuronal Networks).
2. Press the measuring head against the sample surface. The surface should be smooth and as clean as possible. If not, scratch the surface with the attached knife to obtain a fresh new material surface. Both movable electrodes must have closed contact to the surface.
3. Press the start button and keep it pressed for about 1 second. When the button is pressed, the suction pump starts up and the sparking process is starting. In normal mode (single measurement), the result is displayed after the sparking process. The screen display with the results window remains displayed until the next measurement is carried out. In multiple mode (3x measurements), the result is displayed first after the three measurements have been carried out (see: Operating Elements in the Start-Display).
1 Rocker switch at the front panel in case of a SSS2-device. 2 The message DDD-Stop-Sensor! is also displayed if more than ¾ of the pre-set scans have been missed while sparking.

Manual: mIRoSpark - 7 - Copyright by IoSys/GUT
4. Check the identification performance of the device regularly by sparking off the reference sample supplied. If the PA sample is not unambiguously identified as PA6x3 in the Standard (All) model or if it appears that identification is not being carried out correctly with other known plastic samples, the device should be recalibrated (see: Recalibration of SSS2)
5. Non-Identification is signalled with the No-Result message (---). This
sample reliably (see: Polymer Type Identification by Neuronal Networks). The pre-set limit values have not been exceeded (e.g. 1st place less than 70 %, 2nd place greater than 30 % probability). In such case repeat the measurement until a reliable statement appears. If repeated measurements still are producing this message, the sample might be unknown (not calibrated) or the wrong net model was selected for identification or new recalibration is necessary (see: Non-identifications / Incorrect identifications). Touching any touch field in the middle of the screen changes back to the Start-Display.
6. Clean the quartz window inside the measuring head, the electrode tips and the inner surface of the sparking chamber with cotton wool sticks regularly. From time to time the stick should be moistening a bit with Isopropanol to remove obstinate contaminations from the quartz lens and from the chamber surface.
4.3 Transportation Handling 1. Leave the SSS2-program with <QUIT> and switch the
device off with the rocker switch. Last settings are stored automatically and reloaded again for the next putting into operation.
2. To transport the unit, coil up the protective hoses of the
measuring pistols. Ensure that the hoses are not subjected to any stress when being coiled up and attached to the clips. Fix the protective hoses into the clips mounted aside of the device. Clamp the measuring pistols gently in its pistol holders with the aid of the knurled screws.
The SSS-2 unit and the mIRo unit only have one measuring pistol at the right side, the mIRoSpark unit has the above displayed two pistols on the left and on the right. Please coil up the one or two protective hoses accordingly depending on your unit.
3 Fine differentiation of the polymer type PA6 and PA66 is not reliable. Therefore both types are calibrated/combined to PA6x.

Manual: mIRoSpark - 8 - Copyright by IoSys/GUT
4.4 Mini-Plotter Handling 4.4.1 Integrated Mini-Plotter The outside of the paper roll is the side to print on. Use only paper rolls which are coated on the outside with a with of 57.5 mm and a winding diameter of 31 mm. To insert the paper please proceed as following: 1. Open the printer cover by slightly pressing the lever upwards. 2. The paper roll is lifted from the mechanism together with the cover. 3. Unwind a little bit of the paper roll and insert the paper roll in the paper storage. 4. Close the cover by applying sufficient pressure until a clear snap shot can be heart. 5. After printing the paper can be simply ripped off at the tear bar.
5 The SSS2-pogram
5.1 Conventions in this Manual The device is designed in such a way that it can be operated from the touchscreen and/or from an external keyboard. In general a keyboard permits the menu-guided software to be handled more easily. While sparking off with the SSS2 part the keyboard line is automatically interrupted with the aid of a relay to avoid electromagnetic disruptions and then is automatically connected again after the measurement. The following paragraph gives the writing conventions used in these operating instructions: Operations to be carried out via the touch screen are given with the legend on the particular touch field and the word <Icon>. Those to be carried out with the external keyboard with the legend of the keyboard key and the word <Key>. Usually small characters should be entered. A touch field on the display only has to be touched briefly. If a number of keys or, as the case may be, touch fields have to be pressed simultaneously, then this is indicated with a plus sign (+) between the individual key or touch field legends, e.g. <SHIFT>+<F1>. In general only small characters of the keyboard are to be used! Pressing a key or touching an icon activates or deactivates a mode or function. In general a repeated pressing of the same key or touching the same icon again deactivates/activates the respective operation.

Manual: mIRoSpark - 9 - Copyright by IoSys/GUT
5.2 Operating Elements in the Start-Display Icon Key Function
Spec F1 Switches to the Spc-Mode (spectra) for detailed viewing atomic emission spectra and the DDD values (see: Operating Elements in the Spc-Mode).
Set F2 Switches to the Set-Mode to set4 the sparking parameters and scanning time
(see: Operating Elements in the Set-Mode). Ref F3 Starts the routine for the recalibration measurement by
sparking-off the PA-reference sample at three different sample places.
Cal F4 Starts the recalibration calculation (see: Recalibration of SSS2)
Keys F5 Displays the assignment of the touchscreen fields and opens further menu options for testing, setting and editing systems files for the SSS2 and mIRo part
(see: Operating Elements in the Keys-Display). mIRo F6 Switches to the mIRo-program. The mIRo program is
opened as a sub-program of the main SSS2-programm (see: Manual mIRoSpark).
3x F7 Sets 3-fold-Mode. In this mode three measurements must be carried out before the identification statement based on the arithmetic average of these 3 measurements will be displayed. A non-reproducible measurement can be deleted to carry out a new sparking. After the triple-measurement the system automatically switches back to the single measurement mode (1x) in which the results window is displayed after each sparking process (normal mode for the device)
??? F8 Switches to the Results-Display. You can leave the results window by pressing any vacant key or by touching the middle of the touch screen briefly.
QUIT ESC Leaves the SSS2-program and returns to the DOS level.
4 The SSS2 parameter Sparking condition can not be changed. The Scan Time, Pre-Sparks and Scans of given Sliding Spark Spectrometer part have been optimized for plastic identification and should not be changed.
Main window
Main menu bar
Status window

Manual: mIRoSpark - 10 - Copyright by IoSys/GUT
5.3 Operating Elements in the Result-Display Icon Key Function
Plot 0 Printing out the result as a screen dump by a Mini-Plotter (optional feature). The rocker switch located at the integrated plotter must be turned on. Touching the touchscreen or pressing any key on the keyboard stops the plotting process.
Slct Enter Restriction of the element display to the predefined significant elements only (Br, Cl, P, Pb and Cd) for an improved overview. With the Select function other elements which mostly arise from dust and contamination adhering to the samples (e.g. Ca, Mg, Si, Al, Ti, Ba etc.) will be suppressed in the screen.
Org BS Identification of the measured sample in relation to the original reference spectrum which represents the DESIGN state of the system (<Backspace>). The Original function permits a comparison of the identification performance. With the help of known test samples it can be checked whether a reliable polymer type recognition with the original reference spectrum or with the actual reference spectrum is ensured (see Recalibration of SSS2).
Int F9 Opens the Intensity-List showing the net intensities5 of the predefined additive lines for the measured test sample together with the limit of detection (LOD). Those element intensities which exceed the pre-set intensity threshold values of this line are highlighted in red.
Mat E Switches to Matrix-Listing of the net intensities of the pre-defined matrix lines of the present measured sample.
LOD F10 Opens the LOD-Menu to set the type-specific threshold values for the additive detection and polymer type identification like PVC etc. (see: LOD Settings).
??? F8 Switches back to the Result-Display.
Cln Starts the Cleaning-Function to remove possible memory effects of elements which came up in high concentration range before (e.g. Cl in PVC). The amount of pre-sparks are automatically set to 100 scans. Renewed touching the <Cln> icon deactivates the Cleaning function and goes back to single mode.
5 Marking of the colon in red indicates that the actual position of the peak maximum of the analysis are found by 2 pixel units to the left in
comparison with the pre-set pixel number, a blue marking that it was found by 2 pixels to the right. This markings are often shown if no significant intensities for a line are measured. Within the listing of the matrix intensities all colons should be in green. It simply indicates that the spectrometer adjustment is fine and thus no damage occurred due to bad handling.
Elements detected
Number of scans carried out
Statement of Concentration
Selection of identification models and further options
Statement of Pixel drift display
Hit list of identification probabilities
Resulting DDD- and element intensities shown as a Net-Data curve
Measured Net-Intensity of detected elements
Polymer type identified
Menu Bar

Manual: mIRoSpark - 11 - Copyright by IoSys/GUT
Icon Key Function
Stop F Deactivates the DDD-Stop-Sensor6 which observes the ignition voltage during a sparking process (train of sparks)
Mdfy N Due to spectra similarity the distinction of some polymer types is sometimes uncertain and could be random-like. To modify the identification result means that the determined probability in the network model (1st ranking in the Hit list) is altered to the main polymer group or which are in
general more probable ABS PMMA. The identification will be simplified like PA6x, PA12 PA
and PP, PE PO and ABS, PS Styr and PBT, PET PES. The Modify function can just be activate/deactivated if one of the mentioned polymer types are displayed. A temporary modification of an identification result is signalled then in red.
gryT 7 This identification model is recommended when gray-coloured plastic parts coming from the electro- and electronic dissembling area (e.g. computer waste) are to be detected, because the amount of polymer types for fine differentiation of the styrene-containing sub-group is extended and other types are neglected to enhance the identification performance. Modified results (Mdfy) switches ABS, PS result to Styr. Identification of PP, Styr (ABS, PS/PPO) and PCA7.
DSD M This identification model is recommended when typical plastic parts and foils coming from the household and packing area (MWS) are to be detected, because the amount of polymer types is restricted to the polymer types which normally occur as household and packaging (MWS=DSD = Duales System Deutschland). Modified results (Mdfy) switches PP, PE to PO. Identification of PO (PP, PE), PS and PET.
blkT U This identification model is recommended when black-coloured plastic parts coming from the electro- and electronic dissembling area are to be detected. Modified results (Mdfy) switches ABS, PS to Styr. Identification of PA8, PO, Styr (ABS, PS/PPO), PCA9, PBT, PMMA and POM.
clrT Z Restriction of the polymer identification to few clear types which can normally occur also or only as clear-transparent kinds. This identification model is recommended, because the amount of polymer types for fine differentiation of the styrene-containing sub-group is extended and other types are neglected to enhance the identification performance. Modified results (Mdfy) switches PS, SAN (AS) to Styr and ABS10 to PMMA! Identification of Styr (ABS, PS, SAN), PET, PC and PMMA.
./. ./. In case no specific net model is selected than the Standard (All) model is active. This identification11 model is recommended when coloured, natural- or milky-like plastic parts (not gray, not black and not transparent) are to be detected. Herein the amount of polymer types for fine differentiation of the styrene-containing sub-group is reduced. Modified results (Mdfy) switches PA6x,
PA12 PA and PP, PE PO and ABS, PS Styr and PBT,
PET PES. Identification of PA12 (PA6x, PA12), PO (PP, PE), Styr (ABS, PS), PES (PBT, PET), PCA13, PMMA, POM and TEFL, PPS and SK and PVC (see: Polymer Type Identification by Neuronal Networks).
6 The property of sparking off plastic samples partly is type depending. Some polymer types (e.g. some PC and styrene-containing polymer types) incline strongly during a sequence of sliding spark discharges to carbonisation and become conductive between the electrode gap. This alteration is supervised by the dynamic discharge detector (DDD-values). If more than ¾ of the predefined sliding sparks (Scans) have not ignited on the surface, this function prevents a further sparking to avoid a possible soot contamination of the measuring head. 7 Due to their polymer similarity gray colored PC polymers are calibrated as PCA types and gray PPO types as PS. 8 Fine differentiation of PA6, PA66 and PA12 is not reliable. Therefore these polymer types are calibrated and combined to PA. 9 Due to their polymer similarity black colored PC polymers are calibrated as PCA types and black PPO types as PS. 10 Usually transparent ABS material is a blend which contains PMMA, too. 11 IoSys uses the following abbreviations: PA=Polyamide, PO=Polyolefine, Styr=Styrene containing polymers, PES=Polyester, PPS=Polyphenylsulfide, SK=Silicon rubber,TEFL=Teflon 12 Fine differentiation of PA6 and PA66 polymer types is not reliable. Therefore both types are calibrated and combined to PA6x. 13 Due to their polymer similarity colored PC polymers are calibrated as PCA types.

Manual: mIRoSpark - 12 - Copyright by IoSys/GUT
5.4 Operating Elements in the Set-Mode Icon Key Function
F1 F1 Changing of the spark conditions from "hard" to "soft" by putting into circuit an induction coil in the discharge circuit. When the characteristics of the sliding spark discharges are soft, the emission spectrum of the elements excited out of their atomic states has fewer lines. Hard sparking conditions produce an emission spectrum of ionic states with more lines. The sparking condition is fixed set to “hard”.
F2 F2 Switching on of the numbers block to enable the scan time to be entered. If a scan time is set smaller than 20 ms, then it is automatically corrected to 20 ms. The longer the measuring time is, the greater will be the time interval up to the next sparking process (slower sequence of sparks) and thus the longer integration time available for the spectrometer optics will be.
F3 F3 Switching on of the numbers block for entering the charging time. If a charging time of > 20 ms is set, this will be automatically limited to 20 ms. The higher the value that is selected, the longer will the pulse capacitors be charged for, i.e. the larger the amount of energy stored, the higher the amount of energy at sparking (more light intensive). If the charging time is set to 0 ms, no discharging of the capacitors will take place. Accordingly only the low energy ignition will be visible. This parameter depends sometimes on the VAC-voltage on your local main power supply and must be set individually.
Setting of Charging time is very sensitive on the rated main input voltage of the device
F4 F4 Switching on of the numbers block for entering the number of pre-sparks. The plasma light from
these sparks will not be evaluated. In other words the pre-sparks can be used for slightly cleaning the surface whereby in general a compromise must be made between cleaning the surface and degrading the material surface (carbonization).
F5 F5 Switching on of the numbers block for entering the number of scans. If a value < "1" is set, this will be automatically corrected to "1". The number of measuring cycles scans is the same as the number of sliding sparks which will be grouped and evaluated together within a sequence of sparks to form an average mean spectrum.
QUIT ESC Leaves the Set-Mode and returns to the Start-Display. 5.4.1 Operating Elements of the Numbers Block: Icon Key Function
0 - 9 0 - 9 Input of the corresponding number.
BS Correction of the entry. OK Enter Confirming of the entry and leaving of the window. Back to
Set-Mode. ESC ESC Closing of the window (operating element of the numbers
block in spectrum mode). The current settings of parameters are automatically stored when the SET mode is left.
SSS2 parameters of given Sliding Spark Spectrometer part have been optimized for plastic identification and should not be changed without practical advice by the manufacturer: Sparking condition (F1), Scan time (F2) and scan numbers (F5)
!
!

Manual: mIRoSpark - 13 - Copyright by IoSys/GUT
5.5 Operating Elements in the Keys-Display Icon Key Function14
SetFile F1 Starts the MS-Dos text editor (edit.com) with automatically loading the setup file set-XX.net (XX = series number15) ) for editing modifications like directory paths, scale factors (B) or pixel numbers (see: The Setup File).
UnitTest F2 Starts the Unit test program (UnitTest.exe) for testing different component parts of the mIRoSpark device. In case of hardware operating malfunctions this diagnostic program helps to locate the error. Function tools coming up in gray are optional test features (see: The Unit Test Program).
PC-Link F3 Starts the PC-Link program16 (intersvr.exe) to enables data exchanges for updates or copying files to another computer (see: Using PC-Link cable).
SSS2Ini F4 Starts the text editor with automatically loading the initialization file for the SSS2 part (ini.net) for the activation of optional accessories (e.g. serial Mini-Plotter) or to edit the password for operation (see: The Initialization File).
mIRoNet F6 Opens a further window with a menu bar to select neuronal network calibration files (NetFiles) of the mIRo device part. Pressing an icon/key starts the text editor with automatically loading the selected NetFile. In a NetFile the Min-/Max-Pixel ranges of the NetD curve can be altered to modify the identification result (see: Manual mIRoSpark for mIRo part).
mIRoIni F7 Starts the text editor with automatically loading the initialization file for the mIRo part (ini.dat) for the activation of optional accessories (e.g. serial Mini-Plotter and to edit pre-set subdirectories.
TeachIn F8 Starts the text editor with automatically loading the initialization file teach-XX.dat for the mIRo-part to edit sample names and pre-set threshold values (see: The Teach-In File in the mIRo manual)
QUIT ESC Leaves the Keys-Display and returns back to the Start-Display.
Do not make any changes to the formatting in the text files. Do not insert a decimal point into the Integer numbers.
14 To operate the text editor an external keyboard should be connected. In general – if not otherwise noted - quitting the editor resets the loaded text file, therefore the modifications are directly taken over. 15 Data are always different depending on the series number and the individual unit. 16 To exit the PC-Link program the mIRoSpark device must be powered down, because the Touchscreen and Keyboard function is disabled while intersvr.exe is running. Therefore the <ALT+F4> command will not work (Beenden=Exit/End).
!

Manual: mIRoSpark - 14 - Copyright by IoSys/GUT
5.6 Recalibration of SSS2 The background to the recalibration routine is that different known types of plastic have been calibrated against the given PA6 reference sample (original reference spectrum: ORG, org-XX.spc). In the recalibration procedure, the original identification capabilities of the sliding spark spectrometer as they have existed at the time of the original calibration (design state) are restored mathematically for the present actual state of the device (actual state) with the aid of the same reference sample. Through the ratio method employed (single point recalibration), the effect of changes to the state of the system are eliminated to a large extent through the formation of intensity ratios (test sample data divided by reference sample data). The reason for this is that any deviations in intensity resulting from changes to the sensitivity of the scanning electronics brought about by temperature effects show up not only in test sample spectrum but also in the same way in the current reference spectrum (REF) produced with the reference sample.
The current identification performance of the device should be checked at regular intervals using known samples (e.g. with the PA6-Reference sample supplied in the All model). Recalibration is to be advised when the test samples or reference sample is no longer reliably identified.
Proceed as follows to recalibrate the SSS2 device: 1. Press the menu option <Ref> in the Start-Display. 2. Press the measuring gun against the reference sample.
Press the start button and hold it pressed until you have sparked off the sample in total three times on different fresh sample spot places. After each single measurement the ignition voltage values (DDD) and the net intensities of the matrix lines (Mat) are displayed as coloured NetD-curve. These values are evaluated in the neuronal network model as a pattern draft later on.
3. If after a measurement the resulting curve looks probably like
a runaway17 you should delete this spectrum with the <Del>
key and repeat the measurement. 4. After three sparkings or three resulting spectra in a mostly
uniform manner, start the recalibration routine by pressing the <Cal> icon.
An average reference spectrum is now formed from the 3 individual measurements. Two columns of figures are now displayed. In the left-hand RSD (Relative Standard Deviation) column, the reproducibility of the triple measurement is listed using the characteristic line intensities of the plastic matrix (Mat). Intensity deviations larger than ±5 % are marked in red in the RSD column for a clearer overview. In the right-hand ORG column, the percentage deviations of the new reference spectrum relative to the original reference spectrum (i.e. spectrum in the design state) are shown. Deviations greater than ± 20 % in the ORG column are also shown in red. If more than five matrix lines are marked, the triple measurement has had too much scattering around the mean value. If more than five matrix lines are shown in red, the current reference spectrum varies too much from the ORG spectrum. In both cases it is recommended that the recalibration process is repeated by pressing the <Ref> function key again.
Improper recalibration causes incorrect identification of polymer types!
17 Causes of runaways could be that the measuring head was not closed attached to the REF-sample or several times the same sparking place was sparked off (local degradation of the PA material result in a inclined DDD curve).
!
!

Manual: mIRoSpark - 15 - Copyright by IoSys/GUT
5. Pressing the pistol trigger briefly (ca. 0,5 s) or pressing any key or touching touchscreen briefly shows the new actual reference spectrum (New-Ref as gray curve for actual state) in comparison to the stored original reference spectrum graphically (Org as red curve for the design state). The more both spectra are congruent18, the closer the actual state is to the design state of the device.
6. Pressing the measuring gun start button again briefly, pressing any key or touching the middle of the touch screen briefly brings about detection of the PA6x sample in relation to the original reference spectrum. This display of results enables a possibility of comparison in which identification would have been possible if the recalibration process which has just been carried out had not been made. In other words, the worse the identification of the reference sample is as PA6x, the greater is the difference between the current actual state in comparison to the design state of the device and the more important it is to carry out the recalibration.
5.6.1 Error Messages of Recalibration Routine The following messages hereinafter signal that the reproducibility of the triple measurement seems acceptable, but the intensities of the reference spectrum compared with this deposited original spectrum are too low in the average or too high. The recalibration routine has to be repeated. If after renewed recalibration one of these reports appears again, check the parameter in the Set-Mode (see: Operating Elements in the Set-Mode). To adjust the sliding spark energy, the charging time should be increased or decreased at first about around initial 1 ms (Charging time, F3). The recalibration process should then be repeated and evaluated again.
On the other hand, starting the recalibration with the <Cal> icon with three measurements which look not similar, the following error messages will be displayed. The three sparkings show too much scattering around the resulting mean value. Consequently, this recalibration with the New-Ref will not be accepted and the result is discarded. Then a listing of the two columns shows the intensity deviations in detail:
18 In the course of REF-sample usage for recalibration, the surface of the PA material becomes more conductive due to energy dissipation by sliding sparks. More conductive means less breakdown voltage must be generated resulting in lower DDD values (graphically shown on the left side of the curve). Therefore the DDD curve might become lower in comparison to the stored original DDD curve. This effect of changing DDD curves was taken into consideration while neuronal network calculation.

Manual: mIRoSpark - 16 - Copyright by IoSys/GUT
5.7 Polymer Type Identification by Neuronal Networks The identification of the polymer type19 using neuronal network is the result of a mathematical model for polymer identification (except in the case of PVC, Teflon, PPS and SK). This data processing simply means a comparison with a pre-set pattern recognition20. Different types of plastics are categorized into a main group and into a number of sub-groups for fine differentiation.
Due to this it is very important to select the right identification net model to obtain the correct identification result depending on colour (Standard, gray- or black Types) or properties (clear Type) of the plastics to be measured.
After the measurement of the plastic sample, relevant optical information as well as the DDD values are processed with given weighting factors and special algorithms of the neuronal network model. The pre-set data of the net model has been created, trained and stored by calibration beforehand. The result of the calculation is a list of the most probable polymer type ranging between 0% and 100%. In the top of the Result–Display the three polymer types predicting the highest degrees of probability are displayed. The percentage value expressed the hit quality determined in the network
model. It does not mean the composition of a polymer blend. If the results of the measurement for a polymer type exceed the pre-set probability threshold values, then the plastic in the first place in the hit list is additionally displayed in green large letters in the middle of the display. If significant elements (Br, Cl, P, Cd, Pb) have been also detected the plastic abbreviation appears in red.
If the pre-set limit values have not been exceeded (e.g. 1st place less than 70 %, 2nd place greater than 30 %), this indicates that the neuronal network was not able to identify the sample reliably. Non-identification is signaled with the No-Result message (---). This should be interpreted as a request to repeat the measurement on the sample again. Recalibration with the reference sample can be necessary if repeat sparkings still produce the No-Result message or incorrect identification results are coming up with known polymer type samples The simplified listing of the evaluation routine given below will make clear the significance of the threshold values type 1 and type 2:
Listing: if (1st place < threshold value type 1) then show No-Result (---) or if (1st place > threshold value type 2) and (2nd ranking > threshold value type 2) then show No-Result or show result = plastic sort for best forecast else if (chlorine intensity) > (threshold value PVC) then show result = PVC or if (sulphur intensity) > (threshold value PPS) then show result = PPS or if (silicon intensity) > (threshold value Silicon Rubber) then show result = SK or if (fluorine intensity) > (threshold value Teflon) then show result = TEFL or if (carbon intensity) < (threshold value plastic) then show result = AIR
In practice the differentiation of styrene-containing polymer types like ABS, PS, PPO and PCA are very difficult with the Sliding Spark Technology due to their polymer similarity. Most of them are blends of each other in different concentrations. But restriction of the polymer identification to their colours and to their typical fire retardant (FR) composition21 helps to work out the distinctive marks in the DDD curve and in the spectra enhancing the SSS2-identification performance for these materials. The message Sparking Spot? appears if a styrene-containing polymer type is identified. It indicates to look exactly at the typical sparking spot on the surface which is mostly very typical for a polymer type (see: Sparking Spot as Detection Criterion).
19 PA=Polyamide, PO=Polyolefine, Styr=Styrene containing polymers, PES=Polyester, PPS=Polyphenylsulfide, SK=Silicon rubber, TEFL=Teflon 20 The relative disadvantage of any neuronal network algorithm is that after the production no other polymer types can be calibrated by the user. The model is only valid for the given main and sub-groups. Modifications must be carried out on demand by the manufacturer. 21 Typical fire retardants contain Bromine (Br), Chlorine (Cl) or Phosphorus (P).
!

Manual: mIRoSpark - 17 - Copyright by IoSys/GUT
5.7.1 Standard Model (All, for coloured, natural or milky-like plastic parts): This identification22 model is recommended when coloured, natural- or milky-like plastic parts (not gray, not black and not transparent) are to be detected. Herein the amount of polymer types for fine differentiation of the styrene-containing sub-group is reduced. Due to their polymer similarity coloured PC polymers are calibrated as PCA
types. Modified results23 (Mdfy) switches PA6x, PA12 PA and PP, PE PO and ABS, PS Styr and PBT,
PET PES. Identification of PA24 (PA6x, PA12), PO25 (PP, PE), Styr26 (ABS, PS), PES (PBT, PET), PCA, PMMA, POM and TEFL, PPS, SK and PVC: As experience shows, the following logical restriction27 for all models can be made due to the characteristic FR-composition: If P is detected in ABS than the result is changing to PCA?,
because ABS comes without P and PCA comes almost with P
(ABS + P PCA?)28. If P is detect in PS than the result is changing to PPO?, because PS
comes without P and PPO comes almost with P (PS + P PPO?). If Br and Cl is detected in PS or PPO or PCA than the identification
result is changing to ABS?, because only ABS comes with Br and
Cl (PS/PPO/PCA + Br + Cl ABS?). If Cl but no Br is detected in ABS than the identification result
changes to PS?, because ABS comes almost without Cl, only with
Br or with Br and Cl together (ABS + Cl PS?). 5.7.2 Clear Type Model (clrT, for clear, transparent plastic parts): Restriction of the polymer identification to few clear types which can normally occur also or only as clear, transparent plastic parts. This identification model is recommended, because the amount of polymer types for fine differentiation of the styrene-containing sub-group is extended and other types are neglected to enhance the identification performance. Modified results (Mdfy) switches PS, SAN (AS) to Styr and ABS29 to PMMA which is in general more probable! Identification of Styr (ABS, PS, SAN30), PET, PC, PMMA and TEFL, PPS and SK and PVC:
22 IoSys uses the following abbreviations: PA=Polyamide, PO=Polyolefine, Styr=Styrene containing polymers, PES=Polyester, PPS=Polyphenylsulfide, SK=Silicon caoutchouc, -rubber, TEFL=Teflon 23 Due to spectra similarity the distinction of some polymer types is sometimes uncertain and could be random-like. To modify the identification result means that the identification will be simplified. 24 Fine differentiation of PA6 and PA66 polymer types is not reliable. Therefore both types are calibrated and combined to PA6x. 25 To distinguish each Polyolefine group for the neuronal network calculation IoSys uses the following abbreviations: PO for Standard (All), POx for DSD and POy for the black Type model. 26 To distinguish each styrene-containing group for the neuronal network calculation IoSys uses the following abbreviations: Styr for Standard (All), Styl for clear Type, Strl for gray Type and Stol for the black Type model. 27 A question mark ? indicates a logical modification of the identification result. 28 As an example the following changes of the result display due to its restriction is explained: After sparking off the display shows in red letters PCA and P is detected. The Modify function is activated thus the ABS-result is changing. Due to the detection of Phosphorus as a typical fire retardant in PCA the modified ABS-result is switched to PCA? 29 Usually transparent ABS material is a blend which contains PMMA, too. 30 SAN = Styrene-Acryl-Nitril is also named as AS = Acryl-styrene.
PES
PA6x, PA12
PP, PE
PBT, PET
POM PVC
PO
PMMA PA Styr PCA
ABS, PS
PVC
SK
PPS
TEFL
ABS, PS, SAN
PC PMMA PET Styr PVC
SK
PPS
TEFL

Manual: mIRoSpark - 18 - Copyright by IoSys/GUT
5.7.3 Gray Type Model (gryT, for gray-coloured plastic parts): In general the differentiation of styrene-containing polymer types like ABS, PS, PPO and PCA are difficult with the Sliding Spark Technology due to their polymer similarity. Most of them are blends of each other in different concentrations. But restriction of the polymer identification to gray-coloured materials helps to work out the distinctive marks in the DDD-values and spectra enhancing the identification performance for these materials. This identification model is recommended when gray-coloured plastic parts coming from the electro- and electronic dissembling area (e.g. computer waste) are to be detected, because the amount of polymer types for fine differentiation of the styrene-containing sub-group is extended and other types are neglected to enhance the identification performance. Due to their polymer similarity gray coloured PC polymers are calibrated as PCA types and gray PPO types as PS. Modified results (Mdfy) switches ABS, PS result to Styr. Identification of PP, Styr (ABS, PS/PPO), PCA and TEFL, PPS, SK and PVC: 5.7.4 Black Type Model (blkT, for black-coloured plastic parts): This identification model is recommended when black-coloured plastic parts coming from the electro- and electronic dissembling area are to be detected. Due to their polymer similarity black coloured PC polymers are calibrated as PCA types and black PPO types as PS. Modified results (Mdfy) switches PP, PE to PO and ABS, PS result to Styr. Identification of PA31, PO, Styr (ABS, PS/PPO), PCA, PBT, PMMA, POM and TEFL, PPS, SK and PVC: 5.7.5 DSD Model (for household and packaging plastics): This identification model is recommended when typical plastic parts and foils coming from the household and packing area (MWS) are to be detected, because the amount of polymer types is restricted to the polymer types which normally occur as household and packaging plastics (MWS = DSD = Duales System Deutschland). To enhance the spectral variances, the database of normal, gray and black coloured and transparent polymer types were gathered and ABS, PS, SAN are combined to PS and PBT, PET are combined to PET. Modified results (Mdfy) switches PP, PE to PO. Identification of PO (PP, PE), PS, PET and TEFL, PPS, SK and PVC:
31 Fine differentiation of PA6, PA66 and PA12 is not reliable. Therefore these polymer types are calibrated and combined as PA.
ABS, PS/PPO
PCA Styr PP PVC
SK
PPS
TEFL
PVC
SK
PPS
TEFL ABS, PS/PPO
PA PO PBT Styr POM
PP, PE
PMMA PCA
PS
PET
PO
PP, PE
PVC
SK
PPS
TEFL

Manual: mIRoSpark - 19 - Copyright by IoSys/GUT
5.8 Additive Detection Detection of an additive is carried out on the basis of the presence of a characteristic spectral line of the element in question at a pre-set pixel position. The net intensities (Inet = Itotal - Ibackground) of the analysis lines are determined here by the base line subtraction method. The intensity of the background is determined at two defined points left and right next to the particular measuring line peak maximum (left Background, LBG and right Background, RBG) using a straight line equation and interpolated on the measurement line. The background intensity determined in this way is then subtracted from total intensity as determined of the analysis line. The element is presented as being identified in the results display if the line intensity after correction for the background exceeds the pre-set intensity threshold value of this line (LOD).
Pressing the <Int> icon (Key: <F9>) in the results display shows all the elements together with their pre-set LOD values (see: LOD Settings). Those element intensities32, which exceed the threshold after the measurement, the LODs are marked in red. The intensities of the matrices elements are listed by pressing the Mat icon (Matrix). For an improved overview of the Result window, the element display can be restricted with the <Slct> function (Select) to just significant elements (Br, Cl, P, Pb and Cd). Listing of other elements (e.g. Ca, Mg, Si, Al, Ba, Sb etc.), which almost arises from dust and contamination adhering to the sample, will now be suppressed.
The basic principle on which the semi- quantitative statements of content are possible, is the result of a calibration, which has been carried out before with suitable samples (mostly PVC) with known element content. The statement of element concentration is calculated by means of pre-set values determined from a one point calibration. The following procedure shows how to edit new values in the Setup file for an element concentration statement in the sample: 1. Carry out a cleaning measurement to remove possibly memory effects. 2. Activate the triple measurement mode <3x> 3. Spark off the sample with a known given element concentration on three different surface points. Delete a
spectrum a with the <Del> icon if it seems to be a runaway. 4. Switch to the <Int> menu and take/note the average intensity of the element in question. 5. Divide this Net-Intensity value by the known concentration (eg. Cts / % ) to obtain the gradient factor B33 (here:
one-point-calibration). 6. Open the Keys-Menu and press the <SetFile> icon (F1) to open the Text-Editor with automatically loading
the initialization file of the system. 7. Edit this B-value at the appropriate line of the text file (see: The Setup File). The simplified listing below shows the significance of the axis section (A) and gradient factor (B) and LOD threshold value for the concentration statement :
Listing: If (intensity of the element line) > (element threshold value for plastic type detected [PVC or Not-PVC34]) then begin with if regression data are present {i.e. gradient B <> 1} then begin with element concentration = ((intensity of the element line in Cts. ) - (axis section A)) div (gradient factor B) if element concentration >= 0.1 then show (element symbol) with (statement of content in %) but else show only (element symbol) without (statement of content) end.
32 Marking of the colon in red indicates that the actual position of the peak maximum of the analysis are found by 2 pixel units to the left in
comparison with the pre-set pixel number, a blue marking that it was found by 2 pixel to the right. This markings are generally shown if no significant intensities for a line are measured. Listing the matrix intensities all colons should be in green.
33 Y= A + B*X 34 Since the detection limits of most elements are much more sensitive in a PVC matrix, two calibration functions are calculated (for Non-PVC
types and for PVC)
Net-Intensity
RBG
Background-Intensity
Total-Intensity
LBG

Manual: mIRoSpark - 20 - Copyright by IoSys/GUT
5.8.1 LOD Settings Many elements present in additives can show different intensity sensitivities depending on the polymer type in which they are contained. Thus, for example, the line intensities of many elements are much higher when they are present in a plastic matrix containing halogens (e.g. in PVC) than when they are present in a non-halogen matrix35. Taking this into account, the intensity threshold values can be set in type-specific manner in the LOD menu (Limit of Detection, Key: <F10>) under the Set Plastic selection window. In the Element selection window, the threshold value gives the value that has been set which the element signal for the particular type of plastic in question must exceed before the element can be displayed as being detected. The detection limit can be changed at any time by entering a new threshold value. In the active menu selection windows, not only the polymer type being identified but also the elements that have been detected are marked in red. With the aid of the <ALL> key modification of a LOD values can be applied to all types of plastic listed. An element symbol with a hyphen (e.g. Pb’) signals that this emission line is second choice and thus deactivated (high LOD value like 4000).
Icon Key Function
0 - 9 0 - 9 Entry of the figures in question OK Enter Confirmation of the current entry, back to Element-Selection Display BS BS Correction of the threshold value entry ESC ESC Closes the Element-Selection Display, back to Type-Selection Display. Pressing again: back
to Result-Display. The identification of PVC, Teflon, PPS and SK is carried out by the detection of their characteristic elements exceeding their LOD threshold values. As an example: PVC can be set by pressing the <PVC> icon in the Set Plastic list and then selecting the Cl in the Element list (Cl is now highlighted in green). Proceed in an analogous
manner for Teflon F, PPS S, SK Si.
Attention: After pressing the ALL-function for setting the threshold values for the element Cl, F, S and Si, LOD for PVC, Teflon, PPS und SK has to be set newly.
Cl Flame-retardant paints, matrix element in PVC
Br Flame-retardant paints
Zn Stabilizers, release agents,
Ba Stabilizers, fillers (in heavy spar), with contamination
S Stabilizers, matrix element in PPS
Pb Stabilizers, dyestuffs, release agents
Ca Stabilizers, fillers (in chalk), with contamination
Al Stabilizers, fillers (in mica), flame-retardant paints
F Antidripping agents, matrix element in Teflon (PTFE) and PVDF
Ti Dyestuffs, fillers
Sn Stabilizers in PVC
Si Fillers (in talcum), glass fibers, with contamination, matrix element in SK
Mg Fillers, stabilizers, flame-retardant paints, with contamination
Sb Synergist in flame-inhibiting systems together with Br36
P Flame-retardant, paints, plasticizers
Cd Stabilizers, dyestuffs
35 The vaporization of additives containing metals for excitation in a sliding spark plasma is significantly increased in the presence of chlorine through the formation of volatile halides, which favour detection in a permanent manner. 36 The used Silicium spectral line interferes with the Antimony lines. Thus detection of Sb is only shown if Br is detected also.
!
Entering of the current threshold value
Pre-set threshold value
Entering of LOD threshold values for all types
Alternative keyboard Key
Element intensity measured
Polymer Type detected
Manual: mIRoSpark - 21 - Copyright by IoSys/GUT
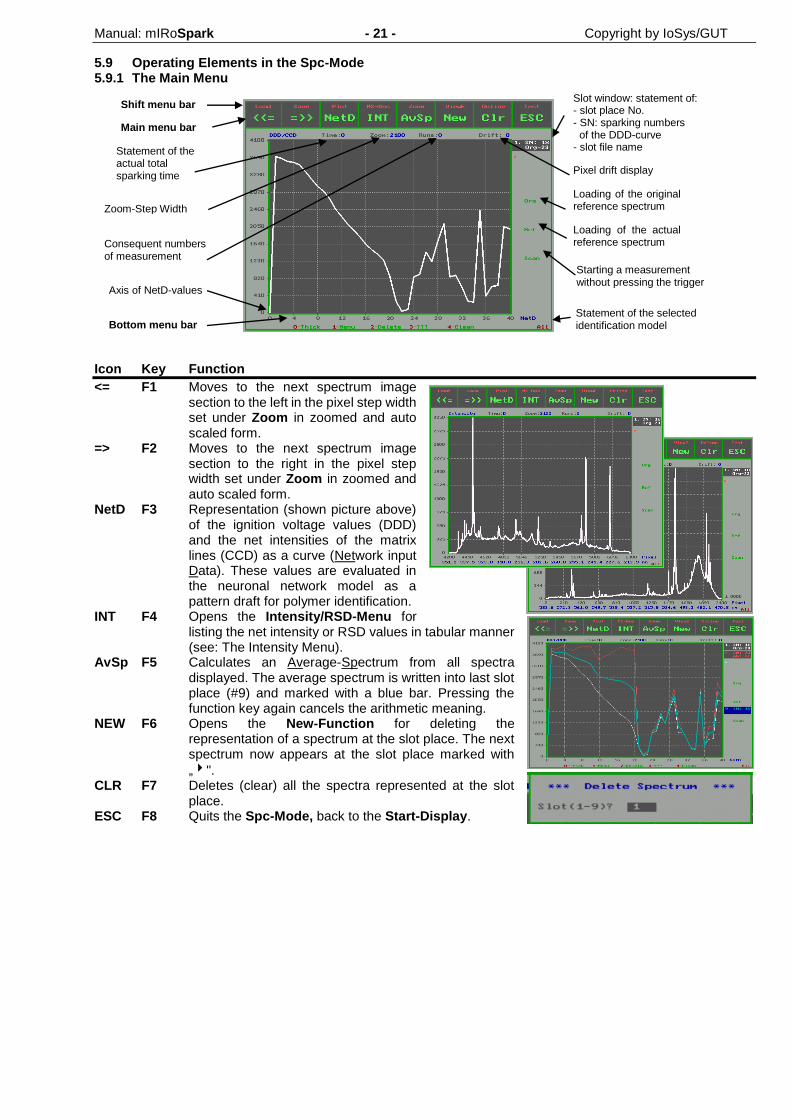
5.9 Operating Elements in the Spc-Mode 5.9.1 The Main Menu Icon Key Function
<= F1 Moves to the next spectrum image section to the left in the pixel step width set under Zoom in zoomed and auto scaled form.
=> F2 Moves to the next spectrum image section to the right in the pixel step width set under Zoom in zoomed and auto scaled form.
NetD F3 Representation (shown picture above) of the ignition voltage values (DDD) and the net intensities of the matrix lines (CCD) as a curve (Network input Data). These values are evaluated in the neuronal network model as a pattern draft for polymer identification.
INT F4 Opens the Intensity/RSD-Menu for listing the net intensity or RSD values in tabular manner (see: The Intensity Menu).
AvSp F5 Calculates an Average-Spectrum from all spectra displayed. The average spectrum is written into last slot place (#9) and marked with a blue bar. Pressing the function key again cancels the arithmetic meaning.
NEW F6 Opens the New-Function for deleting the representation of a spectrum at the slot place. The next spectrum now appears at the slot place marked with
„". CLR F7 Deletes (clear) all the spectra represented at the slot
place. ESC F8 Quits the Spc-Mode, back to the Start-Display.
Starting a measurement without pressing the trigger
Consequent numbers of measurement
Statement of the actual total sparking time
Shift menu bar
Axis of NetD-values
Main menu bar
Bottom menu bar Statement of the selected identification model
Loading of the original reference spectrum
Pixel drift display
Loading of the actual reference spectrum
Slot window: statement of: - slot place No. - SN: sparking numbers of the DDD-curve - slot file name
Zoom-Step Width

Manual: mIRoSpark - 22 - Copyright by IoSys/GUT
5.9.2 The Shift Menu Touch Key Function
Load Sft+F1 Opens the Load-Spectrum Menu to open spectra which were saved in the directory path edited under Dir (max. 22 letters). A temporary change to the pre-set directory (edited in the Initialization File) and path can be carried out under Dir. The files are listed in filtered form in accordance with the characters37 entered. Moving within the window can be done with the <Enter> or <Cursor up> or <Cursor down> key. Loaded spectra are shown in different colours after quitting the menu.
Save Sft+F2 Opens the Save-Spectrum Menu to permit spectra to be stored in the directory path edited under Dir (max. 22 letters). A saved spectrum file gets the file suffix „*.spc“ and is written in a Flat-ASCII text format.
Plot Sft+F3 Prints38 out the actual display as a screen dump to a Mini-Plotter (optional feature). Touching any field of the touchscreen or pressing any key on the Keyboard stops the plotting process.
MS-Dos Sft+F4 Opens a MS-DOS Menu for the entering or carrying out given MS-Dos operation commands.
Zoom Sft+F5 Opens the Zoom-Menu with numbers block for entering a section window for detailed viewing of the spectra.
ViewE Sft+F6 Viewing of an element spectral line39 as a curve measured in dependence of the spark number while sparking off the sample under investigation. The spectral line under investigation can be set by entering the pixel position. The specific pixel position (between 1 and 6300) can taken from the detail spectra section. In this mode40 polymer identification is disabled. Pressing the ViewE-Function icon/key again switches back to the SPC-Mode.
Online Sft+F7 Continuous running and reading of the spectrometer optics whereby the online spectrum is always displayed in the first slot. In the Online-Mode41 sparking with the measuring gun is disabled (function for manufacturer only).
Test Sft+F8 Starts the Test-Mode which permits to control changes in the scanning sensitivities of the scanning and reading electronics. In this mode the dynamic range42 of the photo-sensors can be determined and thus to be checked.
37 A backslash (\) edited at first of the file name activates the loading/saving of a file series. For example, the entry \kal-0 loads/saves all spectra beginning with the file from kal-1; an entry \kal-1 loads/saves all spectra beginning from kal-11. 38Only active if a the Mini-Plotter is connected and the hardware is activated in the initialization file Ini.dat. 39 The intensity of the line is displayed as total intensities. It means that there is no subtraction of the background. 40 The ViewE functions allows to analyze or to detect coatings like Si or F on non-conductive surface (depth-profile). 41 The Online-Mode permits external light emission sources (e.g. HCL, neon lamp) held in front of the measuring head to be spectroscopically analyzed. 42 In the Test-Mode the spectrometer signals are continuously shown in slot place #1. Pressing the function key again causes switching between the initial zoomed image representation (LEDoff= dark signal: 0-100 Cts. and LEDon = saturation signal: 4000-4100 Cts.) and the full image representation (0-4100 Cts.). The pistol start trigger is disabled as a function for the manufacturer.

Manual: mIRoSpark - 23 - Copyright by IoSys/GUT
5.9.3 The Bottom Menu Touch Key Function
Thick 0 Displaying the last curve (highest Slot-number) as a thick or thin curve (or <t> key). Menu 1 Opens the menu bar (also
with <ENTER>) to select either a net model for polymer type identification (<F1>..<F6>) and/or to open the LOD settings (see: LOD Settings) as described before.
Delete 2 Deletes the spectrum with the highest slot number (also with <Backspace>).
??? 3 Switches to the Result-Display for 2 sec. Always an average spectrum is evaluated. It means, if several spectra are shown then a corresponding mean of all displayed spectra is calculated and this result is displayed for a short time.
Cln 4 Starts the Cleaning-Function to remove possible memory effects of elements which came up in high concentration range before (e.g. Cl in PVC). The amount of pre-sparks are automatically set to 100 scans. Renewed touching the <Cln> icon deactivates the Cleaning-Function.
5.9.4 Additional Operating Elements Icon Key Function
./. Moving of spectrum section in its pre-set pixel step width to the left.
./. Moving of spectrum section in its pre-set pixel step width to the right.
./. Auto scaled representation of spectrum section in the pre-set pixel step width.
./. Full image representation of the spectrum window in question.
Zoom ‘ ‘ Sets the pixel step widths in steps of 20, 50, 100, 200 and 2100 steps for detailed spectra viewing. Change the step widths by pressing repeatedly the <Zoom> icon or <Space> key, resp..
Org O Quick loading of the original-reference spectrum (PA6) into slot#1.
Ref R Quick loading of the actual reference spectrum into the next vacant slot. Scan S Starts a measurement without sparking and pistol triggering. ./. P Activates the polymer type identification for all displayed spectra (also with
<???>). The identification result and the 1st ranking percentage for each spectrum is listed in the corresponding slot window. Pressing again the <p> key returns back to the statements of the sample file name.
./. C Starts the recalibration routine (see: Recalibration of SSS2).
./. L Opens the Save-Learning-Spectra menu to stored calibration spectra (only for the manufacturer).

Manual: mIRoSpark - 24 - Copyright by IoSys/GUT
5.9.5 The Intensity Menu Icon Key Function
Add F1 Listing of the net intensity values of the pre-set additive element lines from all spectra displayed. In the left column of the Intensity window the drift-corrected43 pixel positions for the analysis lines are listed.
Mat F2 Listing of the net intensities of the pre-set matrix lines, dito. AvSp F3 Calculates an Average-Spectrum (mean values) from all the spectra represented. The <AvSp>
icon changes to <Org> icon. The intensity values of the average spectrum is written into the last column (gray background). Pressing the function key again cancels the arithmetic mean.
RSD F4 Listing of the relative standard deviation44 (RSD). The <RSD> icon changes to <Int> icon. In the last column, the RSD values under repeat conditions are listed (precision of the method). To give a better overview, deviations less than 100 % are represented with ---, RSD greater than 100 % with +++. Repeatedly pressing the function key again switches between RSD-/INT-Display.
Save F5 Opens Save-Intensity-Menu in order to save the listed intensity or RSD values in the directory and path set under Dir. The intensity files get the file suffix „*.int“, the RSD files „*.rsd“., resp.. All data are written in each case in Flat-ASCII text format. A temporary change to the preset directory and path (max. 22 characters) can be carried out under Dir.
Plot F6 Plotting the intensity or RSD values in tabular form to the integrated Mini-Plotter or external one (connected to COM-Port as optional feature).
FFD F7 Form feed for the Mini-Plotter. ESC F8 Leaves the Intensity-Menu, back to the Spc-Mode.
43 Displacements of the predefined pixel positions in the spectrometer optics can come about as a result of temperature effects. The program routine determines and corrects this pixel drift by determining the deviation in relation to the defined drift correction line for the current position. In addition the analysis lines as set are "run through" so that the particular peak maximum of the scan line is automatically brought in for the net intensity calculation. The drift-corrected pixel positions of the highest slot place are listed in the left-hand column of the INT menu. Marking of the particular pixel number in red indicates that the position of the current peak maximum of the analysis line has been moved by 2 pixel units to the left in comparison with the pre-set pixel number, a blue marking that it has been moved by 2 pixel units to the right. An overview of eventually displacements of the predefined pixel positions are also shown in the results display under the figure of the INT- and MAT function. Hereby, the colons after the element symbols are coloured marked. 44 The percentage deviations of the individual emission line intensities relative to the arithmetic mean are shown.
Statement of drift-corrected pixel numbers *
Element symbol display
Column for average value spectrum
List of net intensities of all spectra displayed

Manual: mIRoSpark - 25 - Copyright by IoSys/GUT
6 The System Files for SSS2
6.1 The Setup File Pre-set parameters like directory paths, pixel positions of the spectral lines and their backgrounds calibration data for semi-quantitative statements are stored in the file Set-XX.net (XX=series number). This text file can be opened by pressing the <SetFile> (see: Operating Elements in the Keys-Display). As an example a typical setup file is listed (data always differ depending on system!). 6.2 The Initialization File Pre-set parameters like the serial number of the unit, hardware address and the activation of optional features are stored in the file Ini.net. This text file can be opened by pressing the <SSS2Ini> (see: Operating Elements in the Keys-Display). As an example a typical initialization file is listed:
Do not make any changes to the formatting in the text files. Do not insert a decimal point with Integer numbers.
!
Password which activates the SSS2-program.
Activation code for optional features 0 = deactivated,
1 = activated
Corresponding consecutive number in the element table.
Axis section and scale factor from the linear regression for non-PVC polymers. (usually not set).
Used element symbol, wavelength of the spectral line with corresponding pixel position, left and right Background values
Axis section (A) and scale factor (B) from the linear regression calculation (Y= A + B*X) for PVC material (for one-point recalibration). Axis can be set to 0, because LOD value determines the threshold limit
Pre-set directory paths

Manual: mIRoSpark - 26 - Copyright by IoSys/GUT
7 Non-identifications / Incorrect identifications
The fact that a sample has not been identified is indicated with the No-Result (---) on the results screen. If no improvement in identification performance comes about following recalibration of the device, one of the following can be responsible for repeated No-Results:
Possible cause Solution / elimination of mistakes
Surface of sample painted a) Repeat the measurement at another point, e.g. on the inside of a monitor housing. Dirty sample surface place a) Scratch the surface with a knife to obtain a fresh new material surface Structured sample surface a) Repeat the test if possible at a point which is smooth or less structured b) Scratch the surface with a knife to even the surface Electrodes do not come into contact a) Check the position of the seals in their slots with the sample surface b) Check the position of the electrodes. c) Adjust the distance between the electrodes if necessary (see: Electrode Adjustment). Permanent display of particular element/s a) Carry out a number of "cleaning shots" by placing the (memory effect) measuring head in the measuring head holder and carrying out a few sparking cycles. b) If necessary correct the threshold value for the plastics in question in menu option LOD set. Dirt on the quartz window a) Clean the quartz window inside the sparking chamber with cotton wool sticks45
8 Operational Disruptions
Fault Elimination
Computer and display is not starting a) Switch the device off and then try to start again. If error still remains (see: Trouble shooting) Program SSS2 „crashes“ a) Switch the device off and try to start again. after a sparking process b) Check the device parameter settings and if necessary load the default values of original settings (see: Operating Elements in the Keys). Spectra cannot be loaded. a) Check the spectra directory and path Sliding spark ignites poorly a) The particular type of plastic is inherently unsuitable for the sliding spark process b) Check the alignment of the electrodes and set the distance properly (see: Electrode Adjustment) c) Clean the sparking chamber surface with Isopropanol The sliding spark ignites but is too weak a) In SET mode check the charging time (only ignition spark) of the capacitor (F3,charging energy). b) Switch the device off and then on again. c) Check the device fuses on the back of the housing and if necessary insert a new one of the same type (5A/115V/fast/20mm). d) Defect of the energy circuit board (see: Trouble shooting) Proximity switch triggers too often a) Release the fixing screw and push the sensor deeper into the measuring head until the desired sensitivity is reached. Screw up the grub screws again.
45 From time to time the cotton stick should be moistened with a little bit of Isopropanol (Isopropyl alcohol) to remove invisible coatings on the quartz window which decreases the light intensities of the UV spectral lines

Manual: mIRoSpark - 27 - Copyright by IoSys/GUT
9 Sparking Spot as Detection Criterion
Many types of plastic show sparking spots of different characteristics after sliding sparking. Very often an a priori general identification on the type of plastic can be carried out on the basis of the appearance46 of the sparking spot. Accordingly examination of the sparking spot is advised as a check on the plausibility of the detection result in order in this way to eliminate possible incorrect identifications.
Type of plastic, Nature of sample, Nature of sparking spot abbreviation primarily
Polyamide opaque no sparking spot47 PA
Polyethylene opaque no sparking spot, sparking pattern is PE shinier than with PA
Polypropylene opaque no sparking spot PP sparking mark is matter than with PE
Polyvinylchloride opaque or brownish sparking spot, weak encrustation, PVC crystal-clear, transparent restless sparking
Acryilnitrile/Butadiene/Styrene opaque brown sparking spot, ABS sparking mark is matter than with PCA
Polystyrene-polymerisate crystal-clear, transparent brown-black sparking spot (darker than with PS/HIPS or opaque SAN and ABS), slight encrustation
Polyphenylene ether opaque brown-black sparking spot, PPO poor sliding spark behavior
PC+ABS blend opaque brownish sparking spot, restless sliding PCA spark, sparking pattern has a more metallic
sheen than with ABS
Polycarbonate opaque or brown-black sparking spot, encrustation, PC crystal-clear, transparent poor sliding spark behavior
Polyoxymethylene opal, opaque no sparking spot POM
Polymethylmethacrylate crystal-clear, transparent no sparking spot PMMA in certain circumstances
opaque
Polyethyleneterephthalate crystal-clear, transparent weak sparking spot, PET in certain circumstances restless sliding spark behavior
opaque
Polybutylenterephthalate opaque brownish, star-shaped sparking spot PBT
Polytetrafluorethylene opaque slightly brown sparking spot PTFE poor sliding spark behaviour
Polyphenylensulfide opaque black sparking spot PPS poor sliding spark behaviour
Silicon Caoutchouc opaque sparking spot with metallic sheen SK
46 Shape and brown carbonisation degree of the sparking spot depends on the sparking parameters. 47 With FR types containing halogens, all types of plastic show brownish sparking spots after sparking off

Manual: mIRoSpark - 28 - Copyright by IoSys/GUT
10 Electrode Adjustment
1. Switch the device off. 2. Lift up the small sealing ring from its slot and insert grub screw driver (SW0.9) and loose both M2 fixing screws for the electrodes. 3. Set the gap between the electrodes to 4.3 ± 0.1 mm using a slide gauge.
4. Adjust the flattened tips of the electrodes so that these are
plane with the plane of the face of the measuring head.
5. Tighten up the M2 grub screws for the electrodes again.
6. Press the sealing ring
into the slot again. Secure the seal if necessary with a drop of instant
glue.
11 Time and Date Setting
To enter a new Time and/or Date for example for correct Mini-Plotter printouts please do as follows: 1. Connect an external keyboard to the system. 2. Enter on the DOS-prompt level of the given sub-directory the command time or date, resp.. 3. Edit new date or time values and confirm/quit with <ENTER>.
12 Enter new Password
The system is secured with a password which activates the SSS2-program. In case the message: Program deactivated!… is displayed, please contact [email protected] to obtain the actual password for the device.
To edit once the new password please proceed as following: 1. Connect an external keyboard (PS/2) to the system. 2. Edit on the DOS-prompt level of the given sub-directory the command line edit
ini.net 3. Replace the 8 stars (*) in the first line of the ini.net with the new password (8 small
characters!). 4. Save the ini.net file (steps: ALT+F(ile), ALT+S(ave)) and close the Text-editor
(ALT+X(exit)). 5. Edit on the DOS-prompt level sss2.exe to start the program.

Manual: mIRoSpark - 29 - Copyright by IoSys/GUT
13 Data Exchange
13.1 Using PC-Link cable For communication with other computers and the update of software the MS-DOS communication system Interlink/Interserver is used for the communication between the device system and other computers (only working for computers equipped with Windows95® or Windows98®) for with the aid of the serial interface, a zero modem cable (Laplink-cable, 9p-SUB-D). Copy the interlnk.exe file (supplied by Floppy-Disk or e-mail) to a directory on the computer (e.g. your Desktop or Laptop computer) where you want to make the communication with the systems. The interlnk.exe file should be placed in the main root c:\ of the external computer and should get an entry in the config.sys file48 as following.
device=c:\interlnk.exe /com /noprinter /auto. 1. Connect a serial zero modem cable to the COM interfaces of the device (acts as Server) and the external
computer (acts as Client). 2. Switch off the integrated Mini-Plotter (optional feature) with the rocker switch locate aside before to avoid data
transfer malfunctions. 3. Press the <PC-Link> icon (or <F3>) in the KEYS-Menu to start data
exchange program (intersvr.exe). 4. Reboot the external computer (e.g. your Laptop or Desktop-PC) to
start the data exchange program. The drives of the measuring device (e.g. A:\, C:\) will appear now as additional drives (e.g. F:\, G:\) at your external computer which you can now access to copy files for updates or to copy stored spectra to your computer.
5. If no computer link could be established then restart the external computer again and press repeatedly <F8> to enter the Microsoft Window 98 Start Menu. Press <5> to select the Dos prompt level.
6. Power down the device to quit the PC-Link-program49.
Do not start a sparking while a cable is connected at the COM of the device. The electromagnetic radiation on the line could otherwise destroy the computer interface.
13.2 Using USB-Stick
For data exchange with other computers and software updates an USB stick can be connected to the USB port of the system. Before booting up50. the system the USB-Stick must inserted correctly into the USB slot. Access to the USB-stick can be done by the means of an external keyboard and by editing <d:> usually.
Sometimes there is no access to the USB-Stick at first time and the following error message51 is shown: Unzulässiger Datenträgertyp beim Lesen von Laufwerk D: Quit the error message by editiing <u> like (U)ebergehen and enter <d:> again.
48 Please recognize that there might be some config.xxx files on your computer in the root directory (usually c:\) depending on the operating system you may have for initial starts or the later change to MS-DOS. In such a case all files named config.xxx should be altered accordingly with the above mentioned line. Please make sure that also the lastdrive command is giving enough figures for the deviated disks on your computer when connecting to the mIRoSpark. Always place the new command at the end of the config.xxx files to avoid conflicts with other commands redirecting drives. Then either from the Windows Explorer or alternatively starting the MS-DOS mode, updates for the unit can be easily copied. 49 Rebooting the mIRoSpark is necessary, because the Touchscreen and Keyboard function is disabled while intersvr.exe is running. Therefore the <ALT+F4> command will not work. 50 The USB stick will be recognized by the MS-DOS system at time of booting only ! When the USB stick is disconnected while system operation and connected again then it will not recognize the USB stick again. The unit must be restarted again. 51 German based MS-DOS is used.
!
!

Manual: mIRoSpark - 30 - Copyright by IoSys/GUT
14 Trouble shooting
The device consists of different function groups. These are in part integrated in the housing in modular fashion. In case that the described elimination procedures of the manual have not been successful, a failure can have been occurred in the function group of the pulse generator or in the control electronics of the PC. In that case the following instruction is listed to locate the error and to eliminate a simple defect on your own. Computer and display is starting and green LED at the SSS2-measuring pistol is shining: 1. Start the Unit test program in the Keys-Display with <F2>. 2. Check the Generator <F5> in the test program at first. While
pressing the pistol trigger, high current spark discharges should appear. In this mode the sliding spark generator, consisting of the Ignition- and Energy-Board as well as the control electronics located on the Interface-Board, are tested together. In case of no sparking, operate the listed menu function step by step as described below (see: The Unit Test Program).
Computer or display is not starting: 1. Switch the device off and remove the main power cable at the
back panel. 2. Unscrew the two upper screws located inside the black rubber feet of the device and take the top cover plate52
off. 3. Check the fixed positions of the marked connectors at the computer module.
52 If additionally the bottom cover plate must be removed, disconnect the cable for the mounted ventilator. Please take care of correct connection again (red/red and black/black)!

Manual: mIRoSpark - 31 - Copyright by IoSys/GUT
Green LED at the SSS2-measuring pistol is not shining: 1. Firstly, check the fuse on the power-supply and if necessary insert a new one
of the same type (Europe: 200mA; USA, Japan: 630 mA, medium). 2. In case of still remaining error, remove the right front panel. 3. Disconnect the Mini-Plotter cables if integrated. Take care when reassembling
the connections again. Look exactly at pining and cable markings! 4. Remove the white isolation paper and then turn down the red the left lever
and pull out the left Ignition board to 2/3 out from its guide bars. 5. Check the fixed positions of the connectors: Pistol-, red Spark(+) and
black Spark(-)-plug. 6. Push the board into the device and turn up the red lever so that the circuit
board is fixed again inside its socket at the rear panel. 7. Plug in the main power cable and switch on the device again.

Manual: mIRoSpark - 32 - Copyright by IoSys/GUT
14.1 The Unit Test Program
CCD-Interface board NIR-board Ignition-board Energy board
Test function Defect/Elimination F1 (SSS2-Start/Run circuit): Pressing the SSS2-pistol trigger, the status on the display should switch from OFF to ON. At the same time a distinct relay clicking at the Ignition-Board should be heard. Status remains OFF Change53 the part OC-1 on the CCD-Interface-Board Status changes to ON but Change the component part OC-3 on the CCD-Board no relay clicking to hear F2 (Keyboard circuit): While pressing the <F2>, a distinct relay clicking at the Interface-Board should be heard. No relay clicking to hear Check connection on the CCD-Interface-Board F3 (Ignition-Board): While pressing the pistol trigger, weak sparks (high voltage ignition sparks) should appear. No ignition sparks Check the Jumper connection on the Ignition-Board Still existing defect Change the parts IC-1 & IC-2 on the Ignition-Board and change the component part OC-2 on the CCD-Board F4 (Energy-Board): While pressing the pistol trigger, weak “high frequency sound” at the Energy-Board should be heard. No weak transformer sound to hear Check the main fuse at the back panel and if necessary
insert a new one of the same type (5A, fast, 5x20mm) Still existing defect Check the fuse in the black holder on the Energy board: If broken then complete changing of this fuse (5A/fast) and both 100mA fuses, both IC-6 and both Mosfet-2 at the screw mounted socket on the Energy-Board F5 (Sliding Spark Generator): While pressing the pistol trigger, high current spark discharges should appear. In this mode the sliding spark generator, consisting of the Ignition- and Energy-Board as well as the control electronics located on the Interface-Board are tested together. F6 (mIRo-Start/Run circuit): Pressing the mIRo-pistol trigger, the status on the display should switch from OFF to ON. At the same time a relay clicking at the NIR-Interface-Board should be heard. Status remains OFF Change the part OC-4 on the NIR-Interface-Board Status changes to ON but Change the Mini-Relay on the NIR-Board no relay clicking to hear F7 (Mini-Plotter): When pressing the <F7>, the Mini-Plotter should print out three “Test of Mini-Plotter” lines. No printout is coming Turn on the rocker switch on. Check if the paper roll is not empty Open the Mini-plotter front plate and check both cables.
53 Remove the bottom cover plate carefully by solving the two srews inside the black rubber feet and disconnect the cable for the mounted ventilator. Remove the OC- or IC-component parts from their sockets by the means of a screw driver and place marked new ones. Take care of the right IC-Pin orientation.
OC1
100 mA Fuse
OC3
Mini-Relay
OC2
OC4
IC2
MosFet-2
100 mA Fuse
IC1
IC6 IC6
MosFet-2
NIR-Board