operating mechanism and set pair analysis model of a sustainable water resources system
TRANSCRIPT

RESEARCH ARTICLE
Operating mechanism and set pair analysis model of asustainable water resources system
Chaoyang DU1,2, Jingjie YU (✉)1, Huaping ZHONG3, Dandan WANG1,2
1 Institute of Geography Science and Natural Resources Research, Chinese Academy of Sciences, Beijing 100101, China2 University of Chinese Academy of Sciences, Beijing 100049, China
3 Nanjing Hydraulic Research Institute, Nanjing 210029, China
© Higher Education Press and Springer-Verlag Berlin Heidelberg 2014
Abstract There is no alternative to the world’s waterresources, and their increasing scarcity is making itdifficult to meet the world population’s water needs. Thispaper presents a sustainable water resources system(SWRS) and analyzes the operating mechanism thatmakes it possible to evaluate the status of such a system.A SWRS can be described as a complex coupling systemthat integrates water resources, social, economic andecological systems into a whole. The SWRS’s operatingmechanism is composed of dynamic, resistance andcoordination components, and it interacts with and controlsthe system’s evolution process. The study introduces a newapproach, set pair analysis theory, to measure the state of aSWRS, and an evaluation index system is establishedusing the subsystems and operating mechanism of aSWRS. The evaluation index system is separated into threelevels (goal level, criteria level and index level) and dividesthe index standard into five grades. An evaluation model ofthe SWRS based on set pair analysis theory is constructed,and an example of SWRS evaluation in Shanghai ispresented. The connection degrees of the index in the threelevels are calculated, and the connection degree of the goalindex is calculated to be 0.342, which classifies the city’sSWRS condition as grade 2. The sustainable use of waterresources in the region is determined to be at a relativelyadequate level that meets the requirements of sustainabledevelopment.
Keywords sustainable water resources system, operatingmechanism, set pair analysis model, Shanghai
1 Introduction
Population growth and rapid economic development havecaused a sharp increase in the demand for water over thepast 100 years [1–4], and intensified human activities andabnormal climate change have worsened the state of theworld’s water resources [2,5]. A series of water problemscaused by water scarcity, water pollution, ecologicaldeterioration, groundwater depletion and soil erosionhave become increasingly prominent and have restrictedthe sustainable use of water resources. The problemsassociated with water resources sustainability have alsobecome increasingly complex and diverse.Water resources sustainability has been a topic of
discussion since the concept of sustainable developmentwas first introduced in the World Commission onEnvironment and Development report [6]. Feng consideredwater resources systems to be composed of a number ofinterrelated and interacting water resources engineeringmanagement and technical units [7]. Water resourcespossess not only natural attributes but also social,economic and ecological attributes, among others. Awater resources system is incorporated into a morecomplex system produced by the interaction and couplingof natural ecosystems and socio-economic systems [8].Loucks defined sustainable water resources systems asthose that not only maintain their ecological and hydro-logical intergrity, aslo meet the demands of society andeconomy, currently and in the future. [9]. However, theconcept of sustainable development remains somewhatnebulous and lacks the necessary precision to allow for itsdirect practical application. Many scholars have begun tostudy the sustainability of water resources system from theperspectives of sustainability criteria, quantization meth-ods, sustainable management, policy and regulation,among others [10–12]. The book “Sustainable Criteriafor Water Resources Systems” was written to advance this
Received March 29, 2013; accepted December 11, 2013
E-mail: [email protected]
Front. Environ. Sci. Eng.DOI 10.1007/s11783-014-0642-4
conversation by offering possible solutions for how theconcept of sustainable development should be employedwith respect to water resources systems [13]. To evaluatethe sustainability of a water resources system, an object-oriented system dynamics approach was used to develop amodel and simulate the system, capturing the dynamiccharacter of the main elements affecting the water supplyand demand in the study area [14]. The sustainabilitymethods and models for water resources system have alsobeen explored to measure and evaluate water resourcessustainable utilization. The reliability, resilience andvulnerability of water resources system have beenconsidered in a sustainability index, which is used toquantify and describe the sustainability of such a system[12,15–17]. Yang designed an evaluation model using acombination of entropy theory and the projection pursuitmethod to evaluate the sustainable development of waterresources [18]. The evaluation indicators model is anotherpopular tool used to evaluate the sustainability status ofwater resources systems. Many scholars from differentfields are currently using a variety of methods to study thesustainable use of water resources.A sustainable system generally provides for the
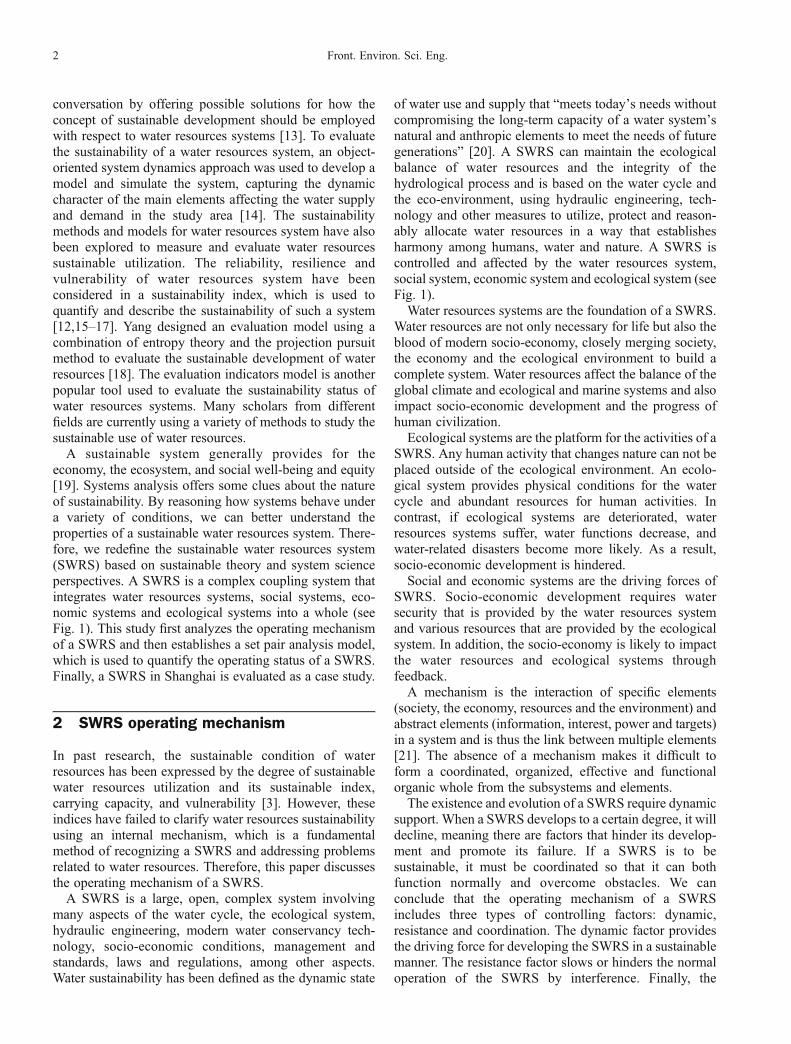
economy, the ecosystem, and social well-being and equity[19]. Systems analysis offers some clues about the natureof sustainability. By reasoning how systems behave undera variety of conditions, we can better understand theproperties of a sustainable water resources system. There-fore, we redefine the sustainable water resources system(SWRS) based on sustainable theory and system scienceperspectives. A SWRS is a complex coupling system thatintegrates water resources systems, social systems, eco-nomic systems and ecological systems into a whole (seeFig. 1). This study first analyzes the operating mechanismof a SWRS and then establishes a set pair analysis model,which is used to quantify the operating status of a SWRS.Finally, a SWRS in Shanghai is evaluated as a case study.
2 SWRS operating mechanism
In past research, the sustainable condition of waterresources has been expressed by the degree of sustainablewater resources utilization and its sustainable index,carrying capacity, and vulnerability [3]. However, theseindices have failed to clarify water resources sustainabilityusing an internal mechanism, which is a fundamentalmethod of recognizing a SWRS and addressing problemsrelated to water resources. Therefore, this paper discussesthe operating mechanism of a SWRS.A SWRS is a large, open, complex system involving
many aspects of the water cycle, the ecological system,hydraulic engineering, modern water conservancy tech-nology, socio-economic conditions, management andstandards, laws and regulations, among other aspects.Water sustainability has been defined as the dynamic state
of water use and supply that “meets today’s needs withoutcompromising the long-term capacity of a water system’snatural and anthropic elements to meet the needs of futuregenerations” [20]. A SWRS can maintain the ecologicalbalance of water resources and the integrity of thehydrological process and is based on the water cycle andthe eco-environment, using hydraulic engineering, tech-nology and other measures to utilize, protect and reason-ably allocate water resources in a way that establishesharmony among humans, water and nature. A SWRS iscontrolled and affected by the water resources system,social system, economic system and ecological system (seeFig. 1).Water resources systems are the foundation of a SWRS.
Water resources are not only necessary for life but also theblood of modern socio-economy, closely merging society,the economy and the ecological environment to build acomplete system. Water resources affect the balance of theglobal climate and ecological and marine systems and alsoimpact socio-economic development and the progress ofhuman civilization.Ecological systems are the platform for the activities of a
SWRS. Any human activity that changes nature can not beplaced outside of the ecological environment. An ecolo-gical system provides physical conditions for the watercycle and abundant resources for human activities. Incontrast, if ecological systems are deteriorated, waterresources systems suffer, water functions decrease, andwater-related disasters become more likely. As a result,socio-economic development is hindered.Social and economic systems are the driving forces of
SWRS. Socio-economic development requires watersecurity that is provided by the water resources systemand various resources that are provided by the ecologicalsystem. In addition, the socio-economy is likely to impactthe water resources and ecological systems throughfeedback.A mechanism is the interaction of specific elements
(society, the economy, resources and the environment) andabstract elements (information, interest, power and targets)in a system and is thus the link between multiple elements[21]. The absence of a mechanism makes it difficult toform a coordinated, organized, effective and functionalorganic whole from the subsystems and elements.The existence and evolution of a SWRS require dynamic
support. When a SWRS develops to a certain degree, it willdecline, meaning there are factors that hinder its develop-ment and promote its failure. If a SWRS is to besustainable, it must be coordinated so that it can bothfunction normally and overcome obstacles. We canconclude that the operating mechanism of a SWRSincludes three types of controlling factors: dynamic,resistance and coordination. The dynamic factor providesthe driving force for developing the SWRS in a sustainablemanner. The resistance factor slows or hinders the normaloperation of the SWRS by interference. Finally, the
2 Front. Environ. Sci. Eng.
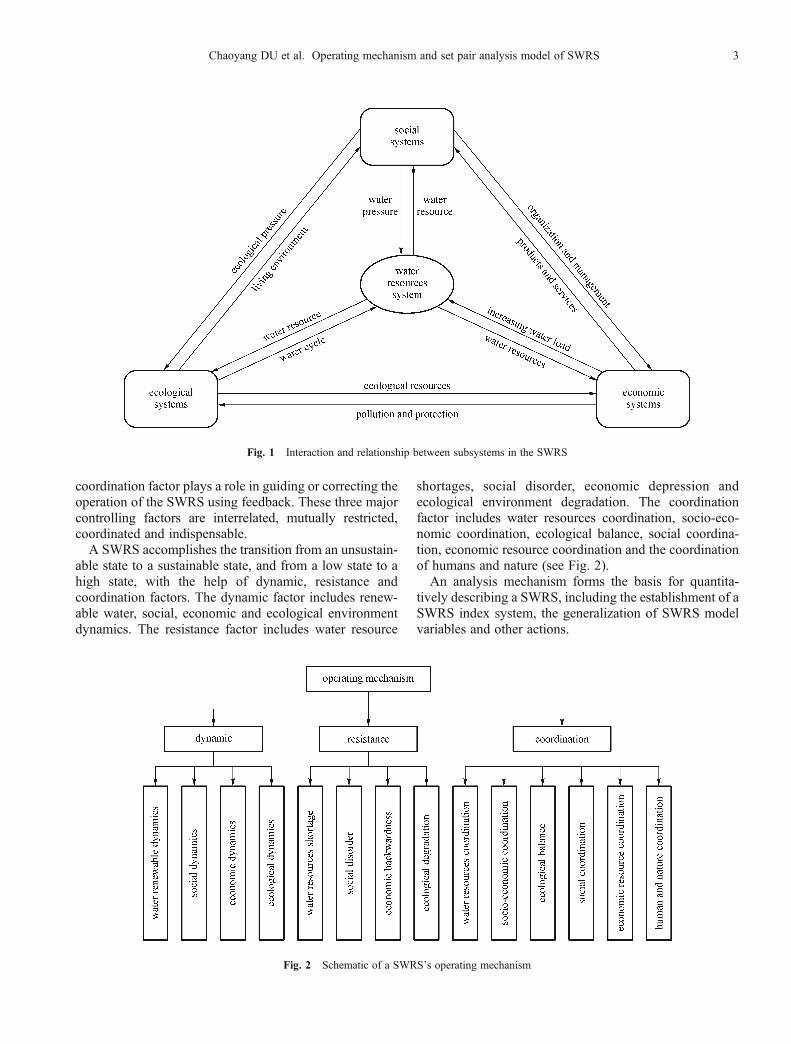
coordination factor plays a role in guiding or correcting theoperation of the SWRS using feedback. These three majorcontrolling factors are interrelated, mutually restricted,coordinated and indispensable.A SWRS accomplishes the transition from an unsustain-
able state to a sustainable state, and from a low state to ahigh state, with the help of dynamic, resistance andcoordination factors. The dynamic factor includes renew-able water, social, economic and ecological environmentdynamics. The resistance factor includes water resource
shortages, social disorder, economic depression andecological environment degradation. The coordinationfactor includes water resources coordination, socio-eco-nomic coordination, ecological balance, social coordina-tion, economic resource coordination and the coordinationof humans and nature (see Fig. 2).An analysis mechanism forms the basis for quantita-
tively describing a SWRS, including the establishment of aSWRS index system, the generalization of SWRS modelvariables and other actions.
Fig. 1 Interaction and relationship between subsystems in the SWRS
Fig. 2 Schematic of a SWRS’s operating mechanism
Chaoyang DU et al. Operating mechanism and set pair analysis model of SWRS 3
3 Study area
Shanghai is the largest city by population in China. It is oneof the four province-level municipalities in the China, witha total population of over 23 million in 2010. Shanghai is aglobal city, a major financial center and the busiestcontainer port in the world, and it influences commerce,culture, finance, media, fashion, technology, and transport.The city sits at the mouth of the Yangtze River in themiddle portion of the Chinese coast, extending betweenlatitudes 30°40′–31°53′ N and longitudes 120°51′–122°12′E, and it is bordered on the north and west by JiangsuProvince, on the south by Zhejiang Province, and on theeast by the East China Sea. The vast majority of Shanghai's6340.5 km2 land area is flat, but the city has many rivers,canals, streams and lakes.Shanghai has a humid subtropical climate and experi-
ences four distinct seasons. “Winters are chilly and damp,while summers are hot and humid, with an average of 8.7days exceeding 35°C annually”. The city averages 4.2°C inJanuary and 27.9°C in July, for an annual meantemperature of 16.1°C. The average annual precipitationis 1048–1138 mm within 129–136 days of the year. A totalof 60% of the annual rainfall occurs intensively from Mayto September. The spatial distribution of precipitationappears to show a decreasing trend from the south to thenorth in Shanghai, and the average annual evaporation is1256–1465 mm. According to average data collected overmany years, Shanghai’s local surface runoff is 24.15� 108
m3. The water outflow from Taihu is 106.6 � 108 m3, andthe amount of tide water resources is 410 � 108 m3.Though local water resources are very limited, the area’stotal water resources are considerable due to abundantcross-border water resources.Shanghai’s urban underlying surface, hydro-meteorolo-
gical elements, ecological patterns and human lifestyleshave undergone significant changes due to its growingurbanization. The problems associated with a massiveexploitation of water resources, serious water pollution, adense population, water demand increase and ecologicaldegradation are hindering the city’s development.However, a small regional area, dense population,
developed industries and limited resources have forcedShanghai’s socio-economic development to depend onwater resources to a very great extent. The Shanghai studyarea is appropriate for investigating the water resourcessystem sustainability of a metropolis.
4 SWRS set pair analysis model
Many models and methods exist to quantitatively describeproblems associated with sustainable water resources,including the principal component method, the fuzzy
evaluation method, the artificial neural network methodand the matter element method [22–25]. The status andgrade standard of a SWRS have uncertain and fuzzyfeatures. Specific index values are used as gradingstandards for a SWRS’s existing index system. Forexample, given an index value of grade 1 for an industrywater reuse rate of 90%, if the measured value of this indexfor a SWRS is 89%, the index’s evaluation grade is givenas grade 2, but if the measured value is 91%, the evaluationgrade is given as grade 1. Obviously, the evaluationstandard is not objective and ignores the identity,discrepancy and contradistinction of each evaluationgrade. To create a more objective SWRS evaluationsystem, we adopt the set pair analysis method to evaluateregional SWRS.
4.1 Principle of set pair analysis theory
The principle of set pair analysis assumes that set A1 andset A2 are relative and constructs a set pair H = (A1, A2); nterms in A1 = (a1, a2… an) and in A2 = (b1, b2, …, bn) areused to show the characteristics of set A1 and set A2,respectively. s is the number of identical terms in a givencharacteristic, p is the number of contradictory terms in thecharacteristic, and f = n – s – p is the number of discrepantterms in the characteristic [26].
�A –B ¼ s
nþ f
niþ p
nj, (1)
Note that a = s/n, b = f/n, and c = p/n, and thus, Eq. (2) canbe written as
�A –B ¼ aþ biþ cj, (2)
where μA-B2[ – 1,1] is the connection degree of H = (A1,A2); a, b, c2[0,1] are the identity degree, discrepancydegree and contradistinction degree, respectively; a + b +c = 1; i is the uncertainty coefficient of the discrepancy,which has different values in [ – 1,1] and can sometimes bea marker of discrepancy only; and j is the uncertaintycoefficient of the contradistinction degree, which has avalue of – 1 or can be considered a marker of contra-distinction only in some cases.Because the objects and requirements of a given study
differ, a multi-element connection degree can be obtainedafter bi is further expanded in Eq. (2). The n elementconnection degree can be obtained as
�A –B ¼ aþ b1i1 þ b2i2 þ � � � þ bn – 2in – 2 þ cj, (3)
where a+ b1 + b2+…+ bn – 2+ c = 1; b1, b2 … bn – 2 arethe components of the discrepancy degree, which are alsodefined as the different grades of the discrepancy degree,such as mild, moderate or severe discrepancy; and i1, i2 …in – 2 are the uncertainty component coefficients of thediscrepancy degree.
4 Front. Environ. Sci. Eng.
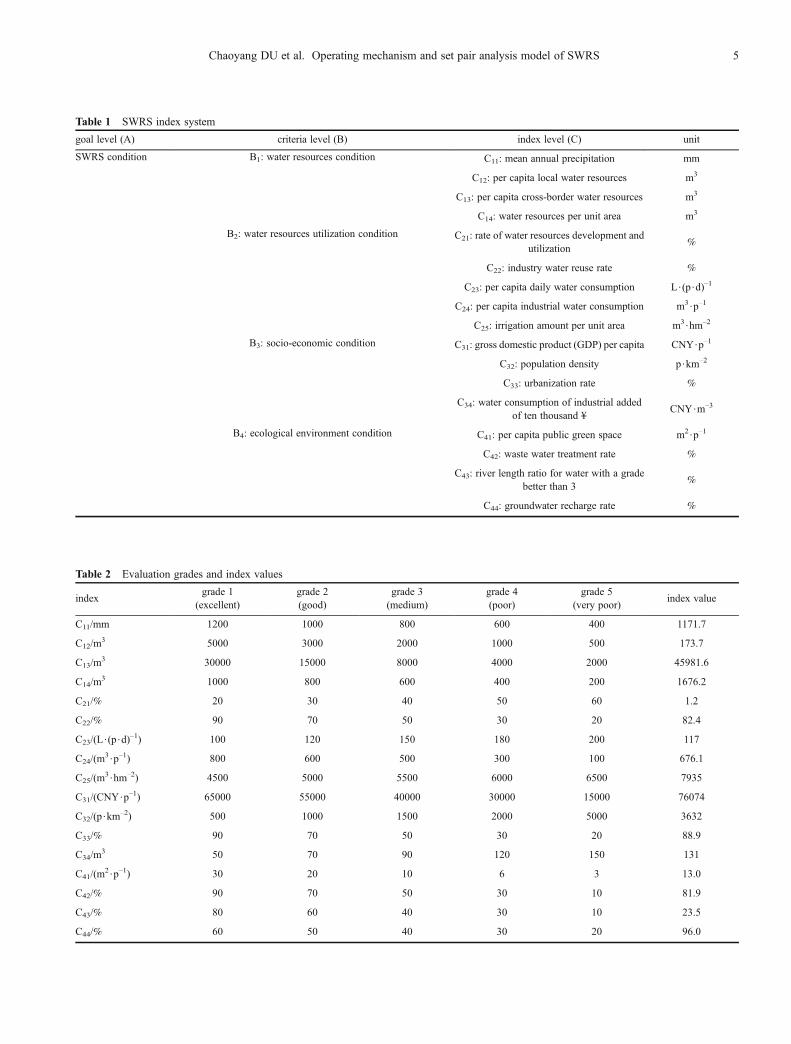
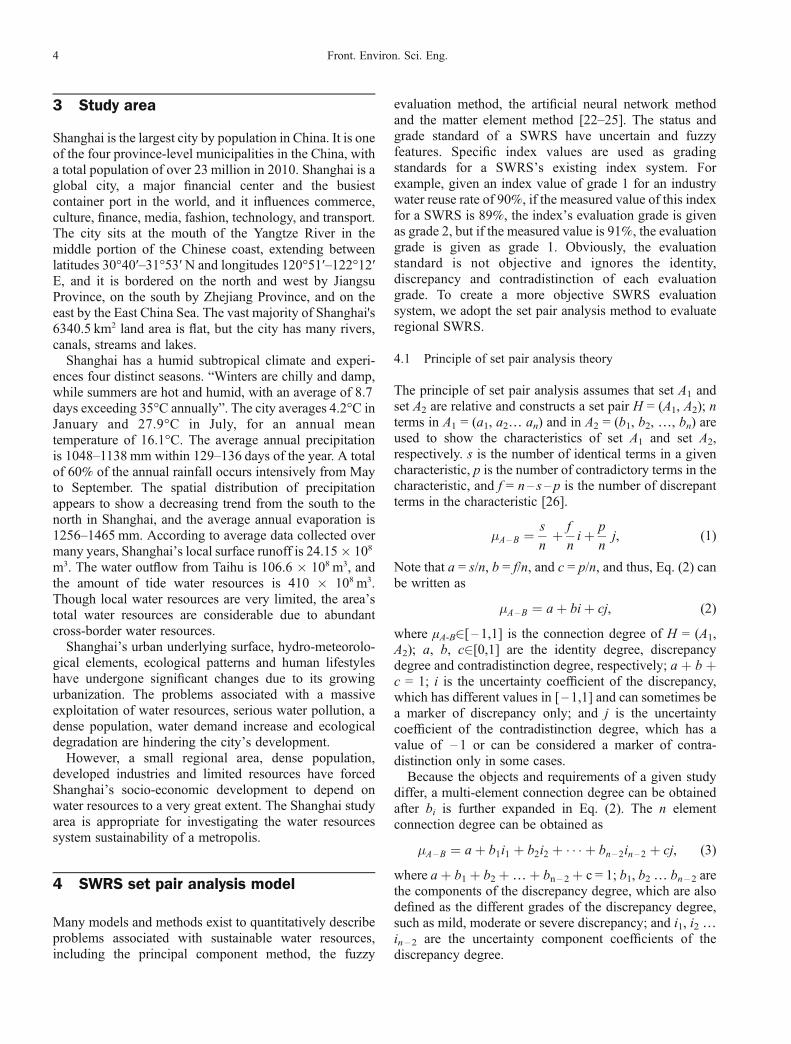
Table 2 Evaluation grades and index values
indexgrade 1
(excellent)grade 2(good)
grade 3(medium)
grade 4(poor)
grade 5(very poor)
index value
C11/mm 1200 1000 800 600 400 1171.7
C12/m3 5000 3000 2000 1000 500 173.7
C13/m3 30000 15000 8000 4000 2000 45981.6
C14/m3 1000 800 600 400 200 1676.2
C21/% 20 30 40 50 60 1.2
C22/% 90 70 50 30 20 82.4
C23/(L$(p$d)–1) 100 120 150 180 200 117
C24/(m3$p–1) 800 600 500 300 100 676.1
C25/(m3$hm–2) 4500 5000 5500 6000 6500 7935
C31/(CNY$p–1) 65000 55000 40000 30000 15000 76074
C32/(p$km–2) 500 1000 1500 2000 5000 3632
C33/% 90 70 50 30 20 88.9
C34/m3 50 70 90 120 150 131
C41/(m2$p–1) 30 20 10 6 3 13.0
C42/% 90 70 50 30 10 81.9
C43/% 80 60 40 30 10 23.5
C44/% 60 50 40 30 20 96.0
Table 1 SWRS index system
goal level (A) criteria level (B) index level (C) unit
SWRS condition B1: water resources condition C11: mean annual precipitation mm
C12: per capita local water resources m3
C13: per capita cross-border water resources m3
C14: water resources per unit area m3
B2: water resources utilization condition C21: rate of water resources development andutilization
%
C22: industry water reuse rate %
C23: per capita daily water consumption L$(p$d)–1
C24: per capita industrial water consumption m3$p–1
C25: irrigation amount per unit area m3$hm–2
B3: socio-economic condition C31: gross domestic product (GDP) per capita CNY$p–1
C32: population density p$km–2
C33: urbanization rate %
C34: water consumption of industrial addedof ten thousand ¥
CNY$m–3
B4: ecological environment condition C41: per capita public green space m2$p–1
C42: waste water treatment rate %
C43: river length ratio for water with a gradebetter than 3
%
C44: groundwater recharge rate %
Chaoyang DU et al. Operating mechanism and set pair analysis model of SWRS 5

4.2 SWRS set pair analysis model
The evaluation of SWRS using set pair analysis theoryutilizes a set pair constructed using index values and thestandard grades of various indices. The set pair iscalculated and analyzed using the identity, discrepancyand contradistinction degree. bi in Eq. (2) must beexpanded according to the index system’s evaluationgrade.
4.2.1 Establishment of the index system
According to the SWRS operating mechanism, thedynamic controlling factors of a SWRS for Shanghaiinclude abundant rainfall, renewable water resources,strong social awareness of water conservation andnecessary conservation measures, low water consumptionfor industrial output and urban ecological improvement.The Shanghai SWRS’s resistance controlling factorsinclude water pollution, various social water demands,industrial water consumption, unreasonable groundwaterexploitation and increased urban-greening water. Finally,the SWRS’s coordination controlling factors consist ofwater pollution treatment, water conservancy projectconstruction, industrial structural upgrades, waterresources management and improvements to water useefficiency. The three controlling factors are a guide to andbasis for choosing quantitative indices and constructing anevaluation index system for the SWRS. Because a SWRSis a multi-level and multi-system creation, its indexsystems should be constructed on the basis of the waterresources, socio-economic and ecological systems. Theindex system is divided into three levels: the goal level, thecriteria level and the index level [27,28]. The SWRS’scondition is the goal level. According to the operatingmechanism of the Shanghai SWRS, the criteria levelincludes the water resources condition, the water resourcesutilization condition, the socio-economic condition and theecological condition. The 17 indices in the index levelcorrespond to the criteria level indices (see Table 1).Considering the availability of data, we chose the year
2010 as the study period. The data for all indices are takenfrom the Shanghai Water Resources Bulletin (2010) andthe Shanghai Statistical Yearbook (2011). The values ofsome indices (C11, C22, C23, C24, C25, C31, C34, C41, C42
and C43) can be obtained directly from the data, but thevalues of the other indexes are obtained indirectly throughthe calculation of relative index values.The set pair analysis method requires dividing the index
grades to construct set pairs. To clearly describe the statusof a SWRS, we divide the evaluation standard into fivegrades, 1, 2, 3, 4, and 5, which correspond to “excellent”,“good”, “medium”, “poor”, and “very poor”, respectively(see Table 2). The five grade values are the key thresholdvalues that result from fully considering the actual situation
in a study area. For example, when considering C11, grade1 is 1200 mm, which is the maximum mean annualprecipitation, and Grade 5 is 400 mm, which is thedemarcation point between semi-humid and semi-aridregions.Due to the uncertain and fuzzy features of a threshold
value in an index-grading standard, a new method ofcalculating the connection degree μl is proposed based onfuzzy analysis.For the index l (l = 1, 2,…, or k), a smaller value of xl
improves the state of the index l. The connection degree μlbetween the sample index value xl and its grade l can bedefined as follows [29]:
� ¼
1þ 0i1 þ � � � þ 0ik – 2 þ 0j, xl£s1s2 – xls2 – s1
þ xl – s1s2 – s1
i1 þ � � � þ 0ik – 2 þ 0j, s1<xl£s2
� � � � � � � � �0þ 0i1 þ � � � þ sk – xl
sk – sk – 1ik – 2 þ
xl – sk – 1sk – sk – 1
j, sk – 1<xl£sk
0þ 0i1 þ � � � þ 0ik – 2 þ 1j, xl > sk
,
8>>>>>>>>><
>>>>>>>>>:
(4)
where s1£s2£ � � �£sk – 1£sk .However, for the index l (l = 1, 2,…, or k), a larger value
of xl improves the state of the index l. The connectiondegree μl between the sample index value xl and its grade lcan then be defined as follows:
� ¼
1þ 0i1 þ � � � þ 0ik – 2 þ 0j, xl³s1xl – s2s1 – s2
þ s1 – xls1 – s2
i1 þ � � � þ 0ik – 2 þ 0j, s1 > xl³s2
� � � � � � � � �0þ 0i1 þ � � � þ xl – sk
sk – 1 – skik – 2 þ
sk – 1 – xlsk – 1 – sk
j, sk – 1 > xl³sk
0þ 0i1 þ � � � þ 0ik – 2 þ 1j, xl<sk
,
8>>>>>>>>><
>>>>>>>>>:
(5)
where s1³s2³ � � �³sk – 1³sk .
4.2.2 Index weight determination
The effects of various indices differ in the index system.Some effects are notable, but others are weak, so differentweights must be given to each index. The AnalyticHierarchy Process (AHP) is adopted to construct acomparison judgment matrix for each level and todetermine index weight [30]. Each comparison judgmentmatrix meets the requirements of a consistency check.
6 Front. Environ. Sci. Eng.
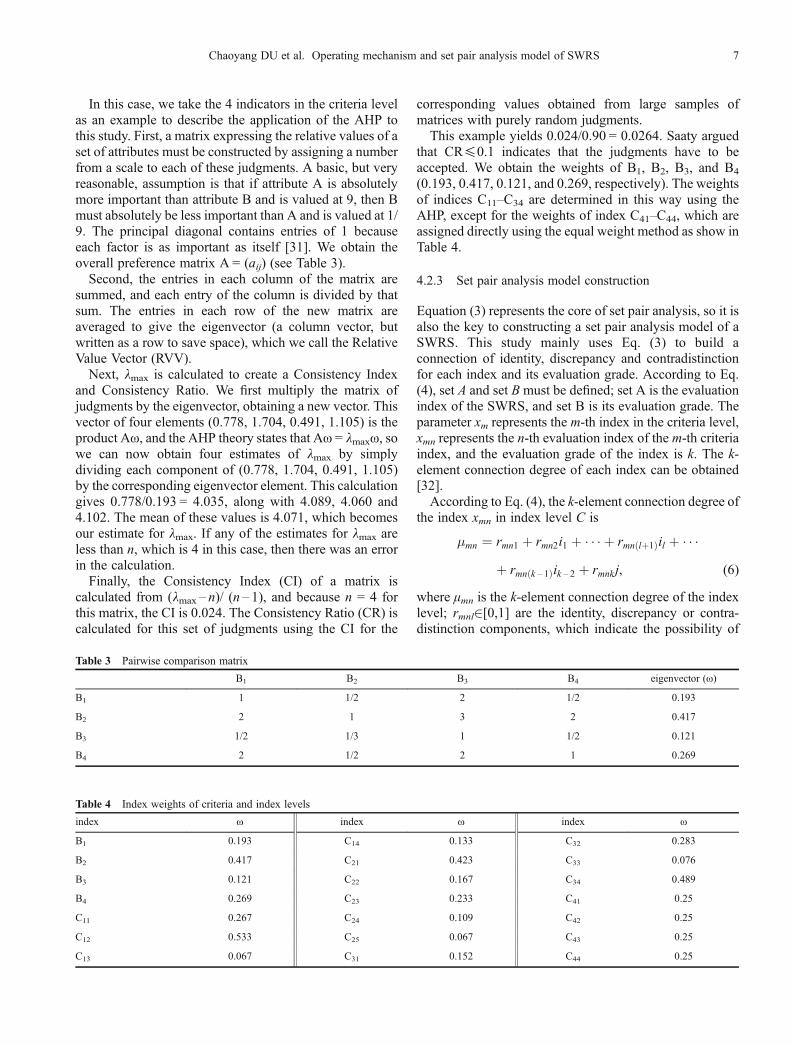
In this case, we take the 4 indicators in the criteria levelas an example to describe the application of the AHP tothis study. First, a matrix expressing the relative values of aset of attributes must be constructed by assigning a numberfrom a scale to each of these judgments. A basic, but veryreasonable, assumption is that if attribute A is absolutelymore important than attribute B and is valued at 9, then Bmust absolutely be less important than A and is valued at 1/9. The principal diagonal contains entries of 1 becauseeach factor is as important as itself [31]. We obtain theoverall preference matrix A = (aij) (see Table 3).Second, the entries in each column of the matrix are
summed, and each entry of the column is divided by thatsum. The entries in each row of the new matrix areaveraged to give the eigenvector (a column vector, butwritten as a row to save space), which we call the RelativeValue Vector (RVV).Next, lmax is calculated to create a Consistency Index
and Consistency Ratio. We first multiply the matrix ofjudgments by the eigenvector, obtaining a new vector. Thisvector of four elements (0.778, 1.704, 0.491, 1.105) is theproduct Aω, and the AHP theory states that Aω = lmaxω, sowe can now obtain four estimates of lmax by simplydividing each component of (0.778, 1.704, 0.491, 1.105)by the corresponding eigenvector element. This calculationgives 0.778/0.193 = 4.035, along with 4.089, 4.060 and4.102. The mean of these values is 4.071, which becomesour estimate for lmax. If any of the estimates for lmax areless than n, which is 4 in this case, then there was an errorin the calculation.Finally, the Consistency Index (CI) of a matrix is
calculated from (lmax – n)/ (n – 1), and because n = 4 forthis matrix, the CI is 0.024. The Consistency Ratio (CR) iscalculated for this set of judgments using the CI for the
corresponding values obtained from large samples ofmatrices with purely random judgments.This example yields 0.024/0.90 = 0.0264. Saaty argued
that CR£0.1 indicates that the judgments have to beaccepted. We obtain the weights of B1, B2, B3, and B4
(0.193, 0.417, 0.121, and 0.269, respectively). The weightsof indices C11–C34 are determined in this way using theAHP, except for the weights of index C41–C44, which areassigned directly using the equal weight method as show inTable 4.
4.2.3 Set pair analysis model construction
Equation (3) represents the core of set pair analysis, so it isalso the key to constructing a set pair analysis model of aSWRS. This study mainly uses Eq. (3) to build aconnection of identity, discrepancy and contradistinctionfor each index and its evaluation grade. According to Eq.(4), set A and set B must be defined; set A is the evaluationindex of the SWRS, and set B is its evaluation grade. Theparameter xm represents the m-th index in the criteria level,xmn represents the n-th evaluation index of the m-th criteriaindex, and the evaluation grade of the index is k. The k-element connection degree of each index can be obtained[32].According to Eq. (4), the k-element connection degree of
the index xmn in index level C is
�mn ¼ rmn1 þ rmn2i1 þ � � � þ rmnðlþ1Þil þ � � �þ rmnðk – 1Þik – 2 þ rmnkj, (6)
where μmn is the k-element connection degree of the indexlevel; rmnl2[0,1] are the identity, discrepancy or contra-distinction components, which indicate the possibility of
Table 3 Pairwise comparison matrix
B1 B2 B3 B4 eigenvector (ω)
B1 1 1/2 2 1/2 0.193
B2 2 1 3 2 0.417
B3 1/2 1/3 1 1/2 0.121
B4 2 1/2 2 1 0.269
Table 4 Index weights of criteria and index levels
index ω index ω index ω
B1 0.193 C14 0.133 C32 0.283
B2 0.417 C21 0.423 C33 0.076
B3 0.121 C22 0.167 C34 0.489
B4 0.269 C23 0.233 C41 0.25
C11 0.267 C24 0.109 C42 0.25
C12 0.533 C25 0.067 C43 0.25
C13 0.067 C31 0.152 C44 0.25
Chaoyang DU et al. Operating mechanism and set pair analysis model of SWRS 7
xmn belonging to the (l – 1) – th grade; and i1, i2,…,ik – 2 arethe coefficients of the discrepancy degree between theindices and the standards from grade 2 to grade k – 1.Similarly, the k-element connection degree of index xn in
criteria level B is
�m ¼ rm1 þ rm2i1 þ � � � þ rmðlþ1Þil þ � � �þ rmðk – 1Þik – 2 þ rmkj, (7)
where μm is the k-element connection degree in the criterialevel; rml2[0,1] are the identity, discrepancy or contra-distinction components, which indicate the possibility of xnbelonging to the (l – 1)-th grade; and rml = Σωmn rmnl. Dueto the uncertainty of the indices in the index level, theindices in the criteria level are also uncertain.Likewise, the k-element connection degree of index x in
goal level A is
� ¼ r1 þ r2i1 þ � � � þ rðlþ1Þil þ � � � þ rk – 1ik – 2 þ rkj, (8)
where μ is the k-element connection degree in the goallevel; rl2[0,1] are the identity, discrepancy or contra-distinction components; and rl = Σωmrml.Given μ2[ – 1,1], according to the principle of equal
division, the interval [ – 1,1] is divided into k – 1 equalsubintervals. The values for j, ik – 2, ik – 3,…, il,…, i2, i1 aretaken at the points of division from left to right, namely, j =
– 1, il = 1 – 2l/(k – 2). After the values of r, i, and j aregiven, the k-element connection degrees of the indices ineach level can be obtained.The interval [ – 1, 1] is then divided into k equal
subintervals that correspond to grades 1 – k from right toleft. In this way, the evaluation grade of the sustainablewater resources system can be calculated. If the value of μis closer to 1, the grade will be better; however, if the valueof μ is closer to – 1, the grade will be worse.
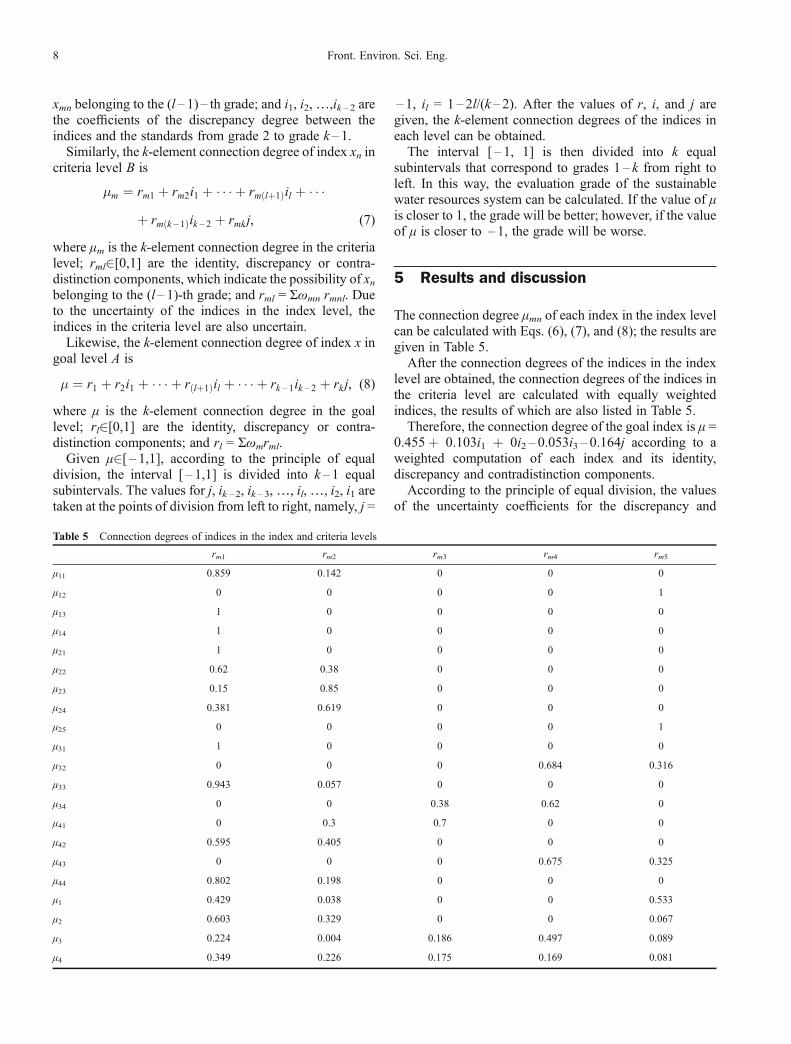
5 Results and discussion
The connection degree μmn of each index in the index levelcan be calculated with Eqs. (6), (7), and (8); the results aregiven in Table 5.After the connection degrees of the indices in the index
level are obtained, the connection degrees of the indices inthe criteria level are calculated with equally weightedindices, the results of which are also listed in Table 5.Therefore, the connection degree of the goal index is μ =
0.455+ 0.103i1 + 0i2 – 0.053i3 – 0.164j according to aweighted computation of each index and its identity,discrepancy and contradistinction components.According to the principle of equal division, the values
of the uncertainty coefficients for the discrepancy and
Table 5 Connection degrees of indices in the index and criteria levels
rm1 rm2 rm3 rm4 rm5
μ11 0.859 0.142 0 0 0
μ12 0 0 0 0 1
μ13 1 0 0 0 0
μ14 1 0 0 0 0
μ21 1 0 0 0 0
μ22 0.62 0.38 0 0 0
μ23 0.15 0.85 0 0 0
μ24 0.381 0.619 0 0 0
μ25 0 0 0 0 1
μ31 1 0 0 0 0
μ32 0 0 0 0.684 0.316
μ33 0.943 0.057 0 0 0
μ34 0 0 0.38 0.62 0
μ41 0 0.3 0.7 0 0
μ42 0.595 0.405 0 0 0
μ43 0 0 0 0.675 0.325
μ44 0.802 0.198 0 0 0
μ1 0.429 0.038 0 0 0.533
μ2 0.603 0.329 0 0 0.067
μ3 0.224 0.004 0.186 0.497 0.089
μ4 0.349 0.226 0.175 0.169 0.081
8 Front. Environ. Sci. Eng.
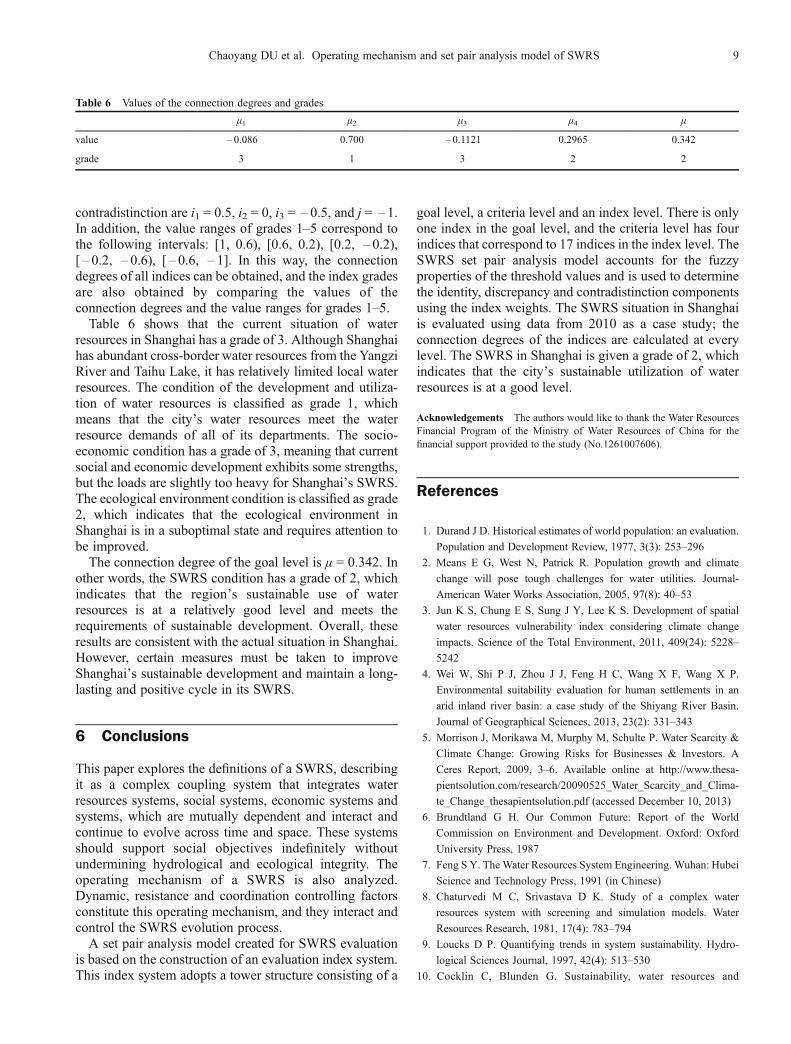
contradistinction are i1 = 0.5, i2 = 0, i3 = – 0.5, and j = – 1.In addition, the value ranges of grades 1–5 correspond tothe following intervals: [1, 0.6), [0.6, 0.2), [0.2, – 0.2),[ – 0.2, – 0.6), [ – 0.6, – 1]. In this way, the connectiondegrees of all indices can be obtained, and the index gradesare also obtained by comparing the values of theconnection degrees and the value ranges for grades 1–5.Table 6 shows that the current situation of water
resources in Shanghai has a grade of 3. Although Shanghaihas abundant cross-border water resources from the YangziRiver and Taihu Lake, it has relatively limited local waterresources. The condition of the development and utiliza-tion of water resources is classified as grade 1, whichmeans that the city’s water resources meet the waterresource demands of all of its departments. The socio-economic condition has a grade of 3, meaning that currentsocial and economic development exhibits some strengths,but the loads are slightly too heavy for Shanghai’s SWRS.The ecological environment condition is classified as grade2, which indicates that the ecological environment inShanghai is in a suboptimal state and requires attention tobe improved.The connection degree of the goal level is μ = 0.342. In
other words, the SWRS condition has a grade of 2, whichindicates that the region’s sustainable use of waterresources is at a relatively good level and meets therequirements of sustainable development. Overall, theseresults are consistent with the actual situation in Shanghai.However, certain measures must be taken to improveShanghai’s sustainable development and maintain a long-lasting and positive cycle in its SWRS.
6 Conclusions
This paper explores the definitions of a SWRS, describingit as a complex coupling system that integrates waterresources systems, social systems, economic systems andsystems, which are mutually dependent and interact andcontinue to evolve across time and space. These systemsshould support social objectives indefinitely withoutundermining hydrological and ecological integrity. Theoperating mechanism of a SWRS is also analyzed.Dynamic, resistance and coordination controlling factorsconstitute this operating mechanism, and they interact andcontrol the SWRS evolution process.A set pair analysis model created for SWRS evaluation
is based on the construction of an evaluation index system.This index system adopts a tower structure consisting of a
goal level, a criteria level and an index level. There is onlyone index in the goal level, and the criteria level has fourindices that correspond to 17 indices in the index level. TheSWRS set pair analysis model accounts for the fuzzyproperties of the threshold values and is used to determinethe identity, discrepancy and contradistinction componentsusing the index weights. The SWRS situation in Shanghaiis evaluated using data from 2010 as a case study; theconnection degrees of the indices are calculated at everylevel. The SWRS in Shanghai is given a grade of 2, whichindicates that the city’s sustainable utilization of waterresources is at a good level.
Acknowledgements The authors would like to thank the Water ResourcesFinancial Program of the Ministry of Water Resources of China for thefinancial support provided to the study (No.1261007606).
References
1. Durand J D. Historical estimates of world population: an evaluation.
Population and Development Review, 1977, 3(3): 253–296
2. Means E G, West N, Patrick R. Population growth and climate
change will pose tough challenges for water utilities. Journal-
American Water Works Association, 2005, 97(8): 40–53
3. Jun K S, Chung E S, Sung J Y, Lee K S. Development of spatial
water resources vulnerability index considering climate change
impacts. Science of the Total Environment, 2011, 409(24): 5228–
5242
4. Wei W, Shi P J, Zhou J J, Feng H C, Wang X F, Wang X P.
Environmental suitability evaluation for human settlements in an
arid inland river basin: a case study of the Shiyang River Basin.
Journal of Geographical Sciences, 2013, 23(2): 331–343
5. Morrison J, Morikawa M, Murphy M, Schulte P. Water Scarcity &
Climate Change: Growing Risks for Businesses & Investors. A
Ceres Report, 2009, 3–6. Available online at http://www.thesa-
pientsolution.com/research/20090525_Water_Scarcity_and_Clima-
te_Change_thesapientsolution.pdf (accessed December 10, 2013)
6. Brundtland G H. Our Common Future: Report of the World
Commission on Environment and Development. Oxford: Oxford
University Press, 1987
7. Feng S Y. TheWater Resources System Engineering. Wuhan: Hubei
Science and Technology Press, 1991 (in Chinese)
8. Chaturvedi M C, Srivastava D K. Study of a complex water
resources system with screening and simulation models. Water
Resources Research, 1981, 17(4): 783–794
9. Loucks D P. Quantifying trends in system sustainability. Hydro-
logical Sciences Journal, 1997, 42(4): 513–530
10. Cocklin C, Blunden G. Sustainability, water resources and
Table 6 Values of the connection degrees and grades
μ1 μ2 μ3 μ4 μ
value – 0.086 0.700 – 0.1121 0.2965 0.342
grade 3 1 3 2 2
Chaoyang DU et al. Operating mechanism and set pair analysis model of SWRS 9
regulation. Geoforum, 1998, 29(1): 51–68
11. Wouters P, Rieu- Clarke A. Sustainability criteria for water resource
systems. Resources Policy, 2001, 27(2): 139–140
12. Sandoval- Solis S, McKinney D C, Loucks D P. Sustainability index
for water resources planning and management. Journal of Water
Resources Planning and Management, 2011, 137(5): 381–390
13. Loucks D P. Sustainability Criteria for Water Resource Systems.
Cambridge: Cambridge University Press, 1999
14. Xu Z X, Takeuchi K, Ishidaira H, Zhang X W. Sustainability
analysis for Yellow River water resources using the system
dynamics approach. Water Resources Management, 2002, 16(3):
239–261
15. Fowler H J, Kilsby C G, O'Connell P E. Modeling the impacts of
climatic change and variability on the reliability, resilience and
vulnerability of a water resource system. Water Resources Research,
2003, 39(8): 1222–1232
16. Khranovich I L. Stability of functioning of water resource systems.
Water Resources, 2007, 34(5): 485–495
17. Li Y, Lence B J. Estimating resilience for water resources systems.
Water Resources Research, 2007, 43(7) W074227
18. Yang G, He X L, Li J F. The evaluation method study for water
resources sustainable utilization in arid areas. International Journal
of Chemical Engineering and Applications, 2010, 1(4): 359–362
19. Shilling F, Khan A, Juricich R, Fong V. Using Indicators to Measure
Water Resources Sustainability in California. Cincinnati: World
Environmental and Water Resources Congress, 2013, 2708–2715
20. Smith E. Water resources criteria and indicators. Water Resources
Update, 2004, 127: 59–67
21. Wang H M. Theory and Method on Sustainable Development
System of Basin. Nanjing: Hohai University Press, 2000 (in
Chinese)
22. Melloul A, Collin M. The principal components statistical method
as a complementary approach to geochemical methods in water
quality factor identification; application to the coastal plain aquifer
of Israel. Journal of Hydrology (Amsterdam), 1992, 140(1–4): 49–
73
23. Tian Y M, Lv X R, Cui Y H. Evaluation of water resources value
based on fuzzy comprehensive method. In: International Conference
on Energy and Environment Technology (ICEET 2009), Guilin.
Guilin: IEEE COMPUTER SOC, 2009, 549–552
24. Guo L, Gao X P, Song H F. Study on Fuzzy Comprehensive
Evaluation Method to Determine Safety Grade of Water Resources.
In: Progress in Safety Science and Technology 2006, Changsha.
Beijing: Science Press, 2006, 1483–1488
25. Kingston G B, Lambert M F, Maier H R. Bayesian training of
artificial neural networks used for water resources modeling. Water
Resources Research, 2005, 41(12): W12409
26. Zhao K Q. Set Pair Analysis and its Preliminary Application.
Hangzhou: Zhejiang Science and Technology Press, 2000, 4–8, 83–
88(in Chinese)
27. Peterson H M, Nieber J L, Kanivetsky R. Water resources
sustainability indicator. application of the watershed characteristics
approach. Water Resources Management, 2013, 27(5): 1221–
1234
28. Song S B, Cai H J. Assessment methods and indicator systems for
sustainable use of regional water resources. In: Proceedings of
International Conference on Water-Saving Agriculture and Sustain-
able Use of Water and Land Resources 2003, Yangling. Yangling:
Water Saving Agriculture and Sustainable Use of Water and Land
Resources, 2003, 677–682
29. Wang W S, Jin J L, Ding J, Li Y Q. A new approach to water
resources system assessment–set pair analysis method. Science in
China Series E: Technological Sciences, 2009, 52(10): 3017–3023
30. Srdjevic B. Linking analytic hierarchy process and social choice
methods to support group decision-making in water management.
Decision Support Systems, 2007, 42(4): 2261–2273
31. Coyle R G. A Mission-orientated approach to defense planning.
Defense Analysis, 1989, 5(4): 353–367
32. Yang X H, Zhang X J, Hu X X, Yang Z F, Li J Q. Nonlinear
optimization set pair analysis model (NOSPAM) for assessing water
resource renewability. Nonlinear Processes in Geophysics, 2011, 18
(5): 599–607
10 Front. Environ. Sci. Eng.